- Silver Price Analysis: XAG/USD refreshes multi-week low, seems vulnerable below 50% Fibo.
Market news
Silver Price Analysis: XAG/USD refreshes multi-week low, seems vulnerable below 50% Fibo.
- Silver drifts lower for the third successive day and drops to over a three-week low.
- The overnight breakdown through key technical supports favours bearish traders.
- Any attempted recovery is likely to get sold into and remain capped near $24.00.
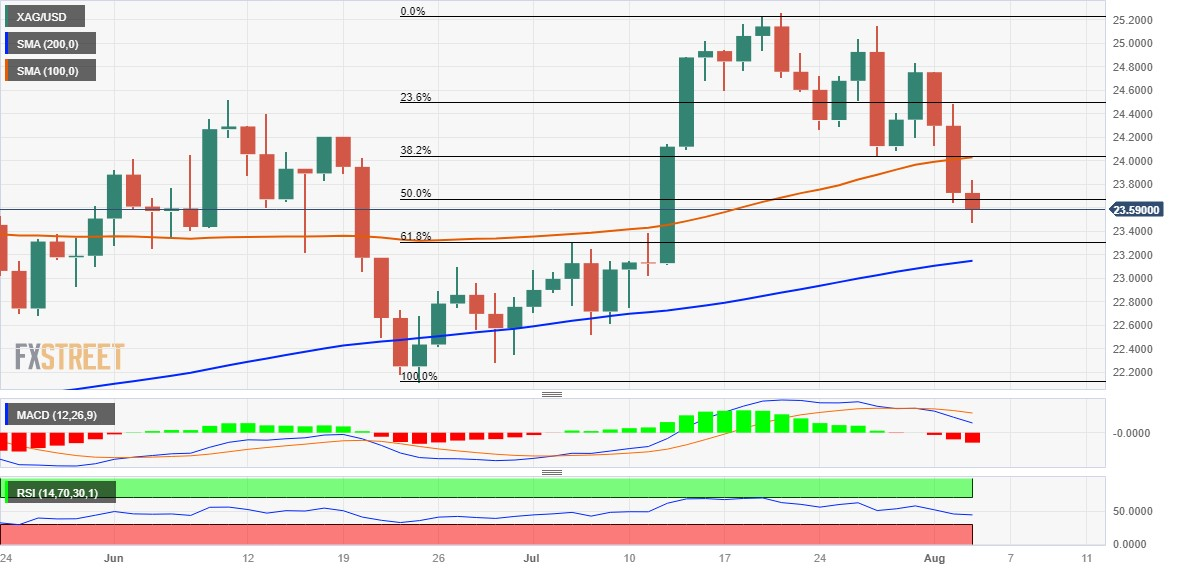
Silver remains under some selling pressure for the third successive day on Thursday and drops to over a three-week low during the early part of the European session. The white metal currently trades around the $23.50-$23.45 region, down over 1% for the day, and seems vulnerable to prolonging its downward trajectory witnessed over the past two weeks or so.
The overnight breakdown below the $24.10-$24.00 confluence, comprising the 38.2% Fibonacci retracement level of the June-July rally and the 100-day Simple Moving Average (SMA), was seen as a fresh trigger for bearish traders. The subsequent slide below the 50% Fibo. level adds credence to the negative outlook and suggests that the path of least resistance for the XAG/USD is to the downside. Moreover, technical indicators on the daily chart have just started gaining negative traction and support prospects for a further near-term depreciating move.
Hence, some follow-through weakness below the 61.8% Fibo. around the $23.35 region, towards testing the next relevant support near the $23.00 round-figure mark, looks like a distinct possibility. The latter coincides with the very important 200-day SMA, which if broken decisively will make the XAG/USD vulnerable to accelerate the downfall towards the multi-month low, around the $22.15-$22.10 area touched in June.
On the flip side, attempted recovery back above the $23.70 area, or the 50% Fibo. level is more likely to attract fresh sellers and remain capped near the $24.00 strong support breakpoint, now turned resistance. A sustained strength beyond, however, might trigger a short-covering rally and lift the XAG/USD back towards the 23.6% Fibo. level, around $24.45-$24.50 supply zone. Some follow-through buying has the potential to lift Siver towards the $24.75 intermediate hurdle en route to the $25.00 psychological mark and the $25.25 resistance zone.
The latter should act as a pivotal point, above which the XAG/USD could surpass the $25.50-$25.55 resistance zone and aim to reclaim the $26.00 mark before eventually climbing to test the YTD peak, around the $26.10-$26.15 area touched in May.
Silver daily chart
Key levels to watch