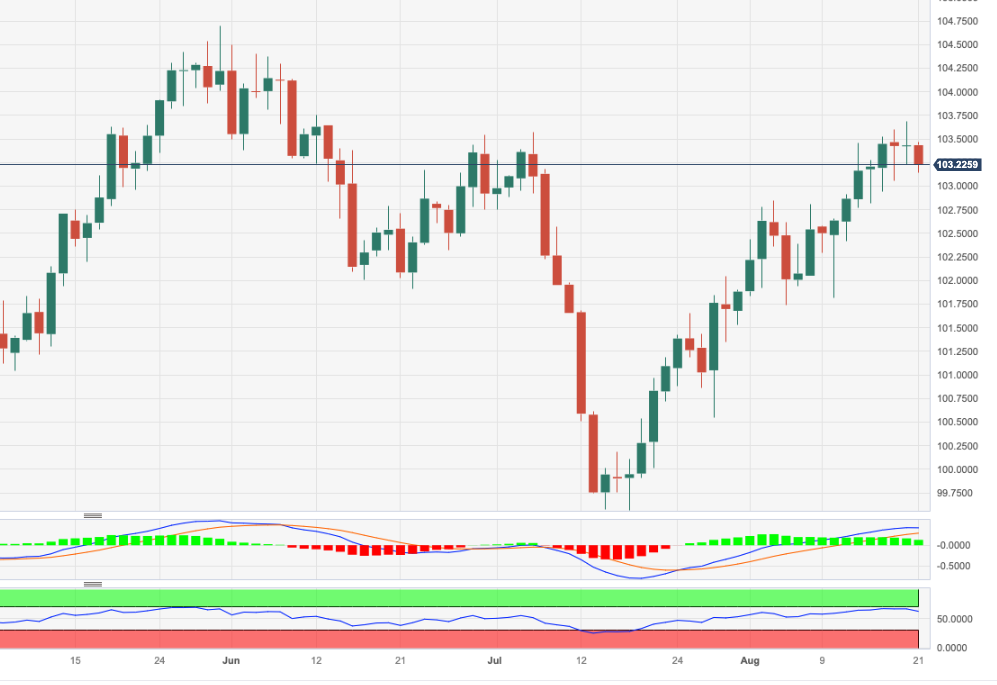
- USD Index Price Analysis: The 200-day SMA near 103.20 holds the downside
Market news
21 August 2023
USD Index Price Analysis: The 200-day SMA near 103.20 holds the downside
- DXY comes under pressure after hitting fresh tops near 103.70.
- The 200-day SMA near 103.20 underpins the index so far.
DXY faces extra selling pressure and revisits the 103.15/10 band at the beginning of the week.
In spite of Monday’s corrective move, the index maintains the bullish view well in place with the immediate hurdle now emerging at the May top of 104.69 (May 31) ahead of the 2023 peak of 105.88 (March 8).
It is worth noting that this area of monthly highs appears reinforced by the proximity of the key 200-day SMA, today at 103.18.
Looking at the broader picture, a convincing breakout of the 200-day SMA should shift the outlook for the index to a more constructive one.
DXY daily chart

Market Focus
Open Demo Account & Personal Page