- EUR/GBP Price Analysis: Holds ground near the 0.8580 mark within the descending trend channel, Bull cross eyed
Market news
EUR/GBP Price Analysis: Holds ground near the 0.8580 mark within the descending trend channel, Bull cross eyed
- EUR/GBP hovers around 0.8580 within a descending trend channel since June.
- The 50-hour EMA is on the verge of crossing above the 100-hour EMA.
- The key resistance level for the cross is located at 0.8600; the initial support level is seen at 0.8572.
The EUR/GBP cross holds ground around 0.8580 after bouncing off the weekly low of 0.8558 during the early European session on Tuesday. The mixed UK labor data fails to boost the Pound Sterling while investors await the monthly UK GDP report and the European Central Bank interest rate decision on Wednesday and Thursday, respectively for fresh impetus.
According to the recent data from the UK's Office for National Statistics, the UK unemployment rate in the three months to July came in at 4.3%, from 4.2% in the previous reading and in line with market expectations. Meanwhile, Employment Change for July fell by 207K from 66K in the previous reading, worse than the 185K drop forecast. The Average Earnings Including Bonus in the three months to July rose by 8.5%, compared to 8.2% in the previous reading. The figure, excluding the bonus remains at 7.8%, as predicted.
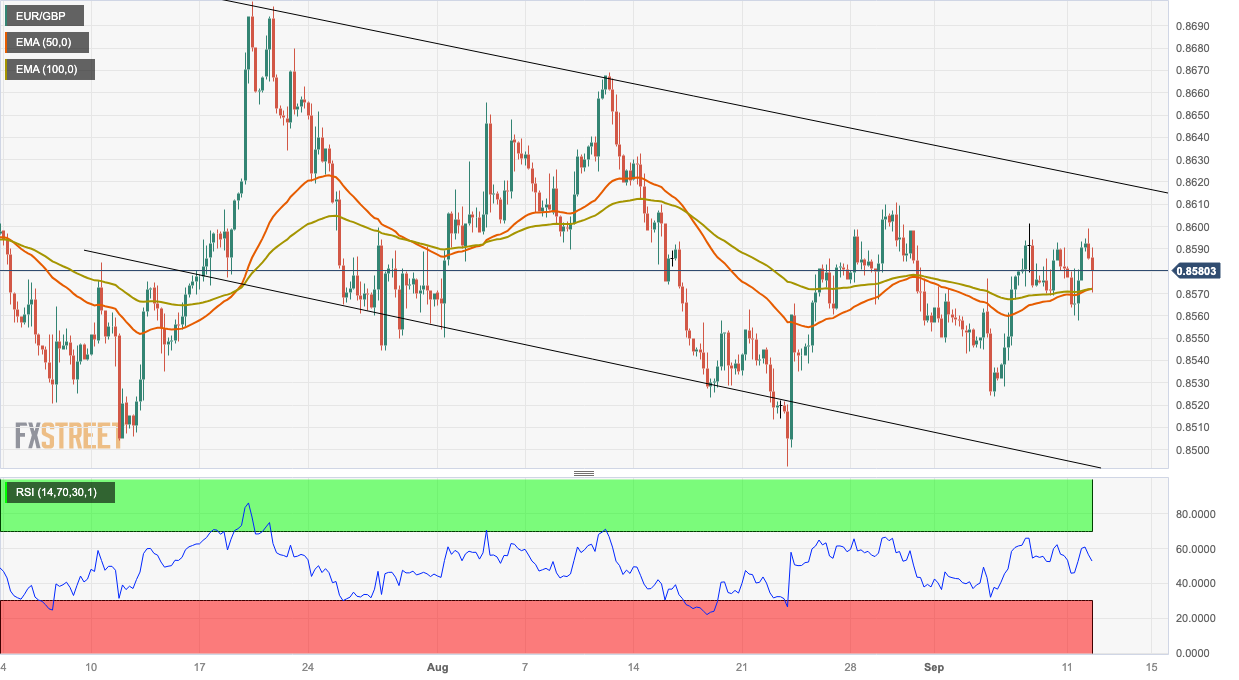
From a technical perspective, EUR/GBP trades within a descending trend channel since the middle of June on the four-hour chart. It’s worth noting that the 50-hour EMA is on the verge of crossing above the 100-hour EMA. If a decisive crossover occurs on the four-hour chart, it would validate a Bull Cross, highlighting the path of least resistance for the cross is to the upside. Meanwhile, the Relative Strength Index (RSI) stands in bullish territory above 50, supporting the buyers for now.
The key resistance level for the cross is located at 0.8600, representing a psychological round mark and a high of August 28. The next barrier to watch is near the upper boundary of a descending trend channel at 0.8626, en route to a high of August 11 at 0.8670 and finally near a high of July 19 at 0.8700.
On the downside, the initial support level is seen at 0.8572, representing a confluence of the 50- and 100-hour EMAs. The next downside stop is located at 0.8540 (a low of September 4). Further south, the additional downside filter is located at 0.8524 (a low of September 5). The key contention will emerge at 0.8500, portraying a lower limit of a descending trend channel and a psychological figure.
EUR/GBP four-hour chart