- USD/JPY Price Analysis: Extends losses on second day near 149.00 psychological level
Market news
USD/JPY Price Analysis: Extends losses on second day near 149.00 psychological level
- USD/JPY hovers around 149.00 psychological level ahead of US Core PCE.
- Momentum indicators suggest a potential bullish sentiment in the market.
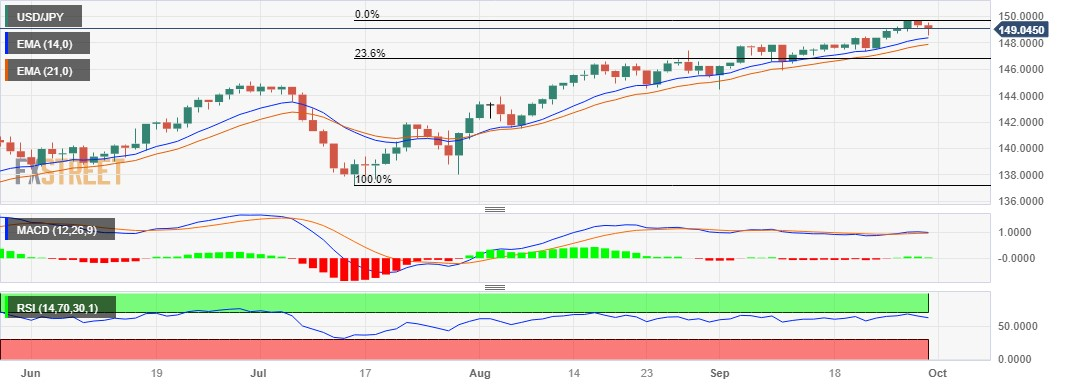
- 14-day EMA emerges as the key support, following the 23.6% Fibonacci retracement.
USD/JPY extends its losses on the second successive day, trading lower around 149.00 psychological level during the European trading session on Friday.
The pair faces a challenge due to the correction in the US Dollar (USD), which could be attributed to the pullback in the US Treasury yields.
The 14-day Exponential Moving Average (EMA) at 148.36 could act as key support, following the 21-day EMA at 147.87.
A firm break could influence the USD/JPY bears to navigate the area around the 23.6% Fibonacci retracement at 146.76, followed by the 146.00 psychological level.
The current upward momentum in USD/JPY appears to have a bullish bias, given that the 14-day Relative Strength Index (RSI) remains above the 50 level.
However, there is a resistance region around the monthly high at 149.70, followed by the 150.00 psychological level that may pose a challenge for further gains.
The Moving Average Convergence Divergence (MACD) indicator is providing a strong signal for the USD’s buyers. The MACD line lies above the centerline and the signal line. This configuration suggests that there is potentially strong momentum in the USD/JPY's price movement.
USD/JPY: Daily Chart