- AUD/USD Price Analysis: Tumbles to 0.6600 as uncertainty deepens ahead of US Inflation
Market news
AUD/USD Price Analysis: Tumbles to 0.6600 as uncertainty deepens ahead of US Inflation
- AUD/USD falls sharply to 0.6600 as safe-haven appeal improves ahead of US Inflation data.
- The USD Index rebounds to 102.90 even though the Fed rate-cut expectations remain firm.
- RBA Hunter is expected to provide GDP projections at Australia’s Financial Review's Business Summit on Tuesday.
The AUD/USD pair faces a sharp sell-off and drops to the round-level support of 0.6600 in the early New York session on Monday. The Aussie asset tumbles as uncertainty ahead of the United States Consumer Price Index (CPI) data for February has dented risk appetite of the market participants.
The monthly headline inflation is forecasted to have risen by 0.4% against a 0.3% increase in January. The core CPI that excludes volatile food and energy prices is expected to have grown at a slower pace of 0.3% from 0.4%. For annual figures, economists expect that the headline CPI remains sticky at 3.1% and the core inflation decelerates to 3.7% from 3.9% in January.
Considering negative overnight futures, the S&P 500 is expected to open on a negative note. The US Dollar Index (DXY) rebounds to 102.90 though market expectations for the Federal Reserve (Fed) reducing interest rates in the June policy meeting remain firm. The CME FedWatch tool shows a 72% chance for a rate-cut decision in June.
Meanwhile, the next move in the Australian Dollar will be guided by the Australia’s Financial Review's Business Summit, scheduled for Tuesday. Reserve Bank of Australia’s (RBA) recently appointed chief economist, Sarah Hunter, is expected to deliver Gross Domestic Product (GDP) projections and the economic risks.
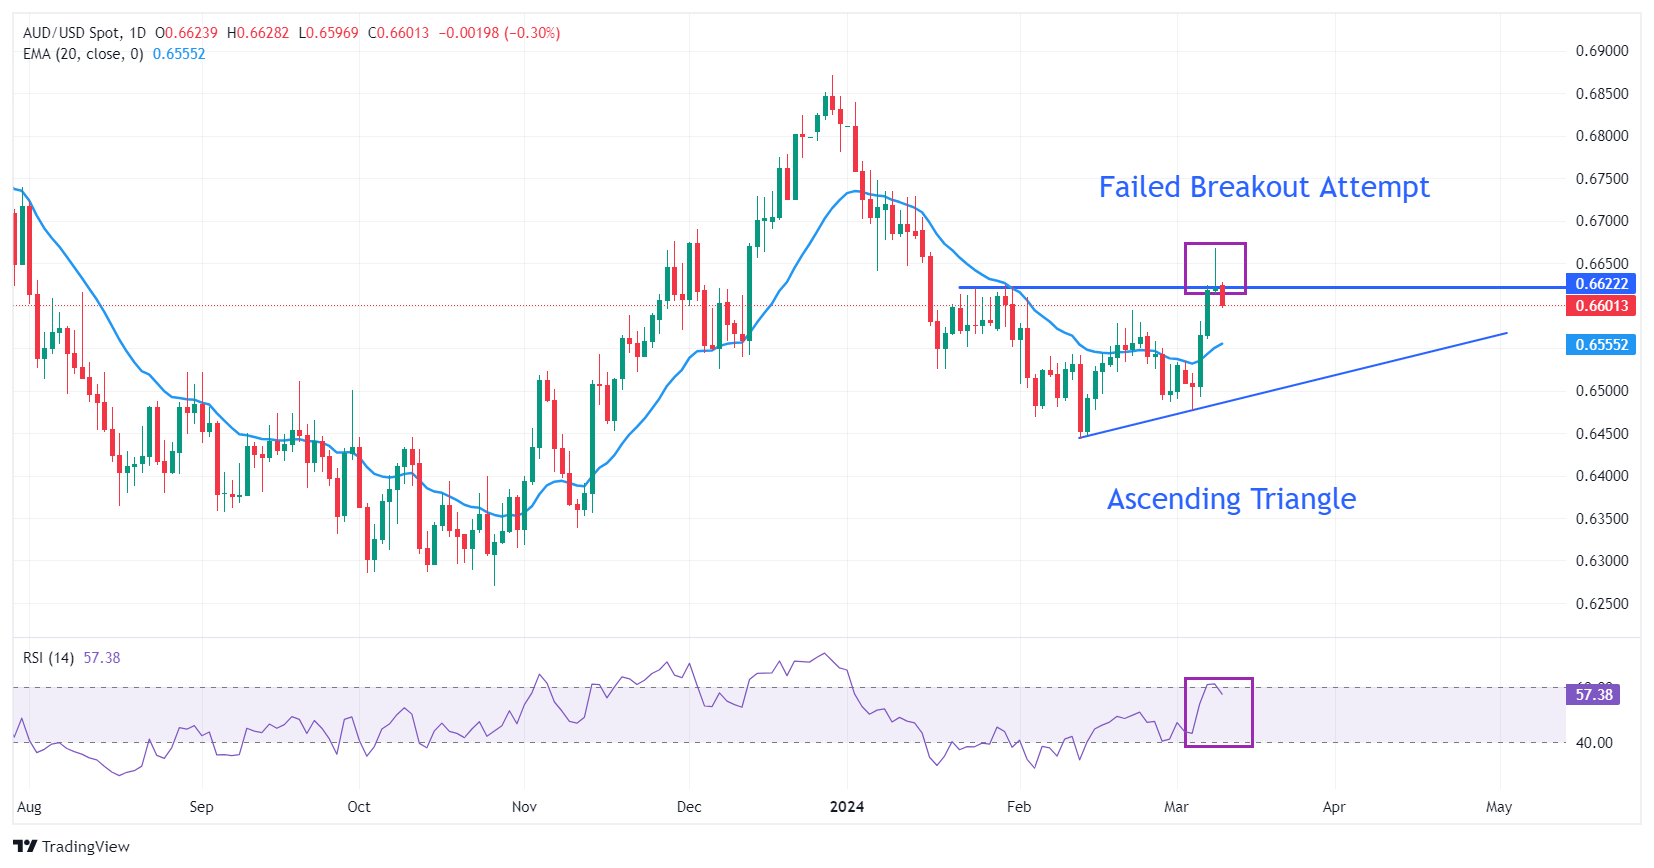
AUD/USD drops after failing to deliver a decisive break above the horizontal resistance of the Ascending Triangle pattern formed on a daily timeframe, which is plotted from the January 24 high at 0.6621. The upward-sloping border of the chart pattern is placed from the February 13 low at 0.6319.
The triangle could break out in either direction. However, the odds marginally favor a move in the direction of the trend before the formation of the triangle – in this case, up. A decisive break above or below the triangle boundary lines would indicate a breakout is underway.
The 14-period Relative Strength Index (RSI) falls back into the 40.00-60.00 region, which indicates persistent indecisiveness among investors.
Shorts buildups for the Aussie asset may swell if it breaks below February 20 high at 0.6579. This would drag the asset towards February 26 low at 0.6530, followed by the psychological support of 0.6500.
On the contrary, the Australian Dollar will strengthen if the asset climbs above December 4 high at 0.6688. This would drive the pair towards January 11 high at 0.6728 and January 4 high at 0.6760.
AUD/USD daily chart