- AUD/JPY Price Analysis: Bears consolidate after hitting oversold conditions in the hourly chart
Market news
AUD/JPY Price Analysis: Bears consolidate after hitting oversold conditions in the hourly chart
- The hourly RSI recovered after bottoming at oversold conditions.
- The negative outlook is more evident on the daily chart with bears threatening the 100-day SMA.
- As long as the bulls hold above the 100 and 200-day SMAs, the overall trend will remain bullish.
In Monday's session, the AUD/JPY pair commenced the week with a drop of 0.50%, trading around the 96.97 level. Bears are in command for the short term, but their momentum seems to fade. On the broader scale, the outlook remains bullish
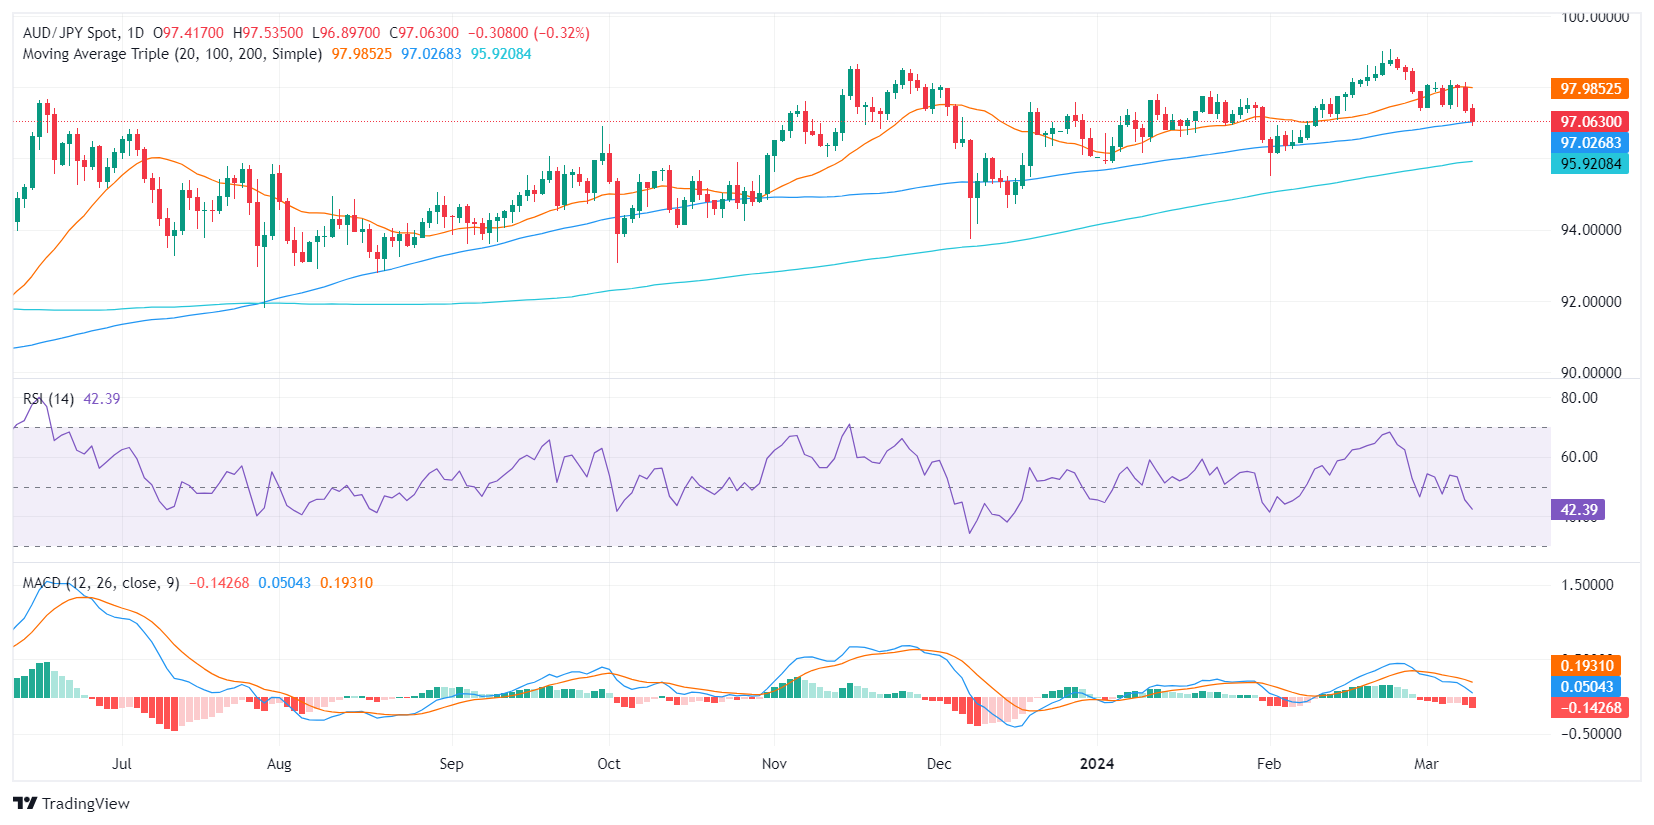
The AUD/JPY pair on the daily chart shows a negative outlook. The Relative Strength Index (RSI) remains deep in negative territory and seems to be en route to the oversold region. Meanwhile, the Moving Average Convergence Divergence (MACD) depicts rising red bars, suggesting an increased bearish momentum.
AUD/JPY daily chart
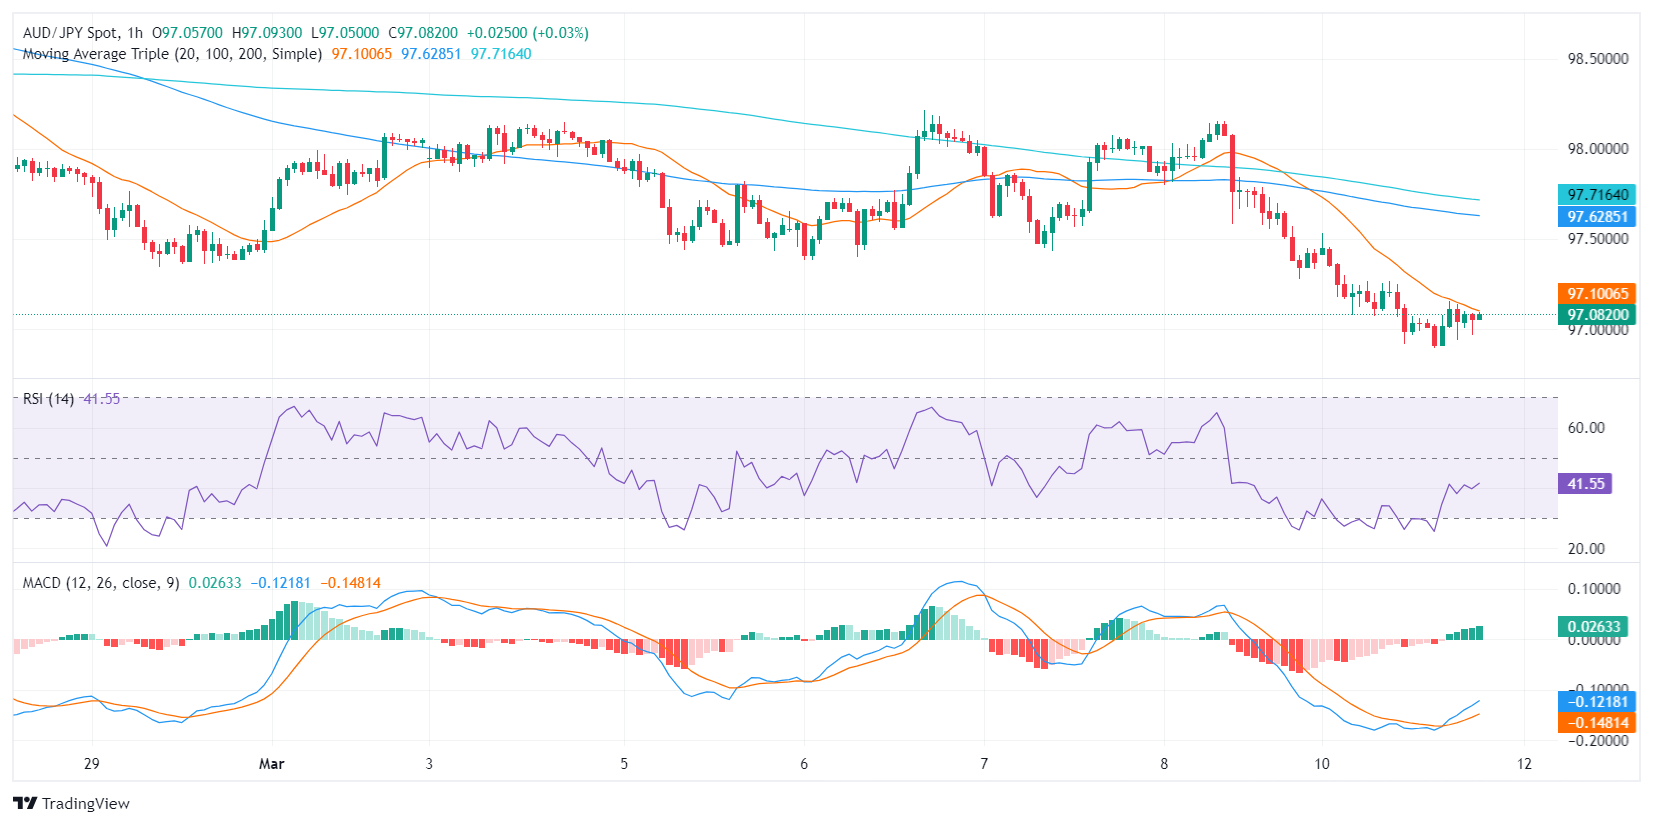
Shifting to the hourly chart, the RSI jumped back from a low of 30 as bears seemed to be consolidating their movements. The hourly MACD presents green bars on the rise, indicating a surge in positive momentum.
AUD/JPY hourly chart
In conclusion, despite the short-term dominance of the bears, the selling momentum seems to be waning. This would give the buyers a chance to make an upward move. Meanwhile, the broader scale outlook, considering the pair's position above its 100 and 200-day SMAs, emphasizes overall bullish control despite trading below the 20-day average.