- NZD/USD Price Analysis: Bears assert their dominance, eyes on a possible short-term momentum shift
Market news
NZD/USD Price Analysis: Bears assert their dominance, eyes on a possible short-term momentum shift
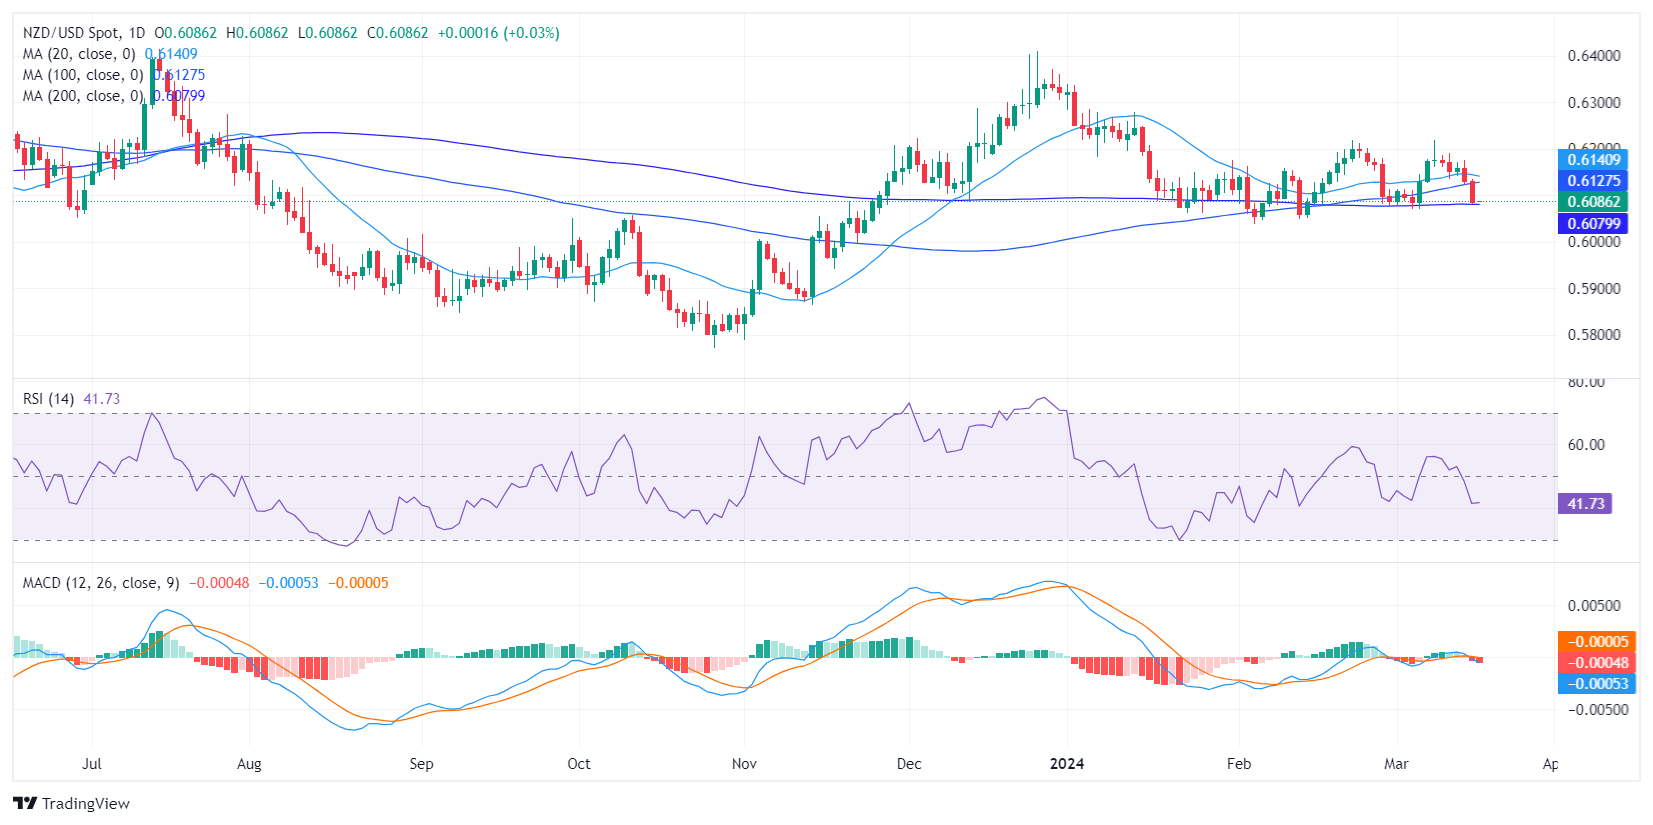
- The daily chart reveals a bearish bias, with RSI transitioning to negative territories and rising red bars in the MACD.
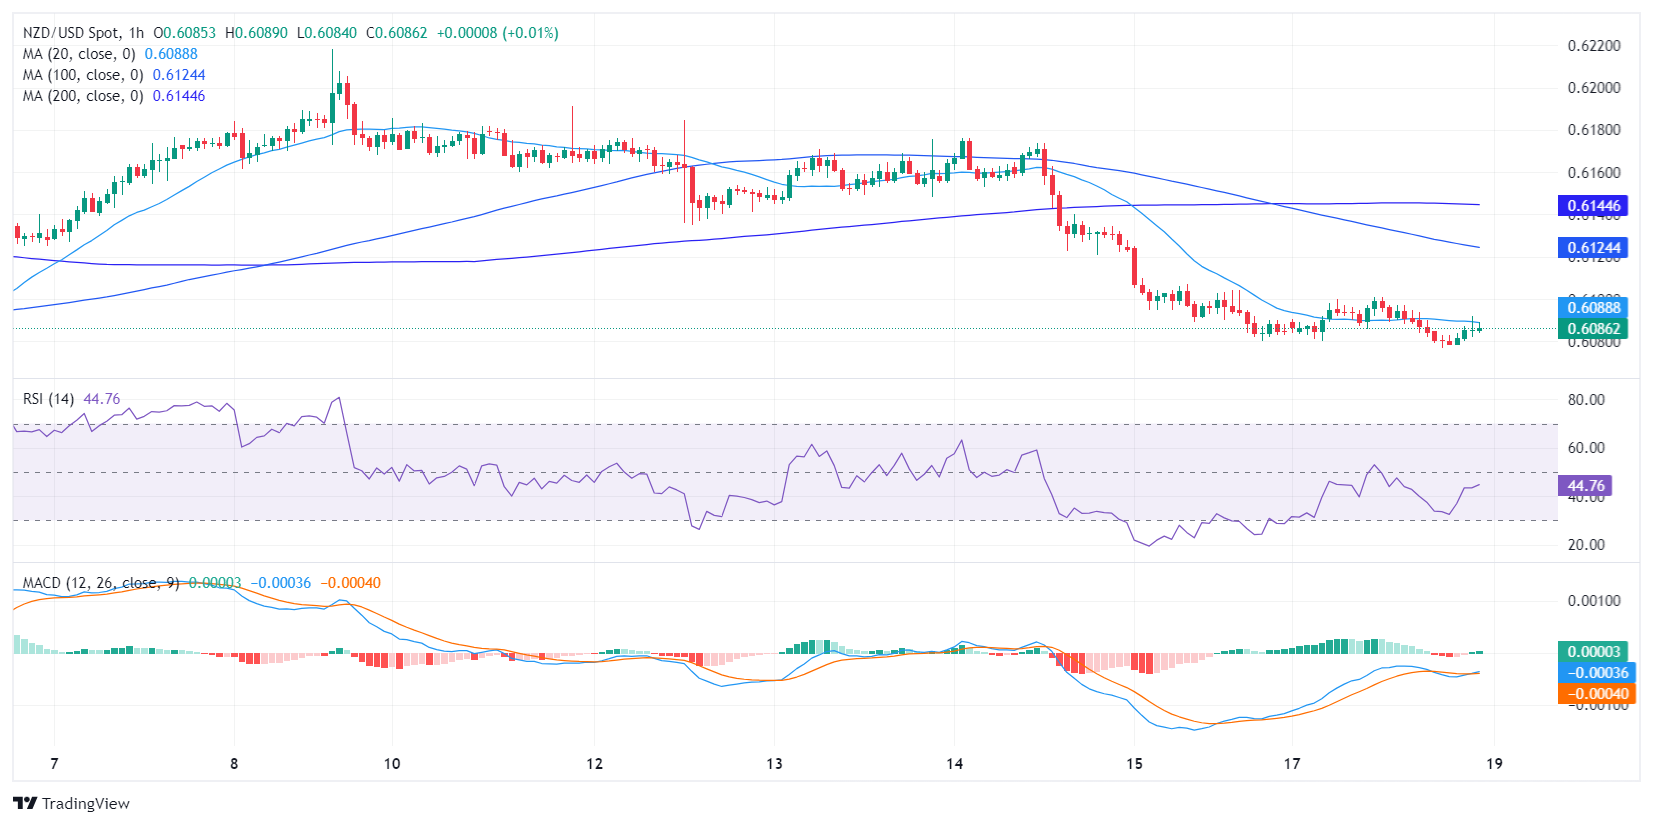
- The hourly chart demonstrates a contrary perspective flashing signals on a potential shift to the upside.
- If bears want to confirm a bearish outlook, they must conquer the 200-day SMA.
In Monday's trading, NZD/USD remained largely unchanged around 0.6085 while the pair showed ongoing sell-off pressure. However, subtle hints of an imminent near-term reversal are beginning to show up on the hourly chart as bears may step out to consolidate their movements.
The continuous decline of the daily Relative Strength Index (RSI) from positive to negative territories demonstrates the prevailing sell-side pressure. The recent reading of the RSI indicates ongoing negative conditions, further substantiated by a sequence of rising red bars in the Moving Average Convergence Divergence (MACD).
NZD/USD daily chart
Moving on to the hourly chart, the NZD/USD pair persists in its bearish trend. The Relative Strength Index (RSI) reflects similar negative conditions as observed on the daily chart, albeit, the index seems to have flattened. In addition, a shift in momentum can be discerned with the emergence of green bars in the MACD histogram. These indicate positive momentum in the last trading hours.
NZD/USD hourly chart
Given the outlooks on the daily and hourly chart, after the sellers pierced through the 20 and 100-day Simple Moving Averages (SMAs), the last hope for the pair is the 200-day average which presents strong support. In case the buyers fail to defend it, the overall trend will turn bearish.