- GBP/USD Price Analysis: Holds position below the major level of 1.2650
Market news
GBP/USD Price Analysis: Holds position below the major level of 1.2650
- GBP/USD could meet the immediate barrier at 23.6% Fibonacci and a major level of 1.2650.
- Technical analysis suggests a confirmation of a bearish momentum for the pair.
- The key support could be met around the psychological support level of 1.2600.
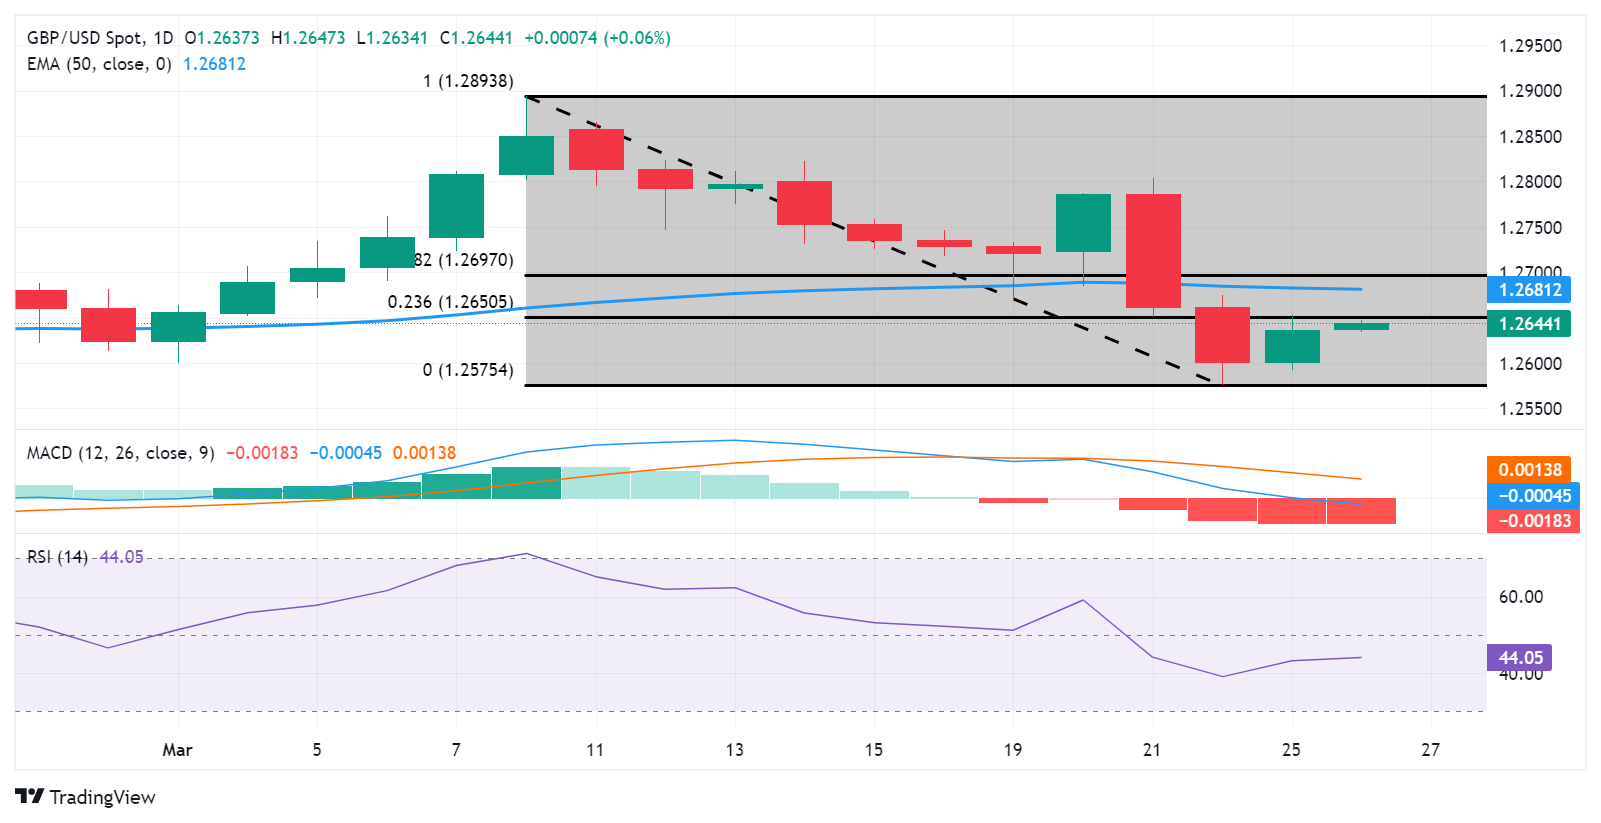
GBP/USD attempts to continue gaining ground, advancing to near 1.2640 during the Asian trading hours on Tuesday. The pair could meet the immediate resistance at 23.6% Fibonacci retracement and a major level at 1.2650.
A breakthrough above the latter could exert upward support for the GBP/USD pair to test the 50-day Exponential Moving Average (EMA) at 1.2681. Should the pair surpass these levels, it may approach the psychological barrier of the 1.2700 level.
The technical analysis of the GBP/USD pair shows that the 14-day Relative Strength Index (RSI) is positioned below 50. This indicates a bearish trend for the GBP/USD pair. However, the Moving Average Convergence Divergence (MACD), a lagging indicator, suggests a bearish confirmation for the pair. The MACD line is situated below the centerline but shows divergence below the signal line.
On the downside, the GBP/USD pair may test the psychological support level of 1.2600. If this level is breached, it could prompt the pair to revisit March’s low at 1.2575, followed by the significant level of 1.2550.
GBP/USD: Daily Chart