- GBP/JPY Price Analysis: Rolls over and finds support at borderline of Wedge
Market news
GBP/JPY Price Analysis: Rolls over and finds support at borderline of Wedge
- GBP/JPY finds support at the upper borderline of a Wedge it recently broke out from.
- Bearish technical indicators suggest more downside is possible after the overextension.
GBP/JPY has been rising in a bearish Wedge pattern. Recently the pair broke above the upper boundary line and then reversed lower. It has since found temporary support at the Wedge’s upper edge. A cursory glance at the tea leaves suggest a risk of further weakness despite the uptrend remaining intact.
GBP/JPY formed a Two Bar reversal pattern on the daily chart (rectangled) at the March 20 and 21 highs. Such patterns are fairly reliable indicators of short-to-medium term reversals.
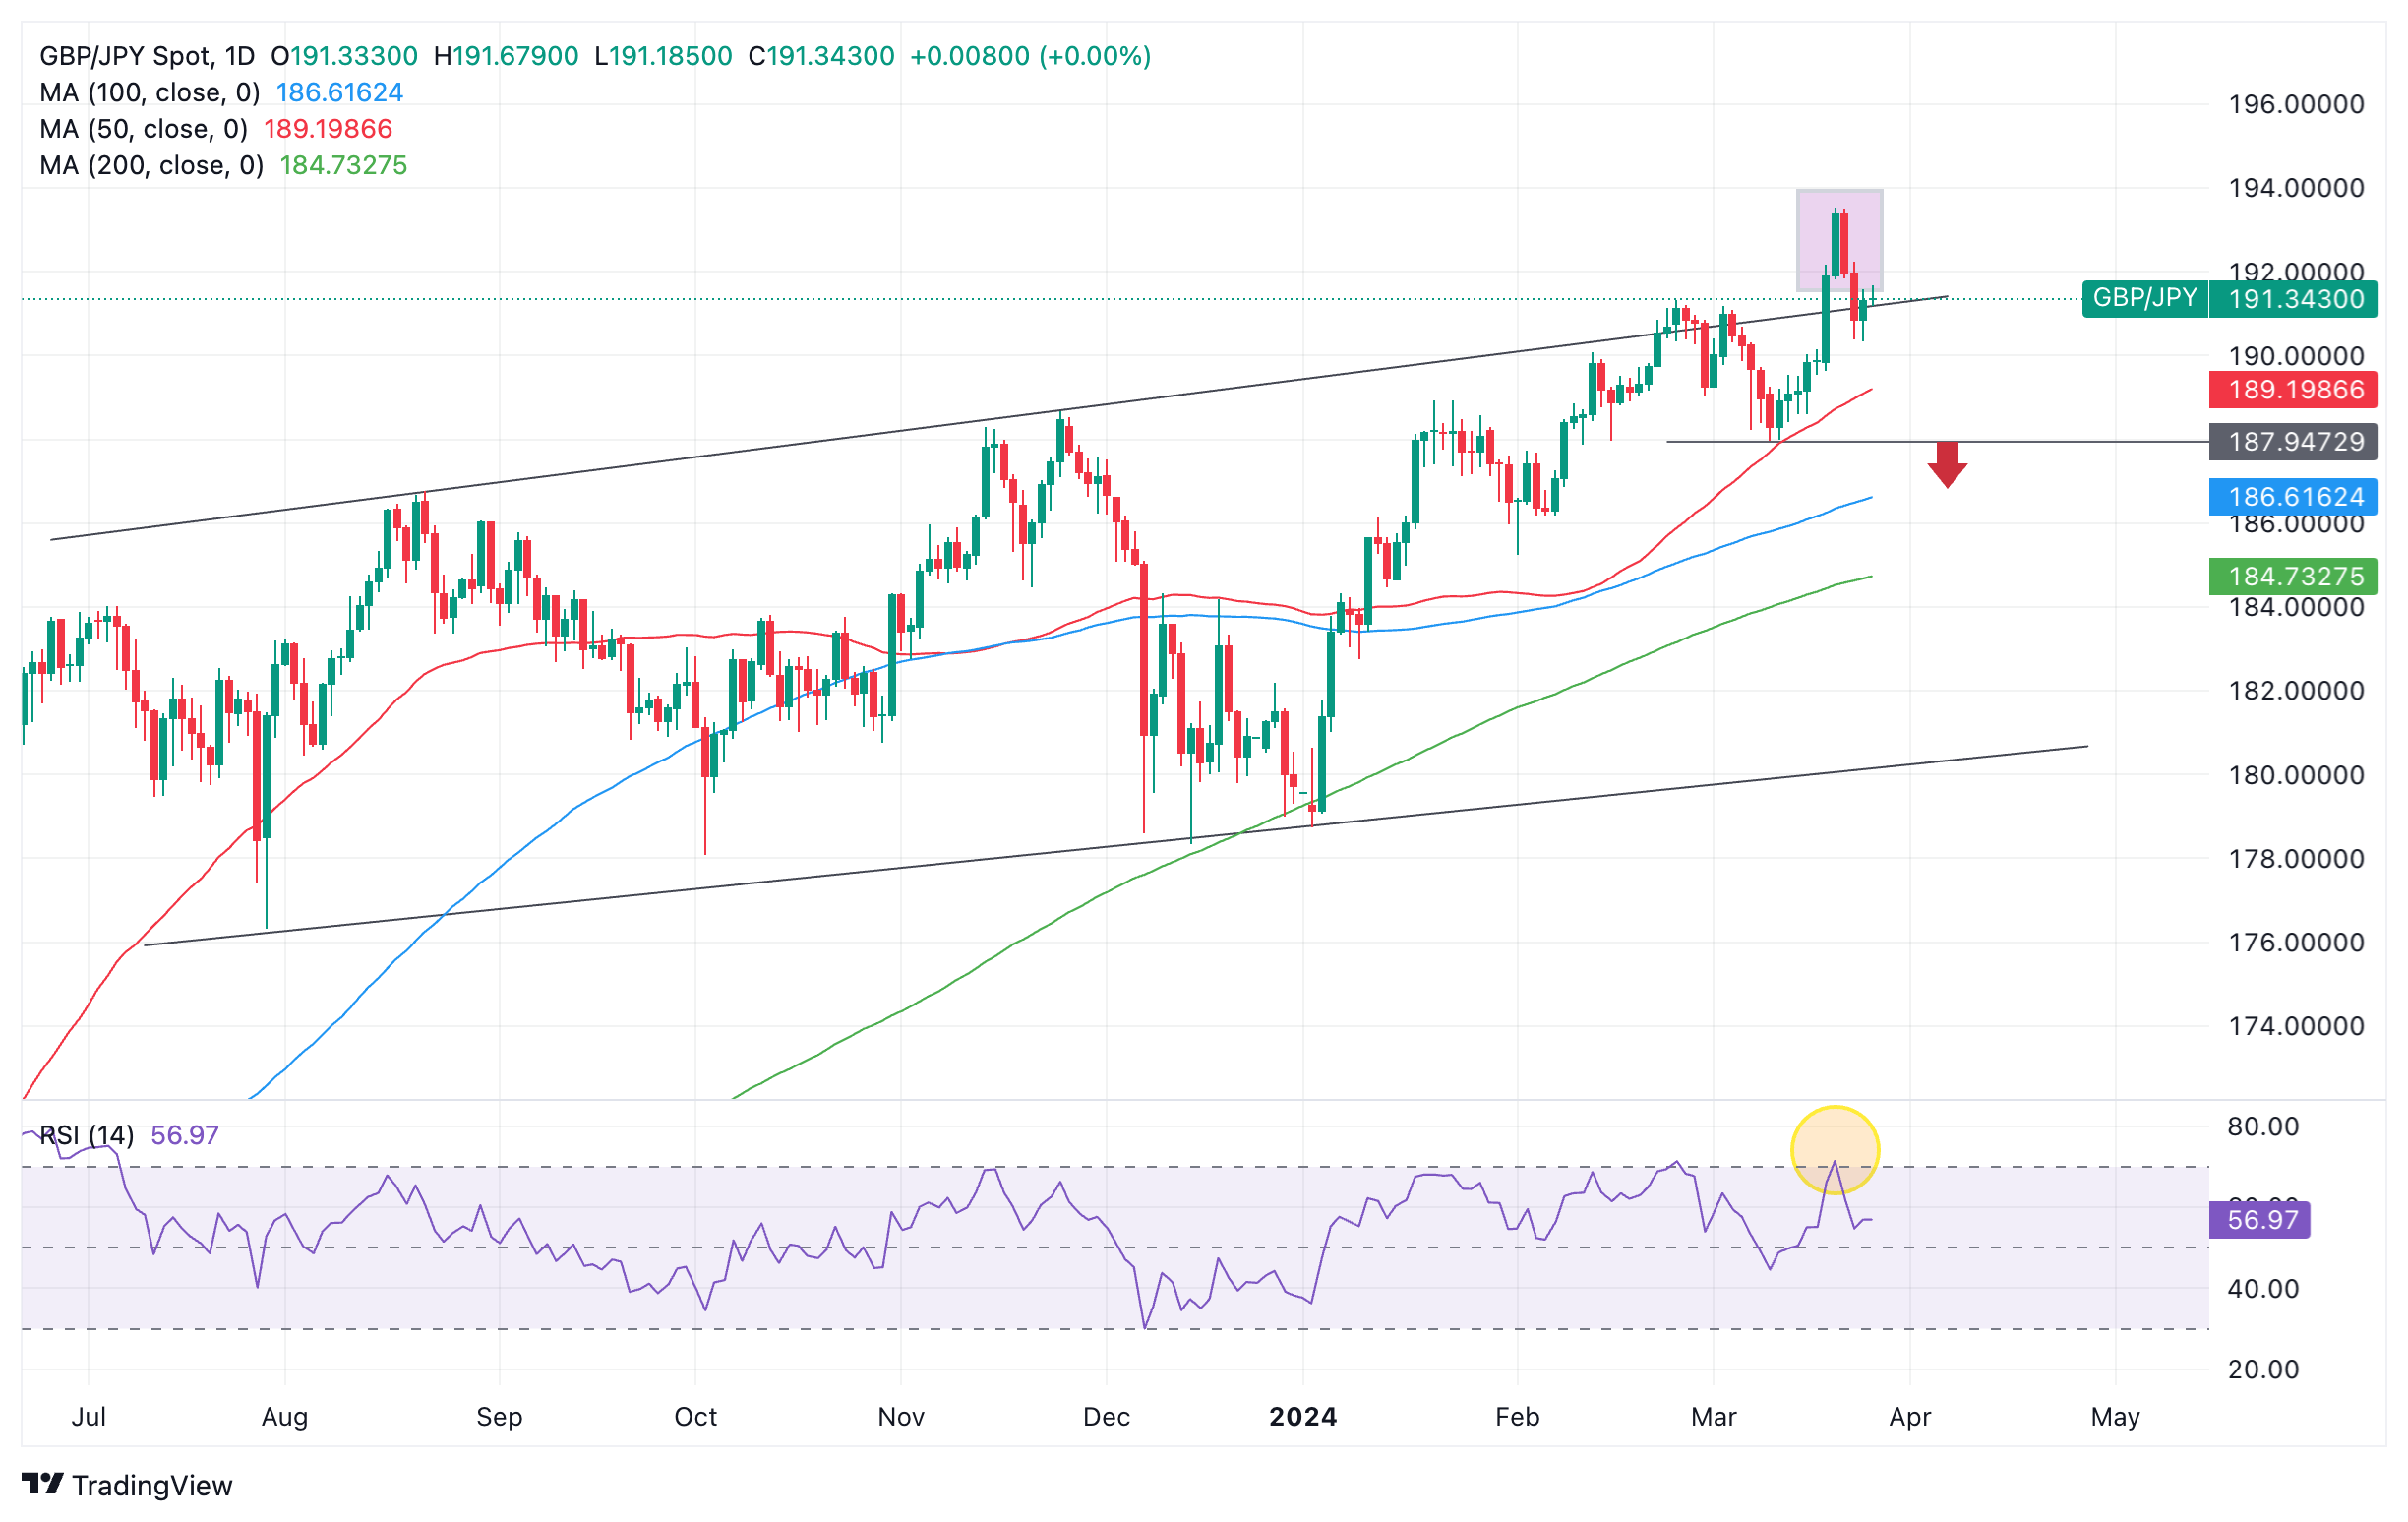
Pound Sterling versus Japanese Yen: Daily chart
At the same time as price rolled over, the Relative Strength Index (RSI) exited its overbought zone, giving a sell signal (circled).
In addition, when prices reach bullish extremes and overshoot trendlines the reversal that follows is often significant, suggesting GBP/JPY could be reversing a longer-term trend.
A break below the last swing low of the up move, the 187.964 March 11 low, would provide stronger confirmation that the trend was turning bearish.
Such a break would probably be followed by a move down inside the Wedge to a target at the lower boundary of the pattern, at roughly 180.400.
Along the way fairly stubborn support is likely to be provided by the 100-day and 200-day SMAs at 186.610 and 184.730 respectively.
A decisive break below the lower borderline of the Wedge would be very bearish and likely see a much deeper slide to the 170.000s, based on an extrapolation of the height of the wedge lower.
A break above the 193.50 highs, however, would provide confirmation the dominant bull trend was still intact and continuing higher.
Although it looks overstretched, such a move could meet an next upside target at the 195.88 highs of 2015.