- NZD/USD Price Analysis: Bears maintain control, short-term bullish flip on the horizon
Market news
NZD/USD Price Analysis: Bears maintain control, short-term bullish flip on the horizon
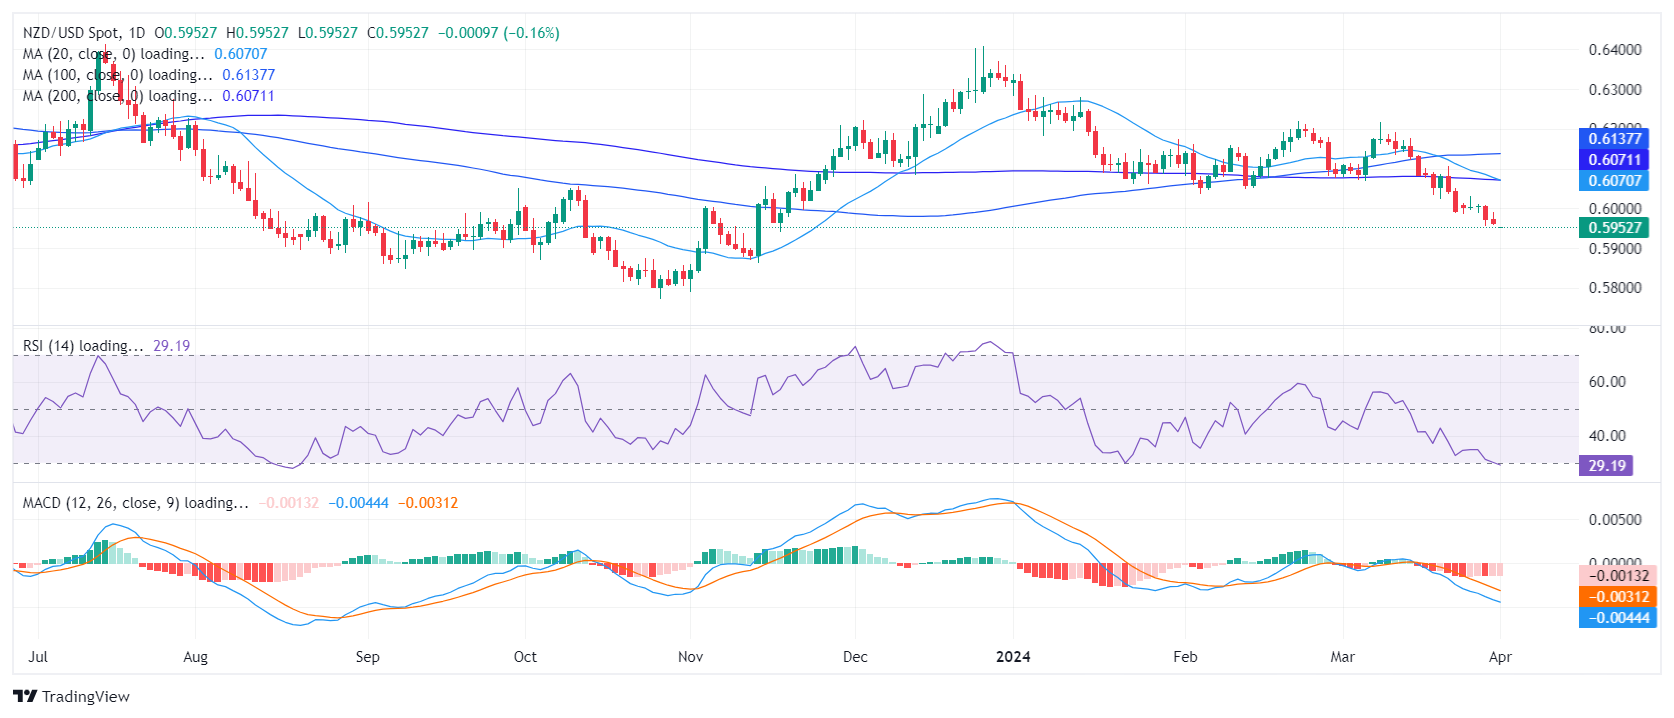
- The daily chart of the pair reflects a prevailing negative trend with indicators flashing oversold signals.
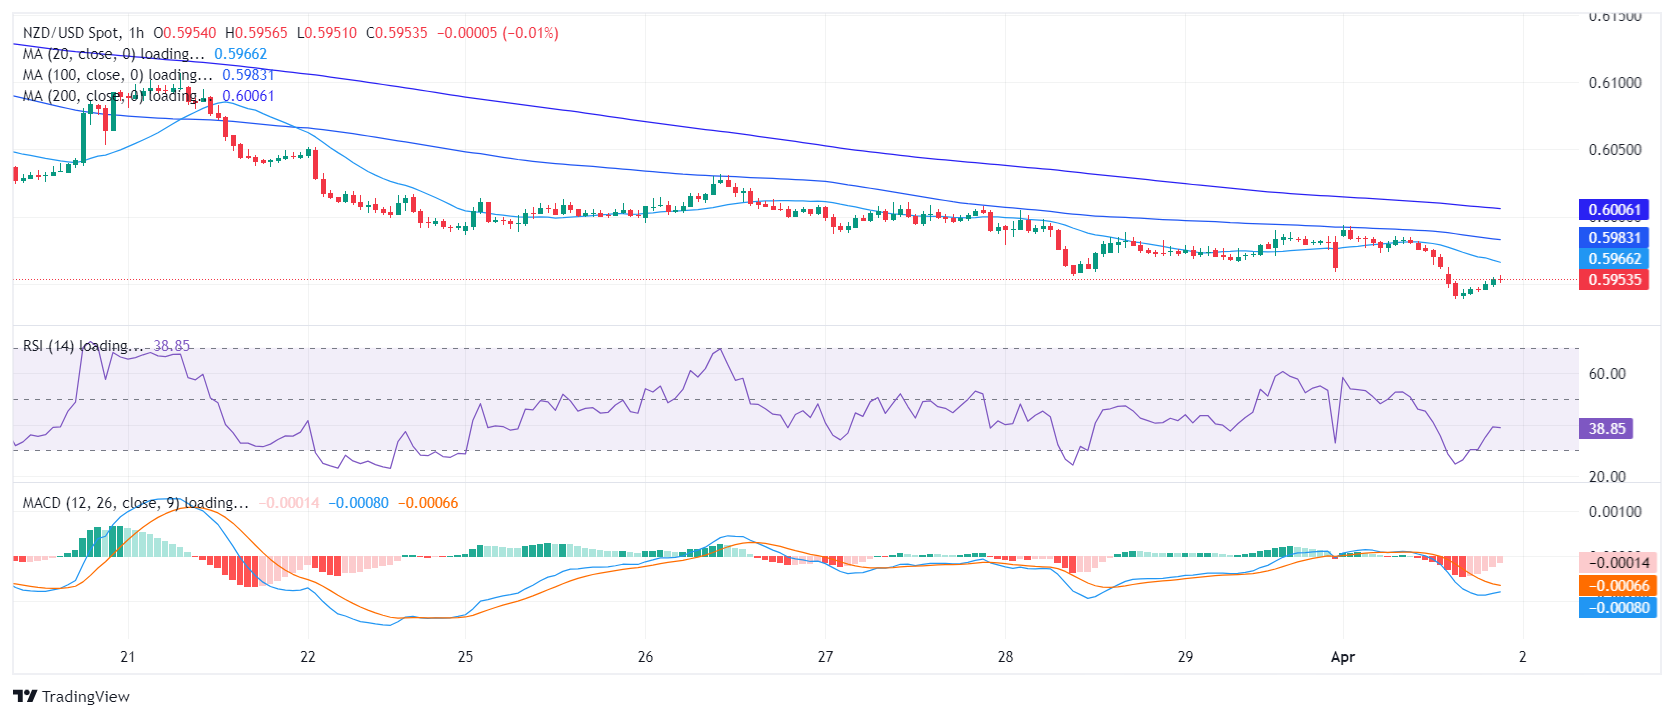
- Indicators on the hourly chart also stand deep in the red zone.
- Moreover, a bearish SMA crossover further emphasizes the depth of the bearish outlook.
The NZD/USD pair is currently trading at 0.5950, showing a 0.50% decrease in the session. Sellers maintain control as the broader outlook remains bearish. However, some signs of a mild bullish reversal are emerging.
On the daily chart, the Relative Strength Index (RSI) value reveals a continuation of the negative trend. This suggests dominant selling conditions for this pair, signaling a possible oversold market soon. Conversely, the steady red bars of the Moving Average Convergence Divergence (MACD) also support this negative momentum.
NZD/USD daily chart
When examining the hourly chart, the RSI values largely stay within the negative zone, echoing the daily chart's sentiment. However, the most recent RSI reading at 41 shows a minor increase, which could suggest a glimmer of a short-term bullish reversal after the index fell below 30 earlier in the session. Even though the corresponding MACD bars remain red, additional upward movements could be seen ahead of the Asian session.
NZD/USD hourly chart
Upon inspecting the broader outlook, the NZD/USD is demonstrating bearish signals across all periods examined. In addition, the pair’s position below the 20, 100-day, and 200-day Simple Moving Averages (SMAs), implies a forecast of negative momentum in the short term. This downward trend is further confirmed by the potential bearish SMA crossover of 20 and 200-day SMAs at 0.6070. However, as the daily indicators enter oversold conditions, a corrective bullish reversal shouldn’t be taken off the table.