- EUR/JPY Price Analysis: Bullish trend intact, as long as bulls defend the 20-day SMA
Market news
EUR/JPY Price Analysis: Bullish trend intact, as long as bulls defend the 20-day SMA
- Indicators on the daily chart show a steady buying momentum.
- Bulls need to maintain control over the current support around the 20-day SMA to avoid additional losses.
- Hourly chart indicators show signs of recovery.
The EUR/JPY pair is currently oscillating around the 163.20 mark, showing a slight increase in Tuesday’s session. The persisting momentum suggests an upper hand for the bulls, but if the pair falls below the 20-day Simple Moving Average (SMA), there may be a likelihood for sellers to force a momentum shift.
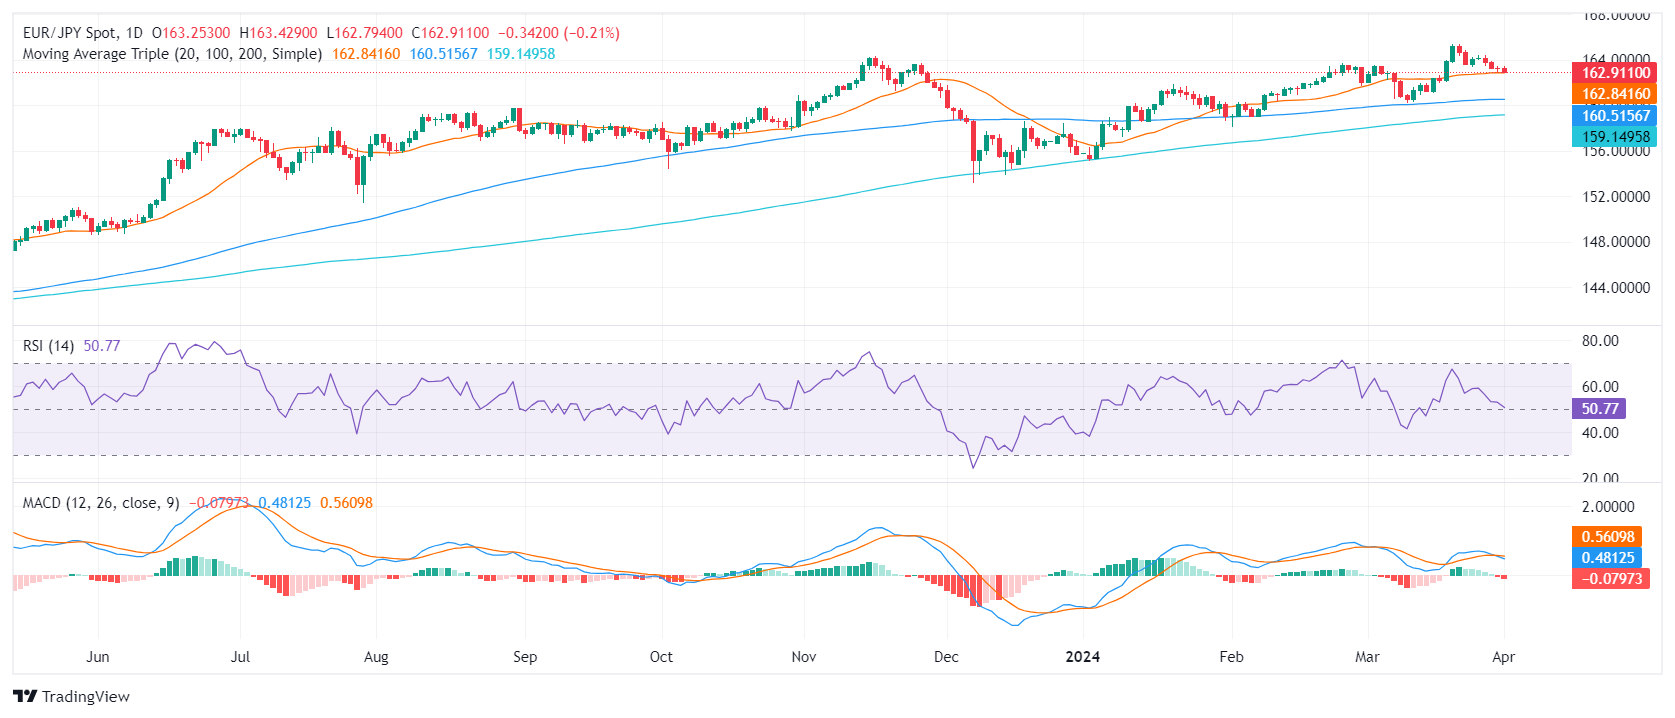
On the daily chart, the EUR/JPY pair has a mildly positive outlook. The Relative Strength Index (RSI) fluctuates in the positive territory, peaking at 65 last week before slipping to 52 in the most recent reading. The Moving Average Convergence Divergence (MACD) continues to print flat red bars, indicating a slightly negative momentum.
EUR/JPY daily chart
Switching to the hourly chart, the sentiment also leans towards positivity. The RSI, which started the session from a low point in negative territory at 39, has since recovered strongly to the positive territory with the most recent reading at 61. Reinforcing this positive trend, the MACD histogram prints green bars.
EUR/JPY hourly chart
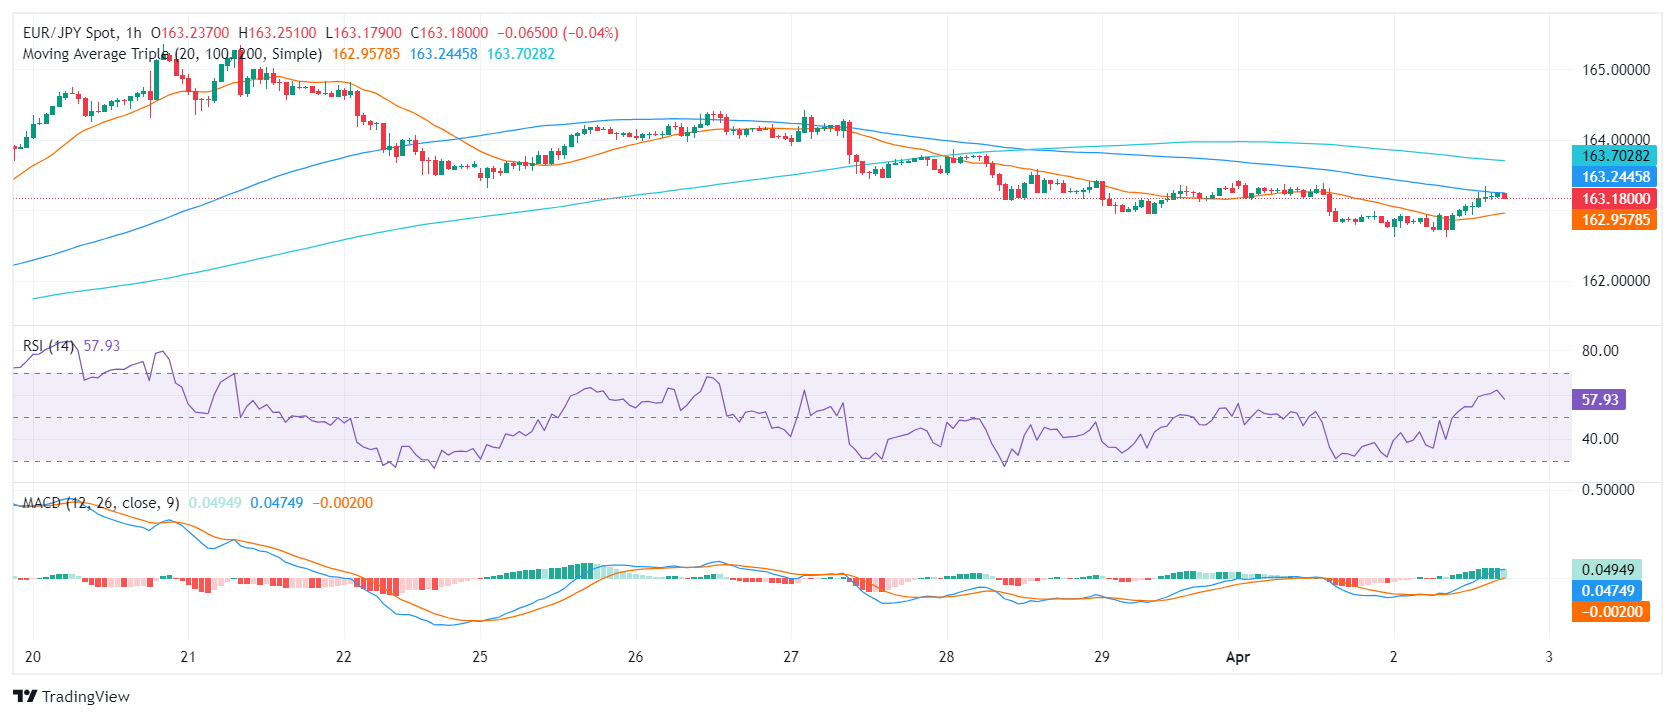
In summary, the EUR/JPY pair is demonstrating an overall upward bias amidst minor setbacks. Both the daily and hourly charts portray a positive sentiment, as indicated by the RSI and MACD values. Along with the pair standing above its 20,100 and 200-day SMA, the overall market inclination leans towards the bulls.