- NZD/JPY Price Analysis: Bearish reversal cues emerge, buyers give up gains
Market news
NZD/JPY Price Analysis: Bearish reversal cues emerge, buyers give up gains
- The daily chart signifies a bullish market; yet, the hourly chart shows hints of a short-term bearish reversal.
- The NZD significantly weakened during the American session and cleared daily gains.
- The hourly RSI dived from the overbought area near oversold terrain.
The NZD/JPY cleared all of its daily gains and fell by nearly 0.75% during the American session. Bearish clues emerge on the hourly chart, but the daily technical outlook remains somewhat bullish.
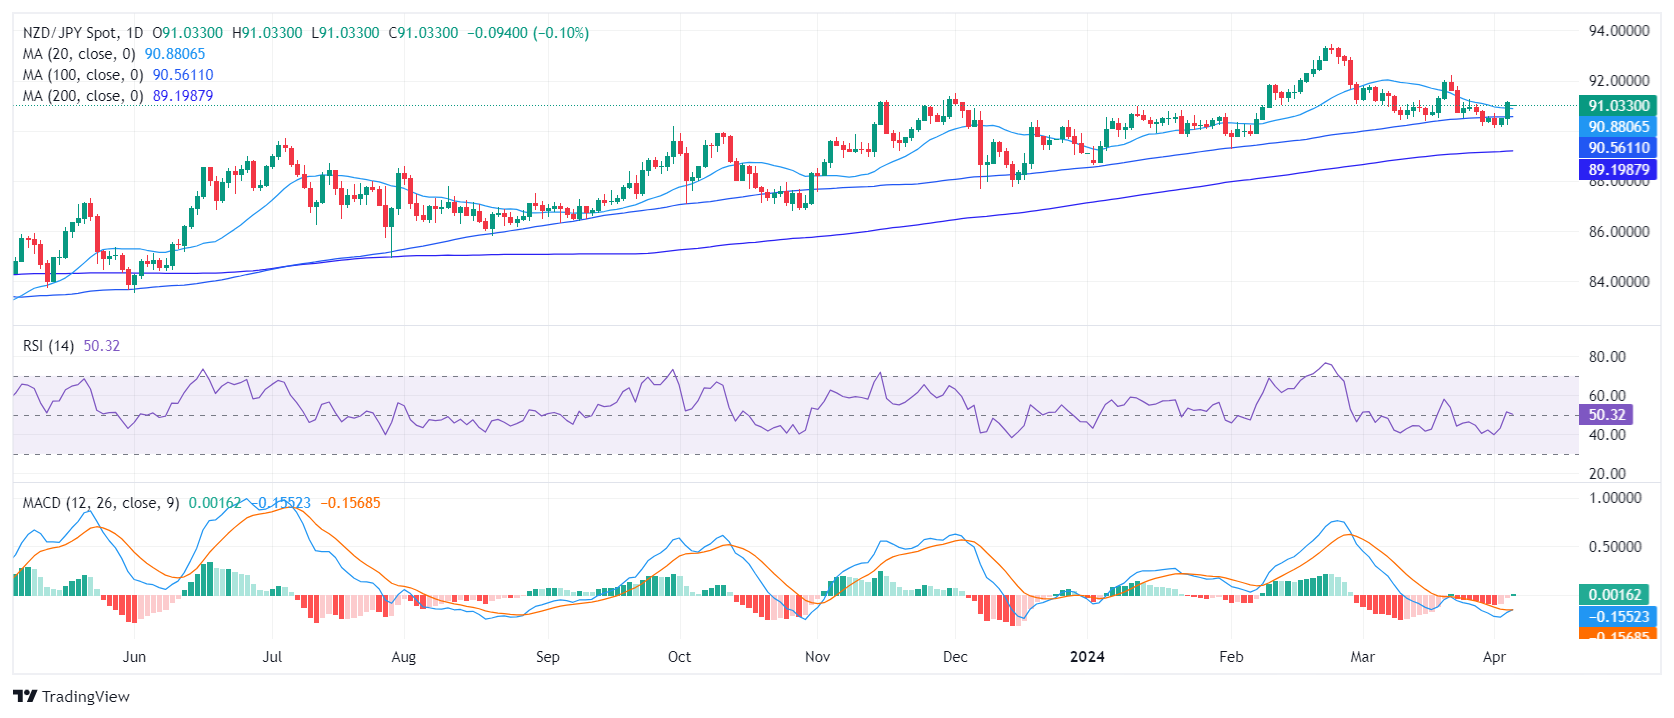
On the daily chart, the NZD/JPY Relative Strength Index (RSI) reveals its latest reading, slightly shifting towards a positive trend. The value is edging past the 50 mark after a period of predominantly being in negative terrain. However, with the latest RSI reading barely past 50, the momentum can still be seen as not strongly favoring the buyers.
NZD/JPY daily chart
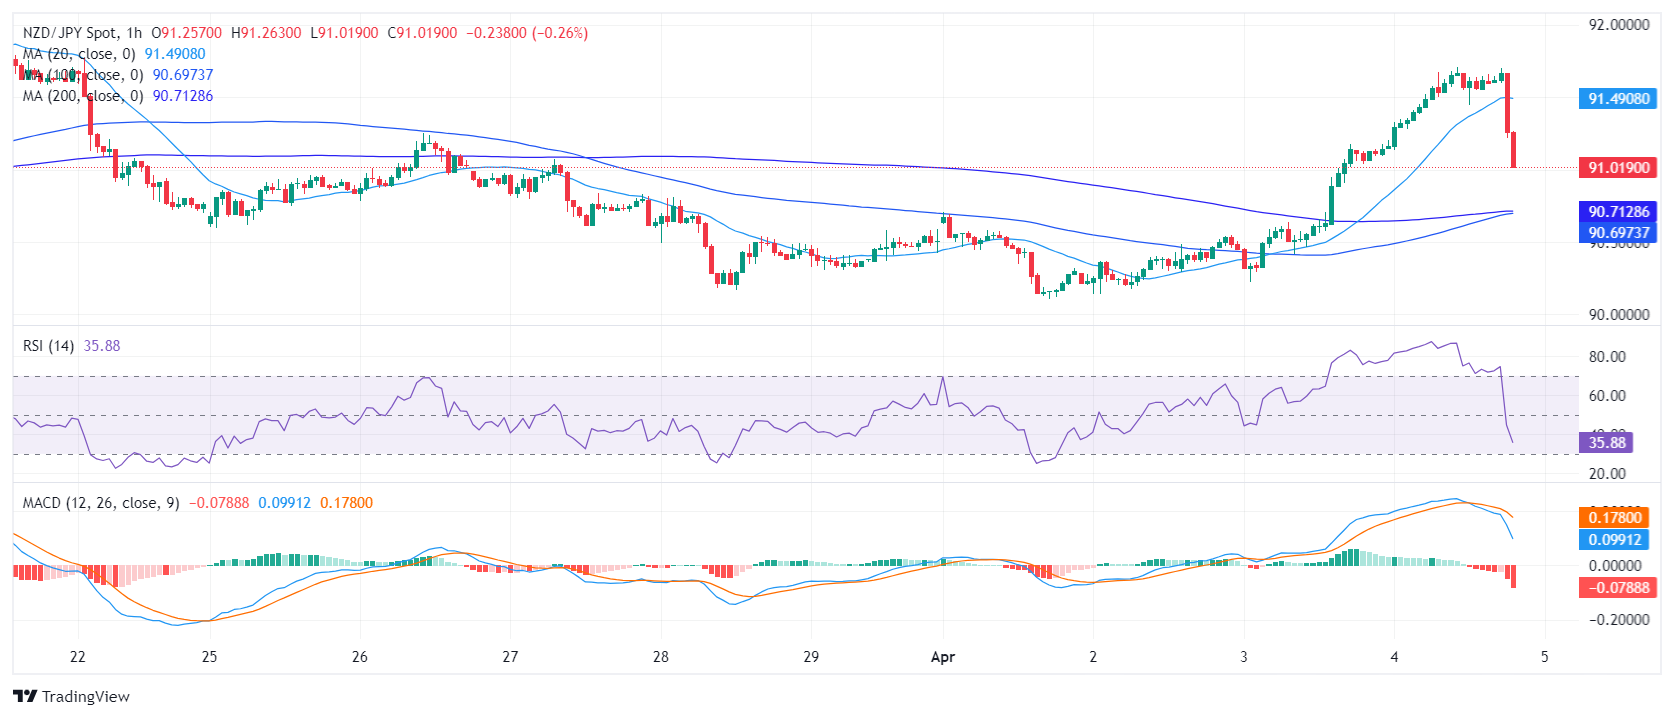
On the hourly RSI reading fell on the negative side after being near 70. The MACD histogram has begun to print rising red bars, also suggesting a rising negative momentum.
NZD/JPY hourly chart
Regarding the overall trend, the NZD/JPY pair jumped above the 20-day SMA today, often serving as a bullish short-term signal. In addition, the pair stands above its 100 and 200-day Simple Moving Average (SMA), also flashing a long-term positive outlook.
In conclusion, based on both the daily and hourly trends, plus taking the position in relation to the SMA into consideration, the NZD/JPY shows signs of a potential shift from a bearish to a bullish stance in the immediate term. However, if the bulls hold the above main SMAs, the outlook will still be positive.