- Silver Price Analysis: XAG/USD finds support near $26.60 after a sharp correction ahead of US NFP
Market news
Silver Price Analysis: XAG/USD finds support near $26.60 after a sharp correction ahead of US NFP
- Silver price finds cushion near $26.60 amid correction ahead of US NFP report.
- The US NFP report will influence market expectations for Fed rate cuts in June.
- Deepening Middle East tensions keep near-term demand for Silver intact.
Silver price (XAG/USD) discovers support near $26.60 after a pullback from more than two-years high of $27.34. The white metal takes a breather after a strong rally as investors turn cautious ahead of the United States Nonfarm Payrolls (NFP) report for March, which will be published at 12:30 GMT.
According to the expectations, fresh payrolls were 200K, lower than the former reading of 275K. The Unemployment Rate is expected to come out steady at 3.9%.
Investors will also focus on the Average Hourly Earnings data, which will provide fresh inflation outlook. The monthly wage growth is forecasted to have grown at a higher pace of 0.3% from 0.1% in February. In the same period, the annually wage growth is estimated to have dipped to 4.1% against 4.3%.
Strong labor demand and higher wage growth would allow the Federal Reserve (Fed) to delay rate cut plans while signs of labor market conditions easing will boost rate cut hopes for the June meeting. The US Dollar Index (DXY) stabilizes after recovering from two-week low of 103.90 ahead of the US NFP report.
The demand for Silver is bullish in the longer horizon due to deepening Middle East tensions. Air strikes from Israel forces on Iranian embassy in Damascus, situated near Syria’s capital, has deepened fears of Iran’s participation to Israel-Palestine war.
Silver technical analysis
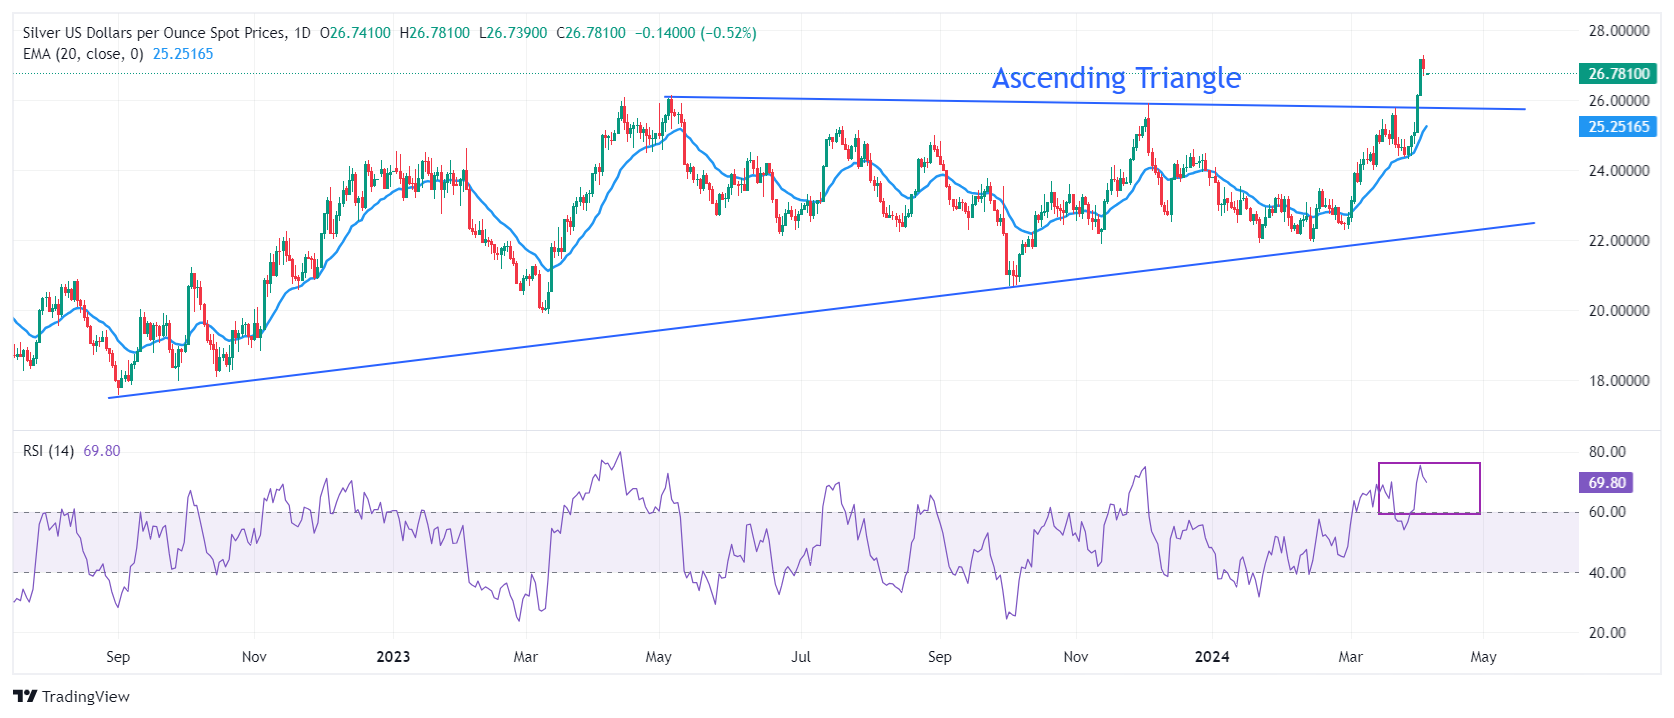
Silver price saw a stalwart rally after a breakout of the Ascending Triangle pattern formed on daily timeframe. The aforementioned chart pattern exhibits sharp volatility contraction but a decisive breakout leads to heavy volume and wider ticks on the upside. The horizontal resistance of the above-mentioned chart pattern, placed from May 5 high at $26.13, has turned into a crucial support for the Silver price bulls.
Advancing 20-day Exponential Moving Average (EMA) near $25.25 keeps the near-term demand unabated.
The 14-period Relative Strength Index (RSI) oscillates in the bullish range of 60.00-80.00, indicating a strong momentum leaned to the upside.
Silver daily chart
