- GBP/JPY pulls back after hitting another fresh 16-year high, cracks 201.00
Market news
GBP/JPY pulls back after hitting another fresh 16-year high, cracks 201.00
- GBP/JPY hit a new 16-year peak of 201.32 on Thursday.
- JPY traders are buckling down ahead of the BoJ’s latest rate call.
- Sterling markets are shrugging off misses in UK data.
GBP/JPY tested into a fresh 16-year high above 201.00 on Thursday, tipping into 201.32 before falling back into the previous day’s range as Guppy traders jostle for position ahead of the Bank of Japan’s (BoJ) latest rate call and Monetary Policy Statement. The BoJ’s latest rate statement is due early on Friday, and Sterling traders will be looking ahead to next week’s latest UK Consumer Price Index (CPI) inflation update.
UK data has broadly missed the mark this week, with an unexpected surge in unemployment claims and a sharper-than-forecast contraction in industrial activity. However, GBP traders have broadly shrugged off the bleaker economic outlook for the UK to bolster the Guppy as Japan’s hypereasy monetary policy stance keeps the Yen unsupported against its major currency peers.
The BoJ is broadly expected to hold rates at 0% early Friday, and investors aren’t expecting much movement from the Japanese central bank in the way of tightening monetary policy. The economic calendar remains thin on the UK side, leaving GBP traders to sit and wait for next Wednesday’s CPI inflation print, followed by Thursday’s rate call from the Bank of England (BoE). The BoE last voted 7-to-2 to keep interest rates steady at 5.25%, with only two Monetary Policy Committee (MPC) members voting for a rate cut.
GBP/JPY technical outlook
GBP/JPY peaked at a fresh 16-year high of 201.32 early Thursday before quickly pulling back to the 200-hour Exponential Moving Average (EMA) at 199.89. The pair is still tilted firmly into bullish territory, but downside pulses are keeping the pair in a choppy rising consolidation pattern.
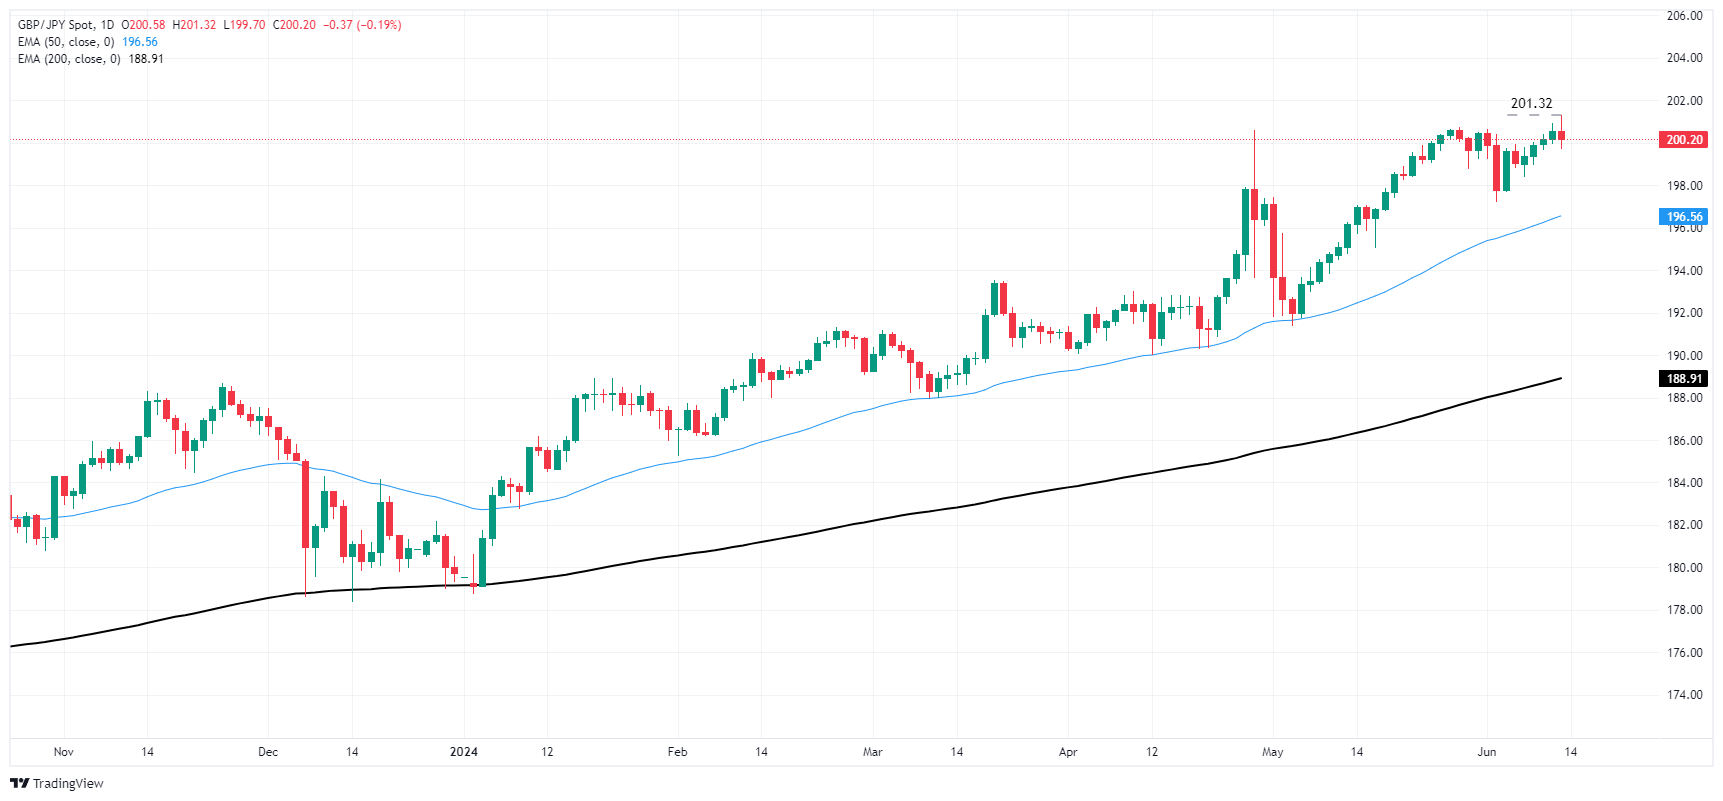
The Guppy closed five of the last six trading days in the green, and is showing signs of bullish exhaustion. The pair could be poised for a fresh drop to the 50-day EMA at 196.56, though GBP/JPY remains deep in bull country, trading above the 200-day EMA at 188.91.
GBP/JPY hourly chart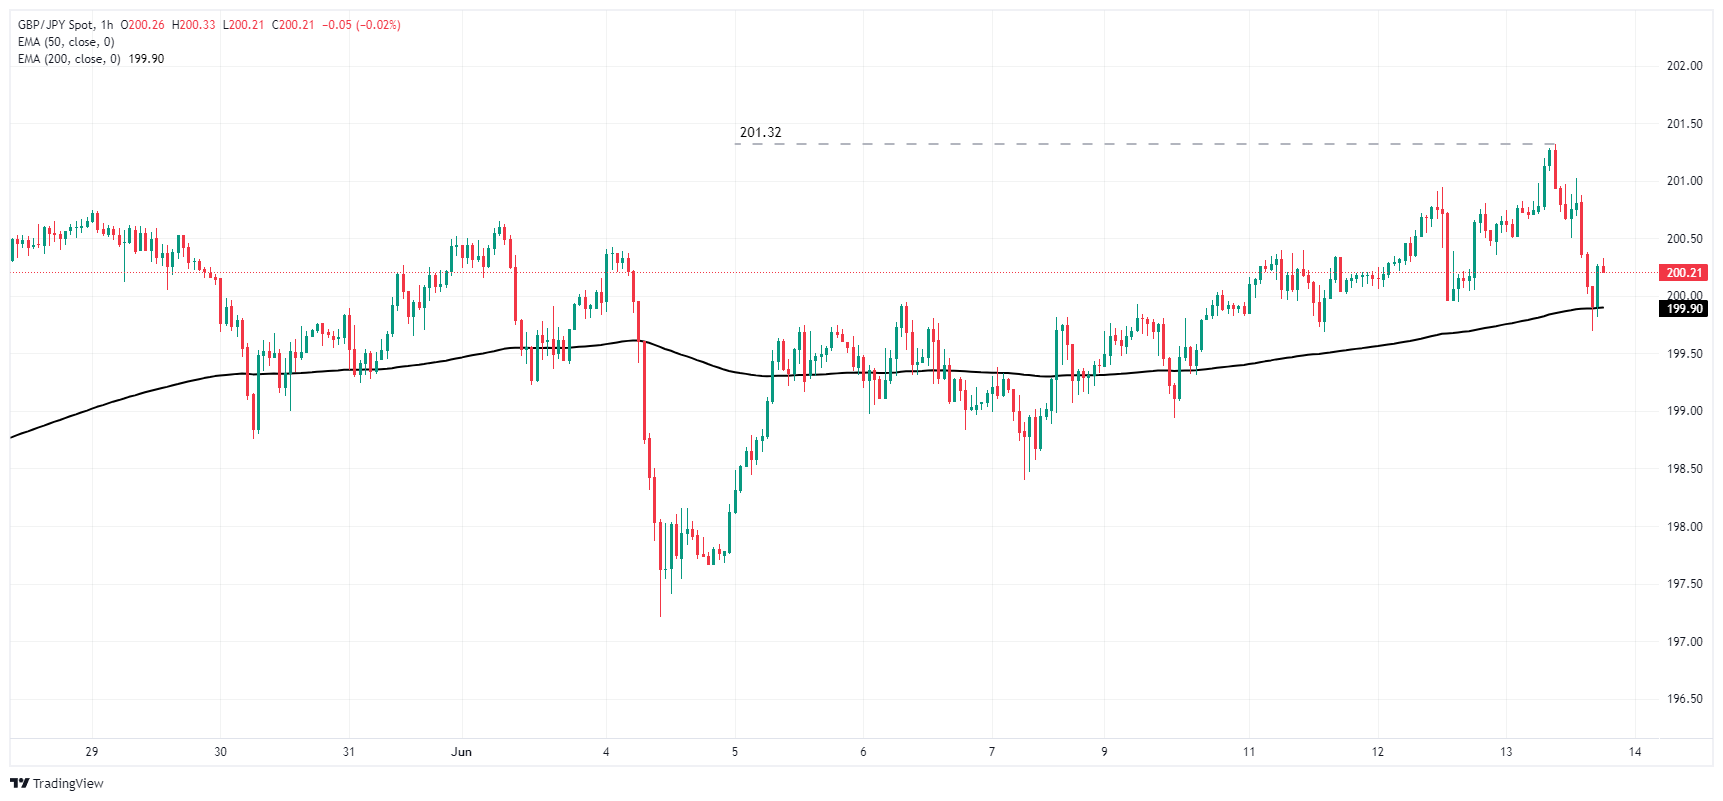
GBP/JPY daily chart