- Silver Price Forecast: XAG/USD falls toward $29.50, followed by a 50-day EMA
Market news
Silver Price Forecast: XAG/USD falls toward $29.50, followed by a 50-day EMA
- Silver price may find support around the 50-day EMA at $29.01 level.
- Analysis of the daily chart suggests a bearish bias as the Silver price consolidates within the descending channel pattern.
- The upper boundary of the descending channel at $30.50 could act as a key resistance.
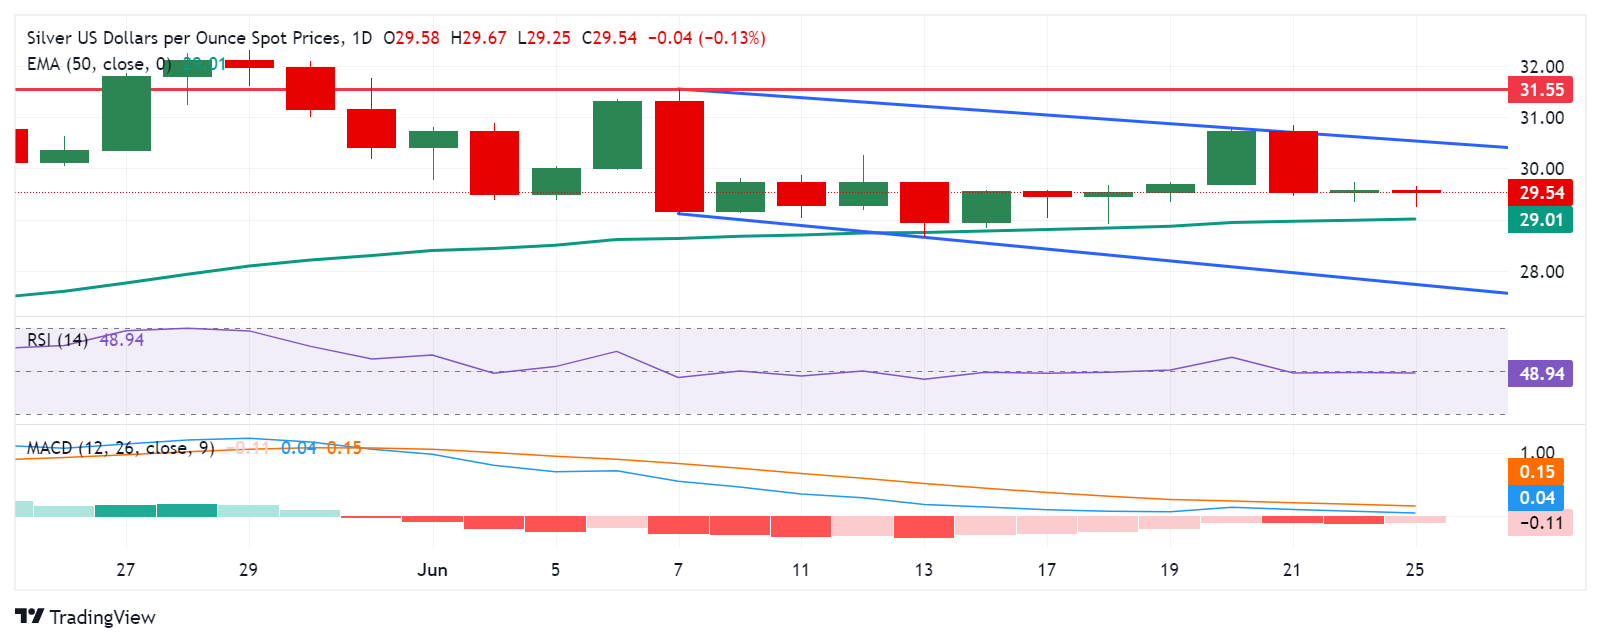
Silver price inches lower to near $29.60 per troy ounce during the early European session on Tuesday. Analysis of the daily chart indicates a bearish bias as the XAG/USD pair consolidates within the descending channel pattern. Additionally, the 14-day Relative Strength Index (RSI) is positioned below the 50 level, suggesting a confirmation of a downward trend.
The momentum indicator Moving Average Convergence Divergence (MACD) suggests a bearish bias for Silver. This configuration indicates that the overall trend might still be positive as the MACD line is above the centreline. However, the momentum is weakening as the MACD line is below the signal line. If the MACD line crosses below the centerline, it would further confirm a strengthening downward trend.
On the downside, the Silver price may find immediate support around the 50-day Exponential Moving Average (EMA) at $29.01 level. A break below this level could put pressure on the grey metal to navigate the region around the psychological level of $28.00, followed by the lower threshold of the descending channel around the level of $27.76.
In terms of resistance, the Silver price may find the immediate barrier at the significant level of $30.00, followed by the upper boundary of the descending channel at $30.50. A breakthrough above the latter could lead the XAG/USD pair to test the four-week high of $31.55.
XAG/USD: Daily Chart