- EUR/USD Price Analysis: Inches higher to near 1.0900; next barrier at four-month highs
Market news
EUR/USD Price Analysis: Inches higher to near 1.0900; next barrier at four-month highs
- EUR/USD may maintain its upward momentum, with a potential return to the ascending channel.
- The pair may encounter key resistance near a four-month high at 1.0922.
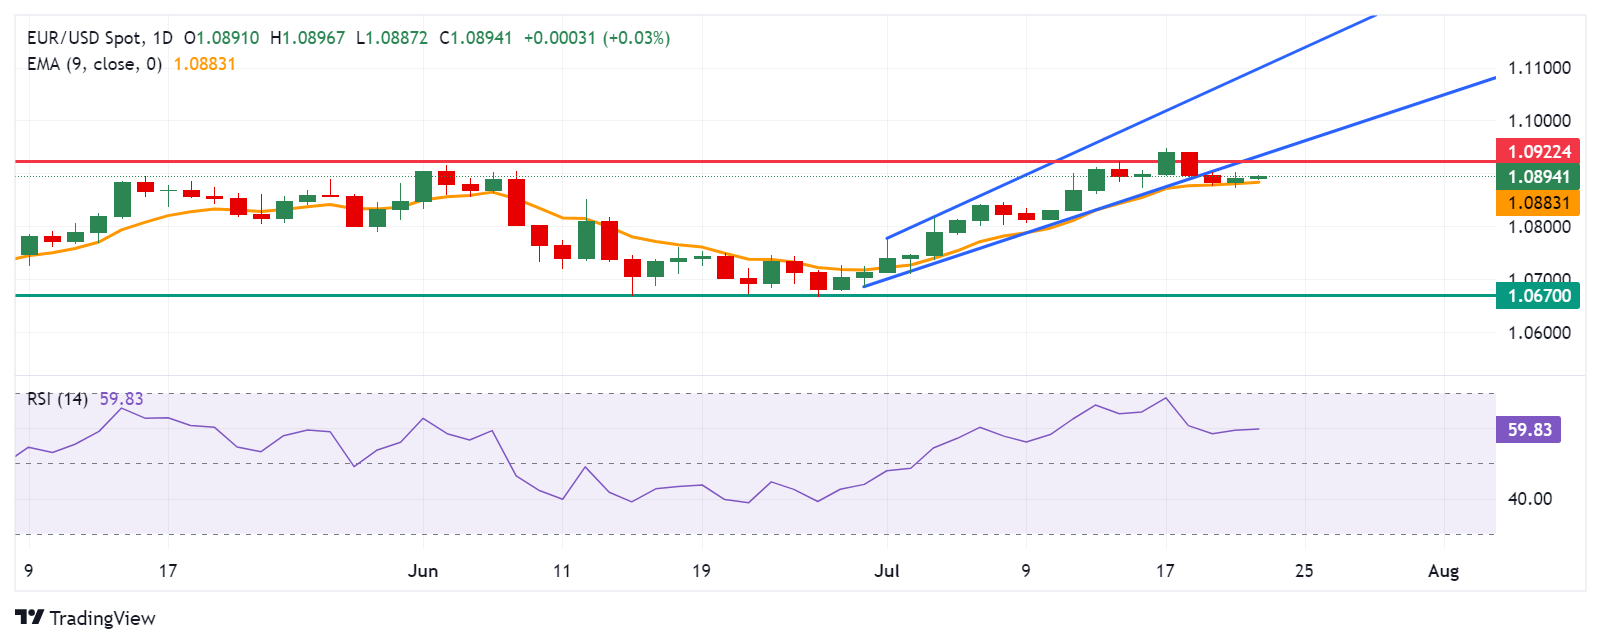
- The nine-day EMA at 1.0883 level acts as immediate support.
EUR/USD advances for the second consecutive day, trading around 1.0900 during Tuesday's Asian session. The analysis of the daily chart shows a weakening of a bullish trend, as the pair is positioned below an ascending channel.
Moreover, the 14-day Relative Strength Index (RSI), a momentum indicator, is above the 50 level, further affirming the bullish sentiment for the EUR/USD pair. Further movement will give a clear directional trend.
The EUR/USD pair could retest a potential resistance near a four-month high at 1.0922, observed on July 15, followed by the lower boundary of the ascending channel around the level of 1.0940.
A return to the ascending channel will improve the bullish bias and support the EUR/USD pair to approach the psychological level of 1.1000, followed by the upper boundary of the ascending channel near 1.1100.
On the downside, the nine-day Exponential Moving Average (EMA) at 1.0883 level acts as immediate support. A break below this level could exert downward pressure on the EUR/USD pair to navigate the region around the key level of 1.0670, potentially serving as a throwback support level.
EUR/USD: Daily Chart
Euro PRICE Today
The table below shows the percentage change of Euro (EUR) against listed major currencies today. Euro was the strongest against the New Zealand Dollar.
| USD | EUR | GBP | JPY | CAD | AUD | NZD | CHF | |
|---|---|---|---|---|---|---|---|---|
| USD | -0.03% | 0.02% | -0.47% | 0.03% | 0.08% | 0.17% | -0.05% | |
| EUR | 0.03% | 0.05% | -0.43% | 0.05% | 0.09% | 0.17% | -0.03% | |
| GBP | -0.02% | -0.05% | -0.46% | 0.01% | 0.07% | 0.14% | -0.08% | |
| JPY | 0.47% | 0.43% | 0.46% | 0.49% | 0.53% | 0.60% | 0.37% | |
| CAD | -0.03% | -0.05% | -0.01% | -0.49% | 0.05% | 0.11% | -0.09% | |
| AUD | -0.08% | -0.09% | -0.07% | -0.53% | -0.05% | 0.08% | -0.15% | |
| NZD | -0.17% | -0.17% | -0.14% | -0.60% | -0.11% | -0.08% | -0.22% | |
| CHF | 0.05% | 0.03% | 0.08% | -0.37% | 0.09% | 0.15% | 0.22% |
The heat map shows percentage changes of major currencies against each other. The base currency is picked from the left column, while the quote currency is picked from the top row. For example, if you pick the Euro from the left column and move along the horizontal line to the US Dollar, the percentage change displayed in the box will represent EUR (base)/USD (quote).