- EUR/GBP Price Analysis: Short-term trend in doubt as falling channel remains shallow
Market news
EUR/GBP Price Analysis: Short-term trend in doubt as falling channel remains shallow
- EUR/GBP’s short-term trend is in doubt.
- The pair continues declining after the August 8 high, however, the move is shallow.
- There is a risk the prior uptrend could still resume, handing control back to bulls.
EUR/GBP underwent a strong rally in late July and early August. The rally eventually peaked on August 8 at 0.8625 and started moving lower.
The pair formed a falling channel which reached a new low of around 0.8507 on Monday. This was also the midpoint of the prior move – or the 0.5 Fibonacci retracement level of the rally from the July 17 low.
EUR/GBP 4-hour Chart
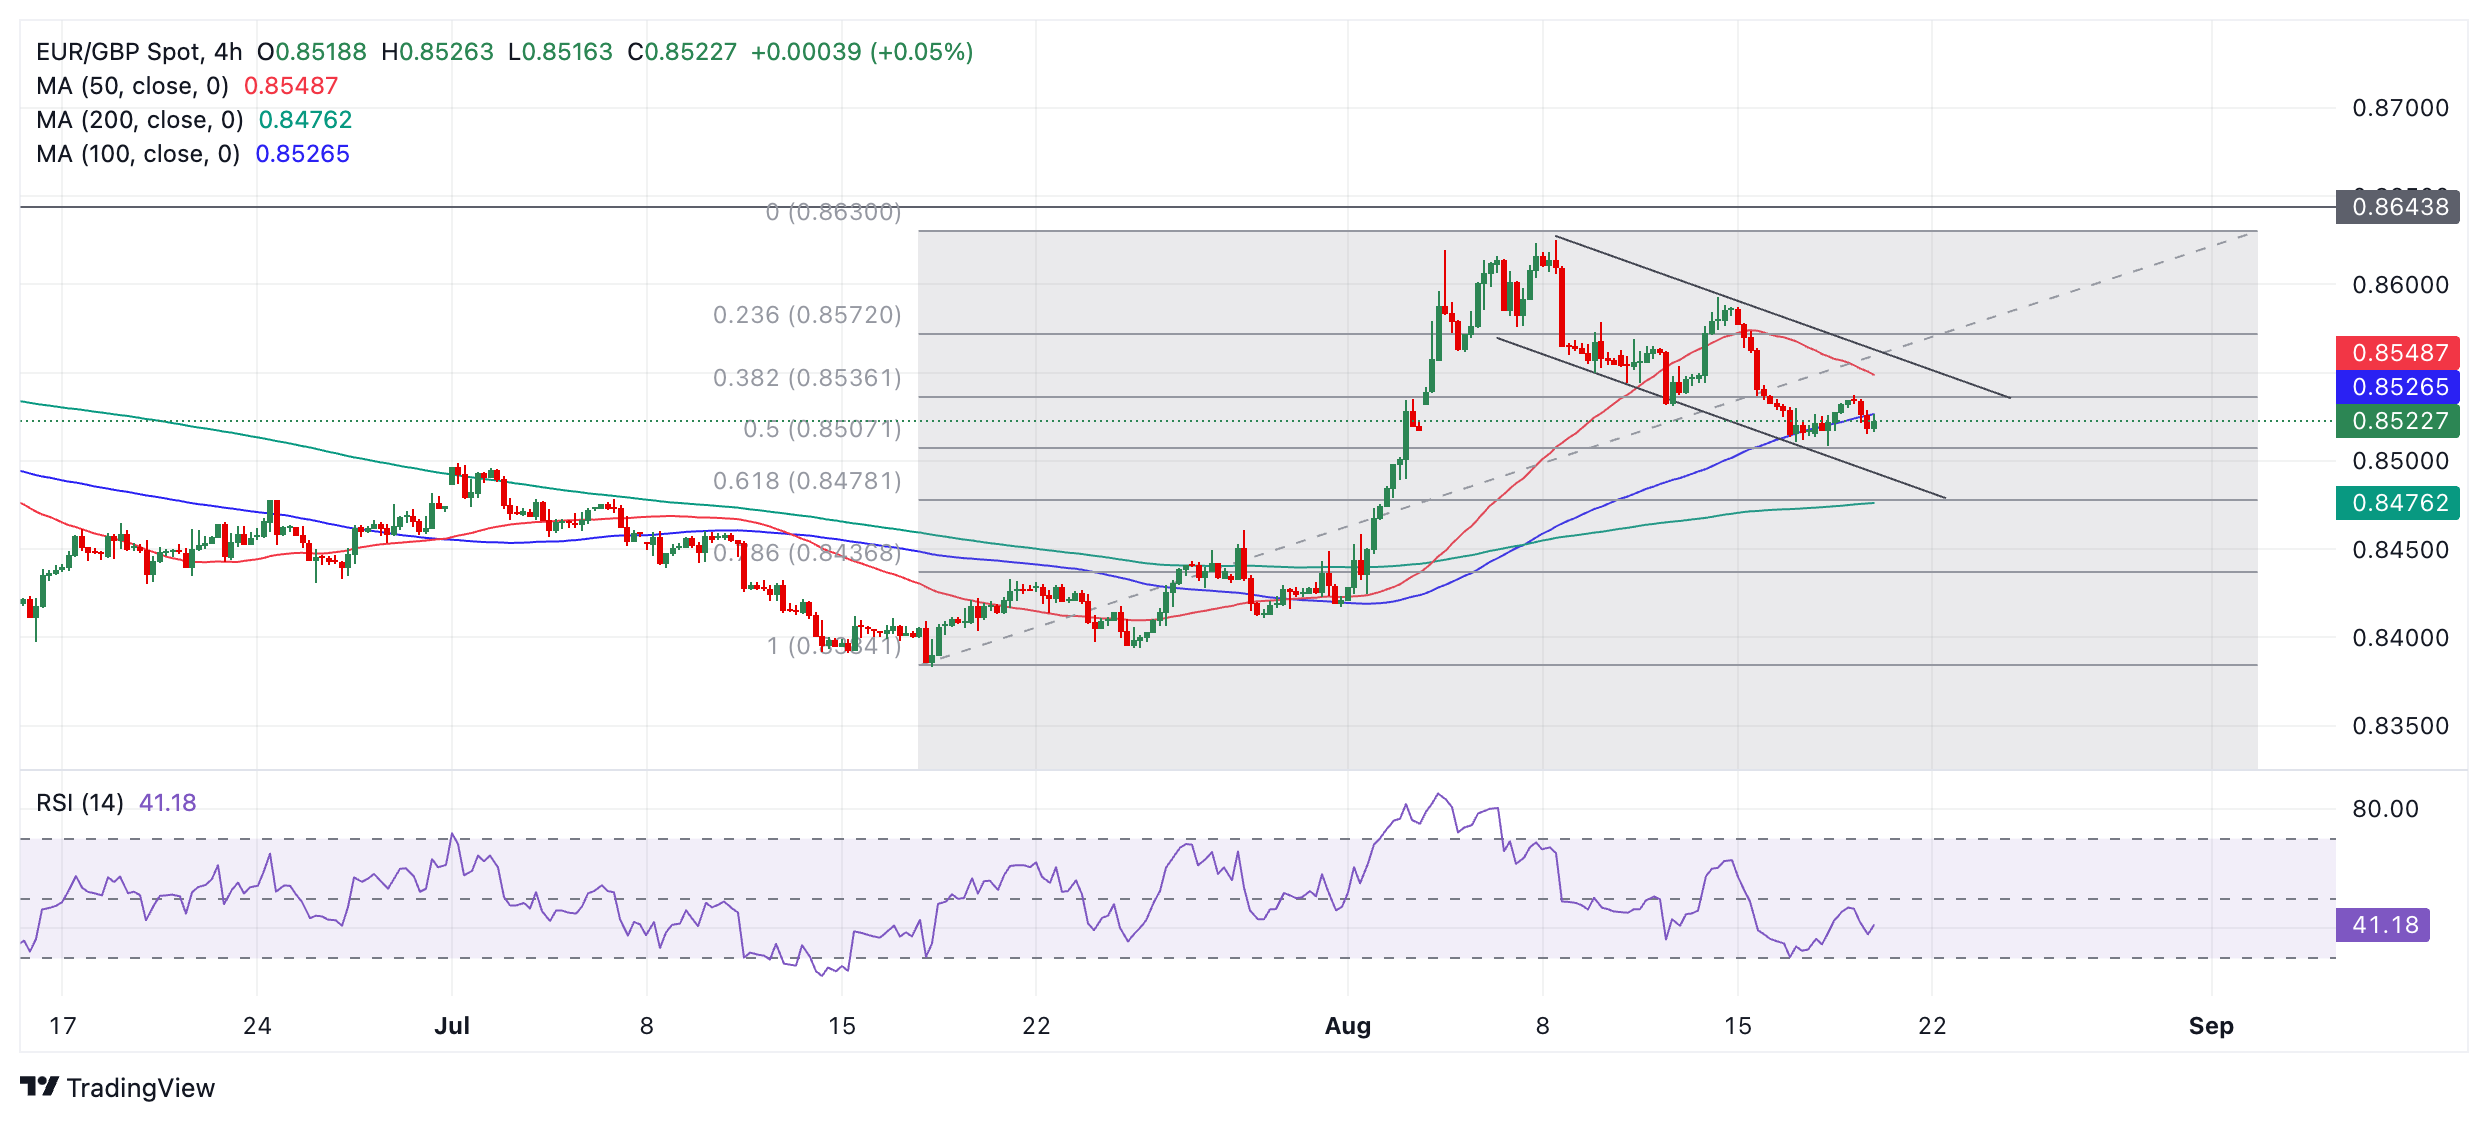
The move down from the August 8 high has extended quite far and established a new sequence of declining peaks and troughs. This could indicate the trend has changed to a short-term downtrend. If so – and given “the trend is your friend” – the odds would now favor shorts over longs.
However, the rally from the July 17 low was quite a bit steeper than the falling channel, indicating bullish conviction has been stronger than bearish conviction. If so, then this might mean that the decline since the August 8 high is in fact merely a correction of the previous rally, and not a new short-term downtrend. If so, the climate still favors longs over shorts.
Either interpretation is valid so the direction of the short-term trend remains doubtful. It would require a strong bullish reversal candlestick pattern to suggest the possibly still-intact uptrend was resuming. An upside breakout from the falling channel could also be a sign of the resumption of the bullish trend.
Likewise, it is also possible the bearish channel could continue falling. In such a scenario, EUR/GBP might next fall to the 0.618 Fibonacci retracement ratio at 0.8478. The 200-period Simple Moving Average (SMA) is also nearby and could provide a downside target for price. ¡
The long-term trend (weekly chart) is still bearish whilst the medium-term trend is bullish, further confusing the technical picture.