- NZD/USD Price Analysis: Bearish bias persists, 20-day SMA gone
Market news
NZD/USD Price Analysis: Bearish bias persists, 20-day SMA gone
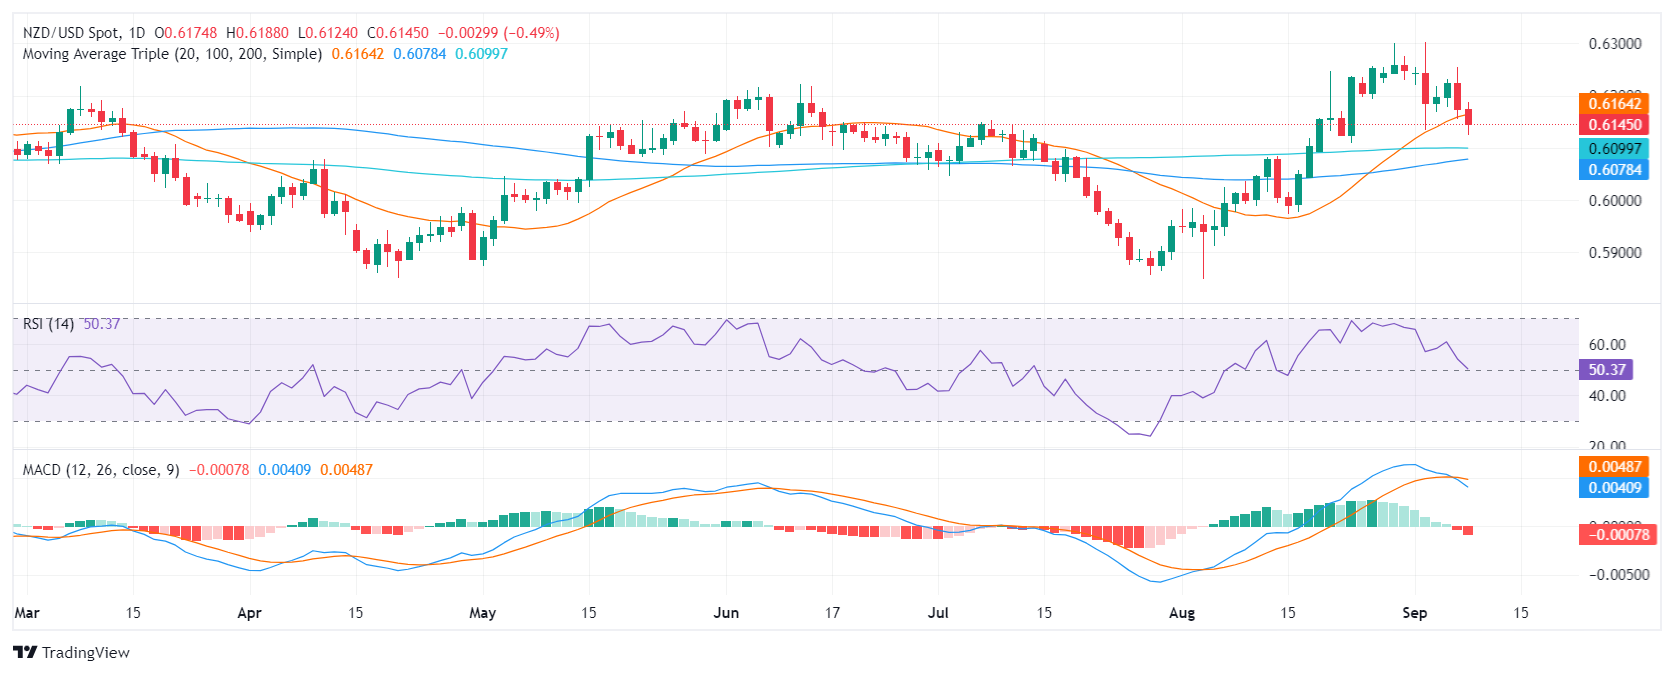
- NZD/USD declined by 0.50% on Monday to reach 0.6145.
- The RSI is in positive territory but declining, indicating a rising bearish traction.
- The pair lost the 20-day SMA which flash sell signals.
Monday's session saw the New Zealand Dollar weaken against its US counterpart, extending its losing streak to two days. The NZD/USD pair fell by 0.50% to a low of 0.6145, as the bears continued to dominate the market.
The Relative Strength Index (RSI) is currently at 50, which is in positive territory but has a negative slope which suggests that the bears are advancing. The Moving Average Convergence Divergence (MACD) printed red bars, a sign of a continuation of the bear’s momentum. This is aligned with the recent price action, which shows the bears are in control.
NZD/USD daily chart

The 20-day Simple Moving Average (SMA) has now turned into a resistance level around the 0.6160 level and bulls will present support around the 0.6130 level and below at the psychological mark of 0.6100. The pair must recover the mentioned average to stop the bleeding.
.