- NZD/USD Price Analysis: Bulls attempt to retake the 20-day SMA, outlook promising
Market news
NZD/USD Price Analysis: Bulls attempt to retake the 20-day SMA, outlook promising
- The NZD/USD pair has been choppy between 0.6159-0.6260 in the past sessions.
- The RSI shows rising buying pressure, whereas the MACD suggests a potential reversal in the bearish momentum.
On Thursday, the NZD/USD pair rose to 0.6239, above the 20-day Simple Moving Average (SMA) which served as a strong resistance in the last sessions. Indicators meanwhile look promising.
The Relative Strength Index (RSI) is at 59, in positive territory with a rising slope, signaling rising buying pressure. Conversely, the Moving Average Convergence Divergence (MACD) histogram is red and falling, suggesting that selling pressure may be declining. This presents a mixed outlook for the pair.
NZD/USD daily chart
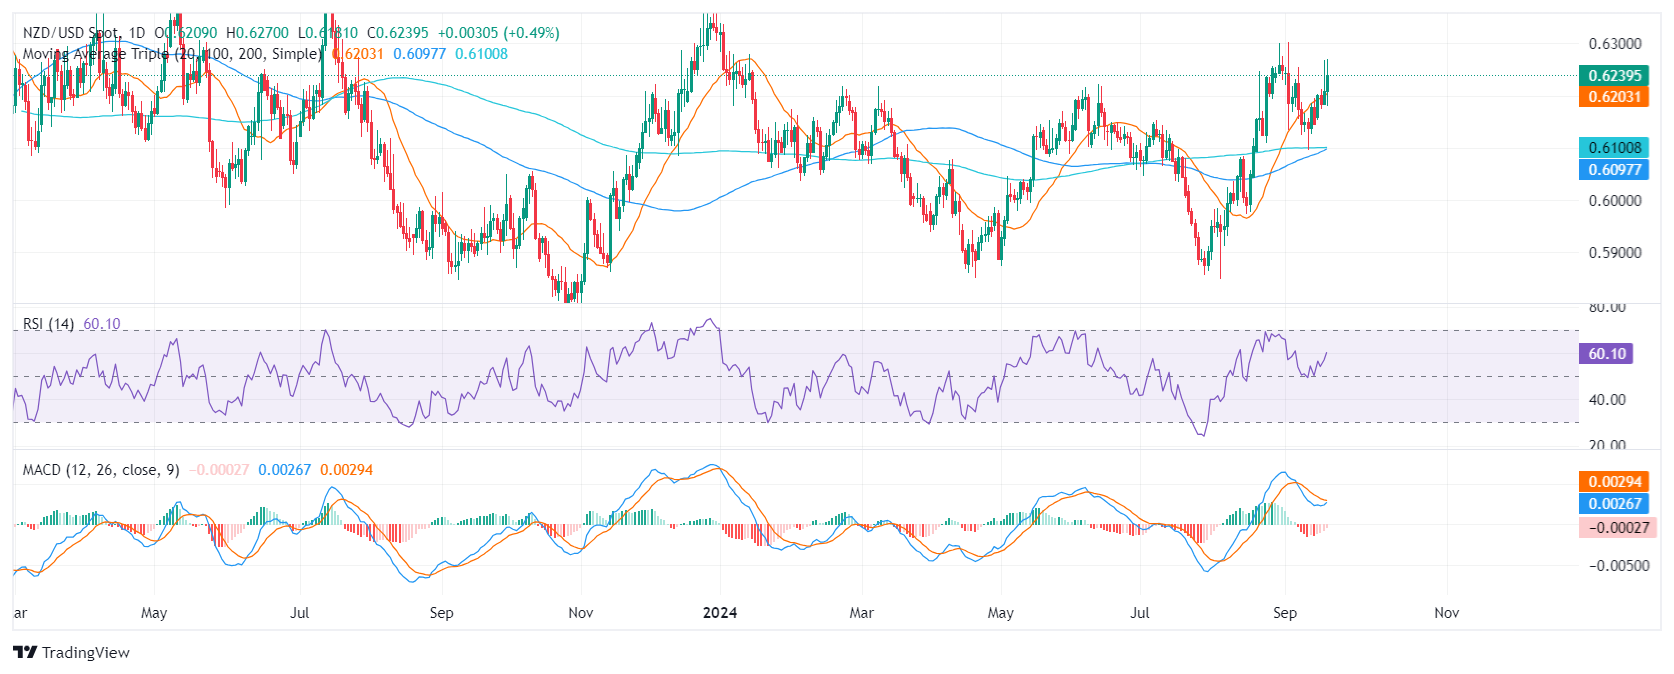
Key support levels include 0.6150, 0.6120, and 0.6100, while resistance levels are 0.6190, 0.6200, and 0.6230. A close above the 20-day SMA, currently at 0.6200, could signal further upward movement with the next target being at early September highs near 0.6300.