- NZD/JPY Price Analysis: Pair stuck in range, moves sideways
Market news
14 November 2024
NZD/JPY Price Analysis: Pair stuck in range, moves sideways
- NZD/JPY declined mildly to 91.40 on Thursday's session.
- The pair continued trading within the range of 92.00-91.00 going nowhere.
- The RSI was at 52, showing flat buying pressure and the MACD histogram flat and red indicated selling pressure was flat.
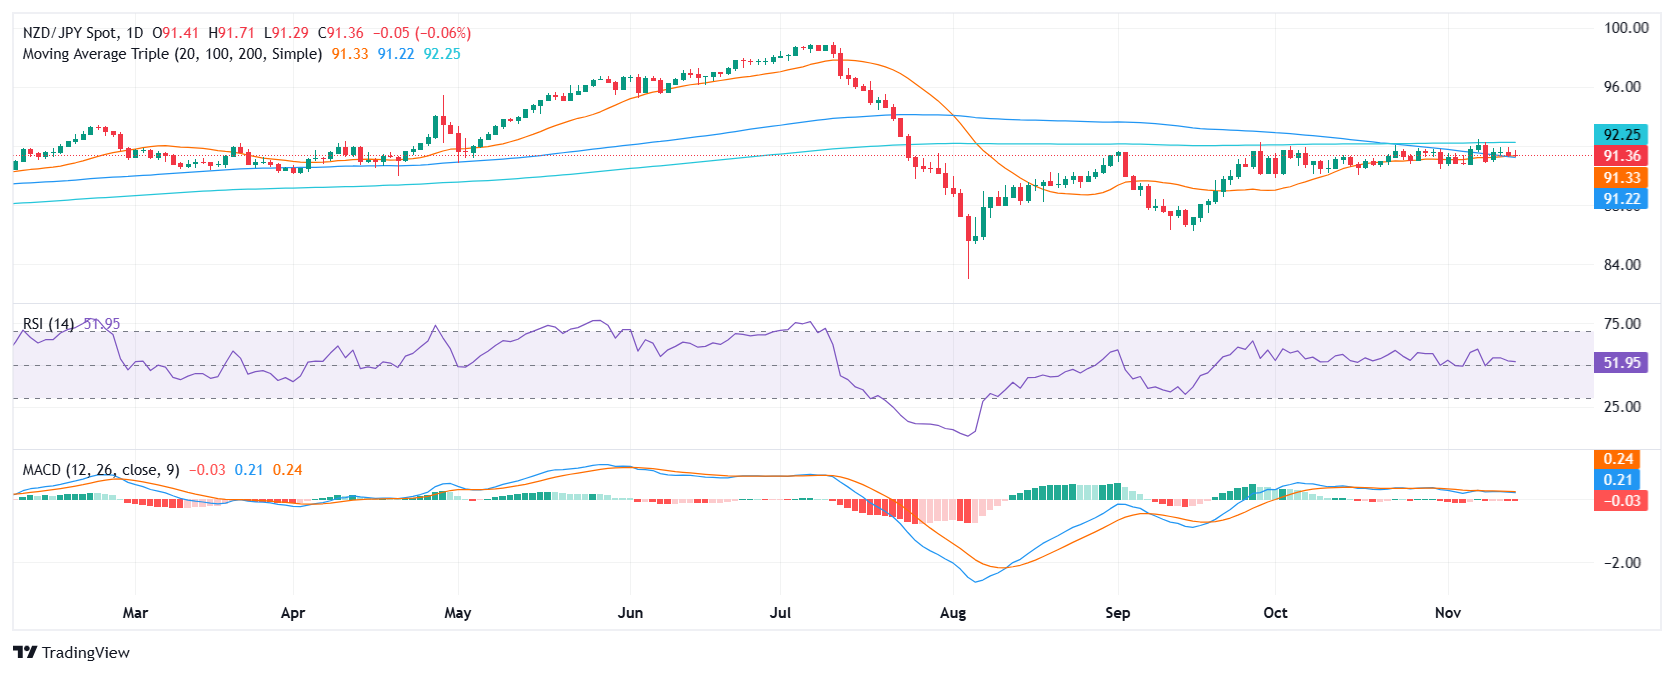
The NZD/JPY pair declined mildly to 91.40 on Thursday's session and continued trading within the range of 92.00-91.00. Indicators are neutral with no clear dominant, but a recently completed bearish crossover between the 20 and 100-day Simple Moving Averages (SMAs) might eventually push the pair lower.
The NZD/JPY pair's technical outlook remains mixed, as suggested by neutral indicators. The Relative Strength Index (RSI) stands at 52, indicating balanced buying and selling pressures, while the Moving Average Convergence Divergence (MACD) histogram is flat and red, suggesting flat selling pressure.The pair is currently trading sideways, with support levels at 91.00, 90.50, and 90.00, and resistance levels at 92.00, 92.50, and 93.00.
NZD/JPY daily chart
Market Focus
Open Demo Account & Personal Page