Market news
-
22:28
Currencies. Daily history for May 01’2017:
(pare/closed(GMT +2)/change, %)
EUR/USD $1,0897 0,00%
GBP/USD $1,2884 -0,49%
USD/CHF Chf0,9961 +0,13%
USD/JPY Y111,83 +0,29%
EUR/JPY Y121,89 +0,31%
GBP/JPY Y144,09 -0,18%
AUD/USD $0,7522 +0,47%
NZD/USD $0,6905 +0,61%
USD/CAD C$1,368 +0,18%
-
21:58
Schedule for today, Tuesday, May 02’2017 (GMT0)
00:20 Japan BOJ Governor Haruhiko Kuroda Speaks
01:45 China Markit/Caixin Manufacturing PMI April 51.2 51.3
04:30 Australia Announcement of the RBA decision on the discount rate 1.5% 1.5%
04:30 Australia RBA Rate Statement
07:30 Switzerland Manufacturing PMI April 58.6 58.3
07:50 France Manufacturing PMI (Finally) April 53.3 55.1
07:55 Germany Manufacturing PMI (Finally) April 58.3 58.2
08:00 Eurozone Manufacturing PMI (Finally) April 56.2 56.8
08:30 United Kingdom Purchasing Manager Index Manufacturing April 54.2 54
09:00 Eurozone Unemployment Rate March 9.5% 9.4%
19:00 U.S. Total Vehicle Sales, mln April 16.62 17.05
22:45 New Zealand Employment Change, q/q Quarter I 0.8% 0.8%
22:45 New Zealand Unemployment Rate Quarter I 5.2% 5.2%
23:30 Australia AIG Services Index April 51.7
-
14:06
US ISM manufacturing well below expectations in April
The report was issued today by Bradley J. Holcomb, CPSM, CPSD, Chair of the Institute for Supply Management Manufacturing Business Survey Committee:
"The April PMI registered 54.8 percent, a decrease of 2.4 percentage points from the March reading of 57.2 percent. The New Orders Index registered 57.5 percent, a decrease of 7 percentage points from the March reading of 64.5 percent. The Production Index registered 58.6 percent, 1 percentage point higher than the March reading of 57.6 percent. The Employment Index registered 52 percent, a decrease of 6.9 percentage points from the March reading of 58.9 percent. Inventories of raw materials registered 51 percent, an increase of 2 percentage points from the March reading of 49 percent.
The Prices Index registered 68.5 percent in April, a decrease of 2 percentage points from the March reading of 70.5 percent, indicating higher raw materials prices for the 14th consecutive month, but at a slower rate of increase in April compared with March. Comments from the panel generally reflect stable to growing business conditions; with new orders, production, employment and inventories of raw materials all growing in April over March."
-
14:00
U.S.: ISM Manufacturing, April 54.8 (forecast 56.4)
-
14:00
U.S.: Construction Spending, m/m, March -0.2% (forecast 0.4%)
-
13:55
April data revealed a sustained upturn in U.S. manufacturing production - Markit
April data revealed a sustained upturn in U.S. manufacturing production, but the rate of growth moderated further from the 22-month peak recorded in January. The slower rise in output volumes largely reflected a more subdued pace of new business growth in April. Payroll numbers continued to increase across the manufacturing sector, driven by efforts to boost production capacity.
However, latest data indicated that manufacturers sought to reduce their stocks of purchases, which ended a six-month period of inventory building. Meanwhile, cost pressures intensified, with input prices rising at the fastest pace for just over twoand-a-half years.
The seasonally adjusted Markit final US Manufacturing Purchasing Managers' Index registered 52.8 in April, down from 53.3 in March, to signal the slowest improvement in overall business conditions since September 2016. A fall in the headline PMI largely reflected weaker contributions from output and new business growth in April, which more than offset a slight rebound in job creation.
-
13:45
U.S.: Manufacturing PMI, April 52.8 (forecast 52.8)
-
13:29
Option expiries for today's 10:00 ET NY cut
EURUSD: 1.0800 (EUR 236m) 1.0825 (278m) 1.0850 (832m) 1.0925-30 (345m) 1.1000 (350m) 1.1055 (240m)
USDJPY: 110.00 (USD 1.7bln 110.20-30 (1.3bln) 110.50 (496m) 111.00 (443m) 111.30 (466m) 112.00 (797m) 112.25 (440m)
GBPUSD: 1.13110-20 (GBP 281m)
AUDUSD: 0.75010-15 (AUD 247m) 0.7560 (391m) 0.7650-60 (912m)
USDCAD: 1.3515 (USD 410m) 1.3625 (450m) 1.3650 (85m)
EURJPY 120.00 (EUR 942m) 121.00 (586m)
-
12:42
US personal income increased $40.0 billion (0.2 percent) in March
Personal income increased $40.0 billion (0.2 percent) in March according to estimates released today by the Bureau of Economic Analysis. Disposable personal income (DPI) increased $35.0 billion (0.2 percent) and personal consumption expenditures (PCE) increased $5.7 billion (less than 0.1 percent).
Real DPI increased 0.5 percent in March and Real PCE increased 0.3 percent. The PCE price index decreased 0.2 percent. Excluding food and energy, the PCE price index decreased 0.1 percent.
-
12:30
U.S.: Personal spending , March 0.0% (forecast 0.3%)
-
12:30
U.S.: PCE price index ex food, energy, m/m, March -0.1% (forecast -0.1%)
-
12:30
U.S.: PCE price index ex food, energy, Y/Y, March 1.6%
-
12:30
U.S.: Personal Income, m/m, March 0.2% (forecast 0.3%)
-
09:48
U.N. Human rights chief says his office continues to receive signals that Saudi coalition might attack Hodeidah port in Yemen, concerned about humanitarian repercussions and loss of life
-
09:18
10-year U.S treasury yield at 2.298 percent vs U.S close of 2.282 percent on friday
-
09:17
UN rights chief Zeid voices concern at state of emergency in Turkey, weekend arrests and sackings: "It is highly unlikely that the suspensions and detentions will have met due process standards"
-
07:47
Forex option contracts rolling off today at 14.00 GMT:
EURUSD: 1.0800 (EUR 236m) 1.0825 (278m) 1.0850 (832m) 1.0925-30 (345m) 1.1000 (350m) 1.1055 (240m)
USDJPY: 110.00 (USD 1.7bln 110.20-30 (1.3bln) 110.50 (496m) 111.00 (443m) 111.30 (466m) 112.00 (797m) 112.25 (440m)
GBPUSD: 1.13110-20 (GBP 281m)
AUDUSD: 0.75010-15 (AUD 247m) 0.7560 (391m) 0.7650-60 (912m)
USDCAD: 1.3515 (USD 410m) 1.3625 (450m) 1.3650 (85m)
EURJPY 120.00 (EUR 942m) 121.00 (586m)
-
07:23
Swiss retail sales up 2.1% in March
Turnover in the retail sector rose by 1.8% in nominal terms in March 2017 compared with the previous year. This is the sharpest increase since June 2014. Seasonally adjusted, nominal turnover rose by 0.6% compared with the previous month. These are provisional findings from the Federal Statistical Office (FSO).
Real turnover in the retail sector also adjusted for sales days and holidays rose by 2.1% in March 2017 compared with the previous year. Real growth takes inflation into consideration. Compared with the previous month, real, seasonally adjusted retail trade turnover registered an increase of 0.7%.
-
07:16
Switzerland: Retail Sales (MoM), March 0.7%
-
07:15
Switzerland: Retail Sales Y/Y, March 2.1%
-
06:37
Preliminary estimates for April indicate that the Australian index of commodity prices decreased by 3.5%
Preliminary estimates for April indicate that the index decreased by 3.5 per cent (on a monthly average basis) in SDR terms, after decreasing by 1.7 per cent in March (revised). A decline in the iron ore price more than offset an increase in the coking coal price. Both the rural and base metals subindices decreased slightly in the month. In Australian dollar terms, the index decreased by 2.0 per cent in April.
Over the past year, the index has increased by 38.6 per cent in SDR terms, led by higher coking coal and iron ore prices. The index has increased by 36.1 per cent in Australian dollar terms.
Consistent with previous releases, preliminary estimates for iron ore, coking coal, thermal coal and LNG export prices are being used for the most recent months, based on market information. Using spot prices for the bulk commodities, the index rose by 3.4 per cent in April in SDR terms, to be 43.5 per cent higher over the past year.
-
06:35
Fitch says "unresolved conflict in eastern Ukraine remains a risk for overall macroeconomic performance and stability"
-
Stable outlook reflects Fitch's assessment that upside and downside risks to rating are currently balanced
-
Ukraine's ratings balance weak external liquidity, high public debt burden and structural weaknesses
-
-
06:33
Fitch assumes Ukraine's debt dispute with Russia will not impair Ukraine's ability to access external financing and meet external debt service commitments
-
06:32
U.S congressional negotiators reach deal to fund government through september, according to congressional aides - Washington Post
-
06:31
Australian manufacturing continued its recent recovery in April
Australian manufacturing continued its recent recovery in April with the Australian Industry Group Australian Performance of Manufacturing Index climbing 1.7 points to 59.2 points (results above 50 indicate expansion with the distance from 50 points indicating the strength of expansion). This was the seventh consecutive month of expansion for the Australian PMI and the strongest monthly result since February 2017 and before that, since May 2002.
All seven activity sub-indexes in the Australian PMI expanded in April. New orders remained elevated (61.5 points) while sales surged higher (65.5 points), as did production (60.7 points), exports (58.6 points) and employment (55.9 points). Inventories eased to a more modest rate of expansion (51.2 points) in April.
-
06:12
April’s survey of Japanese manufacturers indicated a further improvement in business conditions - Markit
April's survey of Japanese manufacturers indicated a further improvement in business conditions, as output, new orders and employment all continued to rise. Export sales strengthened amid reports of higher demand, while purchasing activity was raised to the greatest degree since the start of 2016.
Subsequent pressure on suppliers meant that delivery times lengthened markedly, exacerbated by stock shortages at vendors. Prices for inputs rose sharply and output charges were raised to the greatest degree for nearly two-and-a-half years.
The headline Japan Manufacturing Purchasing Managers' Index - a composite singlefigure indicator of manufacturing performance - edged higher to a level of 52.7 during April (from 52.4 in March). Posting above the 50.0 no-change mark for an eighth successive month, the index was at a level amongst the best seen in the past three years.
-
05:05
Options levels on monday, May 1, 2017
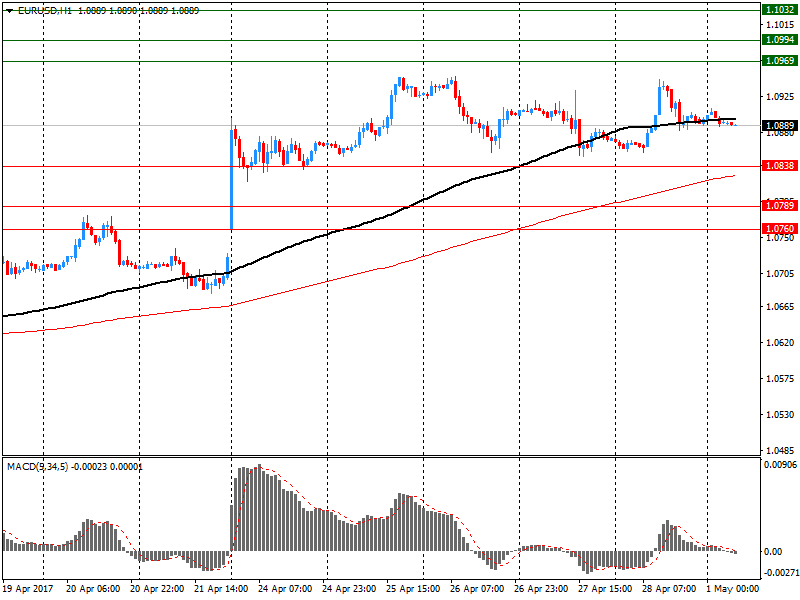
EUR/USD
Resistance levels (open interest**, contracts)
$1.1032 (3160)
$1.0994 (4209)
$1.0969 (4186)
Price at time of writing this review: $1.0889
Support levels (open interest**, contracts):
$1.0838 (1095)
$1.0789 (1387)
$1.0760 (1267)
Comments:
- Overall open interest on the CALL options with the expiration date June, 9 is 72717 contracts, with the maximum number of contracts with strike price $1,1100 (7169);
- Overall open interest on the PUT options with the expiration date June, 9 is 75150 contracts, with the maximum number of contracts with strike price $1,0200 (5273);
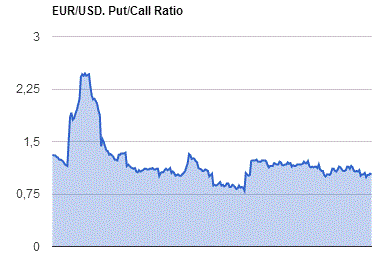
- The ratio of PUT/CALL was 1.03 versus 1.04 from the previous trading day according to data from April, 28

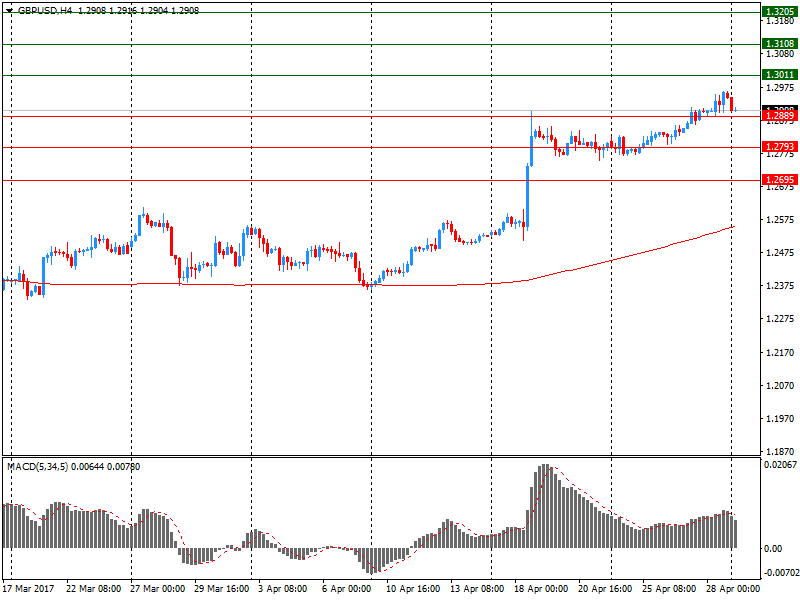
GBP/USD
Resistance levels (open interest**, contracts)
$1.3205 (1664)
$1.3108 (2095)
$1.3012 (2573)
Price at time of writing this review: $1.2908
Support levels (open interest**, contracts):
$1.2889 (166)
$1.2793 (1141)
$1.2695 (863)
Comments:
- Overall open interest on the CALL options with the expiration date June, 9 is 24891 contracts, with the maximum number of contracts with strike price $1,3000 (2573);
- Overall open interest on the PUT options with the expiration date June, 9 is 28727 contracts, with the maximum number of contracts with strike price $1,2500 (5035);
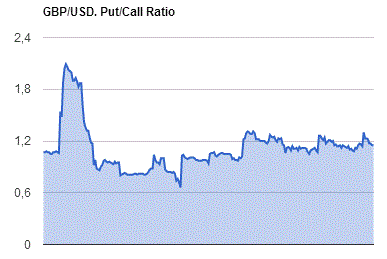
- The ratio of PUT/CALL was 1.15 versus 1.15 from the previous trading day according to data from April, 28

* - The Chicago Mercantile Exchange bulletin (CME) is used for the calculation.
** - Open interest takes into account the total number of option contracts that are open at the moment.
-
01:16
Australia: MI Inflation Gauge, m/m, April 0.5%
-
00:30
Japan: Manufacturing PMI, April 52.7 (forecast 52.8)
-

