Market news
-
22:57
Currencies. Daily history for May 11’2017:
(pare/closed(GMT +2)/change, %)
EUR/USD $1,0861 -0,06%
GBP/USD $1,2887 -0,36%
USD/CHF Chf1,0077 -0,08%
USD/JPY Y113,82 -0,40%
EUR/JPY Y123,62 -0,46%
GBP/JPY Y146,66 -0,76%
AUD/USD $0,7377 +0,60%
NZD/USD $0,6844 -0,06%
USD/CAD C$1,3697 +0,22%
-
22:30
New Zealand: Business NZ PMI, April 56.8
-
21:58
Schedule for today, Friday, May 12’2017 (GMT0)
06:00 Germany CPI, y/y (Finally) April 1.6% 2%
06:00 Germany CPI, m/m (Finally) April 0.2% 0%
06:00 Germany GDP (QoQ) (Preliminary) Quarter I 0.4% 0.7%
06:00 Germany GDP (YoY) (Preliminary) Quarter I 1.2% 1.7%
06:45 France Non-Farm Payrolls (Preliminary) Quarter I 0.4% 0.2%
09:00 Eurozone Industrial production, (MoM) March -0.3% 0.3%
09:00 Eurozone Industrial Production (YoY) March 1.2% 2.3%
12:00 Eurozone ECB's Vitor Constancio Speaks
12:30 U.S. Retail Sales YoY April 5.2%
12:30 U.S. Retail sales April -0.2% 0.6%
12:30 U.S. Retail sales excluding auto April 0% 0.5%
12:30 U.S. CPI excluding food and energy, m/m April -0.1% 0.2%
12:30 U.S. CPI, Y/Y April 2.4% 2.3%
12:30 U.S. CPI excluding food and energy, Y/Y April 2% 2%
12:30 U.S. CPI, m/m April -0.3% 0.2%
13:00 U.S. FOMC Member Charles Evans Speaks
14:00 U.S. Business inventories March 0.3% 0.1%
14:00 U.S. Reuters/Michigan Consumer Sentiment Index (Preliminary) May 97 97
16:30 U.S. FOMC Member Harker Speaks
17:00 U.S. Baker Hughes Oil Rig Count May 703
-
14:28
North Korea preaparing for first ICBM flight test this year
-
14:20
Fed says it plans one test operation in May of its term deposit facility (TDF) and a similar operation each quarter of 2017
-
Will hold floating-rate tdf operation on May 18; maximum tender per institution will be $1 billion
-
-
13:51
Option expiries for today's 10:00 ET NY cut
EURUSD: 1.0750 (EUR 517m) 1.0800 (410m) 1.0875-85 ( EUR 847m) 1.0900 (1.3bln) 1.0925-30 (913m) 1.1000 (1.575bln) 1.1040-50 (2bln)
USDJPY: 112.50 (USD 1.2bln) 113.50-60 (521m) 114.00 (1.3bln) 115.00 (267m) 115.20 (300m)
GBPUSD: 1.3000 (GBP 513m)
EURJPY: 126.00 (EUR 660m)
AUDUSD: 0.7400-10 (AUD 1.3bln) 0.7450-60 (540m) 0.7500 (306m)
NZDUSD: 0.6905 (187m) 0.6940-50 (396m)
-
13:49
Hungary PM orban's chief of staff Lazar says will consider using other financing sources each time payments for paks nuclear project are due in the future
-
13:19
BoE's Carney says volatility is quite low in financial markets, but closer to historic averages in sterling markets
-
13:17
U.S. Tips inflation breakeven rates add gains after U.S weekly jobless claims, April producer price data
-
12:37
US unemployment claims continue to decline
In the week ending May 6, the advance figure for seasonally adjusted initial claims was 236,000, a decrease of 2,000 from the previous week's unrevised level of 238,000. The 4-week moving average was 243,500, an increase of 500 from the previous week's unrevised average of 243,000.
-
12:36
Canadian new house prices were up in 10 of the 27 metropolitan areas surveyed
The New Housing Price Index (NHPI) rose 0.2% in March compared with the previous month. Higher new house prices in Vancouver and Toronto led the gain.
New house prices were up in 10 of the 27 metropolitan areas surveyed, with the largest increases in Oshawa (+1.1%) and Guelph (+0.9%). In Oshawa, builders cited higher construction costs and improving market conditions as reasons for the gain. Builders in Guelph linked higher new house prices to improving market conditions and a shortage of developed land.
Vancouver was the top contributor to the national gain, with prices up 0.7%. Builders reported market conditions as the main source of the rise. This was the first price increase in five months and the largest since May 2016.
-
12:35
US producer price index rose more than expected in April
The Producer Price Index for final demand advanced 0.5 percent in April, seasonally adjusted, the U.S. Bureau of Labor Statistics reported today. Final demand prices edged down 0.1 percent in March and climbed 0.3 percent in February. On an unadjusted basis, the final
demand index rose 2.5 percent for the 12 months ended April 2017, the largest increase since moving up 2.8 percent for the 12 months ended February 2012.
In April, almost two-thirds of the advance in the final demand index is attributable to prices for final demand services, which moved up 0.4 percent. The index for final demand goods climbed 0.5 percent.
Prices for final demand less foods, energy, and trade services increased 0.7 percent in April. For the 12 months ended in April, the index for final demand less foods, energy, and trade services climbed 2.1 percent.
-
12:30
Canada: New Housing Price Index, MoM, March 0.2% (forecast 0.3%)
-
12:30
U.S.: PPI excluding food and energy, Y/Y, April 1.9% (forecast 1.7%)
-
12:30
U.S.: PPI, m/m, April 0.5% (forecast 0.2%)
-
12:30
U.S.: Initial Jobless Claims, 236 (forecast 245)
-
12:30
U.S.: PPI excluding food and energy, m/m, April 0.4% (forecast 0.2%)
-
12:30
U.S.: PPI, y/y, April 2.5% (forecast 2.2%)
-
12:30
U.S.: Continuing Jobless Claims, 1918 (forecast 1980)
-
12:16
United Kingdom: NIESR GDP Estimate, April 0.2%
-
12:09
Ecb's Constancio says loose for longer is less risky than premature withdrawal of stimulus
-
12:00
Orders
EUR/USD
Offers: 1.0900 1.0920-30 1.0950 1.0985 1.1000 1.1030 1.1050
Bids: 1.0865 1.0850 1.0820 1 .0800 1.0780 1.0750 1.0700
GBP/USD
Offers: 1.2950 1.2965 1.2980-85 1.3000 1.3020 1.3050 1.3080 1.3100
Bids: 1.2930 1.2900 1.2880 1.2850 1.2830 1.2800 1.2785 1.2750 1.2700
EUR/JPY
Offers: 124.50 124.80 125.00 125.20 125.50
Bids: 124.00 123.80 123.50 123.20 123.00
EUR/GBP
Offers: 0.8420-25 0.8450 0.8465 0.8480-85 0.8500
Bids: 0.8400 0.8380-85 0.8365 0.8350 0.8330 0.8300
USD/JPY
Offers: 114.35 114.50 114.70 115.00 115.20 115.50
Bids: 114.00 113.80 113.60 113.20 113.00 112.80 112.45-50
AUD/USD
Offers: 0.7385 0.7400 0.7425 0.7550-55 0.7480 0.7500
Bids: 0.7350 0.7330-35 0.7320 0.7300 0.7285 0.7250 0.7200
-
11:47
BoE's Carney says projected inflation overshoot entirely reflects effects of sterling's fall since nov 2015
-
Sterling has appreciated, possibly reflecting market expectations of a more orderly brexit
-
Sterling depreciation caused by market expectations of material adjustment to UK's medium-term prospects as it leaves EU
-
MPC judges that monetary policy could need to be tightened by somewhat greater extent than very gentle path implied by markets in may forecasts
-
Monetary policy will respond in either direction to changes in economic outlook
-
While brexit will play important role, other factors will influence uk economic outlook
-
Economy is still growing solidly
-
This is going to be a more challenging time for UK households
-
-
11:10
OPEC raises 2017 non-opec oil supply growth forecast to 950,000 bpd (prev. Forecast 580,000 bpd rise) on higher U.S shale forecast – OPEC monthly report
-
Leaves 2017 world oil demand growth forecast unchanged at 1.27 million bpd
-
OPEC, citing secondary sources, says its april oil outputfalls 18,000 bpd month/month to 31.732 million bpd as group implements supply cut deal for fourth month
-
Saudi Arabia tells opec it raised oil output in april to 9.946 million bpd from 9.90 million bpd in march, still below its opec target
-
OPEC's 11 members with supply targets cut output to 29.674 million bpd in april, below 29.804 mbpd target - Reuters calculation based on OPEC data
-
-
11:07
Sterling falls half a cent, hits one-week low of $1.2870
-
11:06
BoE forecast shows inflation to peak at 2.82 pct in q4 2017 (feb peak forecast 2.75 pct in q2 2018), based on market interest rates
-
Market interest rate assumption based shows first rate hike fully priced in for q4 2019 (feb forecast q1 2019)
-
Shows inflation in two years' time at 2.20 pct (feb forecast 2.56 pct), based on market interest rates
-
Expects q2 gdp growth of +0.4 pct qq, expects q1 gdp growth to be revised up to +0.4 pct from +0.3 pct
-
"Some" MPC members would need relatively little upside news on growth or inflation to consider voting for tighter policy
-
Policy outlook depends on weak pound boosting cpi but not longer-term inflation expectations, modest pay growth near-term to pick up significantly
-
Consumption to recover once wages pick up, in short-term will be offset by better net trade and investment
-
-
11:05
Interest rates may need to rise by "somewhat greater extent" than implied by markets in May forecasts, says Bank of England
-
11:03
The Bank of England’s Monetary Policy Committee voted by a majority of 7-1 to maintain Bank Rate at 0.25%
The Bank of England's Monetary Policy Committee (MPC) sets monetary policy to meet the 2% inflation target, and in a way that helps to sustain growth and employment. At its meeting ending on 10 May 2017, the Committee voted by a majority of 7-1 to maintain Bank Rate at 0.25%. The Committee voted unanimously to maintain the stock of sterling non-financial investment-grade corporate bond purchases, financed by the issuance of central bank reserves, at £10 billion. The Committee also voted unanimously to maintain the stock of UK government bond purchases, financed by the issuance of central bank reserves, at £435 billion.
As the MPC observed at the time of the United Kingdom's referendum on EU membership, the appropriate path for monetary policy depends on the evolution of demand, potential supply, the exchange rate, and therefore inflation. Aggregate demand slowed markedly in 2017 Q1, and the MPC's central projection contained in the May Inflation Report is now for quarterly growth to remain around current rates, and close to trend. The slowdown appears to be concentrated in consumer-facing sectors, partly reflecting the impact of sterling's past depreciation on household income and spending. The Committee judges that consumption growth will be slower in the near term than previously anticipated before recovering in the latter part of the forecast period as real income picks up.
-
11:00
United Kingdom: BoE Interest Rate Decision, 0.25% (forecast 0.25%)
-
11:00
United Kingdom: Asset Purchase Facility, 435 (forecast 435)
-
10:58
Fed’s Dudley: Calls Trade Protectionism A 'Dead End', Is Destructive To US Economy - Reuters
-
09:36
Britain's defence secretary Fallon dismisses Times newspaper report of deteriorating relationship between PM May and chancellor Hammond as tittle-tattle - BBC radio
-
09:22
Norway's finance minister says weak crown currency and lower wage growth have markedly improved Norway's competitiveness
-
08:34
UK trade deficit widened more than expected
Between Quarter 4 (Oct to Dec) 2016 and Quarter 1 (Jan to March) 2017, the total trade deficit (goods and services) widened by £5.7 billion to £10.5 billion; this followed a sharp narrowing in Quarter 4 2016.
The UK's total trade deficit (goods and services) widened by £2.3 billion between February and March 2017 to £4.9 billion, contributing nearly half of the quarterly deficit.
At the commodity level, the main causes of the widening of the deficit in Quarter 1 2017 were increased imports of machinery and transport equipment (mainly mechanical machinery and cars), oil and chemicals; these commodities also contributed the most to the increase in imports in March 2017.
Total imports increased by £2.9 billion between February and March 2017, with an increase in imports of goods from both EU and non-EU countries.
Since the last UK trade release, the trade balance for February 2017 has revised up by £1.0 billion; this is mainly due to a downward revision to the imports of goods.
-
08:32
UK manufacturing production down 0.6% in March
The Index of Production for Quarter 1 (Jan to Mar) 2017 was estimated to have increased by 0.1%. Increases of 0.3% in manufacturing and 1.8% in mining and quarrying were offset by a fall of 4.3% in energy supply.
In March 2017, total production decreased by 0.5% compared with February 2017, due to falls of 4.2% in energy supply and 0.6% in manufacturing.
Basic metals and metal products provided the largest downward pressure on manufacturing in March 2017, while warmer-than-average temperatures led to a decrease in energy supply.
Total production output for March 2017 compared with March 2016 increased by 1.4%, with growth in three of the four main sectors, with manufacturing providing the largest contribution, increasing by 2.3%.
-
08:30
United Kingdom: Industrial Production (MoM), March -0.5% (forecast -0.2%)
-
08:30
United Kingdom: Total Trade Balance, March -4.90
-
08:30
United Kingdom: Industrial Production (YoY), March 1.4% (forecast 2.1%)
-
08:30
United Kingdom: Manufacturing Production (MoM) , March -0.6% (forecast 0%)
-
08:30
United Kingdom: Manufacturing Production (YoY), March 2.3% (forecast 3.1%)
-
08:29
Eu Commission raises forecast of euro zone gdp growth to 1.7 pct for 2017 (from 1.6 pct), leaves it unchanged at 1.8 pct for 2018
-
Forecasts german gdp growth at 1.6 pct for 2017 (previously 1.6 pct), 1.9 pct for 2018 (prv 1.8 pct)
-
Confirms forecast of french gdp growth at 1.4 pct for 2017, 1.7 pct for 2018
-
Eu gdp growth at 1.9 pct for 2017, 1.9 pct for 2018
-
Confirms forecast of italian gdp growth at 0.9 pct for 2017, 1.1 pct for 2018
-
Cuts greek gdp growth forecast to 2.1 pct for 2017 (from 2.7 pct), to 2.5 pct for 2018 (pvs 3.1 pct)
-
Revises up spanish gdp growth forecast to 2.8 pct for 2017 (from 2.3 pct), to 2.4 pct for 2018 (pvs 2.1 pct)
-
Revises up forecast of Portugal gdp growth to 1.8 pct for 2017 (from 1.6 pct), to 1.6 pct for 2018 (pvs 1.5 pct)
-
-
08:03
Forex option contracts rolling off today at 14.00 GMT:
EURUSD: 1.0750 (EUR 517m) 1.0800 (410m) 1.0875-85 ( EUR 847m) 1.0900 (1.3bln) 1.0925-30 (913m) 1.1000 (1.575bln) 1.1040-50 (2bln)
USDJPY: 112.50 (USD 1.2bln) 113.50-60 (521m) 114.00 (1.3bln) 115.00 (267m) 115.20 (300m)
GBPUSD: 1.3000 (GBP 513m)
EURJPY: 126.00 (EUR 660m)
AUDUSD: 0.7400-10 (AUD 1.3bln) 0.7450-60 (540m) 0.7500 (306m)
NZDUSD: 0.6905 (187m) 0.6940-50 (396m)
-
07:20
Swiss CPI rose less than expected in April
The consumer price index (IPC) increased by 0.2% in April 2017 compared with the previous month, reaching 100.9 points (December 2015=100). Inflation was 0.4% compared with the same month the previous year. These are the results of the Federal Statistical Office (FSO).
-
07:15
Switzerland: Consumer Price Index (YoY), April 0.4% (forecast 0.5%)
-
07:15
Switzerland: Consumer Price Index (MoM) , April 0.2% (forecast 0.2%)
-
06:32
Kiwi hits 11-month low as RBNZ stands pat, dollar touches 8-week peak against yen, sterling consolidates ahead of BoE policy meeting. Bank of England expected to hold the interest rate at 0.25%
-
06:29
China willing to strengthen communication on IP issues with the U.S. to create better legal environment for bilateral trade - Commerce Ministry
-
China seriously concerned by U.S. inclusion of China on IP watch list
-
China urges U.S. to fulfill promises to evaluate china's efforts on IP protection fairly and objectively
-
-
06:27
Moody's dowgraded 6 Canadian banks and their affiliates
Moody's Investors Service has today downgraded the Baseline Credit Assessments (BCAs), the long-term ratings and the Counterparty Risk Assessments (CRAs) of six Canadian banks and their affiliates, reflecting Moody's expectation of a more challenging operating environment for banks in Canada for the remainder of 2017 and beyond, that could lead to a deterioration in the banks' asset quality, and increase their sensitivity to external shocks.
The banks affected are: Toronto-Dominion Bank, Bank of Montreal, Bank of Nova Scotia, Canadian Imperial Bank of Commerce, National Bank of Canada, and Royal Bank of Canada.
The BCAs, long-term debt and deposit ratings and CRAs of the banks and their affiliates were downgraded by 1 notch, excepting only Toronto-Dominion Bank's CRA, which was affirmed. The short term Prime-1 ratings of the Canadian banks were affirmed. All relevant ratings for these banks continue to have negative outlooks, reflecting the expected introduction of an operational resolution regime in Canada.
-
06:24
German selling prices in wholesale trade increased by 4.7% in April
As reported by the Federal Statistical Office (Destatis), the selling prices in wholesale trade increased by 4.7% in April 2017 from the corresponding month of the preceding year. In March 2017 and in February 2017 the annual rates of change were +4.7% and +5.0%, respectively.
From March 2017 to April 2017 the index rose by 0.3%.
-
06:20
Options levels on thursday, May 11, 2017
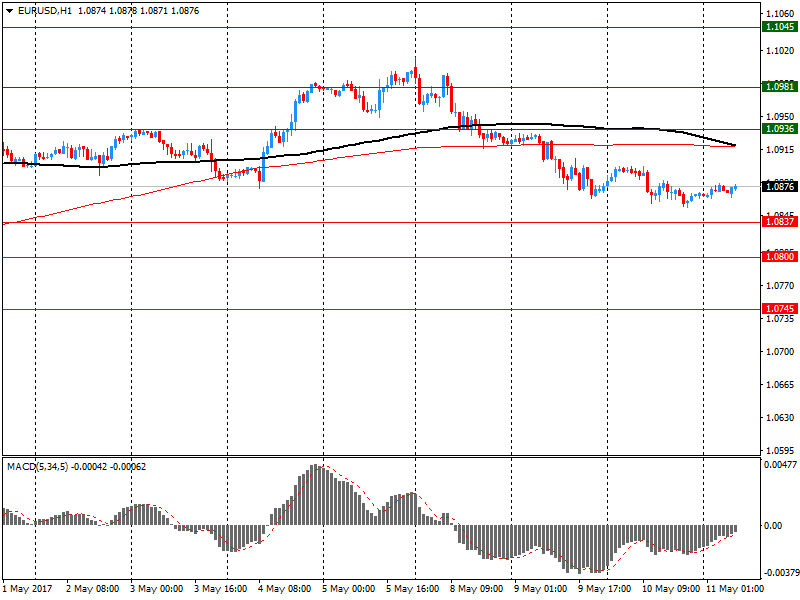
EUR/USD
Resistance levels (open interest**, contracts)
$1.1045 (7782)
$1.0981 (4069)
$1.0936 (3570)
Price at time of writing this review: $1.0876
Support levels (open interest**, contracts):
$1.0837 (1785)
$1.0800 (3915)
$1.0745 (4783)
Comments:
- Overall open interest on the CALL options with the expiration date June, 9 is 82896 contracts, with the maximum number of contracts with strike price $1,1000 (7782);
- Overall open interest on the PUT options with the expiration date June, 9 is 88861 contracts, with the maximum number of contracts with strike price $1,0700 (6019);
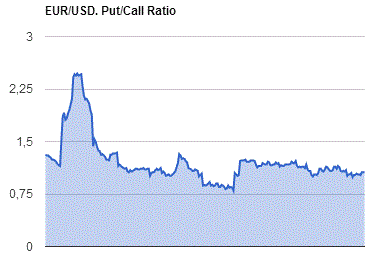
- The ratio of PUT/CALL was 1.07 versus 1.06 from the previous trading day according to data from May, 10

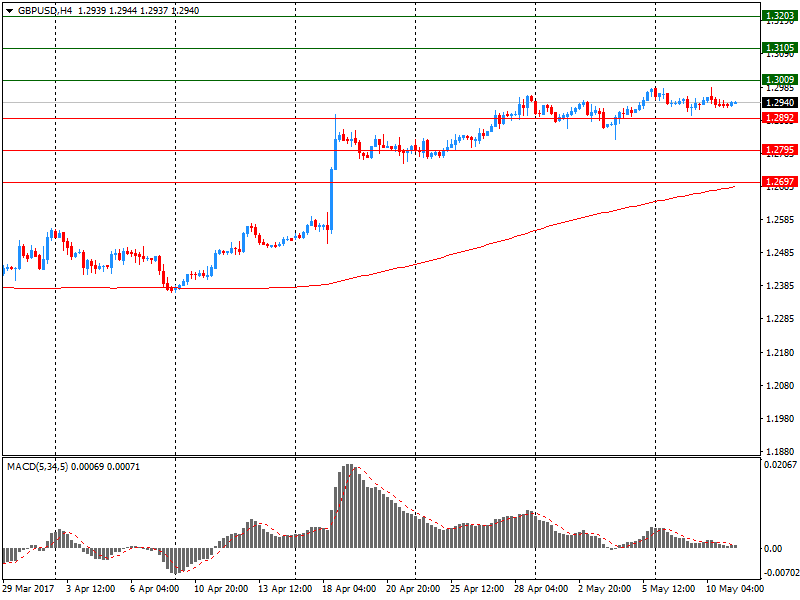
GBP/USD
Resistance levels (open interest**, contracts)
$1.3203 (2165)
$1.3105 (2465)
$1.3009 (3600)
Price at time of writing this review: $1.2940
Support levels (open interest**, contracts):
$1.2892 (1265)
$1.2795 (1947)
$1.2697 (1893)
Comments:
- Overall open interest on the CALL options with the expiration date June, 9 is 32028 contracts, with the maximum number of contracts with strike price $1,3000 (3600);
- Overall open interest on the PUT options with the expiration date June, 9 is 34712 contracts, with the maximum number of contracts with strike price $1,1500 (2795);
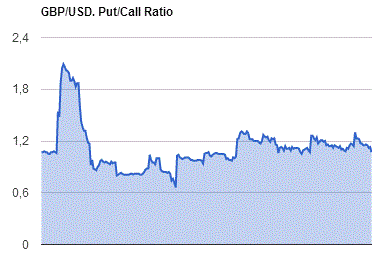
- The ratio of PUT/CALL was 1.08 versus 1.08 from the previous trading day according to data from May, 10

* - The Chicago Mercantile Exchange bulletin (CME) is used for the calculation.
** - Open interest takes into account the total number of option contracts that are open at the moment.
-
06:19
The Reserve Bank of New Zealand left the Official Cash Rate (OCR) unchanged at 1.75 percent. NZD/USD down 120 pips on a dowish statament
"Statement by Reserve Bank Governor Graeme Wheeler:
The Reserve Bank today left the Official Cash Rate (OCR) unchanged at 1.75 percent.
Global economic growth has increased and become more broad-based over recent months. However, major challenges remain with on-going surplus capacity and extensive political uncertainty.
Stronger global demand has helped to raise commodity prices over the past year, which has led to some increase in headline inflation across New Zealand's trading partners. However, the level of core inflation has generally remained low. Monetary policy is expected to remain stimulatory in the advanced economies, but less so going forward.
The trade-weighted exchange rate has fallen by around 5 percent since February, partly in response to global developments and reduced interest rate differentials. This is encouraging and, if sustained, will help to rebalance the growth outlook towards the tradables sector.
GDP growth in the second half of 2016 was weaker than expected. Nevertheless, the growth outlook remains positive, supported by on-going accommodative monetary policy, strong population growth, and high levels of household spending and construction activity.
House price inflation has moderated further, especially in Auckland. The slowing in house price inflation partly reflects loan-to-value ratio restrictions and tighter lending conditions. This moderation is projected to continue, although there is a risk of resurgence given the continuing imbalance between supply and demand".
-
05:16
Japan: Eco Watchers Survey: Outlook, March 48.8
-
05:16
Japan: Eco Watchers Survey: Current , April 48.1 (forecast 47.9)
-

