Market news
-
22:26
Currencies. Daily history for Oct 25’2017:
(pare/closed(GMT +3)/change, %)
EUR/USD $1,1815 +0,44%
GBP/USD $1,3262 +1,01%
USD/CHF Chf0,98925 -0,16%
USD/JPY Y113,67 -0,21%
EUR/JPY Y134,31 +0,23%
GBP/JPY Y150,765 +0,81%
AUD/USD $0,7703 -0,91%
NZD/USD $0,6888 -0,14%
USD/CAD C$1,27856 +0,86%
-
22:04
Schedule for today, Thursday, Oct 26’2017 (GMT0)
00:45 New Zealand Trade Balance, mln September -1179 Revised From -1235 -900 -1143
03:30 Australia Export Price Index, q/q Quarter III -5.7% -6.3%
03:30 Australia Import Price Index, q/q Quarter III -0.1% -1.4%
09:00 Germany Gfk Consumer Confidence Survey November 10.8 10.8
11:00 Eurozone Private Loans, Y/Y September 2.7% 2.9%
11:00 Eurozone M3 money supply, adjusted y/y September 5.0% 5.0%
13:00 United Kingdom CBI retail sales volume balance October 42 15
14:45 Eurozone Deposit Facilty Rate -0.4% -0.4%
14:45 Eurozone ECB Interest Rate Decision 0% 0%
15:30 Eurozone ECB Press Conference
15:30 U.S. Goods Trade Balance, $ bln. September -62.94 -63.80
15:30 U.S. Continuing Jobless Claims 1888
15:30 U.S. Initial Jobless Claims 222 235
17:00 U.S. Pending Home Sales (MoM) September -2.6% 0.2%
17:30 U.S. FOMC Member Kashkari Speaks
-
21:45
New Zealand: Trade Balance, mln, September -1143 (forecast -900)
-
16:37
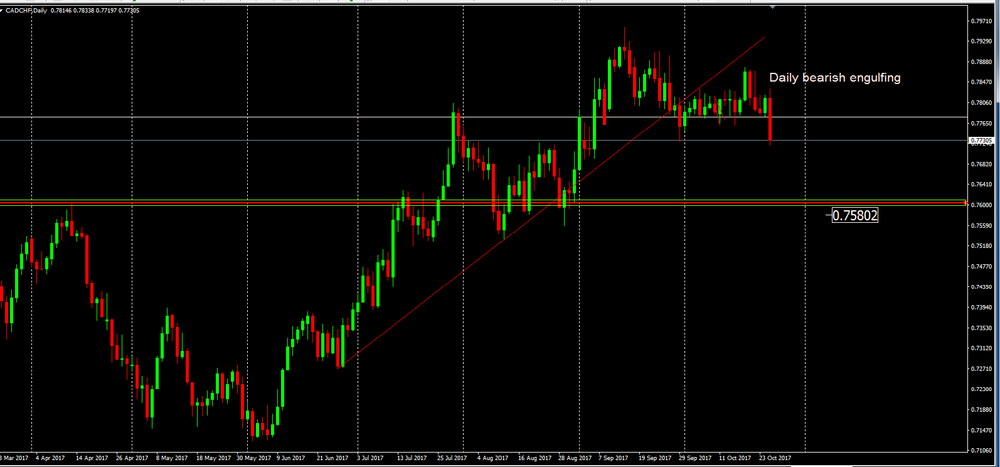
CAD/CHF DAILY CHART
As we can see no chart daily , the trend line that has been respected for several days has recently been broken.
However, and after the breakout or price ended by entering into consolidation.
If the daily candle close like this or similar, then we might have the confirmation of a pattern of candles ("Bearish Engulfing") in which it will give some indications of beginning of a new bearish tendency.
in a bearish scenario we might see the price going down until close to 0.7580.
-
14:32
U.S. commercial crude oil inventories increased by 0.9 million barrels from the previous week
U.S. commercial crude oil inventories (excluding those in the Strategic Petroleum Reserve) increased by 0.9 million barrels from the previous week. At 457.3 million barrels, U.S. crude oil inventories are in the upper half of the average range for this time of year.
Total motor gasoline inventories decreased 5.5 million barrels last week, but are in the upper half of the average range. Both finished gasoline inventories and blending components inventories decreased last week.
Distillate fuel inventories decreased by 5.2 million barrels last week and are in the lower half of the average range for this time of year. Propane/propylene inventories decreased by 1.2 million barrels last week and are in the lower half of the average range. Total commercial petroleum inventories decreased by 12.2 million barrels last week.
-
14:30
U.S.: Crude Oil Inventories, October 0.856 (forecast -2.578)
-
14:29
BoC: outlook subject to "substantial uncertainty" about geopolitical developments, NAFTA renegotiation
-
There could be room for more economic growth than projected without inflation rising materially above target
-
Canadian economy operating close to potential but wage and other data indicate there is still slack in the labor market
-
Effects of higher C$ on inflation expected to become stronger, with peak impact of -0.5 percentage points in q2 2018
-
Export growth seen slower than previously due to stronger c$; still expected to make solid contribution to gdp growth
-
High debt levels mean household spending likely more sensitive to interest rates than in the past
-
Lowers q3 growth forecast to 1.8 from 2.0 pct, sees 2.5 pct growth in q4; raises 2017 growth forecast to 3.1 pct from 2.8 pct, 2018 to 2.1 pct from 2.0 pct
-
-
14:15
US new home sales rose more than expected in September
Sales of new single-family houses in September 2017 were at a seasonally adjusted annual rate of 667,000, according to estimates released jointly today by the U.S. Census Bureau and the Department of Housing and Urban Development. This is 18.9 percent above the revised August rate of 561,000 and is 17.0 percent above the September 2016 estimate of 570,000.
The median sales price of new houses sold in September 2017 was $319,700. The average sales price was $385,200.
-
14:13
The Bank of Canada maintained its target for the overnight rate at 1 per cent
"The Bank of Canada today maintained its target for the overnight rate at 1 per cent. The Bank Rate is correspondingly 1 1/4 per cent and the deposit rate is 3/4 per cent.
Inflation has picked up in recent months, as anticipated in the Bank's July Monetary Policy Report (MPR), reflecting stronger economic activity and higher gasoline prices. Measures of core inflation have edged up, in line with a narrowing output gap and the diminishing effects of lower food prices. The Bank projects inflation will rise to 2 per cent in the second half of 2018. This is a little later than anticipated in July because of the recent strength in the Canadian dollar. The Bank is also mindful that global structural factors could be weighing on inflation in Canada and other advanced economies.
The global and Canadian economies are progressing as outlined in the July MPR. Economic activity continues to strengthen and broaden across countries. The Bank still expects global growth to average around 3 1/2 per cent over 2017-19. However, this outlook remains subject to substantial uncertainty about geopolitical developments and fiscal and trade policies, notably the renegotiation of the North American Free Trade Agreement".
-
14:00
U.S.: New Home Sales, September 667 (forecast 0.555)
-
14:00
Canada: Bank of Canada Rate, 1.00% (forecast 1%)
-
13:46
Forex option contracts rolling off today at 14.00 GMT:
EURUSD: 1.1600 (EUR 410m) 1.1700 (765m) 1.1720-25 (510m) 1.1750 (800m) 1.1800 (545m) 1.1850 (740m)
USDJPY:113.00 (USD 550m) 113.25 (695m) 113.50-55 (465m) 114.00 (2.2bln) 114.60 (130m)
GBPUSD: 1.3100 ( GBP 300m) 1.3185 (230m) 1.3250 (150m)
EURGBP: 0.8875 (830m)
USDCAD: 1.2700 (USD 700m)
AUDUSD: 0.7760 (AUD 260m) 0.7800 (435m) 0.7825 (540m)
NZDUSD: 0.7000 (720m)
-
13:30
U.S. house prices rose in August, up 0.7 percent from the previous month
U.S. house prices rose in August, up 0.7 percent from the previous month, according to the Federal Housing Finance Agency (FHFA) seasonally adjusted monthly House Price Index (HPI). The previously reported 0.2 percent increase in July was revised upward to 0.4 percent. The FHFA monthly HPI is calculated using home sales price information from mortgages sold to, or guaranteed by, Fannie Mae and Freddie Mac.
From August 2016 to August 2017, house prices were up 6.6 percent. For the nine census divisions, seasonally adjusted monthly price changes from July 2017 to August 2017 ranged from -0.1 percent in the New England division to +1.4 percent in the Pacific division. The 12-month changes were all positive, ranging from +5.0 percent in the Middle Atlantic division to +9.3 percent in the Pacific division.
-
13:01
U.S.: Housing Price Index, m/m, August 0.7% (forecast 0.4%)
-
12:33
US durable goods orders rose more than expected in September
New orders for manufactured durable goods in September increased $5.1 billion or 2.2 percent to $238.7 billion, the U.S. Census Bureau announced today. This increase, up three of the last four months, followed a 2.0 percent August increase. Excluding transportation, new orders increased 0.7 percent. Excluding defense, new orders increased 2.0 percent. Transportation equipment, also up three of the last four months, led the increase, $4.0 billion or 5.1 percent to $81.2 billion.
Shipments of manufactured durable goods in September, up four of the last five months, increased $2.4 billion or 1.0 percent to $240.5 billion. This followed a 0.7 percent August increase. Transportation equipment, up two of the last three months, led the increase, $1.1 billion or 1.4 percent to $79.7 billion.
-
12:30
U.S.: Durable Goods Orders ex Transportation , September 0.7% (forecast 0.5%)
-
12:30
U.S.: Durable goods orders ex defense, September 2.0%
-
12:30
U.S.: Durable Goods Orders , September 2.2% (forecast 1.0%)
-
10:55
UK's Brexit minister Davis says my hunch is EU withdrawal agreement will come at same time as agreement on forward trade relationship
-
10:02
UK five-year gilt yields rise to highest since june 2016 Brexit vote at 0.852 pct, up 5 bps on day, as gilt prices slide after Q3 GDP data
-
09:24
UK Brexit Sec. Davis: in total no deal scenario, Britain may not pay any money to the EU after it leaves @livesquawk
-
09:23
Brexit minister David Davis says what we're looking for after Brexit is tariff-free access to single market for goods and as much as possible tariff-free access for services
-
09:01
UK services output increased by 0.4% compared with the three months ending May
In the three months to August 2017, services output increased by 0.4% compared with the three months ending May 2017.
Computer programming and retail trade made the largest contributions to the three-month on three-month growth; contributing 0.10 and 0.08 respectively.
The Index of Services increased by 0.2% between July and August 2017.
The largest contribution to the month-on-month increase came from the business services and finance sector, which contributed 0.12 percentage points.
Retail trade and motion pictures made the largest contributions at industry level to the month-on-month increase, with both contributing 0.06 percentage points.
In the three months to August 2017, services output increased by 1.7% compared with the three months ending August 2016.
-
08:34
UK GDP rose more than expected in Q3. GBP/USD up 50 pips after the news
UK gross domestic product (GDP) was estimated to have increased by 0.4% in Quarter 3 (July to Sept) 2017, a similar rate of growth to the previous two quarters.
Services increased by 0.4%, the same rate as Quarter 2 (Apr to June) 2017 and remains the largest contributor to GDP growth, with a strong performance in computer programming, motor trades and retail trade.
Manufacturing returned to growth after a weak Quarter 2 2017, increasing by 1.0% in Quarter 3 2017.
Construction has contracted for the second quarter in a row, although the industry still remains well above its pre-downturn peak.
GDP per head was estimated to have increased by 0.3% during Quarter 3 2017.
-
08:30
United Kingdom: GDP, y/y, Quarter III 1.5% (forecast 1.4%)
-
08:30
United Kingdom: GDP, q/q, Quarter III 0.4% (forecast 0.3%)
-
08:30
United Kingdom: BBA Mortgage Approvals, September 41.584 (forecast 41.800)
-
08:00
Germany: IFO - Expectations , October 109.1 (forecast 107.3)
-
08:00
Germany: IFO - Current Assessment , October 124.8 (forecast 123.5)
-
08:00
Germany: IFO - Business Climate, October 116.7 (forecast 115.2)
-
07:50
Spain's PM says application of article 155 aims to avoid further economic consequences of catalan independence push
-
07:37
Major exchanges in Europe trading in the red zone: FTSE 7512.84 -13.70 -0.18%, DAX 12994.57 -18.62 -0.14%, CAC 5385.56 -9.24 -0.17%
-
06:49
Options levels on wednesday, October 25, 2017
EUR/USD
Resistance levels (open interest**, contracts)
$1.1890 (3367)
$1.1831 (1321)
$1.1796 (406)
Price at time of writing this review: $1.1760
Support levels (open interest**, contracts):
$1.1715 (2963)
$1.1691 (3000)
$1.1662 (4926)
Comments:
- Overall open interest on the CALL options and PUT options with the expiration date November, 3 is 101590 contracts (according to data from October, 24) with the maximum number of contracts with strike price $1,2000 (6678);
GBP/USD
Resistance levels (open interest**, contracts)
$1.3259 (3869)
$1.3211 (2382)
$1.3168 (1050)
Price at time of writing this review: $1.3117
Support levels (open interest**, contracts):
$1.3075 (2295)
$1.3046 (1698)
$1.3012 (2034)
Comments:
- Overall open interest on the CALL options with the expiration date November, 3 is 40268 contracts, with the maximum number of contracts with strike price $1,3200 (3869);
- Overall open interest on the PUT options with the expiration date November, 3 is 35550 contracts, with the maximum number of contracts with strike price $1,3000 (3140);
- The ratio of PUT/CALL was 0.88 versus 0.89 from the previous trading day according to data from October, 24
* - The Chicago Mercantile Exchange bulletin (CME) is used for the calculation.
** - Open interest takes into account the total number of option contracts that are open at the moment.
-
06:44
Canada 2017 growth forecast 3.1 pct (vs 2.0 pct seen in march); 2018 growth forecast 2.1 pct (vs 2.0 pct seen in march) - Finance minister
-
2017-18 federal debt-to-gdp ratio at 30.6 pct vs 31.6 pct in march
-
Budget deficit expected to be CAD 18.6 bln compared to CAD 27.4 bln forecast in march; includes CAD 3 bln for risk adjustment
-
-
06:42
New Zealand's prime minister-designate Jacinda Ardern says Winston Peters to become foreign minister
-
06:34
U.S. 10-year treasury yield at 2.419 pct vs U.S. close of 2.406 pct on Tuesday
-
06:32
Australian CPI rose less than expected in Q3
The all groups CPI:
-
Rose 0.6% this quarter, compared with a rise of 0.2% in the june quarter 2017.
-
Rose 1.8% over the twelve months to the september quarter 2017, compared with a rise of 1.9% over the twelve months to the june quarter 2017.
Overview of cpi movements:
-
The most significant price rises this quarter are electricity (+8.9%), tobacco (+4.1%), international holiday travel and accommodation (+4.1%) and new dwelling purchase by owner-occupiers (+0.8%).
-
The most significant offsetting price falls this quarter are vegetables (-10.9%), automotive fuel (-2.3%) and telecommunication equipment and services (-1.5%).
-
-
06:00
Switzerland: UBS Consumption Indicator, September 1.56
-
00:30
Australia: Trimmed Mean CPI q/q, Quarter III 0.4% (forecast 0.5%)
-
00:30
Australia: CPI, q/q, Quarter III 0.6% (forecast 0.8%)
-
00:30
Australia: Trimmed Mean CPI y/y, Quarter III 1.8% (forecast 2.0%)
-
00:30
Australia: CPI, y/y, Quarter III 1.8% (forecast 2%)
-