Market news
-
23:52
Japan: Industrial Production (YoY), July 4.7%
-
23:50
Japan: Industrial Production (MoM) , July -0.8% (forecast -0.5%)
-
23:04
United Kingdom: Gfk Consumer Confidence, August -10 (forecast -13)
-
22:28
Currencies. Daily history for Aug 30’2017:
(pare/closed(GMT +3)/change, %)
EUR/USD $1,1892 -0,64%
GBP/USD $1,2923 +0,03%
USD/CHF Chf0,96222 +0,76%
USD/JPY Y110,22 +0,52%
EUR/JPY Y131,09 -0,11%
GBP/JPY Y142,445 +0,55%
AUD/USD $0,7903 -0,57%
NZD/USD $0,7201 -0,67%
USD/CAD C$1,26199 +0,82%
-
21:51
Schedule for today, Thursday, Aug 31’2017 (GMT0)
01:00 Australia HIA New Home Sales, m/m July -6.9%
01:00 China Manufacturing PMI August 51.4 51.3
01:00 China Non-Manufacturing PMI August 54.5
01:00 New Zealand ANZ Business Confidence August 19.4
01:30 Australia Private Sector Credit, y/y July 5.4%
01:30 Australia Private Sector Credit, m/m July 0.6% 0.5%
05:00 Japan Construction Orders, y/y July 2.3%
05:00 Japan Housing Starts, y/y July 1.7% -0.3%
06:00 Germany Retail sales, real unadjusted, y/y July 1.5% 3.5%
06:00 Germany Retail sales, real adjusted July 1.1% -0.4%
06:45 France CPI, y/y (Preliminary) August 0.7%
06:45 France CPI, m/m (Preliminary) August -0.3% 0.5%
07:55 Germany Unemployment Rate s.a. August 5.7% 5.7%
07:55 Germany Unemployment Change August -9 -6
09:00 Eurozone Harmonized CPI ex EFAT, Y/Y (Preliminary) August 1.2%
09:00 Eurozone Harmonized CPI, Y/Y (Preliminary) August 1.3% 1.4%
09:00 Eurozone Unemployment Rate July 9.1% 9.1%
12:30 Canada GDP (m/m) June 0.6% 0.1%
12:30 Canada GDP QoQ Quarter II 0.9%
12:30 Canada GDP (YoY) Quarter II 3.7% 3.7%
12:30 U.S. Continuing Jobless Claims 1954 1950
12:30 U.S. Initial Jobless Claims 234 236
12:30 U.S. Personal Income, m/m July 0% 0.3%
12:30 U.S. Personal spending July 0.1% 0.4%
12:30 U.S. PCE price index ex food, energy, Y/Y July 1.5% 1.4%
12:30 U.S. PCE price index ex food, energy, m/m July 0.1% 0.1%
13:45 U.S. Chicago Purchasing Managers' Index August 58.9 58.5
14:00 U.S. Pending Home Sales (MoM) July 1.5% 0.5%
23:30 Australia AIG Manufacturing Index August 56.0
-
14:31
U.S. commercial crude oil inventories decreased by 5.4 million barrels from the previous week
U.S. commercial crude oil inventories (excluding those in the Strategic Petroleum Reserve) decreased by 5.4 million barrels from the previous week. At 457.8 million barrels, U.S. crude oil inventories are in the middle of the average range for this time of year.
Total motor gasoline inventories remained unchanged last week, and are near the upper limit of the average range. Finished gasoline inventories increased while blending components inventories decreased last week. Distillate fuel inventories increased by 0.7 million barrels last week and are in the upper half of the average range for this time of year. Propane/propylene inventories increased by 1.4 million barrels last week but are in the lower half of the average range. Total commercial petroleum inventories decreased by 1.1 million barrels last week.
-
14:30
U.S.: Crude Oil Inventories, August -5.392 (forecast -1.5)
-
13:51
Option expiries for today's 10:00 ET NY cut
EURUSD: Nothing of note
USDJPY: 109.00 (565m) 109.50 (825m) 110.00 (360m)
GBPUSD: 1.2900 (GBP 225m)
USDCAD: 1.2450 (USD 1.1bln)
-
13:50
US treasury yields rise slightly after GDP data, 10-year yields increase to 2.155 percent
-
13:27
The U.S. has been talking to North Korea, and paying them extortion money, for 25 years. Talking is not the answer! @realDonaldTrump
-
12:35
Canada's current account deficit widened by $3.4 billion in the second quarter to $16.3 billion
Canada's current account deficit (on a seasonally adjusted basis) widened by $3.4 billion in the second quarter to $16.3 billion, as the deficit on international trade in goods expanded.
In the financial account (unadjusted for seasonal variation), foreign investment in Canadian bonds was the largest contributor to the net inflow of funds in the economy.
The deficit on international trade in goods expanded $3.3 billion to reach $5.2 billion in the second quarter, as imports advanced by more than exports. This followed a $2.0 billion deterioration of the goods balance in the first quarter.
On a geographical basis, the goods deficit with non-US countries was up $1.8 billion, mainly reflecting a higher deficit with China. Meanwhile, the surplus with the United States was reduced $1.5 billion to $10.4 billion after three straight quarters of increases.
-
12:33
USD rally after strong Q2 GDP and PCE price index
Real gross domestic product (GDP) increased at an annual rate of 1.2 percent in the first quarter of 2017, according to the "second" estimate released by the Bureau of Economic Analysis. In the fourth quarter, real GDP increased 2.1 percent.
Real gross domestic income (GDI) increased 0.9 percent in the first quarter, in contrast to a decrease of 1.4 percent (revised) in the fourth. The average of real GDP and real GDI, a supplemental measure of U.S. economic activity that equally weights GDP and GDI, increased 1.0 percent in the first quarter,
compared with an increase of 0.3 percent in the fourth quarter.
The price index for gross domestic purchases increased 2.6 percent in the first quarter, compared with an increase of 2.0 percent in the fourth quarter. The PCE price index increased 2.4 percent, compared with an increase of 2.0 percent. Excluding food and energy prices, the PCE price index increased 2.1 percent, compared with an increase of 1.3 percent
-
12:30
U.S.: PCE price index ex food, energy, q/q, Quarter II 0.9% (forecast 0.9%)
-
12:30
U.S.: PCE price index, q/q, Quarter II 0.3% (forecast 0.3%)
-
12:30
Canada: Current Account, bln, Quarter II -16.3 (forecast -17.4)
-
12:30
U.S.: GDP, q/q, Quarter II 3% (forecast 2.7%)
-
12:23
US ADP employment rose more than expected in August
Private sector employment increased by 237,000 jobs from July to August according to the August ADP National Employment Report.
"In August, the goods-producing sector saw the best performance in months with solid increases in both construction and manufacturing," said Ahu Yildirmaz, vice president and co-head of the ADP Research Institute. "Additionally, the trade industry pulled ahead to lead job gains across all industries, adding the most jobs it has seen since the end of 2016. This could be an industry to watch as consumer spending and wage growth improves." Mark Zandi, chief economist of Moody's Analytics, said, "The job market continues to power forward. Job creation is strong across nearly all industries, company sizes. Mounting labor shortages are set to get much worse. The initial BLS employment estimate is often very weak in August due to measurement problems, and is subsequently revised higher. The ADP number is not impacted by those problems."
-
12:15
U.S.: ADP Employment Report, August 237 (forecast 185)
-
12:12
The inflation rate in Germany is expected to be 1.8% in August
The inflation rate in Germany as measured by the consumer price index is expected to be 1.8% in August 2017. Based on the results available so far, the Federal Statistical Office (Destatis) also reports that the consumer prices are expected to increase by 0.1% on July 2017.
In August 2017, the harmonised index of consumer prices for Germany, which is calculated for European purposes, is expected to increase by 1.8% year on year and by 0.2% on July 2017.
The final results for August 2017 will be released on 13 September 2017.
-
12:00
Germany: CPI, m/m, August 0.1% (forecast 0.1%)
-
12:00
Germany: CPI, y/y , August 1.8% (forecast 1.8%)
-
10:30
Russia's 2030 sovereign bond, with significant ownership by bailed out Otkritie bank, falls 1.3 cent in price to 21 month low
-
09:36
Moody's - monetary policy in the U.S. should continue to tighten this year and next
-
Forecasts euro area gdp growth of 2.1% in 2017 and 1.9% in 2018 after 1.7% in 2016
-
Expects U.S. growth of 2.2% in 2017 and 2.3% in 2018, down from 2.4% and 2.5%, respectively
-
Expects euro area monetary policy to become less supportive in 2018, provided that the current growth momentum remains intact
-
Revised up its real gdp growth forecast for Italy to 1.3% in 2017 and 2018 from 0.8% and 1% respectively
-
Revised up Germany's gdp growth forecasts to 2.2% and 2.0% for 2017 and 2018 respectively
-
-
09:00
Eurozone: Consumer Confidence, August -1.5 (forecast -1.5)
-
09:00
Eurozone: Industrial confidence, August 5.1 (forecast 4.8)
-
09:00
Eurozone: Business climate indicator , August 1.09 (forecast 1.06)
-
09:00
Eurozone: Economic sentiment index , August 111.9 (forecast 111.3)
-
08:38
UK broad money fell by £0.8 billion in July
Broad money fell by £0.8 billion in July, the first negative outturn since April 2016. Within this, households' money increased by a similar amount to the recent average but this was largely offset by a fall for non-intermediate other financial corporations (NIOFCs). Private non-financial corporations (PNFCs) money fell by a small amount (Table C), the first fall since April 2016. The net flow of sterling credit was close to zero in July. Increases in both households' and PNFCs' borrowing were almost fully offset by a fall in NIOFCs' borrowing.
The £3.6 billion flow of net secured lending in July was similar to recent months. At 68,689, house purchase approvals were stronger than recent months, returning to the levels seen at the beginning of the year. Approvals for remortgaging, at 46,231, were also stronger and have been on a slight upward trend. The annual growth rate of consumer credit fell to 9.8%, the lowest since April 2016, as the July flow was a little weaker than recent months.
-
08:31
United Kingdom: Net Lending to Individuals, bln, July 4.8 (forecast 5.3)
-
08:30
United Kingdom: Consumer credit, mln, July 1179 (forecast 1500)
-
08:30
United Kingdom: Mortgage Approvals, July 68.69 (forecast 65.5)
-
07:19
Spanish CPI lower than expected in August
According to the flash estimate issued by the INE, the annual inflation of the CPI in August 2017 was expected to be 1.6%. This indicator provides a preview of the CPI that, if confirmed, would imply an increase of one tenth in the annual rate, since in July this rate was 1.5%.
It is worth nothing in this behaviour the increase in the prices of fuels (diesel and gasoline/petrol). In turn, the annual rate of the flash estimate of the HICP in August stood at 2.0%. If confirmed, the annual rate of the HICP would increase three tenths as compared to the previous month.
-
07:00
Switzerland: KOF Leading Indicator, August 104.1 (forecast 107)
-
06:50
RBNZ's Wheeler says a lower New Zealand dollar is needed to increase tradables inflation and help deliver more balanced growth
-
Would not use DTIS while housing market continues to moderate
-
Further surge in house prices can't be ruled out as mortgage rates are low, net migration flows strong
-
Long-term inflation expectations remain well anchored at the target mid-point of 2 percent
-
Lvrs are not expected to be a permanent measure, but their removal would require a degree of confidence that financial stability risks won't deteriorate again
-
There's a risk of a housing market resurgence if lvrs were removed at this time
-
-
06:48
Options levels on wednesday, August 30, 2017
EUR/USD
Resistance levels (open interest**, contracts)
$1.2041 (4451)
$1.2020 (4002)
$1.2004 (2260)
Price at time of writing this review: $1.1948
Support levels (open interest**, contracts):
$1.1927 (4701)
$1.1895 (1268)
$1.1862 (1812)
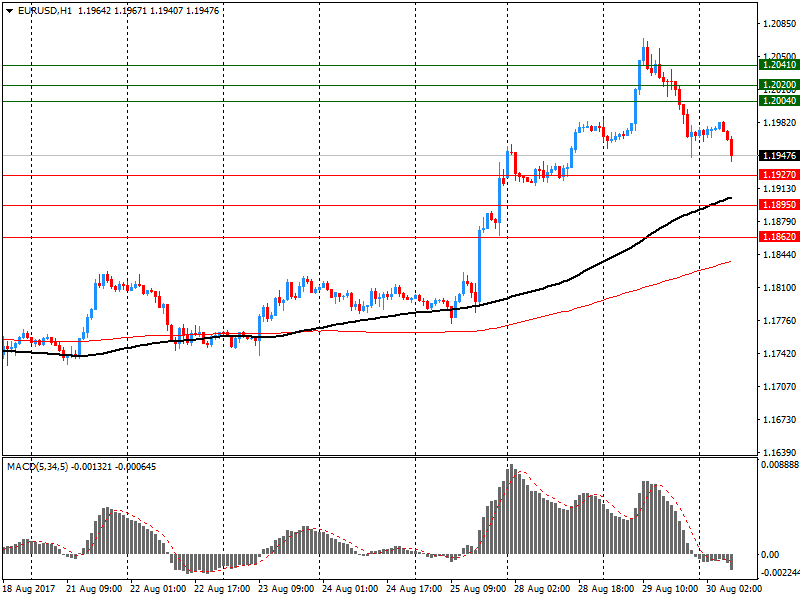
Comments:
- Overall open interest on the CALL options and PUT options with the expiration date September, 8 is 137031 contracts (according to data from August, 29) with the maximum number of contracts with strike price $1,1600 (5952);
GBP/USD
Resistance levels (open interest**, contracts)
$1.3030 (3160)
$1.3000 (1161)
$1.2960 (715)
Price at time of writing this review: $1.2904
Support levels (open interest**, contracts):
$1.2854 (2655)
$1.2821 (2368)
$1.2781 (2460)
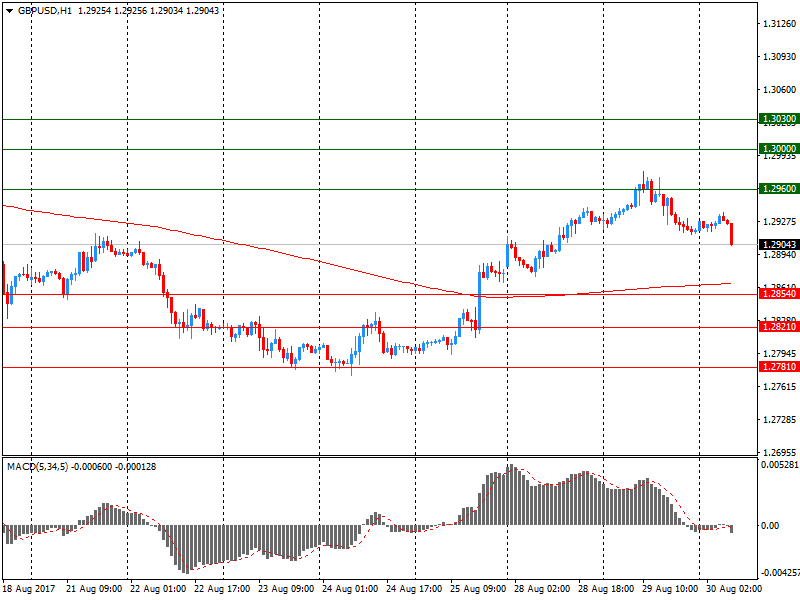
Comments:
- Overall open interest on the CALL options with the expiration date September, 8 is 37517 contracts, with the maximum number of contracts with strike price $1,3000 (3160);
- Overall open interest on the PUT options with the expiration date September, 8 is 32568 contracts, with the maximum number of contracts with strike price $1,2900 (2655);
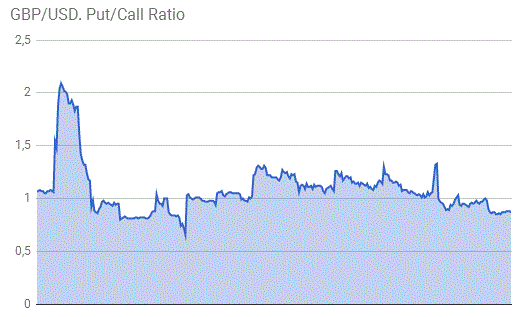
- The ratio of PUT/CALL was 0.87 versus 0.87 from the previous trading day according to data from August, 29
* - The Chicago Mercantile Exchange bulletin (CME) is used for the calculation.
** - Open interest takes into account the total number of option contracts that are open at the moment.
-
06:48
10-year U.S. treasury yield at 2.148 percent vs U.S. close of 2.136 percent on Tuesday
-
06:43
The trend estimate for total construction work done in Australia rose 0.6% in the june quarter
Total construction
-
The trend estimate for total construction work done rose 0.6% in the june quarter 2017.
-
The seasonally adjusted estimate for total construction work done rose 9.3% to $51,669.7m in the june quarter.
Building work done
The trend estimate for total building work done rose 0.5% in the june quarter.
-
The trend estimate for non-residential building work rose 3.0% and residential building work fell 0.9%.
-
The seasonally adjusted estimate of total building work done rose 0.1% to $26,996.9m in the june quarter.
Engineering work done
-
The trend estimate for engineering work done rose 0.7% in the june quarter.
-
The seasonally adjusted estimate for engineering work done rose 21.5% to $24,672.8m in the june quarter.
-
-
06:41
The Swiss UBS consumption indicator stood at 1.38 points in July
The UBS consumption indicator stood at 1.38 points in July, suggesting that the third quarter started with a level of consumption growth that is slightly below the long-term average. This aligns with the forecasts of UBS Chief Investment Office Wealth Management, which forecasts that consumption in private households would grow by 1.3% in 2017.
The relatively weak level of employment growth in recent quarters remains a burden on consumption. In July, the consumption indicator was also negatively influenced by new car registrations, which fell by 4.6% year-on-year. With only 24,885 new registrations for the month, car sales were lower than at any other month since 2009. The weaker figures from the car market were offset by the number of overnight hotel stays by Swiss nationals. The 1.41 million overnight stays recorded in July represent an increase of 9.4% from the previous year, and also set a new record for the month.
The fall in the value of the Swiss franc in recent months is expected to lead to higher inflation, potentially limiting the purchasing power of households. On the other hand, the devaluation enhances the competitiveness of retail trade and tourism in Switzerland relative to neighboring countries. On the whole, the weaker franc could have a slightly positive effect on Swiss consumption growth.
-
06:39
China says working with other U.N. Security Council members to discuss North Korea - reuters
-
06:00
Switzerland: UBS Consumption Indicator, July 1.38
-
01:30
Australia: Construction Work Done, Quarter II 9.3% (forecast 1%)
-
01:30
Australia: Building Permits, m/m, July -1.7% (forecast -5%)
-