Market news
-
22:30
Commodities. Daily history for Apr 17’02’2017:
(raw materials / closing price /% change)
Oil 52.75 +0.19%
Gold 1,286.30 -0.43%
-
22:30
Stocks. Daily history for Apr 17’2017:
(index / closing price / change items /% change)
DJIA 20636.92 +183.67
NASDAQ 5856.79 +51.64
S&P 500 2349.01 +20.06
NIKKEI 18355.26 UNCH 0%
SHANGHAI 3221.67 -24.39
-
22:28
Currencies. Daily history for Apr 17’2017:
(pare/closed(GMT +2)/change, %)
EUR/USD $1,0643 +0,30%
GBP/USD $1,2564 +0,33%
USD/CHF Chf1,0039 -0,14%
USD/JPY Y109,01 +0,39%
EUR/JPY Y116,02 +0,63%
GBP/JPY Y136,96 +0,69%
AUD/USD $0,7589 +0,16%
NZD/USD $0,7010 +0,09%
USD/CAD C$1,3315 -0,07%
-
21:59
Schedule for today, Tuesday, Apr 18’2017 (GMT0)
01:30 Australia RBA Meeting's Minutes
12:30 Canada Foreign Securities Purchases February 6.2
12:30 U.S. Housing Starts March 1288 1264
12:30 U.S. Building Permits March 1216 1245
13:00 U.S. FOMC Member Esther George Speaks
13:15 U.S. Capacity Utilization March 75.9% 76.1%
13:15 U.S. Industrial Production YoY March 0.4%
13:15 U.S. Industrial Production (MoM) March 0.1% 0.5%
16:30 Canada Gov Council Member Wilkins Speaks
-
20:06
The main US stock indexes completed trading on the positive territory
The major US stock indices grew moderately on Monday, as investors switched their attention to the reporting season for the first quarter, while geopolitical problems faded into the background.
The main attention of investors is focused on the quarterly reporting of the corporate segment. This week, Bank of America (BAC), Goldman Sachs (GS), Johnson & Johnson (JNJ), IBM (IBM), American Express (AXP), Verizon (VZ), General Electric (GE), and a lot others.
In addition, as it became known, manufacturing activity in the New York area deteriorated significantly in April, which may indicate that the euphoria of the business community after the election of Trump begins to dissipate. According to the survey, the index of activity in the manufacturing sector from the Federal Reserve Bank of New York fell to 5.2 from 16.4 in March. It was expected that the index will be 15.0. The study still shows improvement in conditions, since the index was above zero. However, a number of key components, including new orders and shipments, also deteriorated.
At the same time, the confidence of builders in the market of newly built single-family houses in April fell by 3 points, to 68 points, according to the housing market index (HMI) from the National Association of Housing Developers. The component evaluating the current conditions of sales fell 3 points to 74, while the index reflecting the expected sales in the next 6 months fell by 3 points to 75. Meanwhile, the component measuring the traffic of buyers decreased by 1 point to 52.
Most components of the DOW index finished the trades in positive territory (28 out of 30). The shares of Chevron Corporation fell more than others (CVX, -0.23%). The leader of growth was the shares of The Boeing Company (BA, + 1.87%).
All sectors of the S & P index showed positive dynamics. The leader of growth was the financial sector (+ 1.5%).
At closing:
DJIA + 0.90% 20.636.58 +183.33
Nasdaq + 0.89% 5,856.79 +51.64
S & P + 0.86% 2,348.99 +20.04
-
20:01
U.S.: Total Net TIC Flows, February 19.3
-
20:01
U.S.: Net Long-term TIC Flows , February 53.4
-
19:00
DJIA +0.62% 20,580.85 +127.60 Nasdaq +0.58% 5,838.65 +33.50 S&P +0.59% 2,342.59 +13.64
-
14:00
U.S.: NAHB Housing Market Index, April 68 (forecast 70)
-
13:34
U.S. Stocks open: Dow +0.35%, Nasdaq +0.35%, S&P +0.28%
-
13:26
Before the bell: S&P futures +0.17%, NASDAQ futures +0.22%
U.S. stock-index advanced as oil prices trimmed losses, but gains were limited by geopolitical tensions and weak U.S. data. In addition, investors eyed a pickup in earnings season.
Stocks:
Nikkei 18,355.26 +19.63 +0.11%
Hang Seng -
Shanghai 3,221.67 -24.39 -0.75%
FTSE -
CAC -
DAX -
Crude $53.08 (+0.23%)
Gold $1,289.30 (+0.06%)
-
12:53
Wall Street. Stocks before the bell
(company / ticker / price / change ($/%) / volume)
ALCOA INC.
AA
31.18
0.19(0.61%)
3712
Amazon.com Inc., NASDAQ
AMZN
888.79
4.12(0.47%)
17681
AMERICAN INTERNATIONAL GROUP
AIG
59.51
-0.04(-0.07%)
309
Apple Inc.
AAPL
141.85
0.80(0.57%)
42052
AT&T Inc
T
40.31
0.03(0.07%)
10493
Barrick Gold Corporation, NYSE
ABX
19.79
-0.04(-0.20%)
6569
Citigroup Inc., NYSE
C
58.35
0.31(0.53%)
19968
Exxon Mobil Corp
XOM
81.7
0.01(0.01%)
1740
Facebook, Inc.
FB
139.9
0.51(0.37%)
35534
Ford Motor Co.
F
11.22
0.11(0.99%)
163336
Freeport-McMoRan Copper & Gold Inc., NYSE
FCX
12.86
0.14(1.10%)
11173
General Electric Co
GE
29.55
-0.01(-0.03%)
1710
General Motors Company, NYSE
GM
33.48
0.09(0.27%)
1654
Goldman Sachs
GS
224.01
0.69(0.31%)
5072
Google Inc.
GOOG
823.5
-0.06(-0.01%)
613
Intel Corp
INTC
35.26
0.01(0.03%)
744
JPMorgan Chase and Co
JPM
84.51
0.11(0.13%)
57996
McDonald's Corp
MCD
131.41
0.65(0.50%)
3157
Microsoft Corp
MSFT
65.1
0.15(0.23%)
3092
Pfizer Inc
PFE
34.11
0.23(0.68%)
7278
Tesla Motors, Inc., NASDAQ
TSLA
301.62
-2.38(-0.78%)
30235
Twitter, Inc., NYSE
TWTR
14.35
0.05(0.35%)
5763
Verizon Communications Inc
VZ
48.51
-0.11(-0.23%)
2746
Wal-Mart Stores Inc
WMT
73.05
-0.10(-0.14%)
202
Yandex N.V., NASDAQ
YNDX
22.95
0.20(0.88%)
1454
-
12:33
Upgrades and downgrades before the market open
Upgrades:
McDonald's (MCD) upgraded to Outperform from Market Perform at Wells Fargo
Downgrades:
Other:
Apple (AAPL) target raised to $157 from $155 at RBC Capital Mkts
Facebook (FB) target raised to $160 from $155 at Aegis Capital
Amazon (AMZN) target raised to $1050 from $900 at Credit Suisse
-
12:30
U.S.: NY Fed Empire State manufacturing index , April 5.2 (forecast 15)
-
12:03
Earnings Season in U.S.: Major Reports of the Week
April 18
Before the Open:
Bank of America (BAC). Consensus EPS $0.35, Consensus Revenues $21765.60 mln.
Goldman Sachs (GS). Consensus EPS $5.19, Consensus Revenues $8328.86 mln.
Johnson & Johnson (JNJ). Consensus EPS $1.77, Consensus Revenues $18019.78 mln.
UnitedHealth (UNH). Consensus EPS $2.17, Consensus Revenues $48211.34 mln.
After the Close:
IBM (IBM). Consensus EPS $2.35, Consensus Revenues $18367.18 mln.
Yahoo! (YHOO). Consensus EPS $0.14, Consensus Revenues $814.32 mln.
April 19
Before the Open:
Morgan Stanley (MS). Consensus EPS $0.90, Consensus Revenues $9290.90 mln.
After the Close:
American Express (AXP). Consensus EPS $1.27, Consensus Revenues $7756.82 mln.
April 20
Before the Open:
Travelers (TRV). Consensus EPS $2.38, Consensus Revenues $6225.25 mln.
Verizon (VZ). Consensus EPS $0.97, Consensus Revenues $30511.07 mln.
After the Close:
Visa (V). Consensus EPS $0.79, Consensus Revenues $4287.42 mln.
April 21
Before the Open:
General Electric (GE). Consensus EPS $0.17, Consensus Revenues $26370.79 mln.
Honeywell (HON). Consensus EPS $1.62, Consensus Revenues $9328.83 mln.
-
03:20
Options levels on monday, April 17, 2017
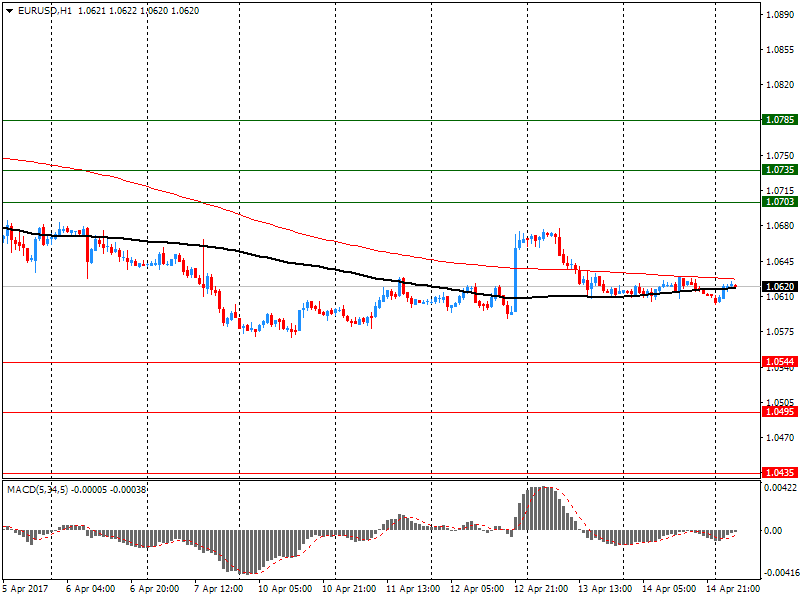
EUR/USD
Resistance levels (open interest**, contracts)
$1.0785 (1067)
$1.0735 (462)
$1.0703 (126)
Price at time of writing this review: $1.0620
Support levels (open interest**, contracts):
$1.0544 (762)
$1.0495 (1700)
$1.0435 (2782)
Comments:
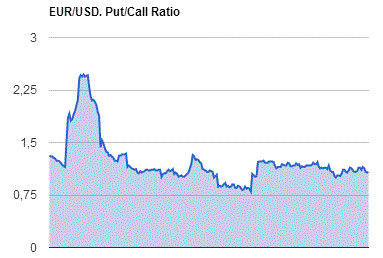
- Overall open interest on the CALL options with the expiration date June, 9 is 54324 contracts, with the maximum number of contracts with strike price $1,1000 (4871);
- Overall open interest on the PUT options with the expiration date June, 9 is 58301 contracts, with the maximum number of contracts with strike price $1,0400 (5235);
- The ratio of PUT/CALL was 1.07 versus 1.08 from the previous trading day according to data from April, 13

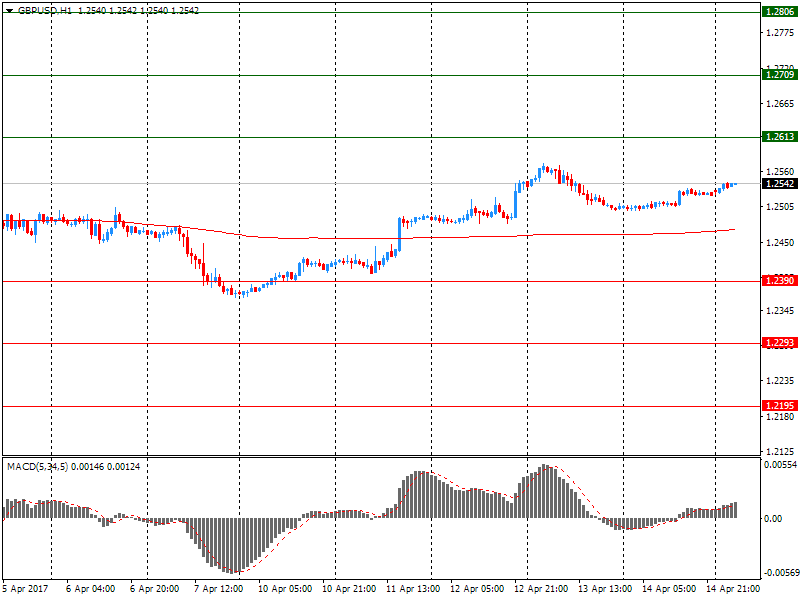
GBP/USD
Resistance levels (open interest**, contracts)
$1.2806 (1078)
$1.2709 (660)
$1.2613 (425)
Price at time of writing this review: $1.2542
Support levels (open interest**, contracts):
$1.2390 (752)
$1.2293 (807)
$1.2195 (723)
Comments:
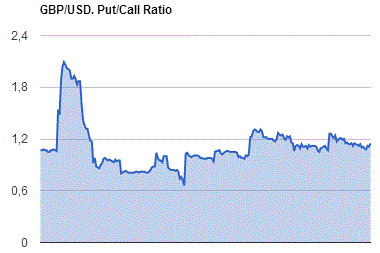
- Overall open interest on the CALL options with the expiration date June, 9 is 16228 contracts, with the maximum number of contracts with strike price $1,3000 (1371);
- Overall open interest on the PUT options with the expiration date June, 9 is 18975 contracts, with the maximum number of contracts with strike price $1,1500 (3063);
- The ratio of PUT/CALL was 1.17 versus 1.15 from the previous trading day according to data from April, 13

* - The Chicago Mercantile Exchange bulletin (CME) is used for the calculation.
** - Open interest takes into account the total number of option contracts that are open at the moment.
-
02:01
China: Industrial Production y/y, March 7.46% (forecast 6.3%)
-
02:01
China: Fixed Asset Investment, March 9.2% (forecast 8.8%)
-
02:00
China: Retail Sales y/y, March 10.9% (forecast 9.6%)
-
01:28
Commodities. Daily history for Apr 14’02’2017:
(raw materials / closing price /% change)
Oil 52.98 +0.13%
Gold 1,296.80 +0.52%
-
01:24
Stocks. Daily history for Apr 14’2017:
(index / closing price / change items /% change)
DJIA 20453.25 -138.61 -0.67%
S&P 500 2328.95 -15.98 -0.68%
NIKKEI 18335.63 -91.21 -0.49%
SHANGHAI 3241.54 -34.42 -1.05%
HSI 24261.66 -51.84 -0.21%
KOSPI 2134.88 -13.73 -0.64%
ASX 200 5889.95 -44.01 -0.74%
-
01:23
Currencies. Daily history for Apr 14’2017:
(pare/closed(GMT +2)/change, %)
EUR/USD $ 1,0611 -0,04%
GBP/USD $ 1,2523 +0,14%
USD/CHF Chf1,0053 +0,01%
USD/JPY Y108,58 -0,52%
EUR/JPY Y115,29 -0,48%
GBP/JPY Y136,02 -0,33%
AUD/USD $0,7577 +0,13%
NZD/USD $0,7004 +0,06%
USD/CAD C$1,3324 -0,05%
-
00:59
Schedule for today, Monday, Apr 17’2017 (GMT0)
02:00 China Retail Sales y/y March 9.5% 9.6%
02:00 China Industrial Production y/y March 6.3% 6.3%
02:00 China Fixed Asset Investment March 8.9% 8.8%
02:00 China GDP y/y Quarter I 6.8% 6.8%
06:00 United Kingdom Bank holiday
06:00 France Bank holiday
06:00 Germany Bank Holiday
06:00 Switzerland Bank holiday
12:30 U.S. NY Fed Empire State manufacturing index April 16.4 15
14:00 U.S. NAHB Housing Market Index April 71 70
20:00 U.S. Total Net TIC Flows February 110.4
20:00 U.S. Net Long-term TIC Flows February 6.3
-


