Market news
-
21:11
Major US stock indexes finished trading in negative territory
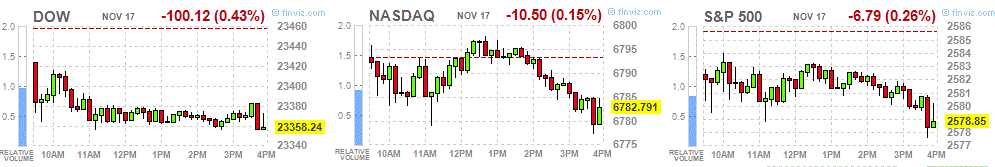
The main US stock indexes slightly decreased, as investors are skeptical of the Republicans' efforts to adopt a tax reform.
Meanwhile, some support for the indices was provided by data on the US housing market. The Ministry of Trade reported that in October the number of new foundations had increased by 13.7% to a seasonally adjusted level of 1.29 million units. The September valuation was revised to 1.135 million units. Economists were expecting 1.18 million units. Permits for construction grew by 5.9% to 1.3 million units. A large double-digit increase occurred in both the South and the Midwest, some of which were associated with the recovery from hurricanes. On a percentage basis, the Northeast was in fact the largest engine, an increase of 42%, but this is the smallest region in terms of activity. The laying of new foundations for one family increased by 5.3%, while the laying of new foundations for five or more units jumped by 37.4%.
Oil prices jumped by more than 2%, but the current week still ended with losses due to fears of excess supply, as signs of increased production in the US were compounded by doubts that Russia would support the extension of OPEC's deal to limit production.
Most components of the DOW index finished trading in the red (20 of 30). Leader of the growth were shares of NIKE, Inc. (NKE, + 3.20%). Outsider were shares of Intel Corporation (INTC, -2.02%).
Most sectors of the S & P recorded a fall. The utilities sector showed the greatest decrease (-0.5%). The conglomerate sector grew most (+ 0.7%).
At closing:
Dow -0.43% 23,358.10 -100.26
Nasdaq -0.15% 6,782.79 -10.50
S & P-0.26% 2.578.84 -6.80
-
20:00
DJIA -0.38% 23,369.95 -88.41 Nasdaq -0.07% 6,788.25 -5.05 S&P -0.15% 2,581.84 -3.80
-
18:01
U.S.: Baker Hughes Oil Rig Count, November 738
-
17:00
European stocks closed: FTSE 100 -6.26 7380.68 -0.08% DAX -53.49 12993.73 -0.41% CAC 40 -17.22 5319.17 -0.32%
-
15:33
Eu leaders' chairman tusk says there is still a chance to move on to next phase of Brexit talks in December
-
Says he is very cautious but optimistic
-
-
14:49
North Korean envoy tells Reuters no negotiations will take place with United States on nuclear issues as long as U.S.- South Korean military exercises continue
-
14:34
U.S. Stocks open: Dow -0.34%, Nasdaq -0.02%, S&P -0.19%
-
14:29
Before the bell: S&P futures -0.09%, NASDAQ futures +0.03%
U.S. stock-index futures were flat on Friday, a day after solid gains, bolstered by strong earnings and progress on U.S. tax cuts.
Global Stocks:
Nikkei 22,396.80 +45.68 +0.20%
Hang Seng 29,199.04 +180.28 +0.62%
Shanghai 3,382.34 -16.91 -0.50%
S&P/ASX 5,957.25 +13.74 +0.23%
FTSE 7,388.39 +1.45 +0.02%
CAC 5,335.65 -0.74 -0.01%
DAX 13,055.99 +8.77 +0.07%
Crude $56.09 (+1.72%)
Gold $1,283.90 (+0.45%)
-
14:15
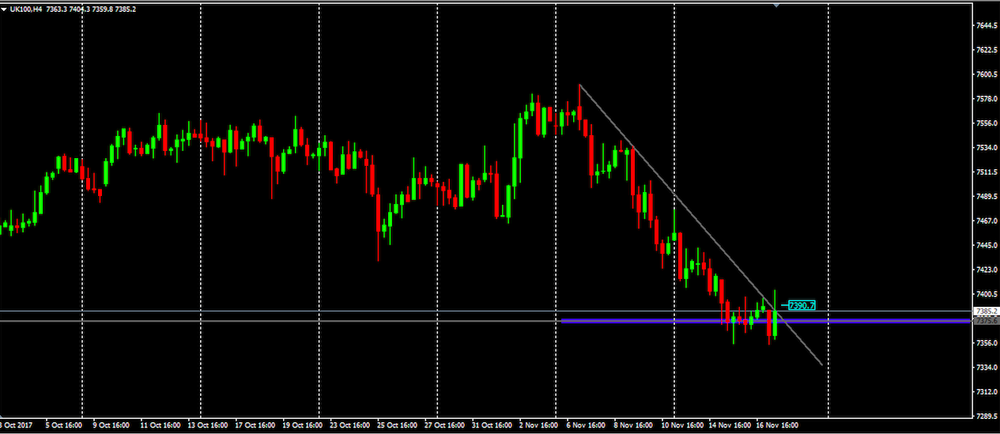
uk100 4h time frame chart
Uk100 has been following a downside trend which we can see on 4-hour time frame chart, however, the price is in a crucial zone to decide the next movement.
As we can see, this last 4hour candle tried to break the downside trend but without success.
On the other hand, we have a relatively important level of support which the price has shown some difficulties in breaking down.
Therefore, we can expect a bearish movement once this support level is broken.
But if the price continues to reject the support level, it is also expected to see a slight correction of previous bearish movement.
-
13:57
Wall Street. Stocks before the bell
(company / ticker / price / change ($/%) / volume)
ALCOA INC.
AA
42
-0.30(-0.71%)
991
Amazon.com Inc., NASDAQ
AMZN
1,138.00
0.71(0.06%)
31856
American Express Co
AXP
93.53
-0.03(-0.03%)
512
Apple Inc.
AAPL
170.97
-0.13(-0.08%)
341988
AT&T Inc
T
34.5
-0.02(-0.06%)
7283
Barrick Gold Corporation, NYSE
ABX
14
0.08(0.57%)
12684
Boeing Co
BA
262.42
-1.28(-0.49%)
6634
Caterpillar Inc
CAT
136.3
-0.06(-0.04%)
1113
Chevron Corp
CVX
114.65
0.08(0.07%)
1889
Cisco Systems Inc
CSCO
35.73
-0.15(-0.42%)
251957
Citigroup Inc., NYSE
C
71.5
-0.17(-0.24%)
1415
Exxon Mobil Corp
XOM
80.69
0.13(0.16%)
15451
Facebook, Inc.
FB
179.62
0.03(0.02%)
146541
Ford Motor Co.
F
12.03
-0.01(-0.08%)
1261
Freeport-McMoRan Copper & Gold Inc., NYSE
FCX
13.52
-0.10(-0.73%)
9131
General Electric Co
GE
18.47
0.22(1.21%)
832832
Goldman Sachs
GS
238.17
-1.20(-0.50%)
3672
Intel Corp
INTC
45.55
-0.10(-0.22%)
1842226
International Business Machines Co...
IBM
148.7
-0.42(-0.28%)
3825
Johnson & Johnson
JNJ
138.59
-0.28(-0.20%)
926
JPMorgan Chase and Co
JPM
98.16
-0.31(-0.31%)
5242
McDonald's Corp
MCD
167.23
-0.86(-0.51%)
3639
Nike
NKE
58.4
1.17(2.04%)
129350
Pfizer Inc
PFE
35.42
-0.14(-0.39%)
3437
Procter & Gamble Co
PG
88.92
-0.33(-0.37%)
3065
Starbucks Corporation, NASDAQ
SBUX
56.97
-0.27(-0.47%)
66556
Tesla Motors, Inc., NASDAQ
TSLA
326.2
13.70(4.38%)
534620
The Coca-Cola Co
KO
46.44
-0.11(-0.24%)
3403
Twitter, Inc., NYSE
TWTR
20.38
0.02(0.10%)
14531
UnitedHealth Group Inc
UNH
210.51
-0.62(-0.29%)
1787
Verizon Communications Inc
VZ
44.71
-0.06(-0.13%)
11365
Visa
V
111.15
0.13(0.12%)
22068
Wal-Mart Stores Inc
WMT
99.44
-0.18(-0.18%)
94128
Walt Disney Co
DIS
103.2
-0.40(-0.39%)
4704
Yandex N.V., NASDAQ
YNDX
32.35
-0.05(-0.15%)
100
-
13:55
Target price changes before the market open
Wal-Mart (WMT) target raised to $92 from $83 at RBC Capital Mkts
Wal-Mart (WMT) target raised to $108 from $96 at Telsey Advisory Group
-
13:50
Forex option contracts rolling off today at 14.00 GMT:
EUR/USD: 1.1500-02(1.49 млрд), 1.1579-80(1.14 млрд), 1.1700(358 млн), 1.1720-25(880 млн), 1.1750(409 млн), 1.1790-1.1800(655 млн ), 1.1825(694 млн),1.1840-50(646 млн)
GBP/USD: 1.2950(303 млн), 1.3000(311 млн), 1.3300(640 млн)
USD/JPY: 111.00(494 млн), 113.25(375 млн), 113.45-50(910 млн), 114.25(515 млн)
USD/CHF: 0.9855(300 млн)
USD/CAD: 1.2600(519 млн), 1.2700(330 млн), 1.2800-10(694 млн),
AUD/JPY: 85.50(940 млн)
AUD/CAD: 0.9730(225 млн)
-
13:38
U.S housing starts and building permits rose more than expected in October
Privately-owned housing units authorized by building permits in October were at a seasonally adjusted annual rate of 1,297,000. This is 5.9 percent above the revised September rate of 1,225,000 and is 0.9 percent above the October 2016 rate of 1,285,000. Single-family authorizations in October were at a rate of 839,000; this is 1.9 percent above the revised September figure of 823,000. Authorizations of units in buildings with five units or more were at a rate of 416,000 in October. Privately-owned housing starts in October were at a seasonally adjusted annual rate of 1,290,000. This is 13.7 percent above the revised September estimate of 1,135,000, but is 2.9 percent below the October 2016 rate of 1,328,000. Single-family housing starts in October were at a rate of 877,000; this is 5.3 percent above the revised September figure of 833,000. The October rate for units in buildings with five units or more was 393,000.
-
13:35
Canadian Consumer Price Index (CPI) increased 1.4% on a year-over-year basis
The Consumer Price Index (CPI) increased 1.4% on a year-over-year basis in October, following a 1.6% gain in September. The all-items excluding gasoline index rose 1.3% year over year in October, after increasing 1.1% in September.
Prices were up in seven of the eight major CPI components in the 12 months to October, with the transportation and shelter indexes contributing the most to the increase. The clothing and footwear index declined on a year-over-year basis.
Transportation prices rose 3.0% on a year-over-year basis in October, following a 3.8% increase in September. This deceleration was led by gasoline prices, which increased 6.5% year over year in October after increasing 14.1% the previous month in the aftermath of Hurricane Harvey. At the same time, the purchase of passenger vehicles index rose 1.5% month over month in October, providing the impetus for the largest year-over-year gain in this index since March 2017.
-
13:30
U.S.: Building Permits, October 1297 (forecast 1240)
-
13:30
U.S.: Housing Starts, October 1290 (forecast 1180)
-
13:30
Canada: Consumer Price Index m / m, October 0.1% (forecast 0.1%)
-
13:30
Canada: Consumer price index, y/y, October 1.4% (forecast 1.4%)
-
13:30
Canada: Bank of Canada Consumer Price Index Core, y/y, October 0.9%
-
12:28
UK PM May's spokesman says government would encourage all members of parliament to support march 29 2019 Brexit date
-
11:08
China Central Bank: financial institutions will be punished for providing implicit guarantees for asset management products
-
10:40
Austrian national bank sees Austrian economy growing q/q at 0.8 pct in q4 2017, 0.6 pct in q1 2018
-
10:00
Eurozone: Construction Output, y/y, September 3.7%
-
09:54
ECB's Draghi says we do now see inflation moving steadily away from the very low levels of recent years
-
09:52
Forex option contracts rolling off today at 14.00 GMT:
EUR/USD: 1.1500-02(1.49 b), 1.1579-80(1.14 b), 1.1700(358 m), 1.1720-25(880 m), 1.1750(409 m), 1.1790-1.1800(655 m), 1.1825(694 m),1.1840-50(646 m)
GBP/USD: 1.2950(303 m), 1.3000(311 m), 1.3300(640 m)
USD/JPY: 111.00(494 m), 113.25(375 m), 113.45-50(910 m), 114.25(515 m)
USD/CHF: 0.9855(300 m)
USD/CAD: 1.2600(519 m), 1.2700(330 m), 1.2800-10(694 m),
AUD/JPY: 85.50(940 m)
AUD/CAD: 0.9730(225 m)
-
09:40
ECB's Draghi says horizon of our net asset purchases, and “well past” the end of those net purchases, mechanically affect the time of the first expected rate hike
-
09:40
ECB's Draghi says we see more signs that growth is “feeding on itself”
-
Recovery therefore has not come against the backdrop of re-leveraging in any economic sector
-
We have increasing confidence that the recovery is robust and that this momentum will continue going
-
We are not yet at a point where the recovery of inflation can be self-sustained without our accommodative policy
-
As regards bank profitability, ECB research finds little evidence that our monetary policy is currently doing harm
-
Economy may be becoming more resilient to new shocks
-
-
09:17
Major stock markets in Europe trading mixed: FTSE 7375.20 -11.74 -0.16%, DAX 13059.19 +11.97 + 0.09%, CAC 5333.36 -3.03 -0.06%
-
09:03
The current account of the euro area recorded a surplus of €37.8 billion in September
The current account of the euro area recorded a surplus of €37.8 billion in September 2017. This reflected surpluses for goods (€35.2 billion), primary income (€9.7 billion) and services (€7.3 billion), which were partly offset by a deficit for secondary income (€14.3 billion).
The 12-month cumulated current account for the period ending in September 2017 recorded a surplus of €346.4 billion (3.2% of euro area GDP), compared with one of €359.3 billion (3.4% of euro area GDP) for the 12 months to September 2016. This development was due to a decrease in the surplus for goods (from €377.0 billion to €342.0 billion) and an increase in the deficit for secondary income (from €135.9 billion to €151.1 billion). These were partly offset by increases in the surpluses for primary income (from €69.2 billion to €93.4 billion) and services (from €49.0 billion to €62.0 billion).
-
09:00
Eurozone: Current account, unadjusted, bln , September 37.8 (forecast 30.2)
-
07:35
Options levels on friday, November 17, 2017
EUR/USD
Resistance levels (open interest**, contracts)
$1.1891 (3853)
$1.1859 (7230)
$1.1834 (3220)
Price at time of writing this review: $1.1798
Support levels (open interest**, contracts):
$1.1757 (1503)
$1.1725 (1799)
$1.1700 (3109)
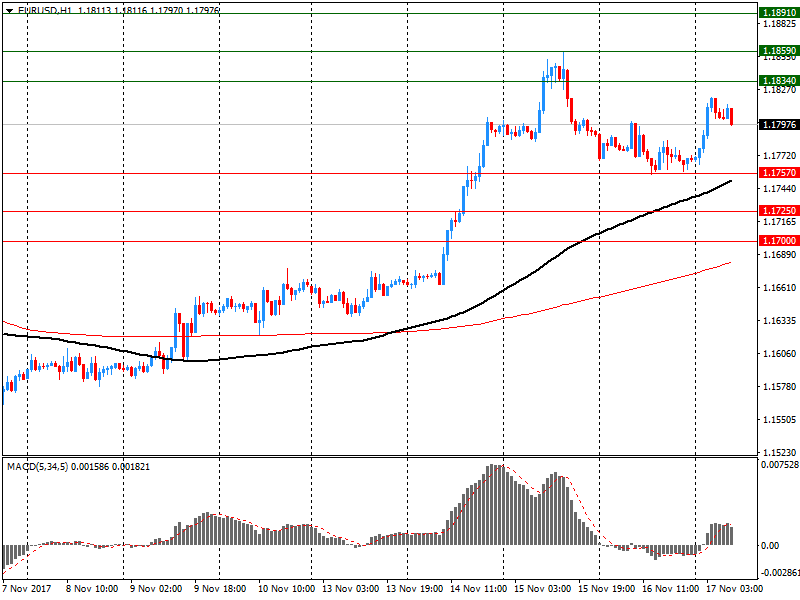
Comments:
- Overall open interest on the CALL options and PUT options with the expiration date December, 8 is 155695 contracts (according to data from November, 16) with the maximum number of contracts with strike price $1,1500 (8411);
GBP/USD
Resistance levels (open interest**, contracts)
$1.3352 (2413)
$1.3320 (2688)
$1.3293 (3265)
Price at time of writing this review: $1.3249
Support levels (open interest**, contracts):
$1.3181 (852)
$1.3142 (1177)
$1.3083 (1348)
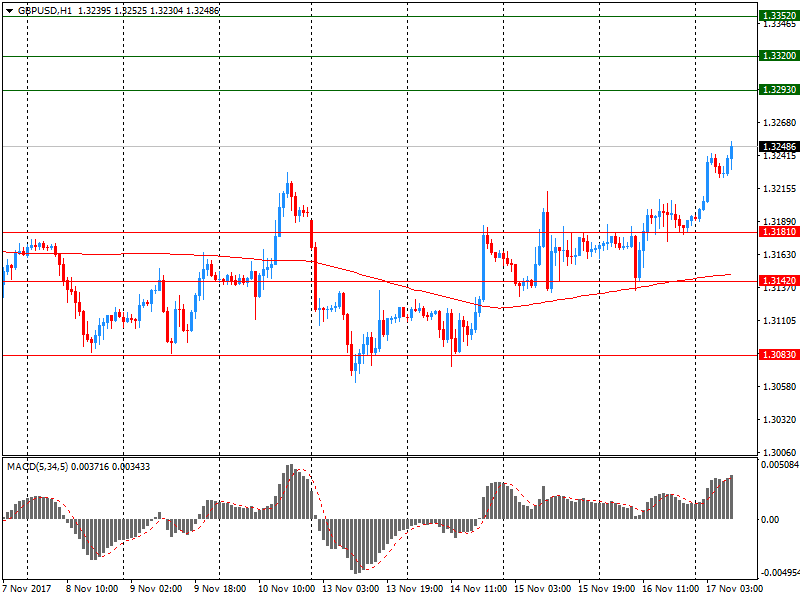
Comments:
- Overall open interest on the CALL options with the expiration date December, 8 is 41372 contracts, with the maximum number of contracts with strike price $1,3200 (3265);
- Overall open interest on the PUT options with the expiration date December, 8 is 39073 contracts, with the maximum number of contracts with strike price $1,3000 (3742);
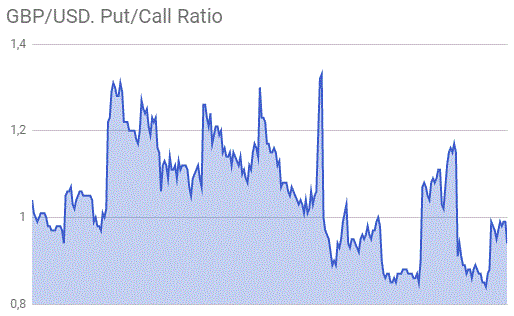
- The ratio of PUT/CALL was 0.94 versus 0.99 from the previous trading day according to data from November, 16
* - The Chicago Mercantile Exchange bulletin (CME) is used for the calculation.
** - Open interest takes into account the total number of option contracts that are open at the moment.
-
07:32
Mixed start of trading expected for the main European stock markets: DAX + 0.15%, CAC 40 + 0.1%, FTSE 100 -0.2%
-
07:21
10-year U.S. treasury yield at 2.361 percent, unchanged from thursday's U.S. close
-
06:19
Global Stocks
European stocks broke their longest losing run in a year on Thursday, with major regional indexes rebounding after well-received corporate updates. Investors also cheered a rise in shares of car makers after the release of encouraging EU sales figures.
U.S. stocks closed higher Thursday, with earnings-inspired gains by Cisco and Wal-Mart helping to set the pace, while House passage of a Republican-sponsored tax cut plan helped cement the rally.
The global stock rebound continued Friday in Asia, with equities working to erase declines from earlier in the week. Japan again led the way. The Nikkei NIK, +0.24% jumped 1.5%, putting it into positive territory for the week. It hasn't had a down week since early September and if it does notch a 10th straight weekly advance today, that would be the longest winning streak since January 2013.
-
00:31
Australia: New Motor Vehicle Sales (YoY) , October 1.0%
-
00:31
Australia: New Motor Vehicle Sales (MoM) , October 0.0%
-