Market news
-
22:37
Commodities. Daily history for Oct 25’2017:
(raw materials / closing price /% change)
Oil 52.17 -0.57%
Gold 1,278.60 +0.02%
-
22:34
Stocks. Daily history for Oct 25’2017:
(index / closing price / change items /% change)
Nikkei -97.55 21707.62 -0.45%
TOPIX -5.49 1751.43 -0.31%
Hang Seng +147.92 28302.89 +0.53%
CSI 300 +17.55 3976.95 +0.44%
Euro Stoxx 50 -19.23 3591.46 -0.53%
FTSE 100 -79.33 7447.21 -1.05%
DAX -59.78 12953.41 -0.46%
CAC 40 -19.91 5374.89 -0.37%
DJIA -112.30 23329.46 -0.48%
S&P 500 -11.98 2557.15 -0.47%
NASDAQ -34.54 6563.89 -0.52%
S&P/TSX -50.37 15854.77 -0.32%
-
22:26
Currencies. Daily history for Oct 25’2017:
(pare/closed(GMT +3)/change, %)
EUR/USD $1,1815 +0,44%
GBP/USD $1,3262 +1,01%
USD/CHF Chf0,98925 -0,16%
USD/JPY Y113,67 -0,21%
EUR/JPY Y134,31 +0,23%
GBP/JPY Y150,765 +0,81%
AUD/USD $0,7703 -0,91%
NZD/USD $0,6888 -0,14%
USD/CAD C$1,27856 +0,86%
-
22:04
Schedule for today, Thursday, Oct 26’2017 (GMT0)
00:45 New Zealand Trade Balance, mln September -1179 Revised From -1235 -900 -1143
03:30 Australia Export Price Index, q/q Quarter III -5.7% -6.3%
03:30 Australia Import Price Index, q/q Quarter III -0.1% -1.4%
09:00 Germany Gfk Consumer Confidence Survey November 10.8 10.8
11:00 Eurozone Private Loans, Y/Y September 2.7% 2.9%
11:00 Eurozone M3 money supply, adjusted y/y September 5.0% 5.0%
13:00 United Kingdom CBI retail sales volume balance October 42 15
14:45 Eurozone Deposit Facilty Rate -0.4% -0.4%
14:45 Eurozone ECB Interest Rate Decision 0% 0%
15:30 Eurozone ECB Press Conference
15:30 U.S. Goods Trade Balance, $ bln. September -62.94 -63.80
15:30 U.S. Continuing Jobless Claims 1888
15:30 U.S. Initial Jobless Claims 222 235
17:00 U.S. Pending Home Sales (MoM) September -2.6% 0.2%
17:30 U.S. FOMC Member Kashkari Speaks
-
21:45
New Zealand: Trade Balance, mln, September -1143 (forecast -900)
-
20:10
The main US stock indexes finished trading in negative territory
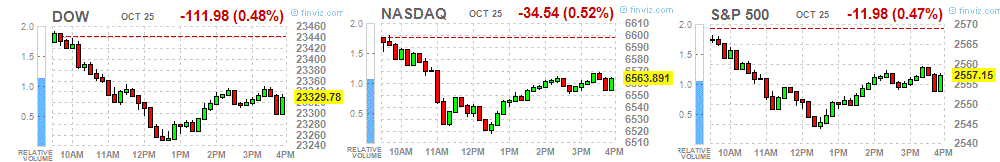
Major US stock indices moderately declined on Wednesday after the last quarterly reports of companies, including AT & T and Boeing, did not impress investors.
According to the published report, AT & T (T)'s profit for the third quarter of 2017 fiscal year (FY) reached $ 0.74 per share (versus $ 0.74 in the third quarter of 2016 FY), which was below the average forecast of analysts at $ 0.75. Quarterly revenue of the company was 39.668 billion (-3.0% y / y), while the average forecast of analysts was $ 40.335 billion.
Meanwhile, the profit of Boeing (BA) for the third quarter of 2017 FY reached $ 2.72 per share (versus $ 3.51 in the third quarter of 2016 FY), which was above the average forecast of analysts at $ 2.66. Quarterly revenue of the company was $ 24.309 billion (+ 1.7% y / y), while the average forecast of analysts was $ 24.090 billion.
In addition, as it became known, orders for durable goods grew by 2.2% in September, ahead of growth forecasts of 1.1%. With the exception of transport, orders increased by 0.7%. Investments in the business grew by 1.3% for the third month in a row, based on a closely related measure known as basic orders for capital goods. Last year, these orders grew by 7.8%.
The sales of newly built houses grew at the highest rates during the decade in September, as reliable demand supported the builders. Sales of new buildings rose to 667,000 per annum, the Ministry of Commerce reported. This is 18.9% more than in August, and 17% more than a year ago. Economists predicted 555,000 annual rates. According to the government, sales were restored after the August hurricanes. They were strong in every region, including in the south, which was destroyed by hurricanes.
Most components of the DOW index finished trading in the red (23 of 30). Leader of the growth were shares of NIKE, Inc. (NKE, + 2.78%). Outsider were shares of The Boeing Company (BA, -3.32%).
All sectors of the S & P index recorded a decline. The largest decline was shown by the sector of conglomerates (-1.8%).
At closing:
DJIA -0.48% 23,329.46 -112.30
Nasdaq -0.52% 6,563.89 -34.54
S & P -0.47% 2.557.15 -11.98
-
19:00
DJIA -0.51% 23,322.51 -119.25 Nasdaq -0.63% 6,557.17 -41.26 S&P -0.53% 2,555.51 -13.62
-
16:37
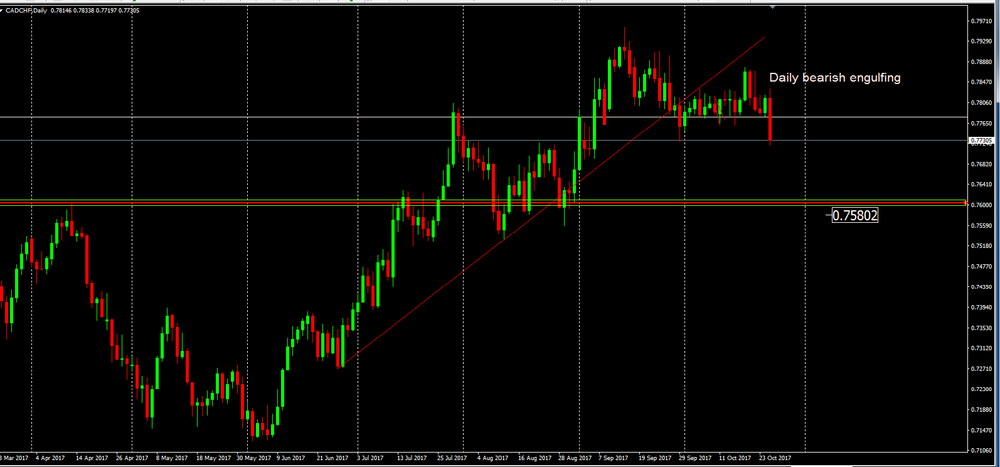
CAD/CHF DAILY CHART
As we can see no chart daily , the trend line that has been respected for several days has recently been broken.
However, and after the breakout or price ended by entering into consolidation.
If the daily candle close like this or similar, then we might have the confirmation of a pattern of candles ("Bearish Engulfing") in which it will give some indications of beginning of a new bearish tendency.
in a bearish scenario we might see the price going down until close to 0.7580.
-
16:00
European stocks closed: FTSE 100 -79.33 7447.21 -1.05% DAX -59.78 12953.41 -0.46% CAC 40 -19.91 5374.89 -0.37%
-
14:32
U.S. commercial crude oil inventories increased by 0.9 million barrels from the previous week
U.S. commercial crude oil inventories (excluding those in the Strategic Petroleum Reserve) increased by 0.9 million barrels from the previous week. At 457.3 million barrels, U.S. crude oil inventories are in the upper half of the average range for this time of year.
Total motor gasoline inventories decreased 5.5 million barrels last week, but are in the upper half of the average range. Both finished gasoline inventories and blending components inventories decreased last week.
Distillate fuel inventories decreased by 5.2 million barrels last week and are in the lower half of the average range for this time of year. Propane/propylene inventories decreased by 1.2 million barrels last week and are in the lower half of the average range. Total commercial petroleum inventories decreased by 12.2 million barrels last week.
-
14:30
U.S.: Crude Oil Inventories, October 0.856 (forecast -2.578)
-
14:29
BoC: outlook subject to "substantial uncertainty" about geopolitical developments, NAFTA renegotiation
-
There could be room for more economic growth than projected without inflation rising materially above target
-
Canadian economy operating close to potential but wage and other data indicate there is still slack in the labor market
-
Effects of higher C$ on inflation expected to become stronger, with peak impact of -0.5 percentage points in q2 2018
-
Export growth seen slower than previously due to stronger c$; still expected to make solid contribution to gdp growth
-
High debt levels mean household spending likely more sensitive to interest rates than in the past
-
Lowers q3 growth forecast to 1.8 from 2.0 pct, sees 2.5 pct growth in q4; raises 2017 growth forecast to 3.1 pct from 2.8 pct, 2018 to 2.1 pct from 2.0 pct
-
-
14:15
US new home sales rose more than expected in September
Sales of new single-family houses in September 2017 were at a seasonally adjusted annual rate of 667,000, according to estimates released jointly today by the U.S. Census Bureau and the Department of Housing and Urban Development. This is 18.9 percent above the revised August rate of 561,000 and is 17.0 percent above the September 2016 estimate of 570,000.
The median sales price of new houses sold in September 2017 was $319,700. The average sales price was $385,200.
-
14:13
The Bank of Canada maintained its target for the overnight rate at 1 per cent
"The Bank of Canada today maintained its target for the overnight rate at 1 per cent. The Bank Rate is correspondingly 1 1/4 per cent and the deposit rate is 3/4 per cent.
Inflation has picked up in recent months, as anticipated in the Bank's July Monetary Policy Report (MPR), reflecting stronger economic activity and higher gasoline prices. Measures of core inflation have edged up, in line with a narrowing output gap and the diminishing effects of lower food prices. The Bank projects inflation will rise to 2 per cent in the second half of 2018. This is a little later than anticipated in July because of the recent strength in the Canadian dollar. The Bank is also mindful that global structural factors could be weighing on inflation in Canada and other advanced economies.
The global and Canadian economies are progressing as outlined in the July MPR. Economic activity continues to strengthen and broaden across countries. The Bank still expects global growth to average around 3 1/2 per cent over 2017-19. However, this outlook remains subject to substantial uncertainty about geopolitical developments and fiscal and trade policies, notably the renegotiation of the North American Free Trade Agreement".
-
14:00
U.S.: New Home Sales, September 667 (forecast 0.555)
-
14:00
Canada: Bank of Canada Rate, 1.00% (forecast 1%)
-
13:46
Forex option contracts rolling off today at 14.00 GMT:
EURUSD: 1.1600 (EUR 410m) 1.1700 (765m) 1.1720-25 (510m) 1.1750 (800m) 1.1800 (545m) 1.1850 (740m)
USDJPY:113.00 (USD 550m) 113.25 (695m) 113.50-55 (465m) 114.00 (2.2bln) 114.60 (130m)
GBPUSD: 1.3100 ( GBP 300m) 1.3185 (230m) 1.3250 (150m)
EURGBP: 0.8875 (830m)
USDCAD: 1.2700 (USD 700m)
AUDUSD: 0.7760 (AUD 260m) 0.7800 (435m) 0.7825 (540m)
NZDUSD: 0.7000 (720m)
-
13:33
U.S. Stocks open: Dow +0.02%, Nasdaq -0.06%, S&P -0.08%
-
13:30
U.S. house prices rose in August, up 0.7 percent from the previous month
U.S. house prices rose in August, up 0.7 percent from the previous month, according to the Federal Housing Finance Agency (FHFA) seasonally adjusted monthly House Price Index (HPI). The previously reported 0.2 percent increase in July was revised upward to 0.4 percent. The FHFA monthly HPI is calculated using home sales price information from mortgages sold to, or guaranteed by, Fannie Mae and Freddie Mac.
From August 2016 to August 2017, house prices were up 6.6 percent. For the nine census divisions, seasonally adjusted monthly price changes from July 2017 to August 2017 ranged from -0.1 percent in the New England division to +1.4 percent in the Pacific division. The 12-month changes were all positive, ranging from +5.0 percent in the Middle Atlantic division to +9.3 percent in the Pacific division.
-
13:29
Before the bell: S&P futures -0.17%, NASDAQ futures -0.23%
U.S. stock-index futures fell as investors assessed latest batch of corporate earnings.
Global Stocks:
Nikkei 21,707.62 -97.55 -0.45%
Hang Seng 28,302.89 +147.92 +0.53%
Shanghai 3,398.30 +10.06 +0.30%
S&P/ASX 5,905.60 +7.98 +0.14%
FTSE 7,488.40 -38.14 -0.51%
CAC 5,403.90 +9.10 +0.17%
DAX 3,007.75 -5.44 -0.04%
Crude $52.22 (-0.48%)
Gold $1,273.20 (-0.40%)
-
13:01
U.S.: Housing Price Index, m/m, August 0.7% (forecast 0.4%)
-
13:00
Wall Street. Stocks before the bell
(company / ticker / price / change ($/%) / volume)
3M Co
MMM
234.45
-0.20(-0.09%)
1768
ALCOA INC.
AA
50
-0.08(-0.16%)
436
Amazon.com Inc., NASDAQ
AMZN
976.67
0.77(0.08%)
9332
Apple Inc.
AAPL
157.27
0.17(0.11%)
41215
AT&T Inc
T
34.26
-0.60(-1.72%)
1959606
Barrick Gold Corporation, NYSE
ABX
15.81
-0.04(-0.25%)
188488
Boeing Co
BA
264.93
-1.07(-0.40%)
118633
Caterpillar Inc
CAT
137.99
-0.25(-0.18%)
5713
Cisco Systems Inc
CSCO
34.74
0.16(0.46%)
26554
Citigroup Inc., NYSE
C
74.71
0.47(0.63%)
35917
Facebook, Inc.
FB
171.65
-0.15(-0.09%)
36069
Ford Motor Co.
F
12.17
-0.02(-0.16%)
26918
Freeport-McMoRan Copper & Gold Inc., NYSE
FCX
15.58
0.35(2.30%)
334624
General Electric Co
GE
21.81
-0.08(-0.37%)
169958
General Motors Company, NYSE
GM
45.8
-0.68(-1.46%)
143149
Goldman Sachs
GS
246.5
1.66(0.68%)
6290
Google Inc.
GOOG
970.55
0.01(0.00%)
549
Hewlett-Packard Co.
HPQ
21.75
-0.20(-0.91%)
208
Home Depot Inc
HD
166.1
0.07(0.04%)
1331
Intel Corp
INTC
41.03
0.08(0.20%)
22971
International Paper Company
IP
59.07
0.40(0.68%)
4004
Johnson & Johnson
JNJ
141.5
-0.14(-0.10%)
943
JPMorgan Chase and Co
JPM
101.7
0.78(0.77%)
31730
McDonald's Corp
MCD
163.8
-0.08(-0.05%)
2985
Microsoft Corp
MSFT
78.7
-0.16(-0.20%)
15069
Nike
NKE
53.67
0.25(0.47%)
1053
Pfizer Inc
PFE
36.15
-0.12(-0.33%)
1167
Procter & Gamble Co
PG
86.86
-0.12(-0.14%)
2141
Starbucks Corporation, NASDAQ
SBUX
54.09
-0.19(-0.35%)
2895
Tesla Motors, Inc., NASDAQ
TSLA
336.85
-0.49(-0.15%)
1510065
The Coca-Cola Co
KO
46.2
0.02(0.04%)
11773
Twitter, Inc., NYSE
TWTR
17.35
0.10(0.58%)
15093
Verizon Communications Inc
VZ
48.53
-0.41(-0.84%)
4825
Visa
V
109.4
0.99(0.91%)
194730
Wal-Mart Stores Inc
WMT
88
0.02(0.02%)
3719
Yandex N.V., NASDAQ
YNDX
32.56
-0.26(-0.79%)
1648
-
12:58
Analyst coverage initiations before the market open
Apple (AAPL) initiated with a Buy at HSBC Securities; target $193
-
12:57
Target price changes before the market open
United Tech (UTX) target raised to $124 at Stifel
Caterpillar (CAT) target raised to $145 from $125 at Stifel
Caterpillar (CAT) target raised to $143 from $120 at RBC Capital Mkts
3M Co. (MMM) target raised to $244 from $220 at Stifel
3M Co. target (MMM) raised to $209 at RBC Capital Mkts
General Motors (GM) target raised to $316 from $327 at RBC Capital Mkts
-
12:56
Downgrades before the market open
General Motors (GM) downgraded to Equal-Weight from Overweight at Morgan Stanley
-
12:55
Upgrades before the market open
3M Co. (MMM) upgraded to Neutral from Sell at Goldman; target raised to $229 from $194
-
12:40
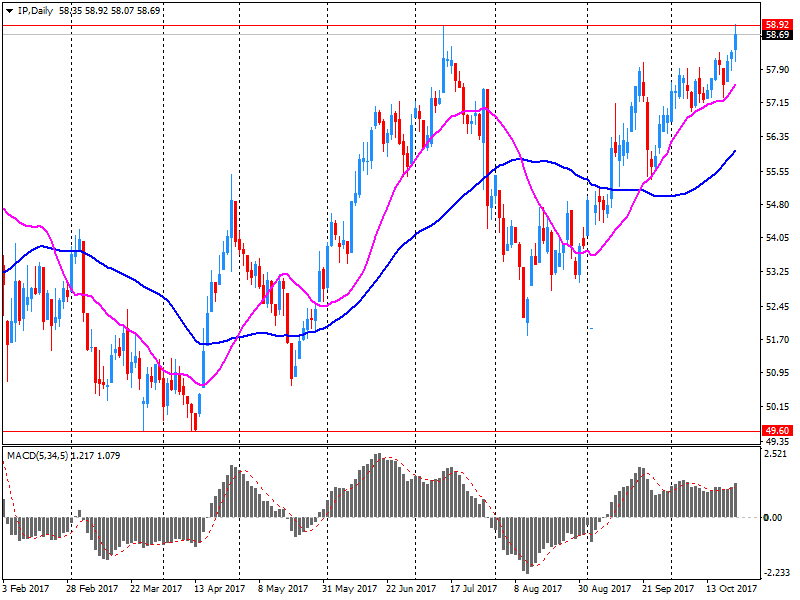
Company News: Int'l Paper (IP) quarterly earnings beat analysts’ estimate
Int'l Paper (IP) reported Q3 FY 2017 earnings of $1.08 per share (versus $0.91 in Q3 FY 2016), beating analysts' consensus estimate of $1.05.
The company's quarterly revenues amounted to $5.913 bln (+12.3% y/y), generally in-line with analysts' consensus estimate of $5.854 bln.
IP traded at $58.67 (0.00%) in pre-market trading.
-
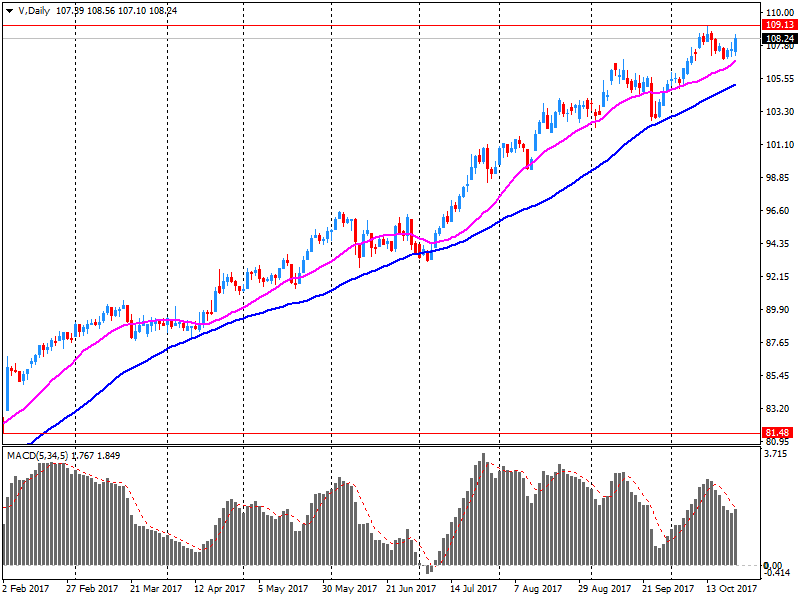
12:36
Company News: Visa (V) quarterly results beat analysts’ forecasts
Visa (V) reported Q4 FY 2017 earnings of $0.90 per share (versus $0.78 in Q4 FY 2016), beating analysts' consensus estimate of $0.85.
The company's quarterly revenues amounted to $4.855 bln (+13.9% y/y), beating analysts' consensus estimate of $4.630 bln.
V rose to $109.25 (+0.77%) in pre-market trading.
-
12:33
US durable goods orders rose more than expected in September
New orders for manufactured durable goods in September increased $5.1 billion or 2.2 percent to $238.7 billion, the U.S. Census Bureau announced today. This increase, up three of the last four months, followed a 2.0 percent August increase. Excluding transportation, new orders increased 0.7 percent. Excluding defense, new orders increased 2.0 percent. Transportation equipment, also up three of the last four months, led the increase, $4.0 billion or 5.1 percent to $81.2 billion.
Shipments of manufactured durable goods in September, up four of the last five months, increased $2.4 billion or 1.0 percent to $240.5 billion. This followed a 0.7 percent August increase. Transportation equipment, up two of the last three months, led the increase, $1.1 billion or 1.4 percent to $79.7 billion.
-
12:30
U.S.: Durable Goods Orders ex Transportation , September 0.7% (forecast 0.5%)
-
12:30
U.S.: Durable goods orders ex defense, September 2.0%
-
12:30
U.S.: Durable Goods Orders , September 2.2% (forecast 1.0%)
-
12:22
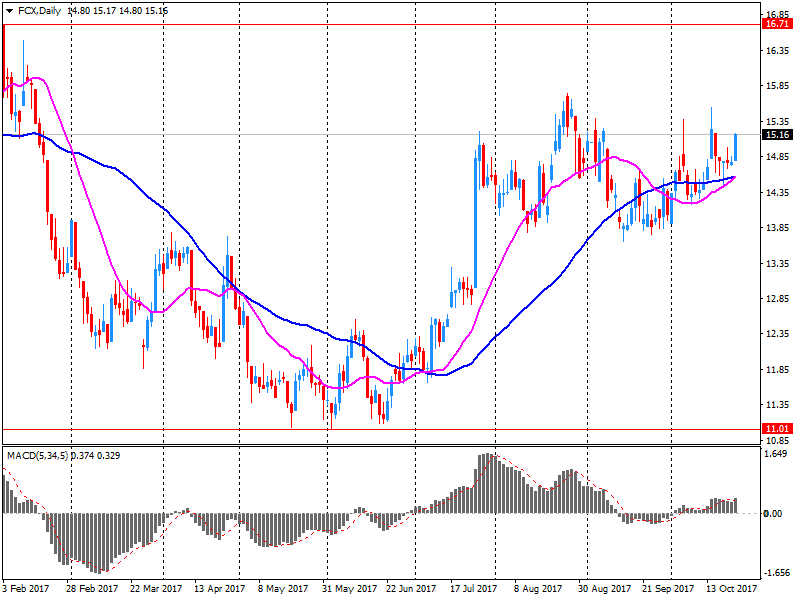
Company News: Freeport-McMoRan (FCX) quarterly results beat analysts’ estimate
Freeport-McMoRan (FCX) reported Q3 FY 2017 earnings of $0.34 per share (versus $0.13 in Q3 FY 2016), beating analysts' consensus estimate of $0.31.
The company's quarterly revenues amounted to $4.310 bln (+11.2% y/y), beating analysts' consensus estimate of $4.056 bln.
FCX rose to $15.58 (+2.30%) in pre-market trading.
-
12:15
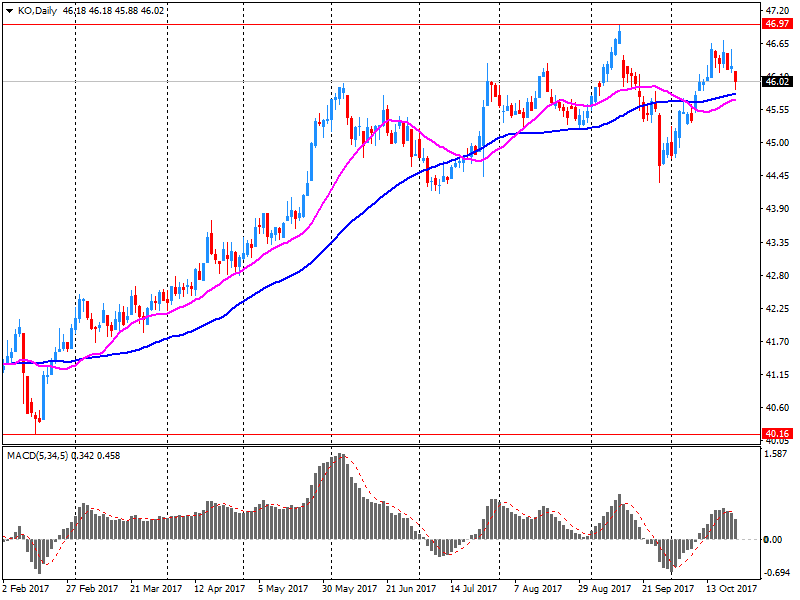
Company News: Coca-Cola (KO) quarterly results beat analysts’ expectations
Coca-Cola (KO) reported Q3 FY 2017 earnings of $0.50 per share (versus $0.49 in Q3 FY 2016), beating analysts' consensus estimate of $0.49.
The company's quarterly revenues amounted to $9.078 bln (-14.6% y/y), beating analysts' consensus estimate of $8.727 bln.
KO fell to $45.98 (-0.43%) in pre-market trading.
-
12:08
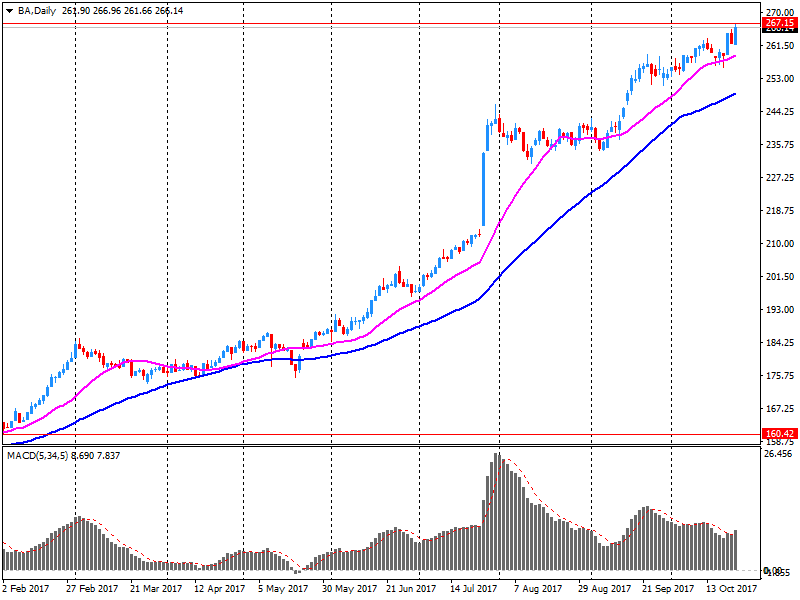
Company News: Boeing (BA) quarterly earnings beat analysts’ forecasts
Boeing (BA) reported Q3 FY 2017 earnings of $2.72 per share (versus $3.51 in Q3 FY 2016), beating analysts' consensus estimate of $2.66.
The company's quarterly revenues amounted to $24.309 bln (+1.7% y/y), generally in-line with analysts' consensus estimate of $24.090 bln.
The company also issued raised guidance for FY2017 EPS of $9.90-10.10 (up from prior $9.80-10.00) versus analysts' consensus estimate of $10.03.
BA fell to $264.00 (-0.75%) in pre-market trading.
-
12:07
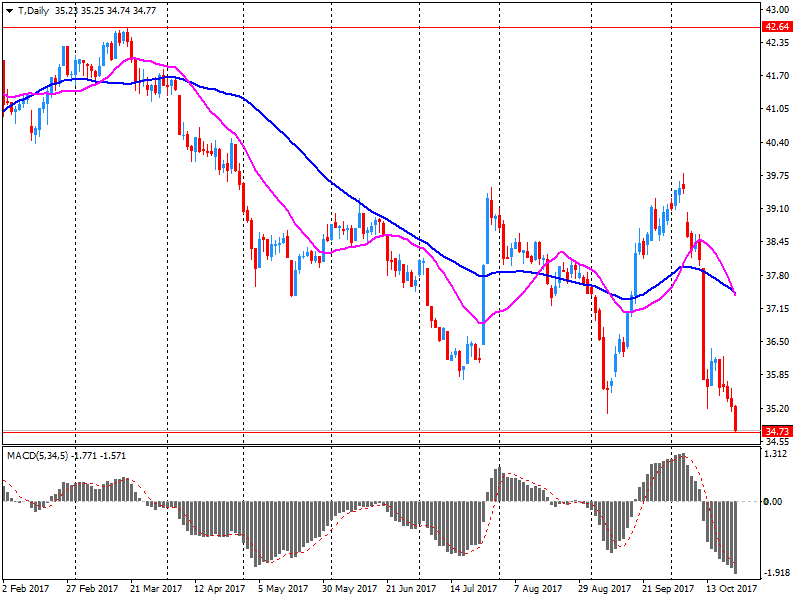
Company News: AT&T (T) quarterly results miss analysts’ estimates
AT&T (T) reported Q3 FY 2017 earnings of $0.74 per share (versus $0.74 in Q3 FY 2016), missing analysts' consensus estimate of $0.75.
The company's quarterly revenues amounted to $39.668 bln (-3.0% y/y), missing analysts' consensus estimate of $40.335 bln.
T fell to $34.12 (-2.12%) in pre-market trading.
-
10:55
UK's Brexit minister Davis says my hunch is EU withdrawal agreement will come at same time as agreement on forward trade relationship
-
10:02
UK five-year gilt yields rise to highest since june 2016 Brexit vote at 0.852 pct, up 5 bps on day, as gilt prices slide after Q3 GDP data
-
09:24
UK Brexit Sec. Davis: in total no deal scenario, Britain may not pay any money to the EU after it leaves @livesquawk
-
09:23
Brexit minister David Davis says what we're looking for after Brexit is tariff-free access to single market for goods and as much as possible tariff-free access for services
-
09:01
UK services output increased by 0.4% compared with the three months ending May
In the three months to August 2017, services output increased by 0.4% compared with the three months ending May 2017.
Computer programming and retail trade made the largest contributions to the three-month on three-month growth; contributing 0.10 and 0.08 respectively.
The Index of Services increased by 0.2% between July and August 2017.
The largest contribution to the month-on-month increase came from the business services and finance sector, which contributed 0.12 percentage points.
Retail trade and motion pictures made the largest contributions at industry level to the month-on-month increase, with both contributing 0.06 percentage points.
In the three months to August 2017, services output increased by 1.7% compared with the three months ending August 2016.
-
08:34
UK GDP rose more than expected in Q3. GBP/USD up 50 pips after the news
UK gross domestic product (GDP) was estimated to have increased by 0.4% in Quarter 3 (July to Sept) 2017, a similar rate of growth to the previous two quarters.
Services increased by 0.4%, the same rate as Quarter 2 (Apr to June) 2017 and remains the largest contributor to GDP growth, with a strong performance in computer programming, motor trades and retail trade.
Manufacturing returned to growth after a weak Quarter 2 2017, increasing by 1.0% in Quarter 3 2017.
Construction has contracted for the second quarter in a row, although the industry still remains well above its pre-downturn peak.
GDP per head was estimated to have increased by 0.3% during Quarter 3 2017.
-
08:30
United Kingdom: GDP, q/q, Quarter III 0.4% (forecast 0.3%)
-
08:30
United Kingdom: GDP, y/y, Quarter III 1.5% (forecast 1.4%)
-
08:30
United Kingdom: BBA Mortgage Approvals, September 41.584 (forecast 41.800)
-
08:00
Germany: IFO - Expectations , October 109.1 (forecast 107.3)
-
08:00
Germany: IFO - Current Assessment , October 124.8 (forecast 123.5)
-
08:00
Germany: IFO - Business Climate, October 116.7 (forecast 115.2)
-
07:50
Spain's PM says application of article 155 aims to avoid further economic consequences of catalan independence push
-
07:37
Major exchanges in Europe trading in the red zone: FTSE 7512.84 -13.70 -0.18%, DAX 12994.57 -18.62 -0.14%, CAC 5385.56 -9.24 -0.17%
-
06:49
Options levels on wednesday, October 25, 2017
EUR/USD
Resistance levels (open interest**, contracts)
$1.1890 (3367)
$1.1831 (1321)
$1.1796 (406)
Price at time of writing this review: $1.1760
Support levels (open interest**, contracts):
$1.1715 (2963)
$1.1691 (3000)
$1.1662 (4926)
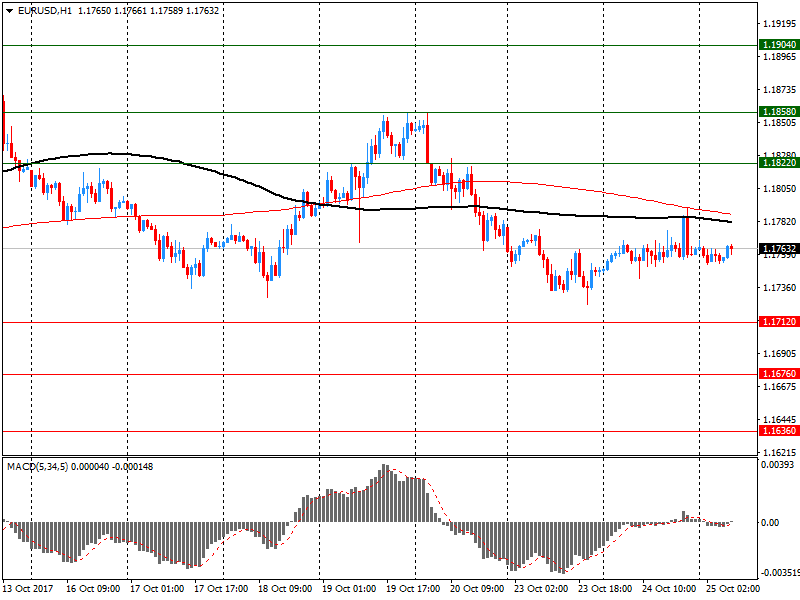
Comments:
- Overall open interest on the CALL options and PUT options with the expiration date November, 3 is 101590 contracts (according to data from October, 24) with the maximum number of contracts with strike price $1,2000 (6678);
GBP/USD
Resistance levels (open interest**, contracts)
$1.3259 (3869)
$1.3211 (2382)
$1.3168 (1050)
Price at time of writing this review: $1.3117
Support levels (open interest**, contracts):
$1.3075 (2295)
$1.3046 (1698)
$1.3012 (2034)
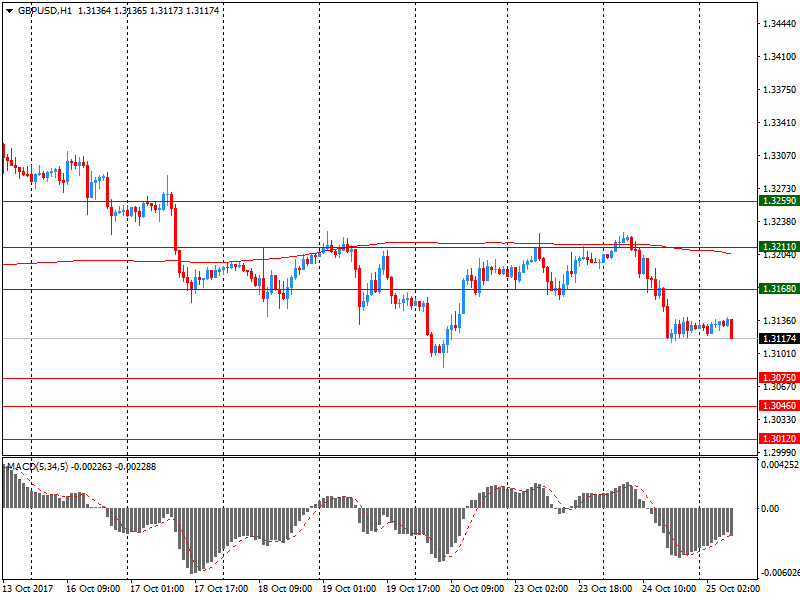
Comments:
- Overall open interest on the CALL options with the expiration date November, 3 is 40268 contracts, with the maximum number of contracts with strike price $1,3200 (3869);
- Overall open interest on the PUT options with the expiration date November, 3 is 35550 contracts, with the maximum number of contracts with strike price $1,3000 (3140);
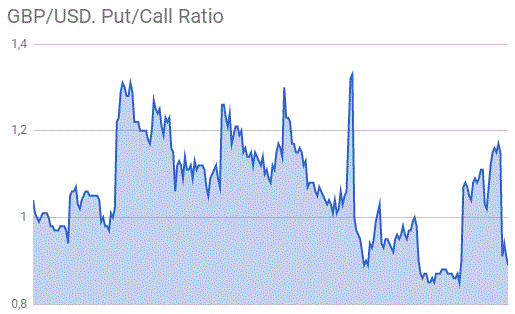
- The ratio of PUT/CALL was 0.88 versus 0.89 from the previous trading day according to data from October, 24
* - The Chicago Mercantile Exchange bulletin (CME) is used for the calculation.
** - Open interest takes into account the total number of option contracts that are open at the moment.
-
06:45
Eurostoxx 50 futures down 0.2 pct, DAX futures down 0.2 pct, CAC 40 futures flat, FTSE futures down 0.3 pct, IBEX futures down 0.3 pct
-
06:44
Canada 2017 growth forecast 3.1 pct (vs 2.0 pct seen in march); 2018 growth forecast 2.1 pct (vs 2.0 pct seen in march) - Finance minister
-
2017-18 federal debt-to-gdp ratio at 30.6 pct vs 31.6 pct in march
-
Budget deficit expected to be CAD 18.6 bln compared to CAD 27.4 bln forecast in march; includes CAD 3 bln for risk adjustment
-
-
06:42
New Zealand's prime minister-designate Jacinda Ardern says Winston Peters to become foreign minister
-
06:34
U.S. 10-year treasury yield at 2.419 pct vs U.S. close of 2.406 pct on Tuesday
-
06:32
Australian CPI rose less than expected in Q3
The all groups CPI:
-
Rose 0.6% this quarter, compared with a rise of 0.2% in the june quarter 2017.
-
Rose 1.8% over the twelve months to the september quarter 2017, compared with a rise of 1.9% over the twelve months to the june quarter 2017.
Overview of cpi movements:
-
The most significant price rises this quarter are electricity (+8.9%), tobacco (+4.1%), international holiday travel and accommodation (+4.1%) and new dwelling purchase by owner-occupiers (+0.8%).
-
The most significant offsetting price falls this quarter are vegetables (-10.9%), automotive fuel (-2.3%) and telecommunication equipment and services (-1.5%).
-
-
06:00
Switzerland: UBS Consumption Indicator, September 1.56
-
05:27
Global Stocks
A pan-European stock benchmark closed lower Tuesday after two days of gains, weighed down by earnings-driven drops for Swedish miner Boliden AB and hospitality chain Whitbread PLC. National equity gauges for Europe's biggest economies edged higher, as data showed a slowing in the eurozone economy ahead of a closely watched European Central Bank meeting later in the week.
U.S. stocks closed higher on Tuesday, with the Dow ending in record territory, supported by earnings results that continued to come in ahead of expectations. Both Caterpillar and 3M boosted the blue-chip average's advance, while broader gains were limited by declines in health-care shares.
Major indexes in Asia were narrowly mixed on Wednesday, following Wall Street's stronger lead, as investors also awaited the unveiling of China's new leadership line-up. The Nikkei 225 rose 0.17 percent as the dollar held onto overnight gains. The benchmark index is rising high after notching its 16th straight winning session on Tuesday - its longest ever win streak.
-
00:30
Australia: Trimmed Mean CPI q/q, Quarter III 0.4% (forecast 0.5%)
-
00:30
Australia: CPI, q/q, Quarter III 0.6% (forecast 0.8%)
-
00:30
Australia: Trimmed Mean CPI y/y, Quarter III 1.8% (forecast 2.0%)
-
00:30
Australia: CPI, y/y, Quarter III 1.8% (forecast 2%)
-