- AUD/USD 4H TIME FRAME CHART
Noticias del mercado
9 noviembre 2017
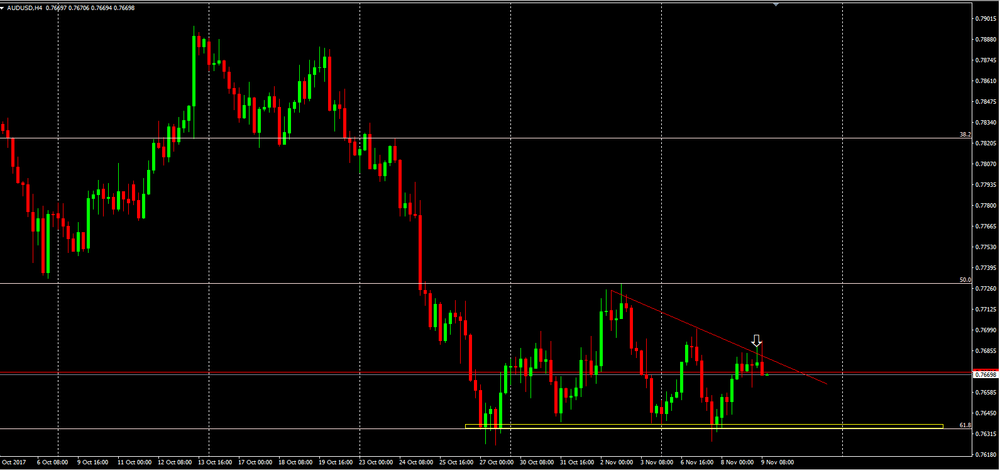
AUD/USD 4H TIME FRAME CHART
As we can see on 4 hours time frame chart, the price has been created a downside trend line.
During the night of today it was possible to see that the price has tested the trend line several times which means that the price can start a new bearish movement until 0.7638 which is our support level (yellow line).
Besides that, if the price breaks that support level so we can expect a bigger depreciation of Australian dollar.
Enfoque del mercado
Abrir cuenta demo y página personal