- USTECH 100 Daily time frame chart
Noticias del mercado
11 diciembre 2017
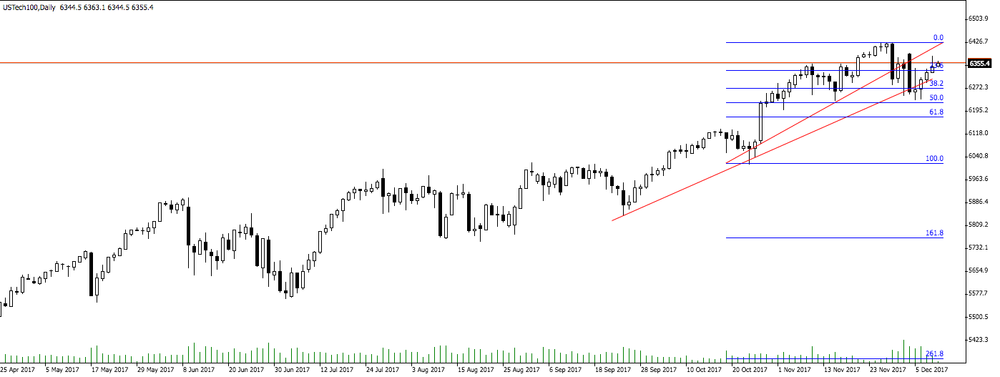
USTECH 100 Daily time frame chart
USTECH 100 is starting a new bullish movement, as we mentioned last week that it could happen.
The set-up still valid, however, the price might have some difficult in break above the resistance level near to 6425.
Enfoque del mercado
Abrir cuenta demo y página personal