- Nikkei 225 Daily time frame chart
Noticias del mercado
21 diciembre 2017
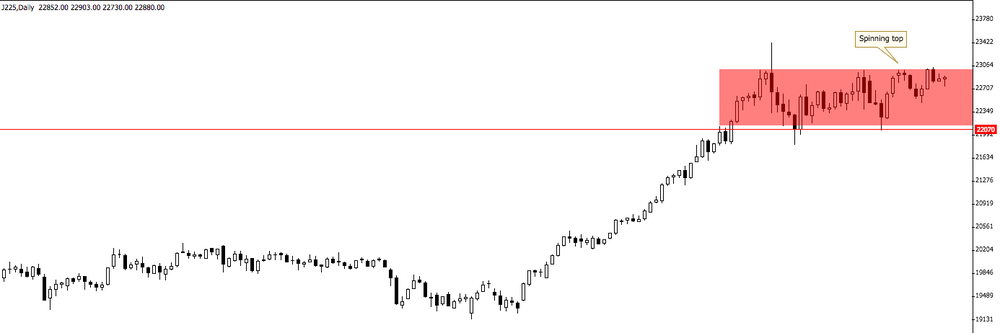
Nikkei 225 Daily time frame chart
On daily time frame chart, we can see that the price is stuck in a consolidation zone.
We also can see that the price didn't respect the candlestick pattern.
However, if it keeps rejects the top of the consolidation then it can be possible to see the price falling to the bottom of the consolidation.
Enfoque del mercado
Abrir cuenta demo y página personal