- Gold Price Forecast: XAU/USD juggles around $1,810 as focus shifts to Fed policy
Noticias del mercado
Gold Price Forecast: XAU/USD juggles around $1,810 as focus shifts to Fed policy
- Gold price is hovering around $1,810.00 as investors await Fed’s policy for fresh impetus.
- S&P500 soared as a consecutive decline in US inflation faded recession fears.
- The US Dollar Index (DXY) is struggling to sustain above the 104.00 resistance as odds favor a smaller Fed rate hike.
Gold price (XAU/USD) is juggling around the immediate support of $1,810.00 in the Tokyo session. The precious metal has corrected after printing a fresh five-month high at $1,824.51 on Tuesday. Fresh blood was infused in Gold price after the release of a soft inflation report for November month.
The US Dollar Index (DXY) is struggling to sustain above the 104.00 resistance as a slowdown in inflationary pressures has cemented expectations of a smaller rate hike by the Fed. Fed policymakers were already advocating for a deceleration in the interest rate hike pace after the soft October inflation report. Now, a consecutive significant slowdown in inflation has bolstered the chances of adopting a less-hawkish approach toward the monetary policy.
The risk-appetite theme after a decline in price pressures strengthened S&P500. Futures of the 500-US stock basket are expected to accelerate further as recession fears have faded to a greater extent. Also, the 10-year US Treasury yields have dropped to near 3.50%.
A note from Commerzbank dictates that “The 50 basis points hike, which is generally expected for tomorrow's FOMC meeting, can be considered almost certain after today's data.” We continue to assume that the Fed will reduce the size of the rate hikes again at the beginning of 2023, moving by only 25 bps in February and March.
Gold technical analysis
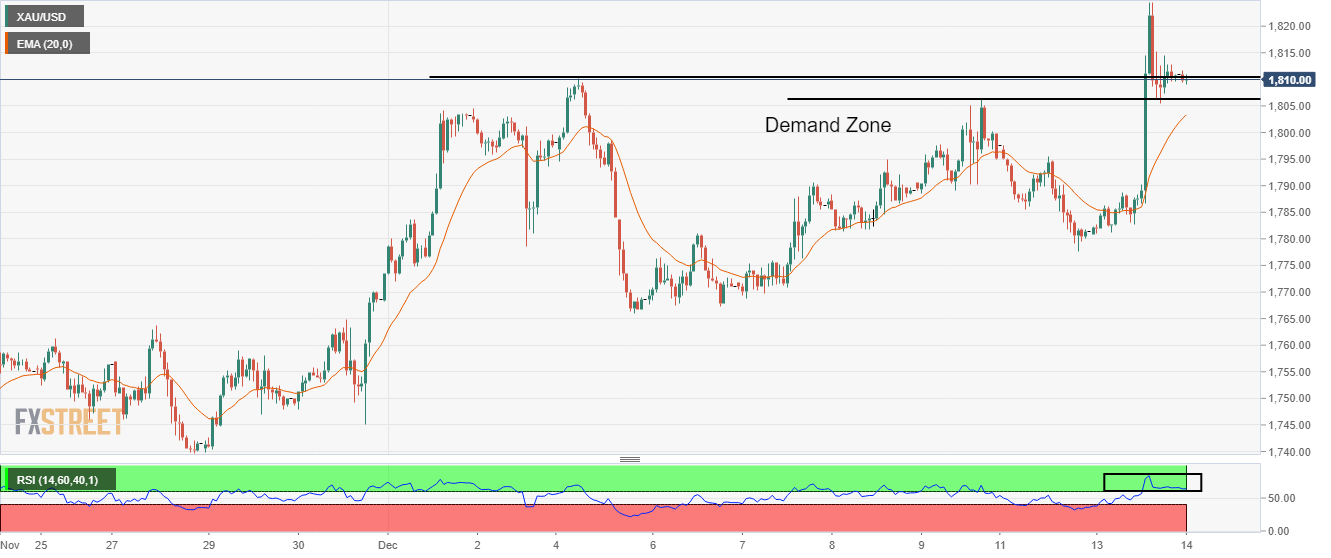
On an hourly scale, Gold price has corrected to near the demand zone placed in a narrow range of $1,806-1,810. The 20-period Exponential Moving Average (EMA) at $1803.60 will act as a major cushion for Gold price. Meanwhile, the Relative Strength Index (RSI) (14) has shifted into the bullish range of 60.00-80.00, which indicates that the bullish momentum is active.
Gold hourly chart