- GBP/USD Price Analysis: Climbs to 11-month highs, as buyers eye 1.2600
Noticias del mercado
GBP/USD Price Analysis: Climbs to 11-month highs, as buyers eye 1.2600
- The GBP/USD bounced off daily lows at 1.2446 and reclaimed 1.2500.
- GBP/USD Price Analysis: Bullish above 1.2500, with buyers eyeing the 200-week EMA above 1.2800.
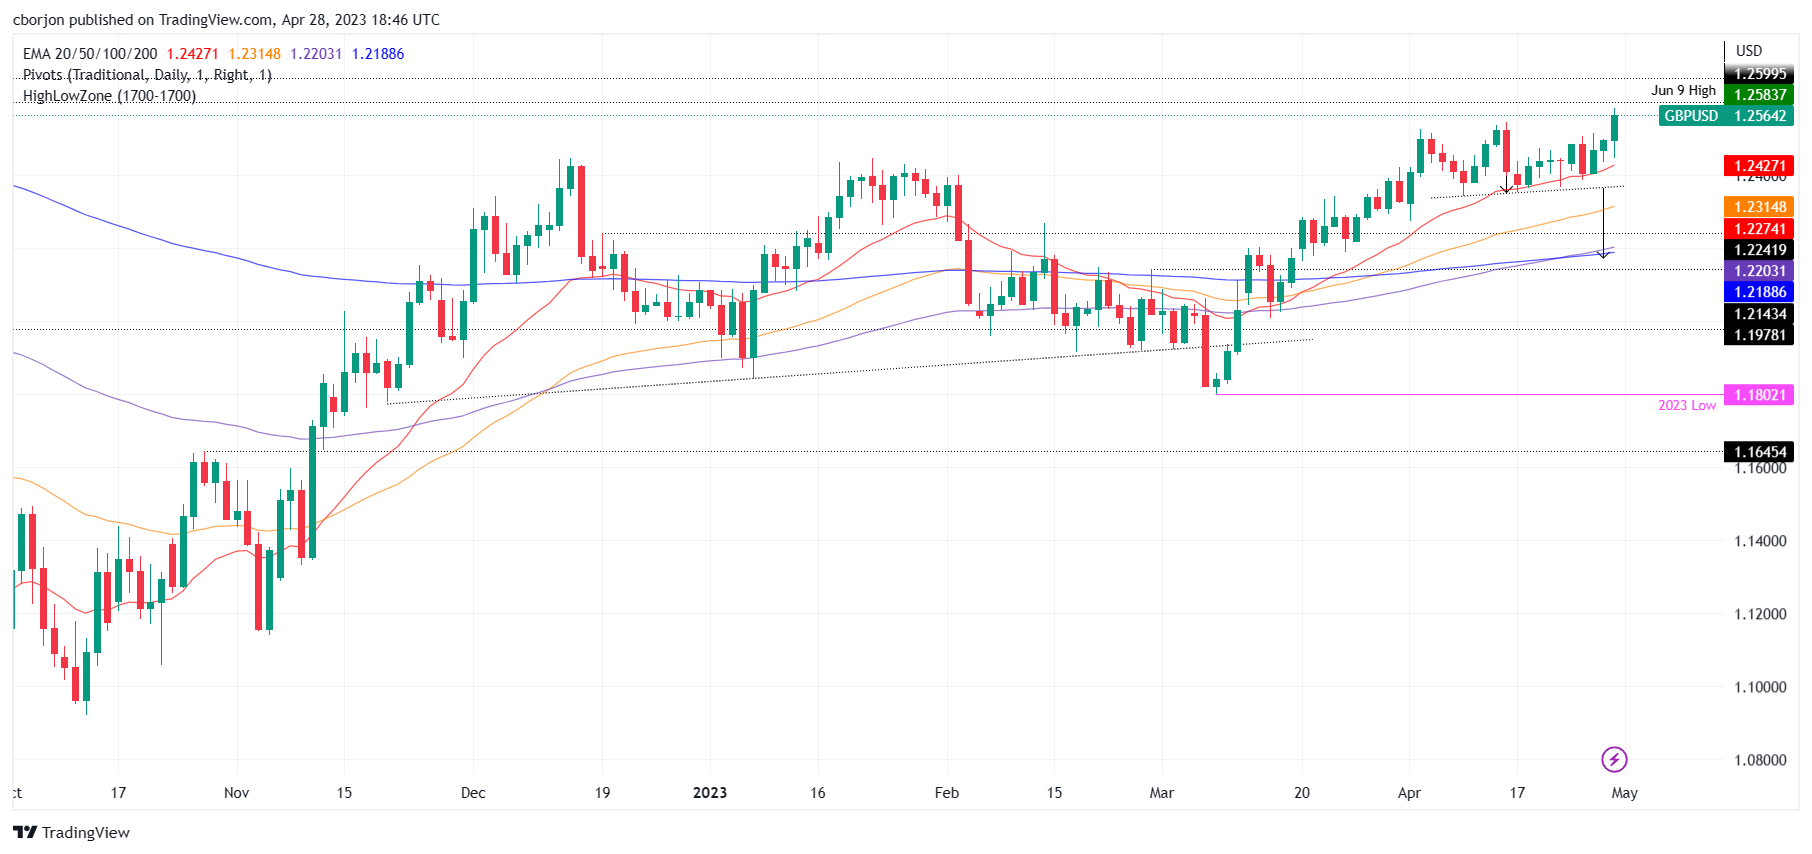
The GBP/USD soared to fresh YTD highs at 1.2583 despite fundamental news from the United States (US) increasing the likelihood of a Federal Reserve 25 bps rate hike. Therefore, the GBP/USD is trading at 1.2571, above its opening price by 0.61%.
GBP/USD Price Action
The GBP/USD daily chart remains upward-biased from a technical perspective. After dipping to the 20-day EMA at 1.2477, the GBP/USD surged past the 1.2500 mark, despite the US Dollar (USD) strengthening after high inflation data.
The Relative Strength Index (RSI) indicator is still in bullish territory and aims higher, justifying higher GBP/USD prices. If GBP/USD cracks the 1.2600 figure, it would be cheered by buyers, which will set their eyes on the 200-week EMA at 1.2817.
Conversely, if the GBP/USD tumbles below 1.2500, that will expose the 20-day EMA at 1.2427, followed by 1.2400. A breach of the latter will expose the 50-day EMA at 1.2315, followed by the 1.2300 figure ahead of the confluence of the 200/100-day EMAs, each at 1.2188/1.2203, respectively.
GBP/USD Daily Chart