- AUD/JPY Price Forecast: Tests 93.00 support, eyes on descending channel’s lower boundary
Noticias del mercado
AUD/JPY Price Forecast: Tests 93.00 support, eyes on descending channel’s lower boundary
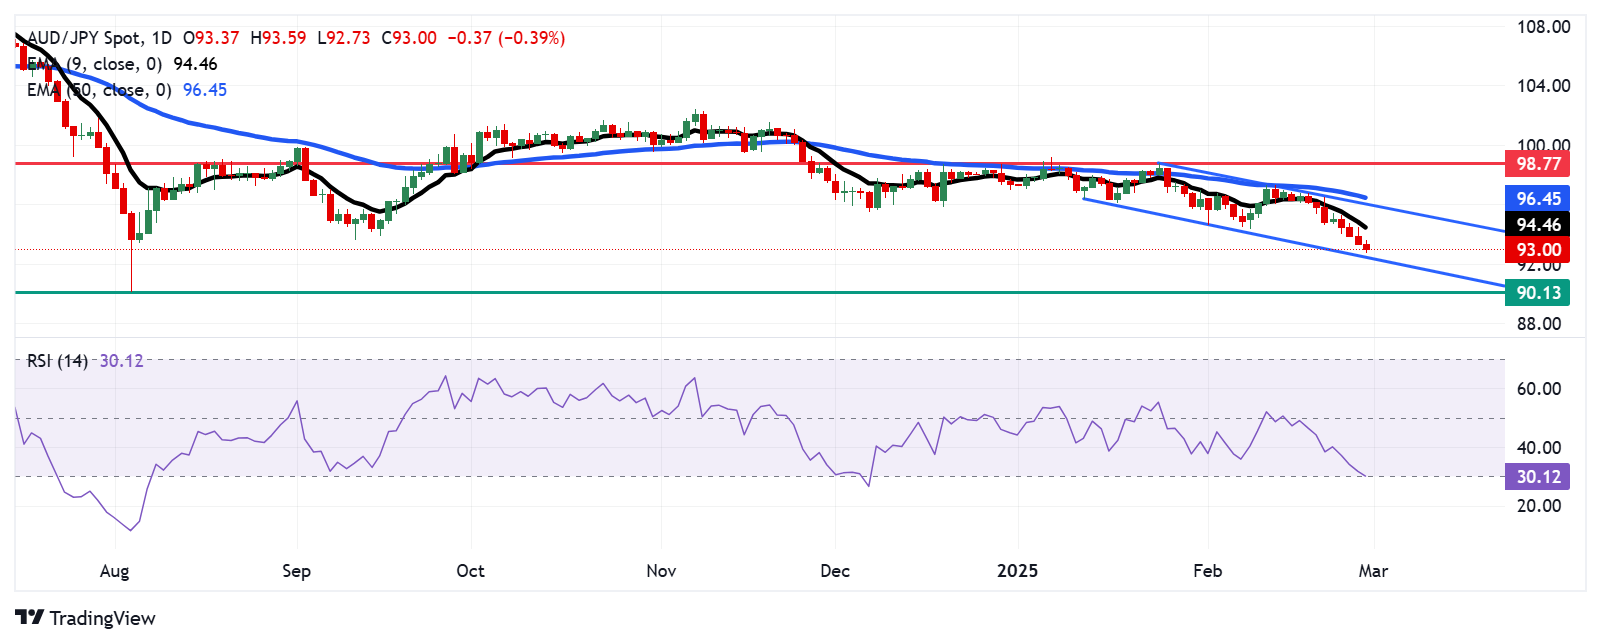
- AUD/JPY could target the lower boundary of the descending channel after a successful break below the 93.00 level.
- The 14-day RSI is positioned on the 30 mark, signaling an oversold condition and suggesting a potential upward correction.
- The pair could find the primary barrier at the nine-day EMA of 94.46.
AUD/JPY remains tepid for the fourth successive session, trading around 93.00 during the Asian hours on Friday. A review of the daily chart shows the currency cross moving downwards within a descending channel pattern, indicating the strengthening bearish bias.
The 14-day Relative Strength Index (RSI) sits at the 30 level, signaling an oversold condition and a potential upward correction in the near term. Additionally, the AUD/JPY cross remains below the nine-day Exponential Moving Average (EMA), highlighting weak short-term price momentum.
The AUD/JPY cross tests the immediate support at the 93.00 level, followed by the lower boundary of the descending channel at 92.50. A break below the channel could reinforce the bearish bias and put downward pressure on the currency cross to navigate the region around 90.13, the lowest since May 2023, last seen on August 5, 2024.
On the upside, the AUD/JPY cross could target the primary barrier at the nine-day EMA of 94.46. A break above this level could improve the short-term price momentum and support the pair to approach the upper boundary of the descending channel at the psychological level of 96.00, followed by the 50-day EMA at 96.45.
AUD/JPY: Daily Chart

Australian Dollar PRICE Today
The table below shows the percentage change of Australian Dollar (AUD) against listed major currencies today. Australian Dollar was the weakest against the US Dollar.
| USD | EUR | GBP | JPY | CAD | AUD | NZD | CHF | |
|---|---|---|---|---|---|---|---|---|
| USD | 0.18% | 0.25% | 0.00% | -0.02% | 0.40% | 0.63% | 0.02% | |
| EUR | -0.18% | 0.07% | -0.19% | -0.19% | 0.21% | 0.44% | -0.17% | |
| GBP | -0.25% | -0.07% | -0.24% | -0.26% | 0.15% | 0.38% | -0.25% | |
| JPY | 0.00% | 0.19% | 0.24% | 0.00% | 0.40% | 0.62% | -0.01% | |
| CAD | 0.02% | 0.19% | 0.26% | -0.01% | 0.40% | 0.64% | 0.00% | |
| AUD | -0.40% | -0.21% | -0.15% | -0.40% | -0.40% | 0.23% | -0.39% | |
| NZD | -0.63% | -0.44% | -0.38% | -0.62% | -0.64% | -0.23% | -0.63% | |
| CHF | -0.02% | 0.17% | 0.25% | 0.00% | -0.00% | 0.39% | 0.63% |
The heat map shows percentage changes of major currencies against each other. The base currency is picked from the left column, while the quote currency is picked from the top row. For example, if you pick the Australian Dollar from the left column and move along the horizontal line to the US Dollar, the percentage change displayed in the box will represent AUD (base)/USD (quote).