Noticias del mercado
-
23:57
USD/CAD trades with mild losses near 1.4300 as tariff worries ease
- USD/CAD trades with mild negative bias around 1.4315 in Wednesday’s late Amercian session.
- Canada posts its first trade surplus in 10 months in December as exports continue to expand.
- US ISM Services PMI eased to 52.8 in January vs. 54.3 expected.
The USD/CAD pair posts modest losses near 1.4315 during the late American session on Wednesday. The Canadian Dollar (CAD) edges higher as Canada's trade balance shifted into surplus and US President Donald Trump delayed his orders to impose 25% tariffs on Canada for 30 days.
Canada in December reported its first trade surplus in ten months, with exports outpacing imports due to US businesses building up inventory ahead of potential tariffs, supporting the Loonie. Additionally, US tariffs provided relief from the looming trade war threat. Trump on Monday agreed to a 30-day pause on his tariff threats against Mexico and Canada as trading partners took steps to appease his concerns about border security and drug trafficking.
"Tariff worries are easing - for now, at least - which is allowing the CAD to stabilize,” said Shaun Osborne, chief currency strategist at Scotiabank. "Unless trade talks deteriorate significantly again, there is a chance that the USD-CAD peak reached Monday near 1.48 will represent a significant high-water mark for spot,” added Osborne.
Data released by the Institute for Supply Management (ISM) on Wednesday showed that the US Services Purchasing Managers' Index (PMI) declined to 52.8 in January from 54.0 (revised from 54.1) in December. This reading came in weaker than the estimation of 54.3.
The US Dollar (USD) weakens in an immediate reaction to the downbeat US economic data. The US labor market data on Friday will be in the spotlight. In case of the stronger-than-expected outcome, this could boost the Greenback against the CAD in the near term.Canadian Dollar FAQs
The key factors driving the Canadian Dollar (CAD) are the level of interest rates set by the Bank of Canada (BoC), the price of Oil, Canada’s largest export, the health of its economy, inflation and the Trade Balance, which is the difference between the value of Canada’s exports versus its imports. Other factors include market sentiment – whether investors are taking on more risky assets (risk-on) or seeking safe-havens (risk-off) – with risk-on being CAD-positive. As its largest trading partner, the health of the US economy is also a key factor influencing the Canadian Dollar.
The Bank of Canada (BoC) has a significant influence on the Canadian Dollar by setting the level of interest rates that banks can lend to one another. This influences the level of interest rates for everyone. The main goal of the BoC is to maintain inflation at 1-3% by adjusting interest rates up or down. Relatively higher interest rates tend to be positive for the CAD. The Bank of Canada can also use quantitative easing and tightening to influence credit conditions, with the former CAD-negative and the latter CAD-positive.
The price of Oil is a key factor impacting the value of the Canadian Dollar. Petroleum is Canada’s biggest export, so Oil price tends to have an immediate impact on the CAD value. Generally, if Oil price rises CAD also goes up, as aggregate demand for the currency increases. The opposite is the case if the price of Oil falls. Higher Oil prices also tend to result in a greater likelihood of a positive Trade Balance, which is also supportive of the CAD.
While inflation had always traditionally been thought of as a negative factor for a currency since it lowers the value of money, the opposite has actually been the case in modern times with the relaxation of cross-border capital controls. Higher inflation tends to lead central banks to put up interest rates which attracts more capital inflows from global investors seeking a lucrative place to keep their money. This increases demand for the local currency, which in Canada’s case is the Canadian Dollar.
Macroeconomic data releases gauge the health of the economy and can have an impact on the Canadian Dollar. Indicators such as GDP, Manufacturing and Services PMIs, employment, and consumer sentiment surveys can all influence the direction of the CAD. A strong economy is good for the Canadian Dollar. Not only does it attract more foreign investment but it may encourage the Bank of Canada to put up interest rates, leading to a stronger currency. If economic data is weak, however, the CAD is likely to fall.
-
23:33
USD/JPY Price Forecast: Turns bearish, breaches Ichimoku Cloud and 200-DMA
- USD/JPY sinks 1.13%, falling sharply to 152.59 as it moves decisively below the 200-day SMA and Kumo.
- Potential recovery hinges on reclaiming the 153.00 level, with resistance near the Kumo's lower edge at 153.35/40.
- Continued downtrend could target longer-term supports at December lows of 149.36 and 148.65.
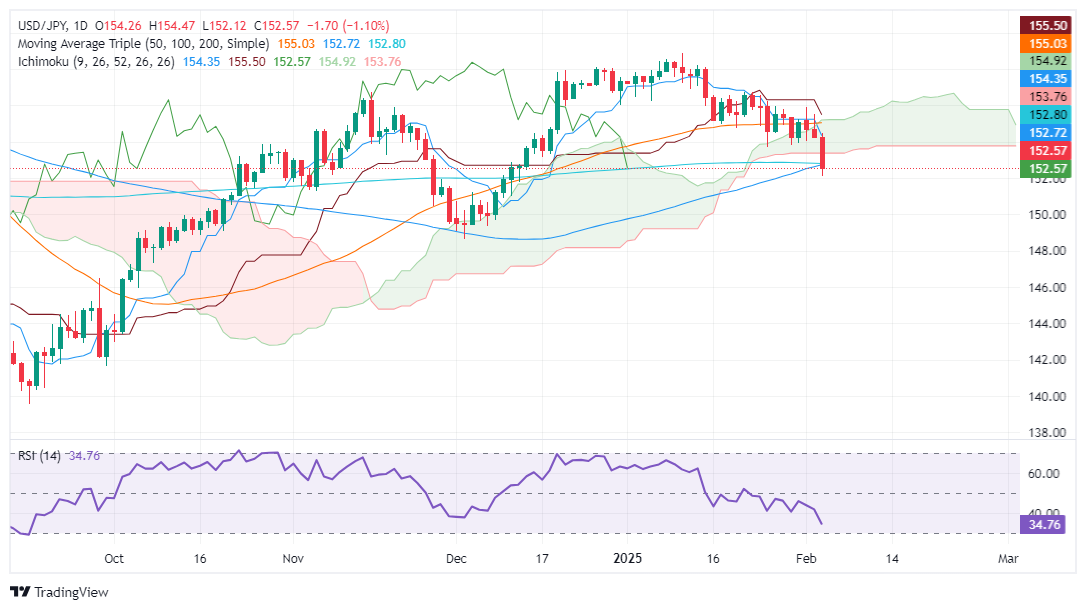
The USD/JPY plummeted 175 pips on Wednesday, posting losses of over 1.13% as the pair cleared the Ichimoku Cloud (Kumo). This cements the pair's downtrend, with the Japanese Yen (JPY) set to appreciate in the short term. At the time of writing, the pair trades at 152.59.
USD/JPY Price Forecast: Technical outlook
Bears stepped in on Wednesday, pushing the USD/JPY below the Kumo and breaching the 200-day Simple Moving Average (SMA) at 152.80. This has opened the door for further downside.
Despite this, a leg-up is on the cards, if buyers clear the 153.00 figure, which could pave the way to test the bottom of the Kumo at 153.35/40, offering sellers a better entry price. However, if it surpassed, the next resistance would be the 154.00 mark, followed by the February 5 high at 154.46.
If the downtrend continues, the USD/JPY first support would be the December 6 low of 149.36, followed by the December 3 low of 148.65.
USD/JPY Price Chart – Daily
Japanese Yen PRICE Today
The table below shows the percentage change of Japanese Yen (JPY) against listed major currencies today. Japanese Yen was the strongest against the Australian Dollar.
USD EUR GBP JPY CAD AUD NZD CHF USD 0.02% -0.01% -0.09% -0.00% 0.04% 0.04% 0.00% EUR -0.02% -0.03% -0.10% -0.02% 0.04% 0.03% -0.04% GBP 0.01% 0.03% -0.10% 0.01% 0.03% 0.07% 0.00% JPY 0.09% 0.10% 0.10% 0.07% 0.12% 0.10% 0.11% CAD 0.00% 0.02% -0.01% -0.07% 0.03% 0.05% 0.01% AUD -0.04% -0.04% -0.03% -0.12% -0.03% -0.01% -0.05% NZD -0.04% -0.03% -0.07% -0.10% -0.05% 0.01% -0.03% CHF -0.01% 0.04% -0.01% -0.11% -0.01% 0.05% 0.03% The heat map shows percentage changes of major currencies against each other. The base currency is picked from the left column, while the quote currency is picked from the top row. For example, if you pick the Japanese Yen from the left column and move along the horizontal line to the US Dollar, the percentage change displayed in the box will represent JPY (base)/USD (quote).
-
23:02
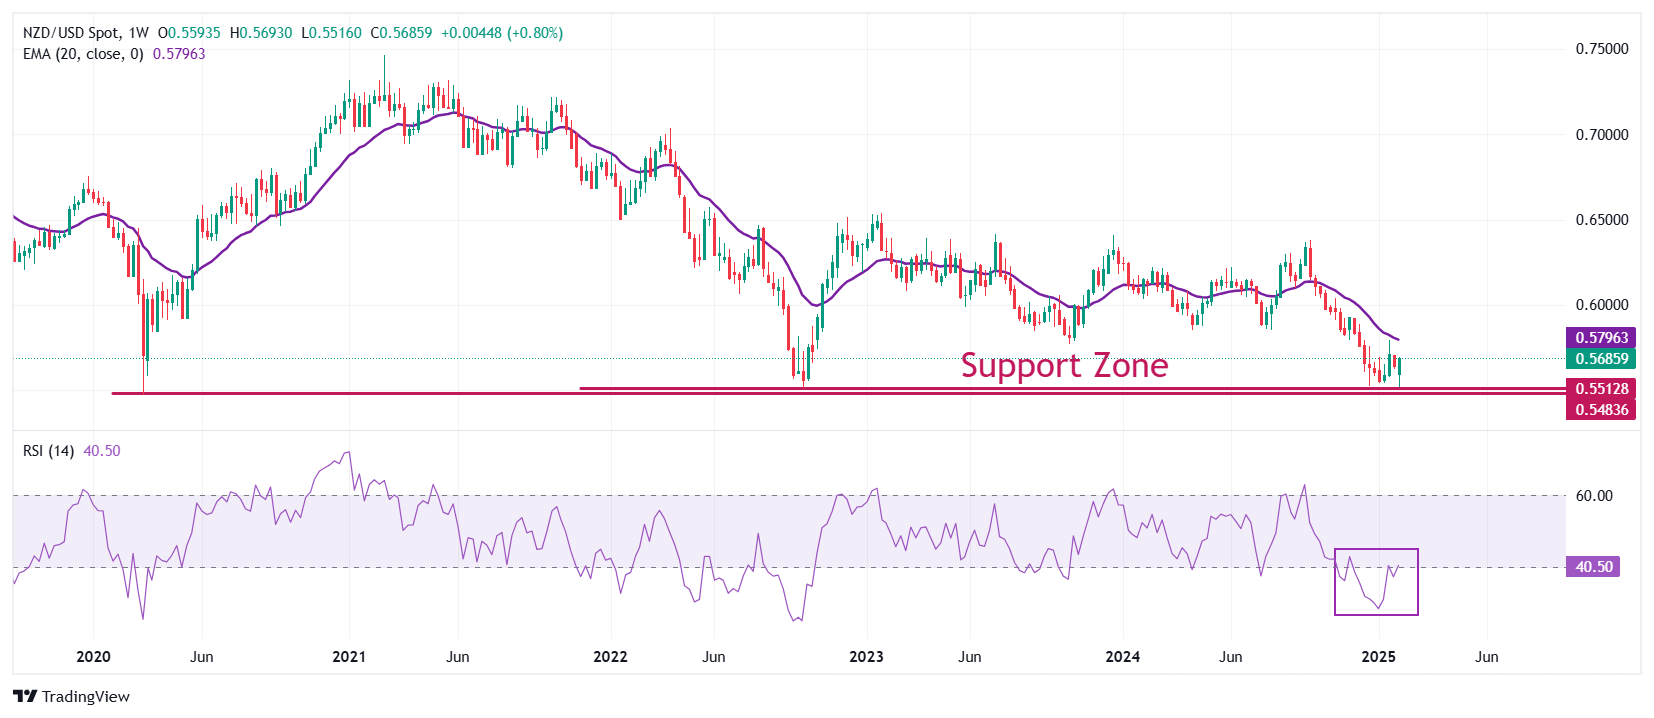
NZD/USD Price Analysis: Pair extends rally, approaching the 0.5700 mark
- NZD/USD advances nearly 0.70% on Wednesday, climbing to 0.5685.
- The pair maintains its position above the 20-day SMA, reinforcing bullish momentum.
- Bulls must conquer the 0.5700 area to confirm a recovery.
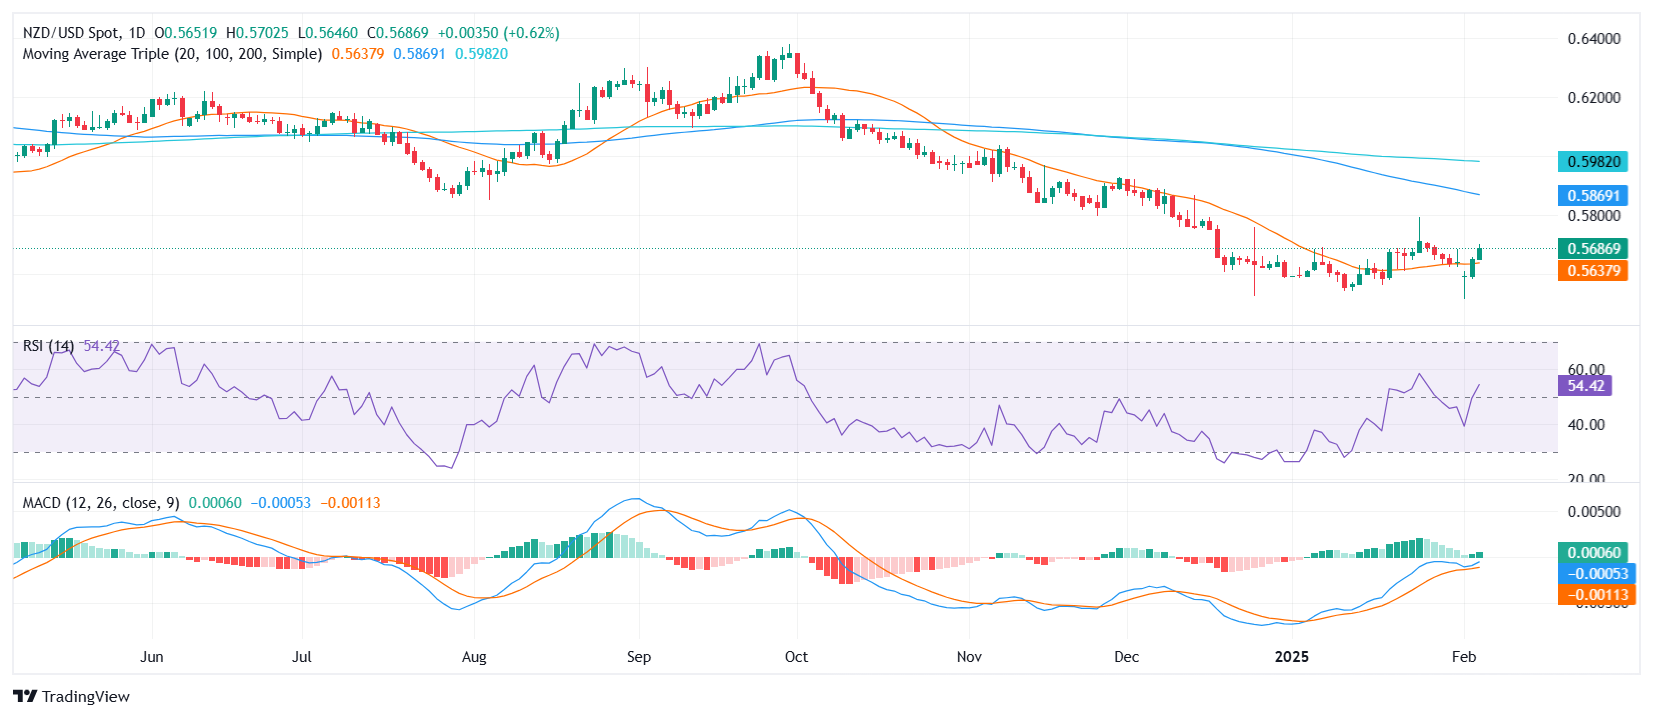
The NZD/USD pair extended its winning streak on Wednesday, posting a 0.67% gain to reach 0.5685. This upward move follows a breakout above the 20-day Simple Moving Average (SMA), which now acts as a key support level. The bullish sentiment appears to be strengthening, with the pair eyeing further gains toward the 0.5700 psychological threshold.
Technical indicators confirm the ongoing bullish trend. The Relative Strength Index (RSI) has surged to 58, indicating growing buying pressure, while the Moving Average Convergence Divergence (MACD) histogram continues to print rising green bars, reflecting a steady acceleration in momentum.
Looking ahead, NZD/USD faces an initial resistance zone at 0.5700, with a further upside target at 0.5735. On the downside, the 20-day SMA, currently near 0.5635, should act as the first line of support, followed by 0.5600 if a correction takes place. As long as the pair holds above the 20-day SMA, the short-term outlook remains in favor of the bulls.
NZD/USD daily chart
-
22:43
Gold price refreshes all-time high on risk aversion
- Gold price is poised to reach $2,900 amid an uncertain environment triggered by Trump’s policies.
- US businesses in the services industry are cooling, indicating an ongoing slowdown.
- Fed officials turned unease on Trump tariffs, putting inflation ahead of employment.
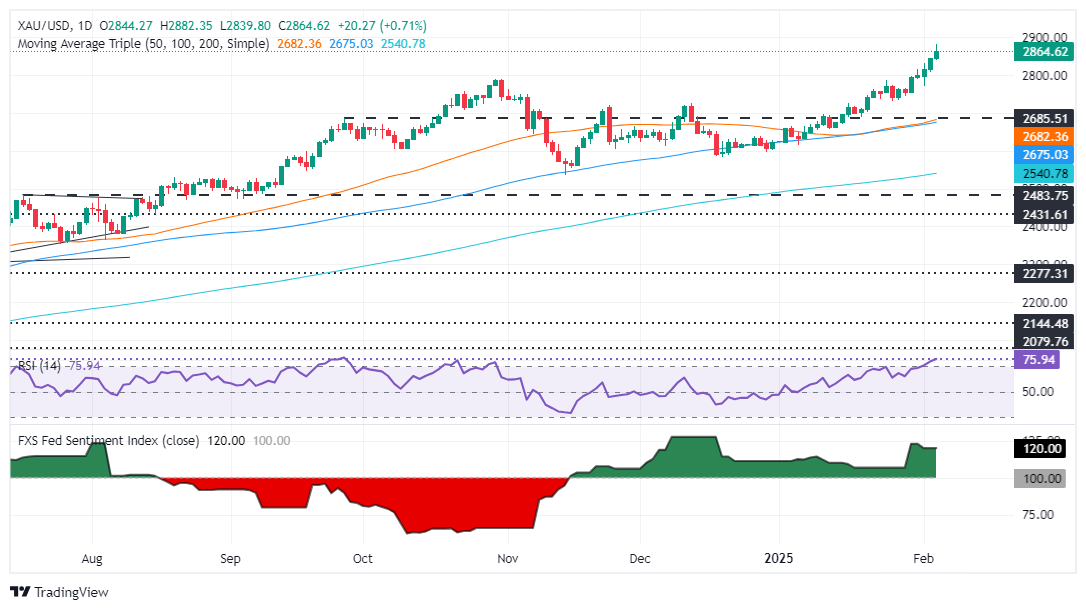
Gold price is set to extend its gains, rising more than 0.90% on Wednesday, sponsored by US Dollar weakness and falling US Treasury bond yields. The escalation of the China-US trade war keeps investors flocking to Gold’s safety appeal, and the XAU/USD trades near $2,870 as bulls target $2,900.
US President Donald Trump's rhetoric and policies continued to drive investors toward the golden metal, which is in unchartered territory. Traders are eyeing the $2,900 mark. Economic data revealed that the labor market remains solid after January’s ADP Employment Change report, which showed that private companies hired more people than foreseen.
However, not everything was positive on the data front. Business activity revealed by S&P Global and the Institute for Supply Management (ISM) showed that the services sector is cooling.
In the meantime, Federal Reserve (Fed) officials had crossed the wires and shown that they were uncertain about the impact of tariffs on inflation. Yet Chicago’s Fed President Austan Goolsbee said that ignoring tariffs' potential impact would be a mistake.
“If we see inflation rising or progress stalling in 2025, the Fed will be in the difficult position of trying to figure out if the inflation is coming from overheating or if it's coming from tariffs,” Goolsbee said.
Given the backdrop that Trump delayed 25% tariffs on Mexico and Canada for 30 days but levied 10% duties on China, uncertainty has kept investors uneasy about the potential disruption to global trade. Hence, they continued to seek the safety of the precious metals and ditched the Greenback.
Daily digest market movers: Gold remains underpinned by falling US yields
- The US Dollar Index (DXY), which tracks the buck’s performance versus a basket of six currencies, drops 0.38% and sits at 107.58 after hitting a three-week high at 109.88.
- The US 10-year Treasury bond yield plunges over nine basis points, down to 4.244%.
- US real yields, which correlate inversely to Bullion prices, dropped three basis points from 2.10% to 2.07%, a tailwind for XAU/USD.
- In January, the US ADP National Employment Change reported an increase in private sector jobs, rising from 176K to 183K and surpassing estimates of 150K.
- Concurrently, the ISM Services PMI for January registered at 52.9, slightly above forecasts of 52.8, although it decreased from December’s 54.0. Additionally, the S&P Global Services PMI decreased from 56.8 to 52.9 for the same period, still outperforming the anticipated 52.8.
- Money market fed funds rate futures are pricing in 52 basis points (bps) of easing by the Federal Reserve in 2025.
XAU/USD technical outlook: Gold prices set to challenge $2,900
After printing a new all-time high of $2,882, the yellow metal is set to challenge $2,890 ahead of the psychological $2,900 figure. Momentum remains bullish, and although the Relative Strength Index (RSI) has pushed well into overbought territory, it hasn’t reached the most extreme level above 80, which could pave the way for a mean-reversion trade.
On the other hand, if Gold tumbles below the $2,800 figure, the first support would be the January 27 swing low of $2,730, followed by $2,700.
Gold FAQs
Gold has played a key role in human’s history as it has been widely used as a store of value and medium of exchange. Currently, apart from its shine and usage for jewelry, the precious metal is widely seen as a safe-haven asset, meaning that it is considered a good investment during turbulent times. Gold is also widely seen as a hedge against inflation and against depreciating currencies as it doesn’t rely on any specific issuer or government.
Central banks are the biggest Gold holders. In their aim to support their currencies in turbulent times, central banks tend to diversify their reserves and buy Gold to improve the perceived strength of the economy and the currency. High Gold reserves can be a source of trust for a country’s solvency. Central banks added 1,136 tonnes of Gold worth around $70 billion to their reserves in 2022, according to data from the World Gold Council. This is the highest yearly purchase since records began. Central banks from emerging economies such as China, India and Turkey are quickly increasing their Gold reserves.
Gold has an inverse correlation with the US Dollar and US Treasuries, which are both major reserve and safe-haven assets. When the Dollar depreciates, Gold tends to rise, enabling investors and central banks to diversify their assets in turbulent times. Gold is also inversely correlated with risk assets. A rally in the stock market tends to weaken Gold price, while sell-offs in riskier markets tend to favor the precious metal.
The price can move due to a wide range of factors. Geopolitical instability or fears of a deep recession can quickly make Gold price escalate due to its safe-haven status. As a yield-less asset, Gold tends to rise with lower interest rates, while higher cost of money usually weighs down on the yellow metal. Still, most moves depend on how the US Dollar (USD) behaves as the asset is priced in dollars (XAU/USD). A strong Dollar tends to keep the price of Gold controlled, whereas a weaker Dollar is likely to push Gold prices up.
-
21:56
Australian Dollar climbs as mixed US data boosts risk sentiment
- Aussie nears 0.6300 amid cautious optimism on Wednesday.
- Investors eye possible February rate cut from RBA.
- Mid-tier US data came in mixed and weighed on the USD.
The Australian Dollar (AUD/USD) edges toward 0.6300, buoyed by mixed United States data that softened the Greenback and lifted broader risk assets. Nonetheless, anticipation of a dovish Reserve Bank of Australia (RBA) move next month tempers upside potential. Ongoing US-China trade tensions further cloud the outlook, restraining a more decisive rally in the Aussie.
Daily digest market movers: Aussie climbs amid mixed US data
- President Donald Trump’s additional tariff on Chinese imports remains in effect, prompting China’s plan for new countermeasures and an antitrust investigation into Alphabet.
- The United States has postponed a 25% duty on Canadian and Mexican imports for 30 days, contingent on border security commitments.
- The ADP Employment Change report surprised with 183,000 new private-sector jobs, surpassing market estimates of 150,000.
- Revised data from S&P Global show January Services at 52.9 and Composite at 52.7, both up from previous figures.
- The Institute for Supply Management’s Services PMI declined to 52.8, missing the 54.3 forecast, while the Prices Paid component dropped to 60.4.
- Markets are expecting that the Federal Reserve might hold rates steady in March, especially after mixed economic signals.
- On the other hand, speculation of a 25 bps cut by the RBA in February weighs on the Aussie since inflation remains subdued.
AUD/USD technical outlook: Pair flirts with key resistance near 0.6300
The pair’s advance above the 20-day Simple Moving Average (SMA) around 0.6230 highlights recovering momentum, with the Aussie rising 0.67% to near 0.6300. The Relative Strength Index (RSI) stands at 58, hinting at growing bullish pressure, while the Moving Average Convergence Divergence (MACD) histogram’s decreasing green bars suggest lingering caution. Although improved risk sentiment encourages short-term gains, market bets on a February RBA rate cut and persistent trade disputes could cap upside potential.
Australian Dollar FAQs
One of the most significant factors for the Australian Dollar (AUD) is the level of interest rates set by the Reserve Bank of Australia (RBA). Because Australia is a resource-rich country another key driver is the price of its biggest export, Iron Ore. The health of the Chinese economy, its largest trading partner, is a factor, as well as inflation in Australia, its growth rate and Trade Balance. Market sentiment – whether investors are taking on more risky assets (risk-on) or seeking safe-havens (risk-off) – is also a factor, with risk-on positive for AUD.
The Reserve Bank of Australia (RBA) influences the Australian Dollar (AUD) by setting the level of interest rates that Australian banks can lend to each other. This influences the level of interest rates in the economy as a whole. The main goal of the RBA is to maintain a stable inflation rate of 2-3% by adjusting interest rates up or down. Relatively high interest rates compared to other major central banks support the AUD, and the opposite for relatively low. The RBA can also use quantitative easing and tightening to influence credit conditions, with the former AUD-negative and the latter AUD-positive.
China is Australia’s largest trading partner so the health of the Chinese economy is a major influence on the value of the Australian Dollar (AUD). When the Chinese economy is doing well it purchases more raw materials, goods and services from Australia, lifting demand for the AUD, and pushing up its value. The opposite is the case when the Chinese economy is not growing as fast as expected. Positive or negative surprises in Chinese growth data, therefore, often have a direct impact on the Australian Dollar and its pairs.
Iron Ore is Australia’s largest export, accounting for $118 billion a year according to data from 2021, with China as its primary destination. The price of Iron Ore, therefore, can be a driver of the Australian Dollar. Generally, if the price of Iron Ore rises, AUD also goes up, as aggregate demand for the currency increases. The opposite is the case if the price of Iron Ore falls. Higher Iron Ore prices also tend to result in a greater likelihood of a positive Trade Balance for Australia, which is also positive of the AUD.
The Trade Balance, which is the difference between what a country earns from its exports versus what it pays for its imports, is another factor that can influence the value of the Australian Dollar. If Australia produces highly sought after exports, then its currency will gain in value purely from the surplus demand created from foreign buyers seeking to purchase its exports versus what it spends to purchase imports. Therefore, a positive net Trade Balance strengthens the AUD, with the opposite effect if the Trade Balance is negative.
-
21:09
Fed's Goolsbee: Can't ignore threats to supply chains like tariffs
Federal Reserve (Fed) Bank of Chicago President Austan Goolsbee noted on Wednesday that it is difficult for central banks to generally estimate the fallout of things like tariffs, and could complicate the Fed's ability to accomplish its task of bringing inflation down to 2%.
Key highlights
If inflation rises or progress stalls, US central bank will need to figure out if it's from overheating or tariffs.
Inflation has come down and is approaching Fed's 2% goal.
US has a strong economy and plausibly full employment.
Distinguishing the cause of any inflation will be critical for deciding when or even if the Fed should act.
COVID-19 pandemic experience shows supply chain disruptions can have a material impact on inflation.
Ignoring potential consequences of new threats to supply chains, like tariffs, would be a mistake.
Opinions differ widely on how much tariffs would get passed into prices, suppliers may have to eat the cost.
Tariffs this time may be broader and higher than in 2018; impact could be larger and longer-lasting.
-
20:49
Forex Today: The BoE is expected to ease its monetary stance
The US Dollar continued its slide on Wednesday, retesting multi-day lows against its peers amid a steady unravelling of positions and lingering uncertainty over Trump’s trade policies.
Here is what you need to know on Thursday, February 6:
The US Dollar Index (DXY) dropped for the third day in a row, extending the breakdown of the 108.00 support helped by lower yields across the board and intense risk-on mood. The usual Initial Jobless Claims are due, along with Challenger Job Cuts, and advanced Unit Labor Costs. In addition, the Fed’s Jefferson, Waller, and Daly are all due to speak.
EUR/USD rose to three-day peaks and looked to consolidate the recent breakout of the 1.0400 barrier. The HCOB Construction PMI is due in the euro area and Germany, seconded by Factory Orders in Germany, and Retail Sales in the bloc. Additionally, the ECB’s Nagel is expected to speak.
Another solid day saw GBP/USD advance to three-week highs past the 1.2500 hurdle in response to further weakness hurting the US Dollar. The BoE gathering will take centre stage, seconded by the S&P Global Construction PMI and the speech by Governor Bailey.
USD/JPY weakened further and put the 200-day SMA to the test near the 152.50 zone amid extra appreciation of the Japanese yen. The weekly Foreign Bond Investment figures will be published, will the BoJ’s Tamura will also speak.
AUD/USD climbed to multi-day highs, extending its weekly rebound to the boundaries of the key 0.6300 barrier. The Balance of Trade results for the month of December will be in the spotlight Down Under.
Prices of WTI resumed their downtrend, rapidly leaving behind Tuesday’s uptick and refocusing on the key $70.00 mark per barrel amid tariffs uncertainty.
Prices of Gold rose to an all-time peak near $2,880 per ounce troy on the back of safe haven demand and further selling pressure in the Greenback. Silver prices retreated marginally soon after hitting three-month highs around $32.50 per ounce.
-
20:35
Canadian Dollar continues to drift higher on Wednesday
- The Canadian Dollar added a thin 0.5% as the Greenback drifts lower.
- Upbeat US employment data is sending risk appetite higher.
- Meaningful Canadian data remains limited until Friday.
The Canadian Dollar (CAD) tested higher against the Greenback on Wednesday, chalking in a scant one-fifth of one percent gain following the early week’s sharp recovery from multi-decade lows. Us data dominated market headlines during the midweek market session, and a general improvement in trader risk appetite is stepping down on the US Dollar, giving the Loonie a leg up.
Economic data from Canada is strictly low-tier until Friday’s labor print. US Purchasing Managers Index (PMI) figures missed the market on Wednesday, but the key reading for US data came from ADP jobs change data, which showed a potential upswing in US net job gains. Traders are keeping a close eye on employment preview numbers in the run-up to Friday’s Nonfarm Payrolls (NFP) report.
Daily digest market movers: Canadian Dollar gains ground on sentiment uptick
- The Canadian Dollar gained a few points on easing Greenback flows.
- Canadian Trade Balance numbers for December rebounded, but less than expected. Markets overwhelmingly overlooked the data print.
- US ISM Services PMI survey results from January softened to 52.8 from a revised 54.0, missing the forecast 54.3.
- US ADP Employment Change swung higher to 183K, stepping over the previous revised 176K and beating the 150K forecast.
- Canadian labor figures are due on Friday, but market attention will be fully focused on US NFP jobs figures due at the same time.
Canadian Dollar price forecast
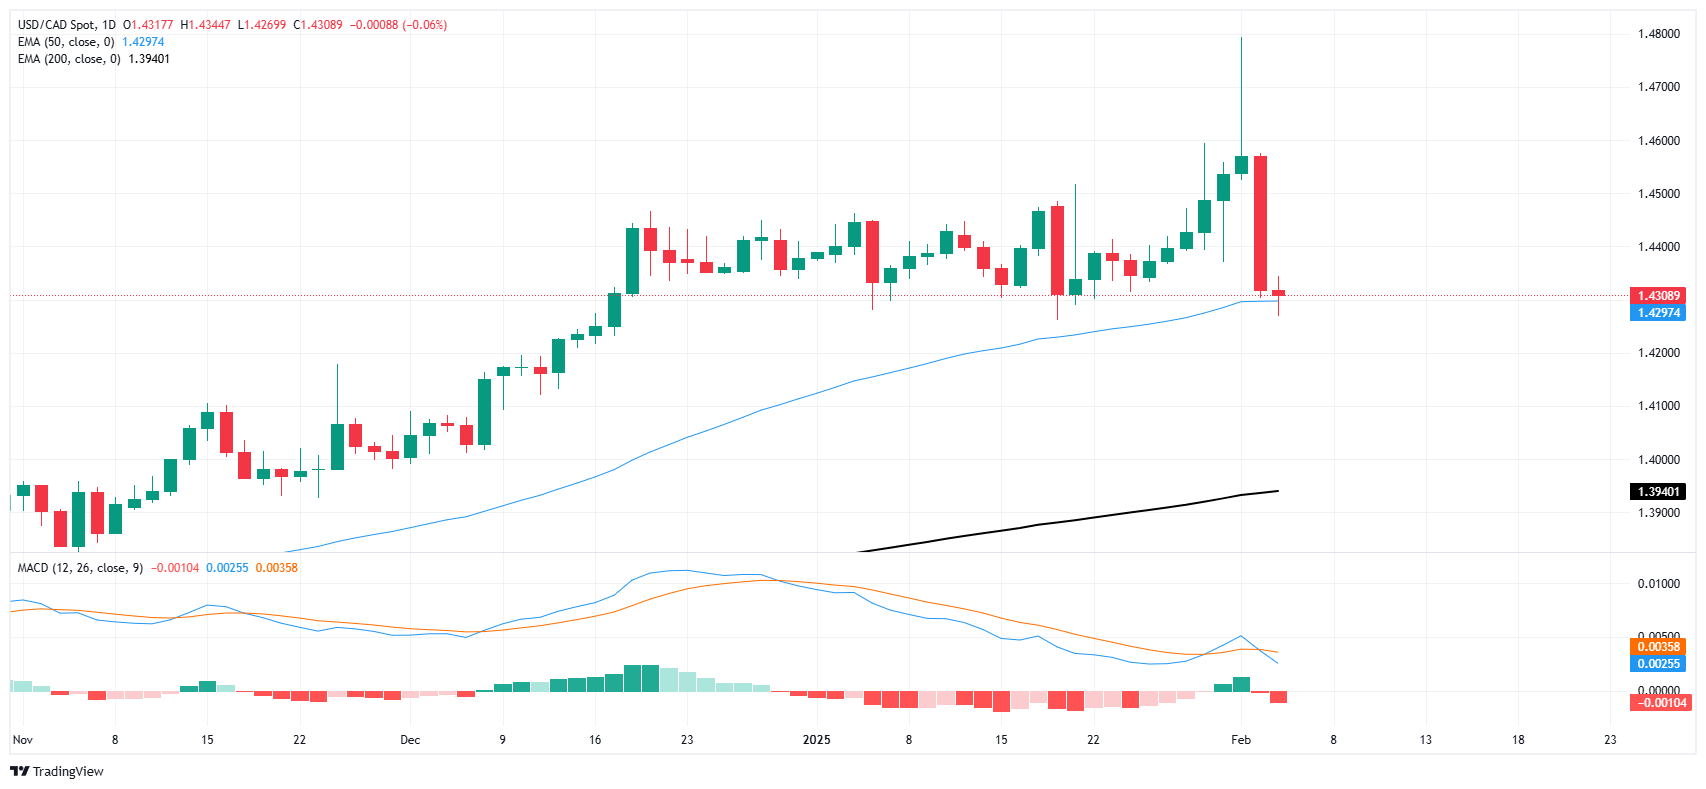
The Canadian Dollar (CAD) managed to eke out thin gains on Wednesday, dragging USD/CAD back down to the 50-day Exponential Moving Average (EMA) near the 1.4300 handle. Loonie traders remain aware that any gains on the CAD side are coming from generalized weakness in USD flows, but gains are gains and the Loonie has recovered solidly from 21-year lows set earlier this week.
The downside of the CAD’s rebound is USD/CAD is once again back into a congestion range as the pair grinds through a volatile but immovable sideways channel. Momentum is unlikely to meaningful break through the bottom near 1.4000, and the technical ceiling remains in place near 1.4500, albeit with some new holes.
USD/CAD daily chart
Canadian Dollar FAQs
The key factors driving the Canadian Dollar (CAD) are the level of interest rates set by the Bank of Canada (BoC), the price of Oil, Canada’s largest export, the health of its economy, inflation and the Trade Balance, which is the difference between the value of Canada’s exports versus its imports. Other factors include market sentiment – whether investors are taking on more risky assets (risk-on) or seeking safe-havens (risk-off) – with risk-on being CAD-positive. As its largest trading partner, the health of the US economy is also a key factor influencing the Canadian Dollar.
The Bank of Canada (BoC) has a significant influence on the Canadian Dollar by setting the level of interest rates that banks can lend to one another. This influences the level of interest rates for everyone. The main goal of the BoC is to maintain inflation at 1-3% by adjusting interest rates up or down. Relatively higher interest rates tend to be positive for the CAD. The Bank of Canada can also use quantitative easing and tightening to influence credit conditions, with the former CAD-negative and the latter CAD-positive.
The price of Oil is a key factor impacting the value of the Canadian Dollar. Petroleum is Canada’s biggest export, so Oil price tends to have an immediate impact on the CAD value. Generally, if Oil price rises CAD also goes up, as aggregate demand for the currency increases. The opposite is the case if the price of Oil falls. Higher Oil prices also tend to result in a greater likelihood of a positive Trade Balance, which is also supportive of the CAD.
While inflation had always traditionally been thought of as a negative factor for a currency since it lowers the value of money, the opposite has actually been the case in modern times with the relaxation of cross-border capital controls. Higher inflation tends to lead central banks to put up interest rates which attracts more capital inflows from global investors seeking a lucrative place to keep their money. This increases demand for the local currency, which in Canada’s case is the Canadian Dollar.
Macroeconomic data releases gauge the health of the economy and can have an impact on the Canadian Dollar. Indicators such as GDP, Manufacturing and Services PMIs, employment, and consumer sentiment surveys can all influence the direction of the CAD. A strong economy is good for the Canadian Dollar. Not only does it attract more foreign investment but it may encourage the Bank of Canada to put up interest rates, leading to a stronger currency. If economic data is weak, however, the CAD is likely to fall.
-
19:37
Mexican Peso tumbles brushes aside broad US Dollar weakness across the board
- The Mexican Peso depreciates as USD/MXN climbs above 20.50 as trade tensions between the US and Mexico ease.
- Mixed investment data and anticipated Banxico rate cut further pressure on the Mexican Peso.
- The White House clarifies trade measures with Mexico, focusing on anti-drug efforts.
The Mexican Peso (MXN) dropped for the second straight day versus the US Dollar (USD) as trade war fears began to fade. Upbeat United States (US) jobs data pressured the Mexican currency, which has failed to capitalize on broad US Dollar weakness. The USD/MXN trades at 20.57, up by 0.45%.
Mexico’s economic docket revealed mixed Gross Fixed Investment figures in November. The data underscores the ongoing economic slowdown and undermines the already battered Mexican Peso, which could weaken further as the Banco de Mexico (Banxico) is expected to lower interest rates by at least 25 basis points from 10% to 9.75% on Thursday.
Although trade disputes between the US and Mexico have found common ground, USD/MXN traders should know that there is a 30-day pause and that tensions could arise throughout the end of February. Peter Navarro, a trade adviser for the White House, said that Canada misunderstood that it is not a “trade war” but a drug war.
Therefore, tariffs on Mexico will remain paused if the Government improves on its fight against drug cartels.
In the US, data keeps the Greenback on the back foot. The Institute for Supply Management (ISM) revealed that business activity in the US services sector cooled down in January. Other data showed that the jobs market remains solid as traders prepare for the release of US Nonfarm Payrolls numbers on Friday.
Daily digest market movers: Mexican Peso remains heavy amid broad USD weakness
- Gross Fixed Investment in Mexico rose 0.1% MoM in November, down from 0.3% in October, but exceeded forecasts of -0.1%. On a yearly basis, it improved from -2.6% contraction to -0.7%.
- Mexico’s Business Confidence in January showed signs of improvement, though business activity contracted, according to S&P Global. The manufacturing sector contracted for the seventh straight month in January, indicating that the economy is slowing down
- Banxico’s private economists survey showed that Mexico’s economy is expected to grow by 1% in 2025, down from 1.2% in the December survey. Inflation is expected to tick higher from 3.80% to 3.83%, while core prices are foreseen at 3.74%, up from 3.72%.
- Economists estimate the USD/MXN pair exchange rate to finish the year at 20.90, up from 20.53 in December, and estimate 150 basis points of easing from Banxico.
- The US ADP National Employment Change in January grew from 176K to 183K, exceeding estimates of 150K.
- The ISM Services PMI, for the same period as the ADP, rose 52.9 and exceeded forecasts of 52.8 but dipped compared to December’s 54.0.
- S&P Global featured Services PMI for January, which dipped from 56.8 to 52.9, better than the 52.8 expected.
- Money market fed funds rate futures are pricing in 52 basis points (bps) of easing by the Federal Reserve in 2025.
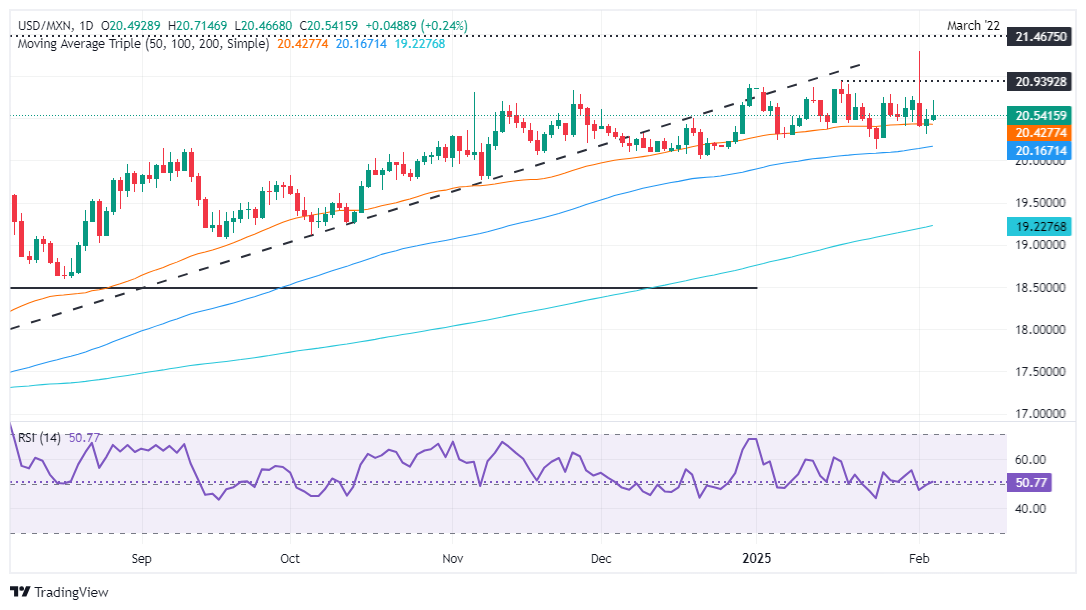
USD/MXN technical outlook: Mexican Peso weakens past 20.50 as buyers target 20.90
USD/MXN rose 0.265, recovering from a weekly low of 20.30 on Monday. Nevertheless, buyers' inability to achieve a daily close below the 50-day Simple Moving Average (SMA) of 20.41 sponsored the buck’s recovery to the detriment of the Peso.
For a bullish resumption, buyers must clear the previous year-to-date (YTD) peak of 20.90, ahead of the 21.00 figure. Further upside lies above the current YTD peak of 21.29.
Conversely, if sellers push USD/MXN below 20.30, it could fall to the 100-day SMA at 20.15. ahead of the 20.00 figure.
Mexican Peso FAQs
The Mexican Peso (MXN) is the most traded currency among its Latin American peers. Its value is broadly determined by the performance of the Mexican economy, the country’s central bank’s policy, the amount of foreign investment in the country and even the levels of remittances sent by Mexicans who live abroad, particularly in the United States. Geopolitical trends can also move MXN: for example, the process of nearshoring – or the decision by some firms to relocate manufacturing capacity and supply chains closer to their home countries – is also seen as a catalyst for the Mexican currency as the country is considered a key manufacturing hub in the American continent. Another catalyst for MXN is Oil prices as Mexico is a key exporter of the commodity.
The main objective of Mexico’s central bank, also known as Banxico, is to maintain inflation at low and stable levels (at or close to its target of 3%, the midpoint in a tolerance band of between 2% and 4%). To this end, the bank sets an appropriate level of interest rates. When inflation is too high, Banxico will attempt to tame it by raising interest rates, making it more expensive for households and businesses to borrow money, thus cooling demand and the overall economy. Higher interest rates are generally positive for the Mexican Peso (MXN) as they lead to higher yields, making the country a more attractive place for investors. On the contrary, lower interest rates tend to weaken MXN.
Macroeconomic data releases are key to assess the state of the economy and can have an impact on the Mexican Peso (MXN) valuation. A strong Mexican economy, based on high economic growth, low unemployment and high confidence is good for MXN. Not only does it attract more foreign investment but it may encourage the Bank of Mexico (Banxico) to increase interest rates, particularly if this strength comes together with elevated inflation. However, if economic data is weak, MXN is likely to depreciate.
As an emerging-market currency, the Mexican Peso (MXN) tends to strive during risk-on periods, or when investors perceive that broader market risks are low and thus are eager to engage with investments that carry a higher risk. Conversely, MXN tends to weaken at times of market turbulence or economic uncertainty as investors tend to sell higher-risk assets and flee to the more-stable safe havens.
-
19:29
US Dollar struggles as mixed data weighs on sentiment
- DXY remains under pressure, testing 107.35 support despite upbeat ADP and S&P Global PMI data.
- ISM Services PMI disappoints, signaling weaker than expected service sector growth and moderating price pressures.
- US 10-year yield rebounds, hovering around 4.40% after touching a yearly low.
The US Dollar Index (DXY), which measures the USD against a basket of currencies, struggled to recover losses on Wednesday and declined against most major peers. Despite stronger than expected ADP Employment and S&P Global PMI data, the ISM Services PMI fell short of forecasts, casting doubt on the strength of the US economy.
The Fed Sentiment Index, which previously sat at 130.00, has cooled off, signaling a less hawkish tone from policymakers. As a result, traders are reassessing the Federal Reserve’s (Fed) rate path, contributing to the DXY’s weak price action around 107.35 support.
Daily digest market movers: US Dollar struggles as mixed data weighs on sentiment
- ADP Employment Report showed that private sector employment jumped by 183,000 in January, exceeding the 150,000 forecast. Consumer-facing industries drove job creation, while manufacturing saw weaker gains.
- S&P Global PMI data revealed that the final readings for January saw minor upward revisions with the Services PMI at 52.9 (vs. 52.8 expected) and the Composite PMI at 52.7 (vs. 52.4 prior).
- ISM Services PMI: Disappointed at 52.8, missing the expected 54.3, while the Prices Paid index eased to 60.4 from 64.4, indicating softer inflationary pressures.
- All eyes are now on Friday Nonfarm Payrolls for January, which is seen printing a weak result that might add more weakness to the USD.
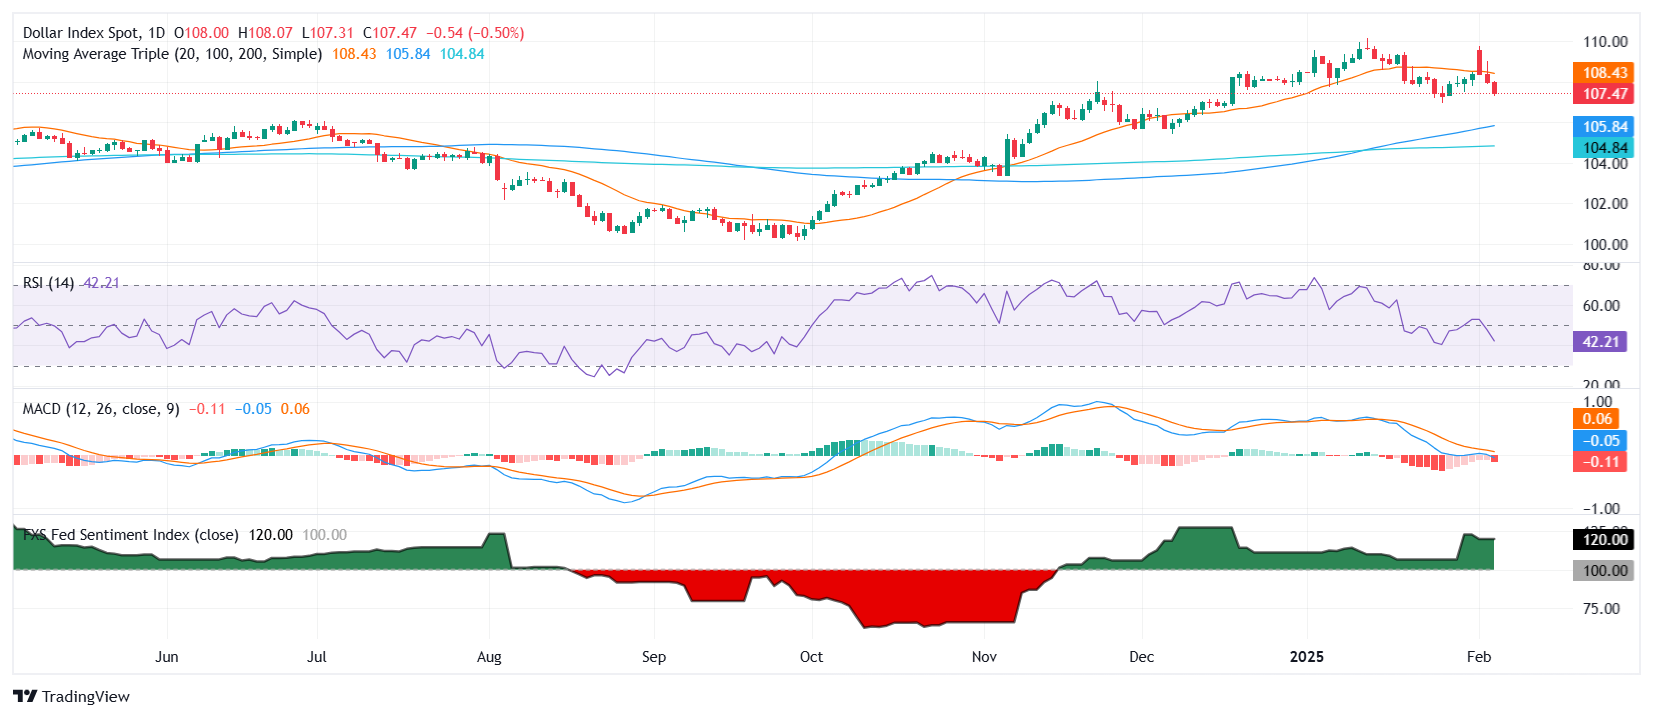
DXY technical outlook: Bears eye 107.00 support
The DXY's momentum indicators reflect a shift toward bearish traction. The Fed Sentiment Index cooling off from 130.00 aligns with weaker ISM data, weighing on the USD.
The Relative Strength Index (RSI) has dropped below 50, while the index has fallen beneath the 20-day Simple Moving Average (SMA) at 108.50. If downside pressure persists, the next key level to watch is the psychological support at 107.00.
Employment FAQs
Labor market conditions are a key element in assessing the health of an economy and thus a key driver for currency valuation. High employment, or low unemployment, has positive implications for consumer spending and economic growth, boosting the value of the local currency. Moreover, a very tight labor market – a situation in which there is a shortage of workers to fill open positions – can also have implications on inflation levels because low labor supply and high demand leads to higher wages.
The pace at which salaries are growing in an economy is key for policymakers. High wage growth means that households have more money to spend, usually leading to price increases in consumer goods. In contrast to more volatile sources of inflation such as energy prices, wage growth is seen as a key component of underlying and persisting inflation as salary increases are unlikely to be undone. Central banks around the world pay close attention to wage growth data when deciding on monetary policy.
The weight that each central bank assigns to labor market conditions depends on its objectives. Some central banks explicitly have mandates related to the labor market beyond controlling inflation levels. The US Federal Reserve (Fed), for example, has the dual mandate of promoting maximum employment and stable prices. Meanwhile, the European Central Bank’s (ECB) sole mandate is to keep inflation under control. Still, and despite whatever mandates they have, labor market conditions are an important factor for policymakers given their significance as a gauge of the health of the economy and their direct relationship to inflation.
-
18:56
Dow Jones Industrial Average grinds higher on Wednesday
- The Dow Jones added another 120 points during calm Wednesday markets.
- US ADP payroll figures point to net job gains that are better than expected.
- US ISM PMI figures came in softer than expected, but investors are shrugging off the bad print.
The Dow Jones Industrial Average (DJIA) climbed 120 points on Wednesday, bolstered by a general improvement in market sentiment. Firmer-than-expected prints in jobs preview data ahead of Friday’s upcoming Nonfarm Payrolls (NFP) report helped to keep markets buoyed, adding to gains as investors recover from an early-week plunge sparked by trade war threats from US President Donald Trump that came up empty for a third time in a row.
The ADP Employment Change amount from January exceeded expectations, suggesting 183K net new jobs were added according to payroll services provider ADP. The figure came in above the revised print of 176K from December, flouting the median market forecast of 150K.
US ISM Services Purchasing Managers Index (PMI) survey results missed the mark, easing to 52.8 from a revised 54.0, flubbing the market’s expected uptick to 54.3. The softer figure dampened sentiment somewhat, but only briefly as traders look for reasons to hit the buy button.
Dow Jones news
Most of the Dow Jones is testing into the high side as broad-market sentiment generally improves. Familiar market favorites Amgen (AMGN) and Nvidia (NVDA) are climbing on Wednesday, gaining 5.5% and 4.5%, respectively. Amgen beat the street on Q4 financial results, reported late on Tuesday, and the biotech firm is trading back above $300 per share.
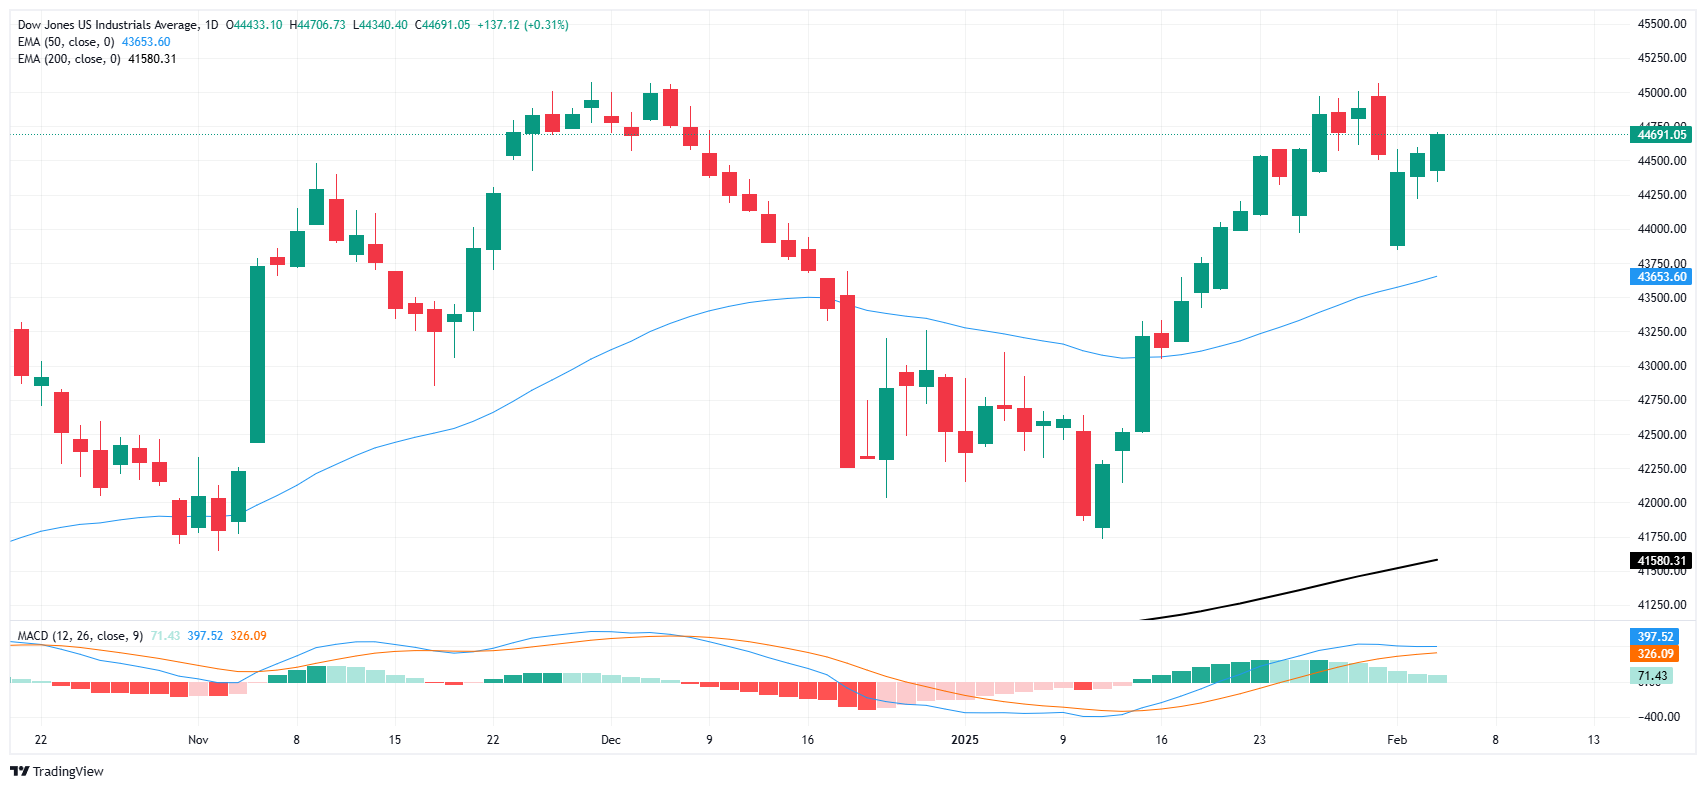
Dow Jones price forecast
The Dow Jones is grinding its way back toward 44,800, with price action drifting into the top-end after kicking the trading week off just south of the 44,000 major price handle. The Dow is set to snap its latest pullback with a three-straight bull run, and the immediate target for bidders will be the 45,000 handle that lies ahead.
Dow Jones daily chart
Dow Jones FAQs
The Dow Jones Industrial Average, one of the oldest stock market indices in the world, is compiled of the 30 most traded stocks in the US. The index is price-weighted rather than weighted by capitalization. It is calculated by summing the prices of the constituent stocks and dividing them by a factor, currently 0.152. The index was founded by Charles Dow, who also founded the Wall Street Journal. In later years it has been criticized for not being broadly representative enough because it only tracks 30 conglomerates, unlike broader indices such as the S&P 500.
Many different factors drive the Dow Jones Industrial Average (DJIA). The aggregate performance of the component companies revealed in quarterly company earnings reports is the main one. US and global macroeconomic data also contributes as it impacts on investor sentiment. The level of interest rates, set by the Federal Reserve (Fed), also influences the DJIA as it affects the cost of credit, on which many corporations are heavily reliant. Therefore, inflation can be a major driver as well as other metrics which impact the Fed decisions.
Dow Theory is a method for identifying the primary trend of the stock market developed by Charles Dow. A key step is to compare the direction of the Dow Jones Industrial Average (DJIA) and the Dow Jones Transportation Average (DJTA) and only follow trends where both are moving in the same direction. Volume is a confirmatory criteria. The theory uses elements of peak and trough analysis. Dow’s theory posits three trend phases: accumulation, when smart money starts buying or selling; public participation, when the wider public joins in; and distribution, when the smart money exits.
There are a number of ways to trade the DJIA. One is to use ETFs which allow investors to trade the DJIA as a single security, rather than having to buy shares in all 30 constituent companies. A leading example is the SPDR Dow Jones Industrial Average ETF (DIA). DJIA futures contracts enable traders to speculate on the future value of the index and Options provide the right, but not the obligation, to buy or sell the index at a predetermined price in the future. Mutual funds enable investors to buy a share of a diversified portfolio of DJIA stocks thus providing exposure to the overall index.
-
17:36
ECB's Centeno: May need to go below neutral to sustain inflation
European Central Bank (ECB) Governing Board Member Mario Centeno noted that deflationary pressures within the European economy are becoming a concern for policymakers. Dropping interest rates below neutral in order to stimulate the economy may be necessary, according to Centeno.
Key highlights
Undershooting 2% inflation is a risk if investment doesn't pick up.
We may need to go below neutral rate to sustain inflation at 2%.
Pretty clear, we need to keep downward trajectory of interest rates.
I'm ok with gradual rate cuts of 25 bps.
Europe must be united in face of potential tariffs; I see negotiations ahead.
-
17:13
EUR/USD Price Analysis: Pair extends gains above 20-day SMA, sustaining bullish momentum
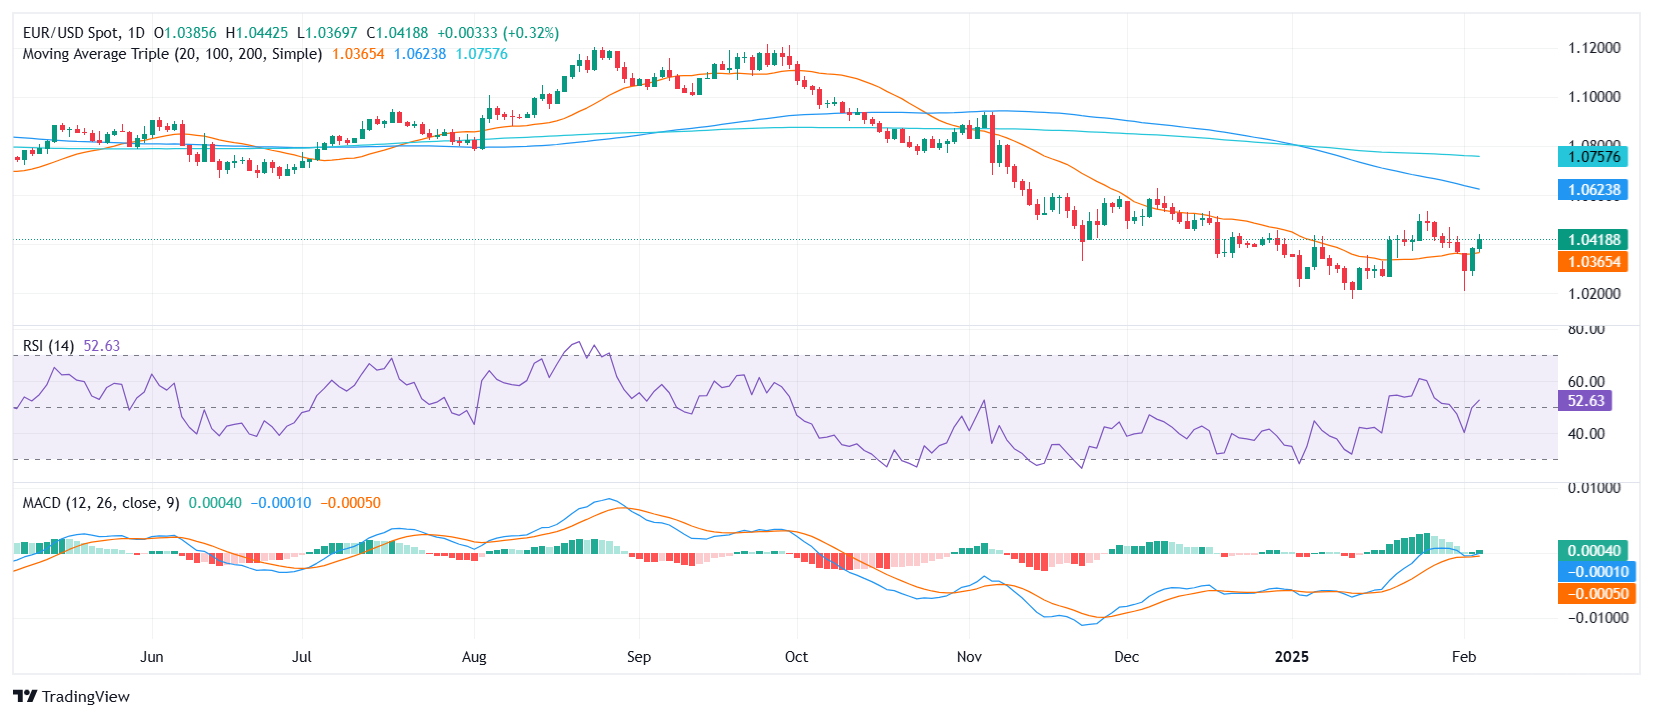
- EUR/USD climbs to 1.0420 on Wednesday, extending its upward trend.
- The pair surges past the 20-day SMA, reinforcing a stronger short-term outlook.
The EUR/USD pair continued its bullish advance on Wednesday, rising by 0.39% to 1.0420 as buyers maintained control. With the latest price action, the pair has decisively climbed above the 20-day Simple Moving Average (SMA), a key resistance level that had previously limited upside attempts. This breakout signals a potential shift in sentiment, favoring further gains in the short term.
Momentum indicators align with the pair’s continued strength. The Relative Strength Index (RSI) has risen sharply to 53, signaling increased buying interest and a stronger bullish bias. Meanwhile, the Moving Average Convergence Divergence (MACD) histogram prints rising green bars, reflecting a sustained increase in momentum.
For EUR/USD to build on its recent gains, the next resistance levels to watch stand at 1.0450 and 1.0485. A break above these levels could open the door for a move toward 1.0520. On the downside, the 20-day SMA, now acting as support, is positioned near 1.0365, followed by a stronger support zone around 1.0350. Holding above the 20-day SMA will be key for the pair to sustain its positive trajectory.
EUR/USD daily chart
-
17:00
Russia Industrial Output climbed from previous 3.7% to 8.2% in December
-
16:30
United States EIA Crude Oil Stocks Change above forecasts (3.2M) in January 31: Actual (8.664M)
-
16:09
GBP/USD surges amid easing US trade tensions, ahead of BoE’s decision
- GBP/USD rises maintaining position above the 50-day SMA as market digests US tariff negotiations.
- US labor market shows strength with ADP employment figures surpassing expectations, spotlight on Nonfarm Payrolls.
- UK economic indicators show slight downturn, with market eyes on BoE's anticipated rate cut.
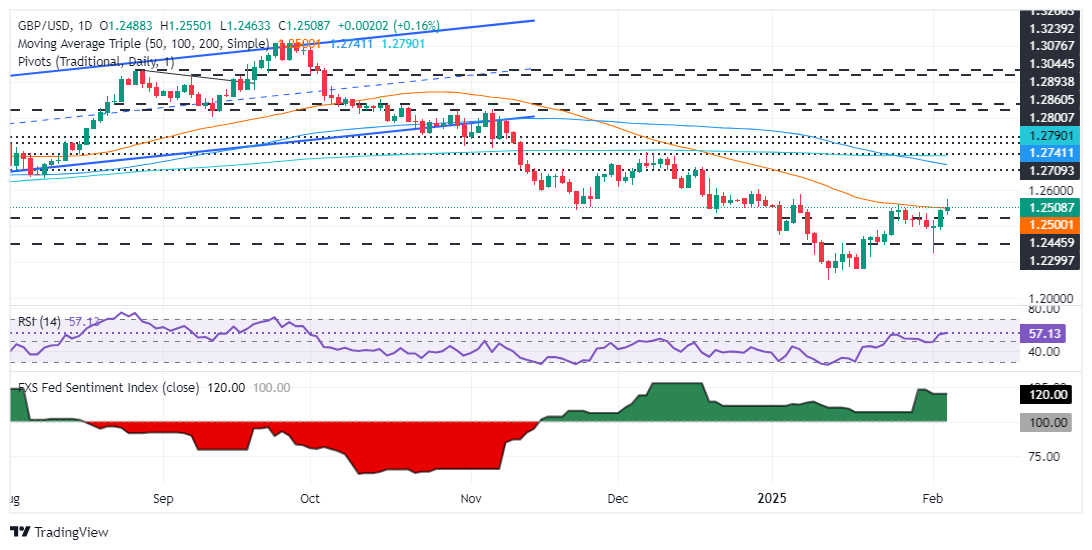
The Pound Sterling remains bid for the third consecutive day, edges up 0.34% as the GBP/USD trades at 1.2519 above the 50-day Simple Moving Average (SMA) at 1.2501.
GBP/USD ascends modestly, bolstered by positive market sentiment
The Greenback has erased most of its Monday’s gains, spurred by the US imposing tariffs on Mexico and Canada. However, both countries reached agreements with Washington. Therefore, investors who once seemed uncertain about US trade policies are confident that US President Donald Trump is using tariffs as a “tool” to negotiate with allies and adversaries.
Data has taken a backseat, with traders eyeing the release of US Nonfarm Payroll figures for January. Wednesday’s US docket featured ADP National Employment Change for January. The numbers exceeded estimates of 150K and rose by 183K, an indication of strength in the labor market.
At the same time, business activity continued to deteriorate. S&P Global featured Services PMI for January, which dipped from 56.8 to 52.9, better than the 52.8 expected. Up next, the Institute for Supply Management (ISM) will feature the Non-Manufacturing PMI, foreseen to increase from 54.1 to 54.3.
Across the pond, January's UK S&P Global Services PMI dipped from 51.1 to 50.8 as economic conditions worsened. Traders await the Bank of England’s (BoE) monetary policy decision on Thursday, poised to reduce rates by 25 basis points (bps) from 4.75% to 4.50%, according to Prime Market Terminal data.
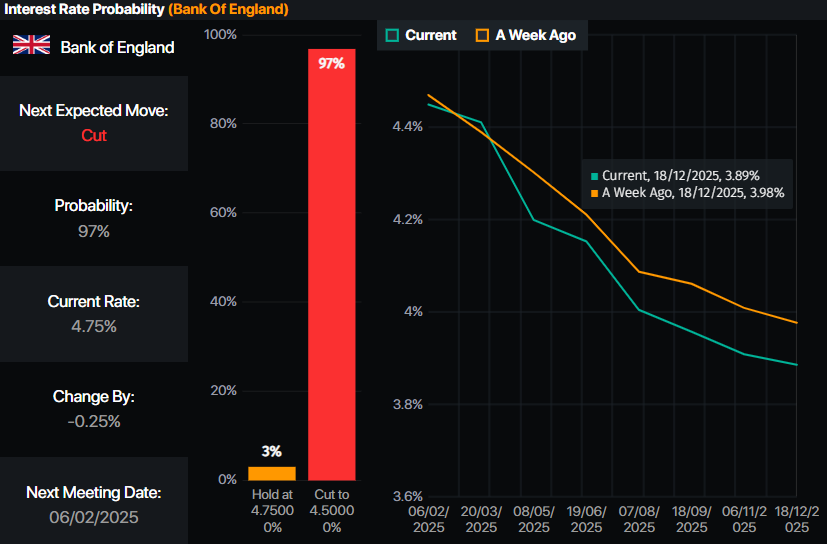
Source: Prime Market Terminal
GBP/USD Price Forecast: Technical outlook
The GBP/USD cleared the January 27 peak of 1.2523, a strong resistance level, and reached a new four-week peak at 1.2549. Although bullish, a daily close above the former would open the door to challenge the year-to-date (YTD) high of 1.2575 and the 1.2600 figure.
If there is a failure to clear 1.2550, sellers could be set to push GBP/USD lower, with trades eyeing 1.2400. Further downside lies underneath the January 2 low of 1.2351, followed by the February 3 low of 1.2248.
British Pound PRICE Today
The table below shows the percentage change of British Pound (GBP) against listed major currencies today. British Pound was the strongest against the US Dollar.
USD EUR GBP JPY CAD AUD NZD CHF USD -0.42% -0.25% -1.23% -0.20% -0.39% -0.66% -0.45% EUR 0.42% 0.19% -0.78% 0.22% 0.03% -0.25% -0.02% GBP 0.25% -0.19% -0.97% 0.04% -0.15% -0.42% -0.21% JPY 1.23% 0.78% 0.97% 1.04% 0.84% 0.56% 0.78% CAD 0.20% -0.22% -0.04% -1.04% -0.19% -0.45% -0.25% AUD 0.39% -0.03% 0.15% -0.84% 0.19% -0.27% -0.08% NZD 0.66% 0.25% 0.42% -0.56% 0.45% 0.27% 0.22% CHF 0.45% 0.02% 0.21% -0.78% 0.25% 0.08% -0.22% The heat map shows percentage changes of major currencies against each other. The base currency is picked from the left column, while the quote currency is picked from the top row. For example, if you pick the British Pound from the left column and move along the horizontal line to the US Dollar, the percentage change displayed in the box will represent GBP (base)/USD (quote).
-
16:03
US ISM Services PMI declines to 52.8 in January vs. 54.3 expected
- US ISM Services PMI in the US declined slightly to begin the new year.
- The US Dollar Index stays deep in negative territory below 107.50.
The economic activity in the US service sector continued to expand in January, albeit at a softer pace than in December, with the ISM Services PMI declining to 52.8 from 54. This reading came in below the market expectation of 54.3.
Other details of the report showed that the Prices Paid Index, the inflation component, dropped to 60.4 from 64.4, while the Employment Index edged higher to 52.3 from 51.3.
Market reaction
The US Dollar stays under selling pressure following these data. At the time of press, the US Dollar Index was down 0.6% on the day at 107.35.
-
16:00
United States ISM Services PMI came in at 52.8 below forecasts (54.3) in January
-
16:00
United States ISM Services Employment Index rose from previous 51.4 to 52.3 in January
-
16:00
United States ISM Services New Orders Index fell from previous 54.2 to 51.3 in January
-
16:00
United States ISM Services Prices Paid: 60.4 (January) vs previous 64.4
-
15:45
United States S&P Global Composite PMI above forecasts (52.4) in January: Actual (52.7)
-
15:45
United States S&P Global Services PMI registered at 52.9 above expectations (52.8) in January
-
15:43
Silver Price Forecast: XAG/USD gives up gains after upbeat US ADP Employment data
- Silver price gives up a majority of intraday gains after the release of the upbeat US private employment data for January.
- Strong labor demand would force the Fed to maintain the status quo for longer.
- Investors expect the trade war would be limited between the US and China.
Silver price (XAG/USD) surrenders almost its entire intraday gains and falls back to near $32.00 in Wednesday’s North American session. The white metal faces selling pressure as the US Dollar (USD) attempts to gain ground on the back of upbeat United States (US) ADP Employment Change data for January. The US Dollar Index (DXY), which tracks the Greenback’s value against six major currencies, finds buyers’ demand near 107.40 but is still over 0.4% down intraday.
The agency reported that 183K new workers were hired by the private sector last month, which were significantly higher than estimates of 150K, and the prior release of 176K, revised significantly higher from 122K.
Signs of strong labor demand would force Federal Reserve (Fed) officials to keep interest rates at their current levels for longer. Last week, Fed Chair Jerome Powell said that they will make monetary policy adjustments only after seeing “real progress in inflation or at least some weakness in labor market”. Technically, the Fed’s stance for keeping interest rates steady weighs on precious metals, such as Silver.
Meanwhile, investors are also doubting the Silver outlook amid receding fears of a lethal global trade war. Market participants expect the trade war to remain restricted between China and the US. Investors have interpreted President Donald trump’s tariff agenda as more a negotiating tool after his decision of suspending the order of imposing 25% tariffs on Canada and Mexico.
While 10% tariffs on China have come into effect from February, and in retaliation, China has also imposed levies on the US.
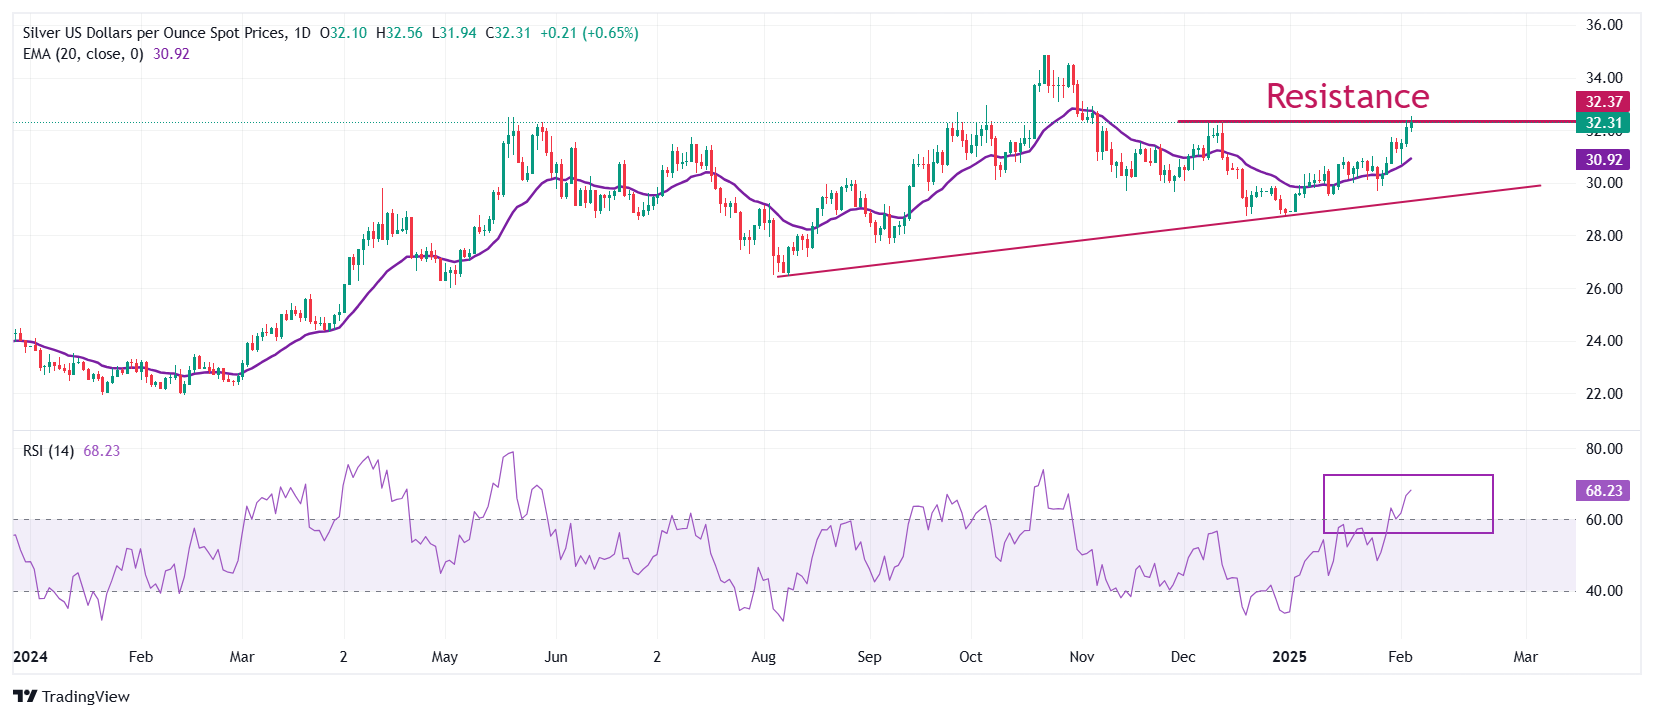
Silver technical analysis
Silver price strives to break above the immediate resistance of $32.50, which is plotted from the December 9 high. The outlook of the white metal remains bullish as the 20-day Exponential Moving Average (EMA) is sloping higher near $30.90.
The 14-day Relative Strength Index (RSI) oscillates in the 60.00-80.00 range, suggesting that the momentum is bullish.
Looking down, the upward-sloping trendline from the August 8 low of $26.45 will be the key support for the Silver price around $29.50. While, the October 31 high of $33.90 will be the key barrier.
Silver daily chart
Silver FAQs
Silver is a precious metal highly traded among investors. It has been historically used as a store of value and a medium of exchange. Although less popular than Gold, traders may turn to Silver to diversify their investment portfolio, for its intrinsic value or as a potential hedge during high-inflation periods. Investors can buy physical Silver, in coins or in bars, or trade it through vehicles such as Exchange Traded Funds, which track its price on international markets.
Silver prices can move due to a wide range of factors. Geopolitical instability or fears of a deep recession can make Silver price escalate due to its safe-haven status, although to a lesser extent than Gold's. As a yieldless asset, Silver tends to rise with lower interest rates. Its moves also depend on how the US Dollar (USD) behaves as the asset is priced in dollars (XAG/USD). A strong Dollar tends to keep the price of Silver at bay, whereas a weaker Dollar is likely to propel prices up. Other factors such as investment demand, mining supply – Silver is much more abundant than Gold – and recycling rates can also affect prices.
Silver is widely used in industry, particularly in sectors such as electronics or solar energy, as it has one of the highest electric conductivity of all metals – more than Copper and Gold. A surge in demand can increase prices, while a decline tends to lower them. Dynamics in the US, Chinese and Indian economies can also contribute to price swings: for the US and particularly China, their big industrial sectors use Silver in various processes; in India, consumers’ demand for the precious metal for jewellery also plays a key role in setting prices.
Silver prices tend to follow Gold's moves. When Gold prices rise, Silver typically follows suit, as their status as safe-haven assets is similar. The Gold/Silver ratio, which shows the number of ounces of Silver needed to equal the value of one ounce of Gold, may help to determine the relative valuation between both metals. Some investors may consider a high ratio as an indicator that Silver is undervalued, or Gold is overvalued. On the contrary, a low ratio might suggest that Gold is undervalued relative to Silver.
-
14:48
NZD/USD Price Forecast: Posts fresh weekly high near 0.5700
- NZD/USD refreshes weekly high near 0.5700 as receding global trade war risks have improved the safe-haven demand.
- The USD strives to gain ground on the back of upbeat US ADP Employment data for January.
- The NZ economy will also face the consequences of the US-China trade war.
The NZD/USD pair posts a fresh weekly high near 0.5700 in Wednesday’s North American session. The Kiwi pair gains as the US Dollar (USD) has remained under pressure due to receding risks of a global trade war.
Investors expect the trade war to remain between the United States (US) and China as the latter has imposed tariffs on a few items from the US economy in retaliation to President Donald Trump’s decision of a 10% levy on all imports from China.
The US Dollar Index (DXY), which tracks the Greenback’s value against six major currencies, refreshes weekly low to near 107.40. However, the Greenback has got some buying interest after the release of the United States (US) ADP Employment Change data, which showed that the private sector hired 183K workers in January, higher than estimates of 150K and the prior release of 176K, revised significantly higher from 122K.
US Dollar PRICE Today
The table below shows the percentage change of US Dollar (USD) against listed major currencies today. US Dollar was the strongest against the Canadian Dollar.
USD EUR GBP JPY CAD AUD NZD CHF USD -0.21% -0.26% -0.78% -0.19% -0.28% -0.51% -0.22% EUR 0.21% -0.05% -0.59% 0.02% -0.06% -0.29% -0.01% GBP 0.26% 0.05% -0.56% 0.07% -0.02% -0.25% 0.04% JPY 0.78% 0.59% 0.56% 0.61% 0.52% 0.27% 0.57% CAD 0.19% -0.02% -0.07% -0.61% -0.08% -0.32% -0.03% AUD 0.28% 0.06% 0.02% -0.52% 0.08% -0.23% 0.05% NZD 0.51% 0.29% 0.25% -0.27% 0.32% 0.23% 0.29% CHF 0.22% 0.01% -0.04% -0.57% 0.03% -0.05% -0.29% The heat map shows percentage changes of major currencies against each other. The base currency is picked from the left column, while the quote currency is picked from the top row. For example, if you pick the US Dollar from the left column and move along the horizontal line to the Japanese Yen, the percentage change displayed in the box will represent USD (base)/JPY (quote).
Meanwhile, the outlook of the New Zealand Dollar (NZD) remains uncertain as the impact of a trade war between the US and China will also be borne by the New Zealand economy, being one of the leading trading partners of China.
On the monetary policy front, market participants expect the Reserve Bank of New Zealand (RBNZ) to continue reducing its cash rate to reduce deepening risks of inflation undershooting their target of 2%.
NZD/USD rebounds strongly from the support zone plotted around 0.5500 on a weekly timeframe. However, the outlook of the Kiwi pair is still bearish as the 20-week Exponential Moving Average (EMA) near 0.5800 is sloping downwards.
The 14-week Relative Strength Index (RSI) attempts to return inside the 40.00-60.00 range. A fresh bearish momentum would trigger if the RSI fails to do the same.
The Kiwi pair could decline to nears round-level supports of 0.5400 and 0.5300 if it breaks below the 13-year low of 0.5470.
On the flip side, a decisive break above the November 29 high of 0.5930 could drive the pair to the November 15 high of 0.5970 and the psychological resistance of 0.6000.
NZD/USD weekly chart
US-China Trade War FAQs
Generally speaking, a trade war is an economic conflict between two or more countries due to extreme protectionism on one end. It implies the creation of trade barriers, such as tariffs, which result in counter-barriers, escalating import costs, and hence the cost of living.
An economic conflict between the United States (US) and China began early in 2018, when President Donald Trump set trade barriers on China, claiming unfair commercial practices and intellectual property theft from the Asian giant. China took retaliatory action, imposing tariffs on multiple US goods, such as automobiles and soybeans. Tensions escalated until the two countries signed the US-China Phase One trade deal in January 2020. The agreement required structural reforms and other changes to China’s economic and trade regime and pretended to restore stability and trust between the two nations. However, the Coronavirus pandemic took the focus out of the conflict. Yet, it is worth mentioning that President Joe Biden, who took office after Trump, kept tariffs in place and even added some additional levies.
The return of Donald Trump to the White House as the 47th US President has sparked a fresh wave of tensions between the two countries. During the 2024 election campaign, Trump pledged to impose 60% tariffs on China once he returned to office, which he did on January 20, 2025. With Trump back, the US-China trade war is meant to resume where it was left, with tit-for-tat policies affecting the global economic landscape amid disruptions in global supply chains, resulting in a reduction in spending, particularly investment, and directly feeding into the Consumer Price Index inflation.
-
14:30
Canada International Merchandise Trade came in at $0.71B, below expectations ($0.75B) in December
-
14:30
Canada Imports rose from previous $66.43B to $68.76B in December
-
14:30
United States Goods and Services Trade Balance registered at $-98.4B, below expectations ($-96.6B) in December
-
14:30
United States Goods Trade Balance dipped from previous $-122.1B to $-123B in December
-
14:30
Canada Exports climbed from previous $66.11B to $69.46B in December
-
14:19
BoE expected to cut 25bps Thursday – Scotiabank
Final January UK PMI data were revised lower but both Services and Composite activity remained in expansion territory (at 50.8 and 50.6 respectively), Scotiabank's Chief FX Strategist Shaun Osborne notes.
GBP firmer through low 1.25s
"The Pound Sterling (GBP) gains are stretching a little ahead of most of its G10 peers on the day so far. Thursday’s BoE policy decision is widely expected to result in a 25bps cut and signs that more cuts are coming."
"The technical 'damage' to the pound inflicted by the weekend volatility in the USD was less severe than some of its peers and Cable’s improvement from Monday’s low suggests the strengthening in the pound’s technical tone that was developing in late January is getting back on track."
"Spot is trading at a minor new cycle high today, holding gains above its 40-day MA and bear trendline resistance in place since late September. Cable may push on to 1.26001/0. Support is 1.2490/95 and 1.2400/10."
-
14:19
US ADP private sector employment rises 183,000 in January vs. 150,000 expected
- Employment in the US private sector rose at a stronger pace than expected in January.
- US Dollar Index stays deep in negative territory near 107.50.
Private sector employment in the US rose 183,000 in December and annual pay was up 4.7% year-over-year, the Automatic Data Processing (ADP) reported on Wednesday. This reading followed the 176,000 (revised from 122,000) increase recorded in December and came in above the market expectation of 150,000.
Assessing the survey's findings, “we had a strong start to 2025 but it masked a dichotomy in the labor market,” said Nela Richardson, chief economist, ADP. “Consumer-facing industries drove hiring, while job growth was weaker in business services and production.”
Market reaction
The US Dollar Index struggles to stage a rebound after this data and was last seen losing 0.42% on the day at 107.55.
-
14:16
EUR stretches rebound to low 1.04s – Scotiabank
Weaker than expected PMIs from Spain, downward revisions to French data and a minor upgrade for the German Composite index saw the final Eurozone January Services index marked lower than the preliminary release at 51.3 (from 51.4) while the Composite Index was unchanged at 50.1, Scotiabank's Chief FX Strategist Shaun Osborne notes.
Tariff focus may soon shift to EU
"Details reflected firmer orders and new business but the outlook for sluggish growth and somewhat lower ECB interest rates remains. Monday’s 'hammer' low signal got some confirming support from additional gains in the EUR Tuesday and a further pick up in the EUR today is getting hard to ignore."
"The EUR has closed the gap on the short-term chart which was left open by the volatile market swings over the weekend which may pave the way for spot gains to extend to 1.0450/75 in the short run. Support is 1.0350/55."
-
14:15
United States ADP Employment Change above forecasts (150K) in January: Actual (183K)
-
14:14
CAD extends recovery to 1.43 area – Scotiabank
Tariff worries are easing—for now, at least—which is allowing the CAD to stabilize. The hefty swing lower in the USD from the early week peak may not extend much further for now but the sell-off is material, Scotiabank's Chief FX Strategist Shaun Osborne notes.
Firm USD support likely in mid/upper 1.42s
"Unless trade talks deteriorate significantly again, there is a chance that the USD/CAD peak reached Monday near 1.48 will represent a significant high-water mark for spot. Spot has priced in some tariff risk over the past few weeks (perhaps something in the region of 10%-plus) so investors could start to price that risk out again in the coming weeks *if* confidence grows that the US will not resort to any additional tariff action."
"That’s still a pretty big “if” though. Short-term spreads are about 50bps wider than early November, however, and the huge US/Canada interest rate differential will limit just how much of a rebound the CAD will see in the next few weeks at least. Spot fair value has eased to 1.4391, driving a minor, and unusual by recent standards, CAD overvaluation relative to its estimated equilibrium."
"CAD-positive signals are piling up on the charts. After Monday’s big, daily reversal signal, price action through the middle of the week reflects a potential bearish weekly reversal as well. Spot closed below its 40-day MA for the first time since early October yesterday. But there were a number of CAD-positive technical developments evident on the charts through late January which yielded no CAD improvement so markets may not buy into the idea of a big CAD rally too willingly just yet. The early January low at 1.4260 represents major support ahead of a push back to 1.40/1.41. Resistance is 1.4350/75."
-
14:11
USD slides as trade fears ease – Scotiabank
The USD continues to retreat, leaving the DXY more than 2% below Monday’s peak, Scotiabank's Chief FX Strategist Shaun Osborne notes.
USD trades broadly lower
"There is little fresh news to explain the US Dollar’s (USD) slide. Rather, investors are ditching long USD positions as trade war risks ease, at least for the moment. Global stocks are soft and major bond markets are firmer, with Treasurys underperforming slightly. Commodities are trading a little lower overall on the session. Generally, soft stocks, relatively firmer US yields and weak commodities would all tilt risks towards a somewhat stronger USD. But that’s not the case today."
"This is perhaps where the preponderance of long USD positioning evident in recent data helps explain price action. Also, technical signals are leaning quite obviously bearish for the DXY on the week so far, given the scale of the sell-off, but it’s hard to buy into the idea of a sharp USD fall with trade war risks clearly still seemingly high. Beyond recent developments, President Trump has yet to confront European allies with tariffs—something that he has promised is 'absolutely' coming—and investors should not get too comfortable with the appearance of Trump rolling over easily after minimal concessions from Mexico and Canada won temporary reprieves."
"More volatility seems very likely across markets in the coming weeks as the Trump team tries to reset the global trade picture. US data releases this morning include ADP jobs, final Services and Composite PMIs and the January Services ISM data. Fed speakers include Barkin, Goolsbee, Bowman and Jefferson."
-
14:06
Fed's Barkin: Still think policy rate is modestly restrictive
In an interview with Bloomberg on Wednesday, Richmond Federal Reserve President Thomas Barkin said that he still thinks the policy rate is modestly restrictive, per Reuters.
Key takeaways
"Looking forward, it is hard to know what specific tariffs are coming."
"Uncertainty goes beyond tariffs to immigration, regulation, other issues."
"Baseline data has been favorable."
"Expecting 12 month inflation numbers to come down nicely."
"Still leaning towards cuts this year."
"Would never take any policy move off the table, but hikes would require an economy overheating."
"No evidence of overheating at this point."
"Recalibrated to a place that is more sensible to where the economy is now."
"Bias is to see what happens and react to it."
Market reaction
The US Dollar stays under bearish pressure following these comments. At the time of press, the USD Index was down 0.48% on the day at 107.48.
-
13:41
US Dollar extends correction as global trade war fears ease
- The US Dollar slides lower against most major peers and looks for support on Wednesday.
- Economic data and risk premium unwind in the Greenback is triggering a correction.
- The US Dollar Index (DXY) falls below 108.00 and tests major support at 107.50.
The US Dollar Index (DXY), which tracks the performance of the US Dollar against six major currencies, dives lower and trades near 107.50 at the time of writing on Wednesday ahead of the US Purchase Managers Index (PMI) releases from both S&P Global and the Institute for Supply Management (ISM). Tensions in markets over the United States (US) President Donald Trump’s tariffs are unwinding now that levies on Mexico and Canada slapped over the weekend have been paused. This coincides with some US Dollar (USD) risk premium easing this Wednesday while Chinese traders head back to their desks after the Chinese New Year, with a surge in trading volumes.
As mentioned above, the economic data calendar shows a bulk of PMI releases on Wednesday. In Europe, the aggregate Eurozone, German, French, and Spanish PMI data have already been released earlier in the day, with final readings for January falling roughly in line to below their preliminary readings. In the US, S&P Global is set to release its reading in the early American session, with the ISM data specifically for the Services sector set to be issued just minutes thereafter.
Daily digest market movers: Data takes over from tariffs
- At 13:15 GMT, the ADP Employment Change for the private sector will be released. Expectations are for an increase of 150,000 new jobs in January compared to 122,000 previously.
- At 14:45 GMT, S&P Global will release its final reading for the Services and Composite PMI for January. No changes are expected from preliminary readings, with Services standing at 52.8 and the Composite at 52.4.
- At 15:00 GMT, the ISM will release its January reading for the Services sector:
- Services PMI is expected to tick up to 54.3 from 54.1 in December.
- The Prices Paid component has no forecast and was at 64.4 in the previous release.
- At 18:00 GMT, Chicago Fed President Austan Goolsbee delivers a speech on the current economy at the Chicago Fed's 31st Annual Automotive Insights Symposium, held at the Bank's Detroit Branch.
- Near 20:00 GMT, Federal Reserve Governor Michelle Bowman delivers a speech on Brief Economic Update and Bank Regulation at the 2025 Kansas Bankers Association Harold A. Stones Government Relations Conference.
- Equities are in deep red numbers, with Chinese traders returning to markets after the Chinese New Year holidays and having a lot to catch up with. Where losses in Europe are still contained, US futures are seeing the Nasdaq down by 1%.
- The CME FedWatch tool projects an 83.5% chance of the Fed keeping interest rates unchanged in the next meeting on March 19.
- The US 10-year yield is trading around 4.474%, just a sigh away from its yearly low of 4.46% seen on Monday.
- Gold hits another fresh all-time high above $2,875, with investors fleeing equities and bonds, heading into bullion.
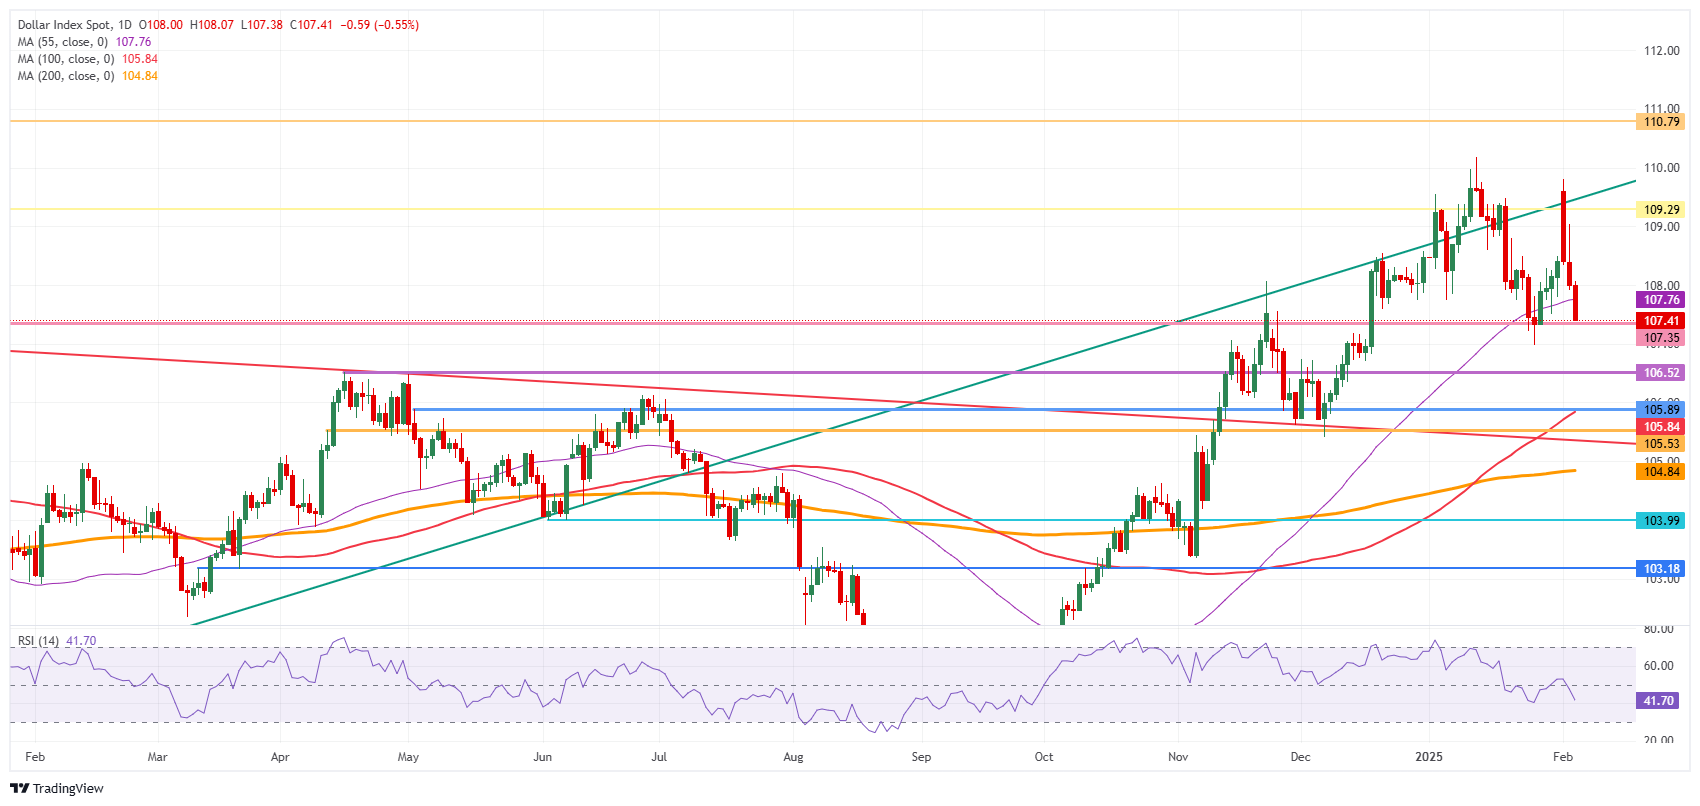
US Dollar Index Technical Analysis: Safe haven excludes Dollar
The US Dollar Index (DXY) extends correction and dives lower on Wednesday. Traders and investors are heading to safe havens like Gold and the Swiss Franc (CHF). For once, the Greenback is not part of the rescue party, as risk-premium gained at the beginning of the week after President Trump slapped Mexico and Canada with tariffs over the weekend is starting to ease, no longer supporting an elevated US Dollar.
On the upside, the first barrier at 109.30 (July 14, 2022, high and rising trendline) was briefly surpassed but did not hold on Monday. Once that level is reclaimed, the next level to hit before advancing further remains at 110.79 (September 7, 2022, high).
On the downside, the October 3, 2023, high at 107.35 acts is trying to hold support and withstand the selling pressure this Wednesday. For now, that looks to be holding, though the Relative Strength Index (RSI) still has some room for the downside. Hence, look for 106.52 or even 105.89 as better levels.

US Dollar Index: Daily Chart
US-China Trade War FAQs
Generally speaking, a trade war is an economic conflict between two or more countries due to extreme protectionism on one end. It implies the creation of trade barriers, such as tariffs, which result in counter-barriers, escalating import costs, and hence the cost of living.
An economic conflict between the United States (US) and China began early in 2018, when President Donald Trump set trade barriers on China, claiming unfair commercial practices and intellectual property theft from the Asian giant. China took retaliatory action, imposing tariffs on multiple US goods, such as automobiles and soybeans. Tensions escalated until the two countries signed the US-China Phase One trade deal in January 2020. The agreement required structural reforms and other changes to China’s economic and trade regime and pretended to restore stability and trust between the two nations. However, the Coronavirus pandemic took the focus out of the conflict. Yet, it is worth mentioning that President Joe Biden, who took office after Trump, kept tariffs in place and even added some additional levies.
The return of Donald Trump to the White House as the 47th US President has sparked a fresh wave of tensions between the two countries. During the 2024 election campaign, Trump pledged to impose 60% tariffs on China once he returned to office, which he did on January 20, 2025. With Trump back, the US-China trade war is meant to resume where it was left, with tit-for-tat policies affecting the global economic landscape amid disruptions in global supply chains, resulting in a reduction in spending, particularly investment, and directly feeding into the Consumer Price Index inflation.
-
13:00
Brazil Industrial Output (YoY) came in at 1.6%, above expectations (1.1%) in December
-
13:00
Brazil Industrial Output (MoM) above expectations (-0.5%) in December: Actual (-0.3%)
-
13:00
United States MBA Mortgage Applications up to 2.2% in January 31 from previous -2%
-
12:47
AUD/USD soars to near 0.6300 as market sentiment turns cheerful
- AUD/USD rallies to near 0.6300 as the market sentiment becomes favorable for risk-sensitive assets.
- The risk-appetite of investors improves on the assumption that the scope of the trade war will be limited between the US and China.
- US-China trade war and RBA dovish bets would limit the Australian Dollar’s upside.
The AUD/USD pair surges to near the key level of 0.6300 in Wednesday’s European session. The Aussie pair strengthens as the risk appetite of investors has improved amid expectations that the trade war won’t be global and will be limited between the United States (US) and China.
S&P 500 futures are slightly down in European trading hours but have recovered their losses significantly. The US Dollar Index (DXY), which tracks the Greenback’s value against six major currencies, declines sharply to near 107.50, the lowest level in more than a week.
Market participants are anticipating a lethal trade war between the US and China as the latter has retaliated with levies of 15% on coal and LNG and 10% for crude oil, farm equipment, and some autos against US President Donald Trump’s decision to impose 10% tariffs on them.
Though a steady market environment has offered some relief to the Australian Dollar (AUD), investors expect the relief would be short-term as Australia would be the victim of the US-China trade war, being a leading trading partner of China.
Apart from that, firm market expectations that the Reserve Bank of Australia (RBA) will pivot to policy normalization from the policy meeting on February 18 would also weigh on the Australian Dollar.
In Wednesday’s session, investors will focus on the US ADP Employment Change and the ISM Services Purchasing Managers’ Index (PMI) data for January.
US-China Trade War FAQs
Generally speaking, a trade war is an economic conflict between two or more countries due to extreme protectionism on one end. It implies the creation of trade barriers, such as tariffs, which result in counter-barriers, escalating import costs, and hence the cost of living.
An economic conflict between the United States (US) and China began early in 2018, when President Donald Trump set trade barriers on China, claiming unfair commercial practices and intellectual property theft from the Asian giant. China took retaliatory action, imposing tariffs on multiple US goods, such as automobiles and soybeans. Tensions escalated until the two countries signed the US-China Phase One trade deal in January 2020. The agreement required structural reforms and other changes to China’s economic and trade regime and pretended to restore stability and trust between the two nations. However, the Coronavirus pandemic took the focus out of the conflict. Yet, it is worth mentioning that President Joe Biden, who took office after Trump, kept tariffs in place and even added some additional levies.
The return of Donald Trump to the White House as the 47th US President has sparked a fresh wave of tensions between the two countries. During the 2024 election campaign, Trump pledged to impose 60% tariffs on China once he returned to office, which he did on January 20, 2025. With Trump back, the US-China trade war is meant to resume where it was left, with tit-for-tat policies affecting the global economic landscape amid disruptions in global supply chains, resulting in a reduction in spending, particularly investment, and directly feeding into the Consumer Price Index inflation.
-
12:31
India M3 Money Supply: 9.6% (January 20) vs previous 10.1%
-
12:22
Growth below expectations to remain a structural drag for CNH – Société Générale
USD/CNH is heavy near 7.2700. China’s private sector services growth traction unexpectedly slowed in January, Société Générale's FX analysts note.
Growth to remain well below expectations
"The Caixin services PMI fell to a four-month low at 51.0 (consensus: 52.4) vs. 52.2 in December. Earlier this week, the Caixin January manufacturing PMI showed the factory sector at a virtual standstill. China’s steady drip feed of stimulus has done little to improve the economy’s medium-term outlook, which we believe hinges crucially on boosting consumption spending."
"Until that has been accomplished, growth will remain well below expectations and a structural drag for CNH."
-
12:20
Markets continue to imply another RBNZ 50bps rate cut in February – Société Générale
NZD/USD is consolidating recent gains triggered by broad USD weakness, Société Générale's FX analysts note.
NZ-US 2-year bond yield spreads can further weigh on NZD/USD
"New Zealand labor market conditions further weakened in Q4, largely matching expectations. The unemployment rate rose three ticks to a four-year high at 5.1% (consensus & RBNZ: 5.1%). Employment dipped -0.1% q/q (consensus: -0.2%, RBNZ: -0.3%) vs. -0.6% in Q3 (revised down from -0.5%). Private sector wages grew 0.6% q/q (consensus: 0.6%, RBNZ: 0.5%) vs. 0.6% in Q3."
"In line with RBNZ guidance, markets continue to imply another 50bps rate cut to 3.75% at the February 19 meeting and the policy rate to through around 3.00% over the next 12 months. Bottom line: NZ-US 2-year bond yield spreads can further weigh on NZD/USD."
-
12:17
Fed sticks to hawkish rhetoric, according to FXS Fed Sentiment Index
Following the first policy meeting of the year, the Federal Reserve (Fed) announced that it left the policy rate unchanged at 4.25%-4.5% in a widely anticipated decision. In its policy statement, the Fed acknowledged that inflation data has been stagnant in recent months. Additionally, the central bank removed earlier language suggesting inflation had "made progress" toward its 2% target, instead stating that the pace of price increases "remains elevated."
In the post meeting press conference, Chairman Jerome Powell reiterated that they don't need to be in a hurry to make adjustment to monetary policy, citing elevated uncertainty because of potentially significant changes to economic policies under the Trump administration.
FXStreet (FXS) Fed Sentiment Index rose above 120 from around 107 before the event, suggesting that the Fed adopted a more hawkish tone after the January meeting.
Comments from Fed policymakers on the policy outlook confirmed the hawkish rhetoric, with the FXS Fed Sentiment Index edging only slightly lower to 120.
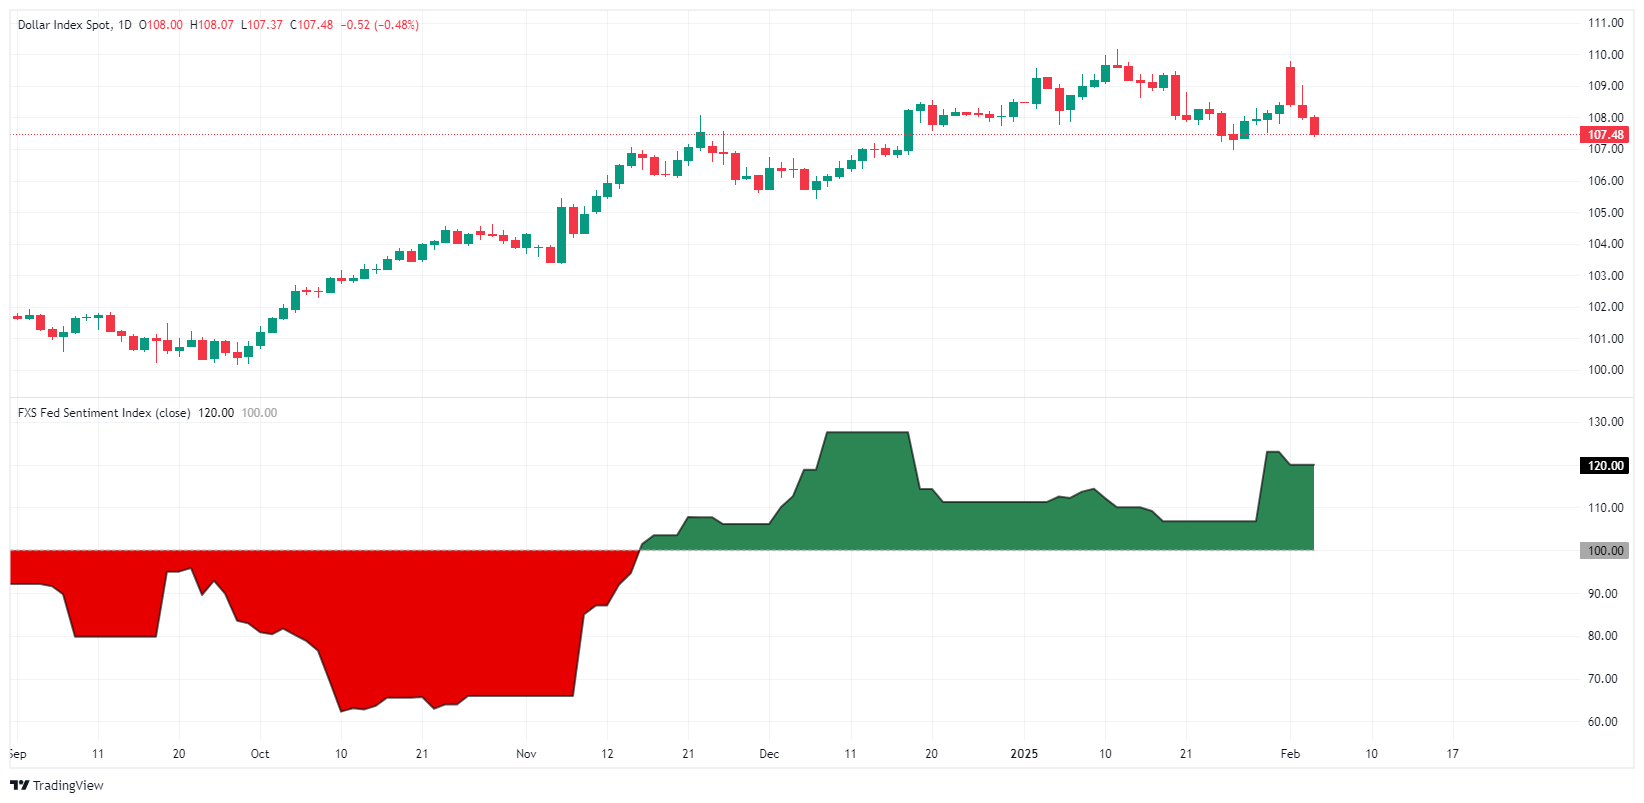
Fed Vice Chairman Philip Jefferson said late Tuesday that they were facing uncertainty around government policies, adding that the strong economy would allow them to adopt a cautious approach to further policy-easing. Similarly, "the Fed can take its time to look at data and policy changes," San Francisco Fed President Mary Daly. Finally, Chicago Fed President Austan Goolsbee noted that fiscal decisions impacting prices or employment will require careful consideration, arguing that they should slow the pace of rate cuts due to uncertainties.
Fed FAQs
Monetary policy in the US is shaped by the Federal Reserve (Fed). The Fed has two mandates: to achieve price stability and foster full employment. Its primary tool to achieve these goals is by adjusting interest rates. When prices are rising too quickly and inflation is above the Fed’s 2% target, it raises interest rates, increasing borrowing costs throughout the economy. This results in a stronger US Dollar (USD) as it makes the US a more attractive place for international investors to park their money. When inflation falls below 2% or the Unemployment Rate is too high, the Fed may lower interest rates to encourage borrowing, which weighs on the Greenback.
The Federal Reserve (Fed) holds eight policy meetings a year, where the Federal Open Market Committee (FOMC) assesses economic conditions and makes monetary policy decisions. The FOMC is attended by twelve Fed officials – the seven members of the Board of Governors, the president of the Federal Reserve Bank of New York, and four of the remaining eleven regional Reserve Bank presidents, who serve one-year terms on a rotating basis.
In extreme situations, the Federal Reserve may resort to a policy named Quantitative Easing (QE). QE is the process by which the Fed substantially increases the flow of credit in a stuck financial system. It is a non-standard policy measure used during crises or when inflation is extremely low. It was the Fed’s weapon of choice during the Great Financial Crisis in 2008. It involves the Fed printing more Dollars and using them to buy high grade bonds from financial institutions. QE usually weakens the US Dollar.
Quantitative tightening (QT) is the reverse process of QE, whereby the Federal Reserve stops buying bonds from financial institutions and does not reinvest the principal from the bonds it holds maturing, to purchase new bonds. It is usually positive for the value of the US Dollar.
-
12:15
JPY: BOJ policy rate is still expected to peak around 1.00% – Société Générale
Japanese Yen (JPY) is outperforming and 10-year JGB yields edged up to almost 1.30%, highest level since April 2011, Société Générale's FX analysts note.
JPY is outperforming and 10-year JGB yields
"Japan wage growth ran hot in December. Nominal cash earnings came in 1.1pts higher than expected at near a three-decade high of 4.8% y/y vs. 3.9% in November (revised up from 3.0%) reflecting a jump in bonuses."
"The less volatile scheduled pay growth for full-time workers matched consensus at 2.8% y/y vs. 2.7% y/y in November and is down from a series high of 3% in July 2024. This is consistent with the Bank of Japan (BOJ) projection for inflation to stabilize around its 2% target in 2026 assuming productivity growth of 1%."
"Bottom line: the BOJ policy rate is still expected to peak around 1.00% over the next two years which curtails upside for JPY and JGB yields."
-
11:58
USD/CAD slumps below 1.4300 as CAD capitalizes on Trump’s suspension of tariff orders
- USD/CAD falls sharply below 1.4300 as the Canadian Dollar continues to advance on US President Trump’s decision to postpone tariffs on Canada.
- BofA expects US tariff threats to China will continue to persist until a new USMCA deal gets negotiated.
- Investors await the US ISM Services PMI and the ADP Employment data for December.
The USD/CAD pair extends its losing streak below the key level of 1.4300 in Wednesday’s European session. The Loonie pair weakens as the Canadian Dollar (CAD) continues to gain, given that United States (US) President Donald Trump delayed his orders to impose 25% tariffs on Canada for 30 days. President Trump suspended orders after Canada agreed for criminal enforcement at borders to stop the flow of drugs and undocumented immigrants into the US.
A suspension in tariff orders on Canada has forced market experts to revise the Canadian economic outlook, who were accounting for the impact of levies. While the Canadian Dollar has surged this week against the US Dollar due to a relief rally from Trump’s decision to put the tariff plan on hold, analysts at Bank of America (BofA) expect the rally is unlikely to sustain as US tariffs threats and headlines on Canada to persist until a “new United States-Mexico-Canada Agreement (USMCA) deal is negotiated”.
This week, investors will focus on the Canadian employment data for January, which will be released on Friday. The employment report is expected to show that the economy added 25K workers, significantly fewer than 90.9K addition seen in December. The Unemployment Rate is estimated to have accelerated to 6.8% from the former release of 6.7%.
The labor market data will influence market expectations for the Bank of Canada’s (BoC) monetary policy outlook. Currently, traders expect the BoC to cut interest rates by 25 basis points (bps) to 2.75% in the March meeting.
Meanwhile, the US Dollar (USD) underperforms its major peers as the market sentiment turns cheerful amid expectations that Trump’s tariff agenda would be less fearful than expected.
On the economic front, investors will focus on the US ADP Employment Change and the ISM Services PMI data for January, which will be published in Wednesday’s North American session.
Canadian Dollar FAQs
The key factors driving the Canadian Dollar (CAD) are the level of interest rates set by the Bank of Canada (BoC), the price of Oil, Canada’s largest export, the health of its economy, inflation and the Trade Balance, which is the difference between the value of Canada’s exports versus its imports. Other factors include market sentiment – whether investors are taking on more risky assets (risk-on) or seeking safe-havens (risk-off) – with risk-on being CAD-positive. As its largest trading partner, the health of the US economy is also a key factor influencing the Canadian Dollar.
The Bank of Canada (BoC) has a significant influence on the Canadian Dollar by setting the level of interest rates that banks can lend to one another. This influences the level of interest rates for everyone. The main goal of the BoC is to maintain inflation at 1-3% by adjusting interest rates up or down. Relatively higher interest rates tend to be positive for the CAD. The Bank of Canada can also use quantitative easing and tightening to influence credit conditions, with the former CAD-negative and the latter CAD-positive.
The price of Oil is a key factor impacting the value of the Canadian Dollar. Petroleum is Canada’s biggest export, so Oil price tends to have an immediate impact on the CAD value. Generally, if Oil price rises CAD also goes up, as aggregate demand for the currency increases. The opposite is the case if the price of Oil falls. Higher Oil prices also tend to result in a greater likelihood of a positive Trade Balance, which is also supportive of the CAD.
While inflation had always traditionally been thought of as a negative factor for a currency since it lowers the value of money, the opposite has actually been the case in modern times with the relaxation of cross-border capital controls. Higher inflation tends to lead central banks to put up interest rates which attracts more capital inflows from global investors seeking a lucrative place to keep their money. This increases demand for the local currency, which in Canada’s case is the Canadian Dollar.
Macroeconomic data releases gauge the health of the economy and can have an impact on the Canadian Dollar. Indicators such as GDP, Manufacturing and Services PMIs, employment, and consumer sentiment surveys can all influence the direction of the CAD. A strong economy is good for the Canadian Dollar. Not only does it attract more foreign investment but it may encourage the Bank of Canada to put up interest rates, leading to a stronger currency. If economic data is weak, however, the CAD is likely to fall.
-
11:32
EUR/USD advances as investors see limited trade war between US and China
- EUR/USD rises above 1.0400 as the risk-premium of the US Dollar eases amid diminishing fears of a global trade war.
- The ECB is expected to continue reducing interest rates amid confidence that the disinflation trend towards the 2% target is intact.
- Investors await the US ADP Employment Change and the ISM Services PMI for January.
EUR/USD advances above 1.0400 in Wednesday’s European session. The major currency pair gains as the US Dollar (USD) extends its losing streak for the third trading day.
The US Dollar Index (DXY), which tracks the Greenback’s value against six major currencies, declines to near 107.50 as it loses some risk premium, with investors assuming that the scope of a trade war won’t be wider.
Market participants expect the trade war to be mainly between the United States (US) and China as the latter has retaliated against 10% levies by imposing tariffs on various US exports, including farm equipment, some autos, and energy items such as Coal and Liquefied Natural Gas (LNG).
With the rest of the world, investors expect US President Donald Trump will use tariffs as a tool to have a dominant position in negotiating deals with trading partners. President Trump's postponement of 25% tariffs on Canada and Mexico stemmed from expectations that tariffs are more of a political maneuver.
Meanwhile, the next trigger for the US Dollar (USD) will be the US Nonfarm Payrolls (NFP) data for January, which will be released on Friday. The official employment data is expected to influence speculation about the Federal Reserve’s (Fed) monetary policy guidance.
In Wednesday’s session, investors will focus on the US ADP Employment Change and the ISM Services Purchasing Managers Index (PMI) data for January.
Daily digest market movers: EUR/USD gains sharply despite Euro’s underperformance
- EUR/USD moves higher at the expense of the US Dollar as the Euro (EUR) underperforms against its major peers amid firm expectations that the European Central Bank (ECB) will continue with its policy-easing spree, given that officials are confident about inflation sustainably returning to the central bank’s target of 2% this year.
- In Wednesday’s European session, ECB Vice President Luis de Guindos said in an interview with the Slovak newspaper Hospodarske Noviny that he sees “inflation approaching the ECB's target” but expects “little uptick in next few months on energy”. When asked about for how long the ECB will continue reducing its borrowing rates, de Guindos said, “Even if our current trajectory under the current circumstances is clear, nobody knows the level at which interest rates will end up."
- Last week, the ECB reduced its Deposit Facility rate by 25 basis points (bps) to 2.75% and guided that the monetary policy is still restrictive. Traders expect the ECB to cut interest rates three times more in the next three policy meetings.
- Meanwhile, market participants are cautious about the Eurozone outlook amid fears that the European Union (EU) will be the next on the list of US President Trump on whom he can threaten to impose tariffs actively. Over the weekend, Trump said that tariffs would definitely happen with the European Union because “they've really taken advantage of us".
Technical Analysis: EUR/USD rebounds to near 1.0400
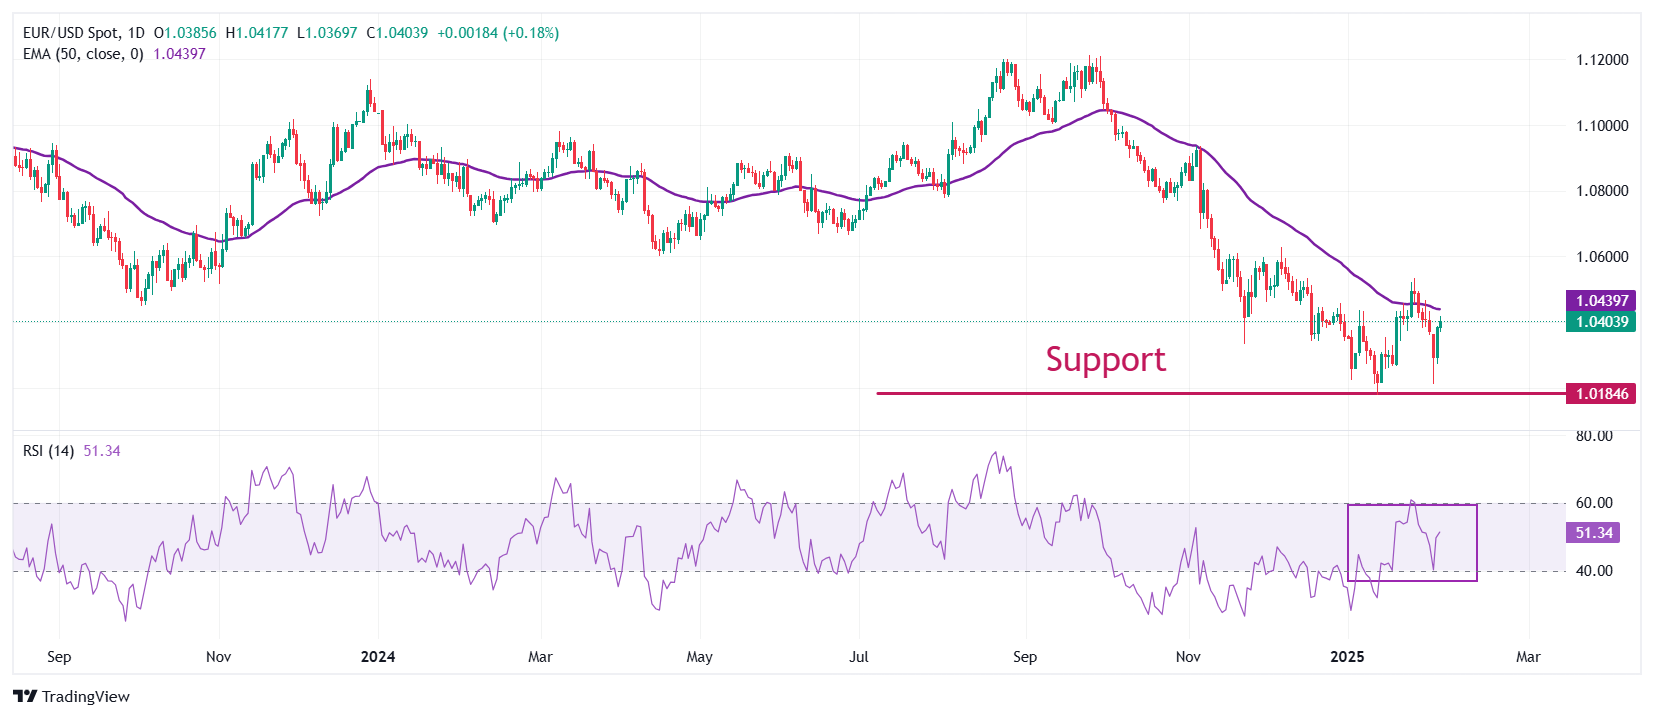
EUR/USD recovers from its three-week low of 1.0210 reached on Monday. However, the pair is still below the 50-day Exponential Moving Average (EMA), which trades around 1.0440, suggesting that the overall trend is still bearish.
The 14-day Relative Strength Index (RSI) oscillates in the 40.00-60.00 range, suggesting a sideways trend.
Looking down, the January 13 low of 1.0177 and the round-level support of 1.0100 will act as major support zones for the pair. Conversely, the psychological resistance of 1.0500 will be the key barrier for the Euro bulls.
Euro FAQs
The Euro is the currency for the 19 European Union countries that belong to the Eurozone. It is the second most heavily traded currency in the world behind the US Dollar. In 2022, it accounted for 31% of all foreign exchange transactions, with an average daily turnover of over $2.2 trillion a day. EUR/USD is the most heavily traded currency pair in the world, accounting for an estimated 30% off all transactions, followed by EUR/JPY (4%), EUR/GBP (3%) and EUR/AUD (2%).
The European Central Bank (ECB) in Frankfurt, Germany, is the reserve bank for the Eurozone. The ECB sets interest rates and manages monetary policy. The ECB’s primary mandate is to maintain price stability, which means either controlling inflation or stimulating growth. Its primary tool is the raising or lowering of interest rates. Relatively high interest rates – or the expectation of higher rates – will usually benefit the Euro and vice versa. The ECB Governing Council makes monetary policy decisions at meetings held eight times a year. Decisions are made by heads of the Eurozone national banks and six permanent members, including the President of the ECB, Christine Lagarde.
Eurozone inflation data, measured by the Harmonized Index of Consumer Prices (HICP), is an important econometric for the Euro. If inflation rises more than expected, especially if above the ECB’s 2% target, it obliges the ECB to raise interest rates to bring it back under control. Relatively high interest rates compared to its counterparts will usually benefit the Euro, as it makes the region more attractive as a place for global investors to park their money.
Data releases gauge the health of the economy and can impact on the Euro. Indicators such as GDP, Manufacturing and Services PMIs, employment, and consumer sentiment surveys can all influence the direction of the single currency. A strong economy is good for the Euro. Not only does it attract more foreign investment but it may encourage the ECB to put up interest rates, which will directly strengthen the Euro. Otherwise, if economic data is weak, the Euro is likely to fall. Economic data for the four largest economies in the euro area (Germany, France, Italy and Spain) are especially significant, as they account for 75% of the Eurozone’s economy.
Another significant data release for the Euro is the Trade Balance. This indicator measures the difference between what a country earns from its exports and what it spends on imports over a given period. If a country produces highly sought after exports then its currency will gain in value purely from the extra demand created from foreign buyers seeking to purchase these goods. Therefore, a positive net Trade Balance strengthens a currency and vice versa for a negative balance.
-
11:31
USD/CNH: Likely to trade in a lower range of 7.2680/1.3200 – UOB Group
Instead of continuing to decline, US Dollar (USD) more likely to trade in a lower range of 7.2680/1.3200. In the longer run, outlook is mixed; USD could trade in a 7.2430/7.3580 range for now, UOB Group's FX analysts Quek Ser Leang and Peter Chia note.
Outlook for USD is mixed for now
24-HOUR VIEW: "Following Monday’s volatile price movements, we indicated yesterday that 'the rapid swings have resulted in a mixed outlook.' We expected USD to 'trade between 7.2950 and 7.3400.' The subsequent price movements did not turn out as we expected. USD rose to 7.3361 and dropped sharply, reaching a low of 7.2755. It rebounded from the low to close at 7.2875 (-0.20%). Despite the decline, there is no clear increase in momentum. Instead of continuing to weaken, USD is more likely to trade in a lower range of 7.2680/7.3200. In other words, a sustained break below 7.2680 is unlikely."
1-3 WEEKS VIEW: "Yesterday (04 Feb, spot at 7.3160), we indicated that 'if USD breaches 7.2950 (‘strong support’ level), it would mean that it “is likely to trade in a range instead of advancing further.' USD subsequently dropped to a low of 7.2755. The outlook for USD is mixed after the volatile price movements over the past couple of days. For now, it could trade in a broad range of 7.2430/7.3580."
-
11:30
USD/JPY: High achieved last week at 156.25 could cap upside – BBH
USD/JPY recently formed a lower peak near 158.85 than the one achieved last year at 162, BBH FX analysts report.
Next bearish objectives are located at 151.50 and 151.00/150.80
"Daily MACD has been posting negative divergence and has now dipped below equilibrium line highlighting regain of downward momentum. This is also highlighted by break below a multi-month ascending trend line. The pair is now close to the 200-DMA at 152.80/152.50 which could be a potential support, but signals of a large bounce are not yet visible."
"High achieved last week at 156.25 could cap upside. Below the MA, next objectives are located at 151.50, the 38.2% retracement from September and projections at 151.00/150.80."
-
11:25
USD/JPY: USD is likely to trade in a range – UOB Group
US Dollar (USD) is under mild downward pressure; it could edge lower, but any decline is unlikely to break below 153.70. In the longer run, for the time being, USD is likely to trade in a 153.70/156.70 range, UOB Group's FX analysts Quek Ser Leang and Peter Chia note.
USD is under mild downward pressure
24-HOUR VIEW: "Following Monday’s choppy price action, we indicated yesterday that USD 'could continue to trade in an erratic manner, probably in a range of 154.50/156.00.' We did not expect USD to drop to a low of 154.16, closing at 154.33 (-0.27%). The decline has resulted in a slight increase in downward momentum. Today, we expect USD to edge lower, but given the mild downward momentum, any decline is unlikely to break below the major support at 153.70. On the upside, a breach of 155.00 (minor resistance is at 154.70) would suggest that the mild downward pressure has faded."
1-3 WEEKS VIEW: "There is not much to our update from yesterday (04 Feb, spot at 155.20). As indicated, USD 'is likely to trade in a 153.70/156.70 range for the time being.' Looking ahead, if USD were to break and remain below 153.70, it could trigger a sustained drop."
-
11:22
Oil: Trump signing a directive to increase economic pressure on Iran – ING
There were two key factors influencing oil prices yesterday, firstly downward pressure came from China announcing retaliatory tariffs against the US, which included targeting US energy flows. However, countering this later in the session was President Trump signing a directive to increase economic pressure on Iran by enforcing sanctions more strictly and so putting a large share of Iranian oil exports at risk, ING's commodity expert Warren Patterson notes.
US stance on Iran makes the market claw back the losses
"On China’s retaliatory tariffs, US crude oil and LNG were included, with a 10% and 15% tariff, respectively. However, with these tariffs only coming into force on 10 February, there is still room for a deal, although there are reports that President Trump is in no rush to talk to President Xi. The tariffs on oil and LNG affect a relatively small share of Chinese imports. In 2024, of the 11.11m b/d of crude oil imported, only 1.7% came from the US. For LNG, of the 105bcm imported last year, 5.6% came from the US."
"On the more bullish side for crude and as reflected in the price action during the latter part of yesterday’s trading session, was President Trump’s directive to increase economic pressure on Iran. This move shouldn’t come as too much of a surprise given that President Trump was hawkish towards Iran during his first term and reimposed oil sanctions against Iran back then. These sanctions were never lifted by Biden, but they were not enforced strictly."
"Overnight, API numbers showed that US crude oil inventories increased by 5m barrels over the last week, above the roughly 2m barrels build the market was expecting. In addition, gasoline inventories increased by 5.4m barrels, while distillate stocks fell by 7m barrels. The more widely followed EIA inventory report will be released later today."
-
11:11
Gold hits fresh all-time highs, enters bull run with fifth consecutive day of gains
- Gold hits yet again another fresh all-time high near $2,870 on Wednesday.
- Equities edge lower amid Asia reopening after Chinese New Year holidays.
- Gold extends rally for a five-day winning streak.
Gold’s price (XAU/USD) has no limit and rallies for a fifth consecutive day in a row on Wednesday, accounting for more than 2% of gains this week and hitting fresh all-time highs near $2,870. Softer economic data from the United States (US), which further supports the case for another rate cut from the Federal Reserve (Fed), together with quickly fading tariff fears, is lifting Gold to higher levels day by day.
On the economic data front, the calendar could become an additional tailwind for Gold to stretch even higher. This Wednesday, US Purchasing Managers Index (PMI) data for January will be released. A softer PMI print could be enough to set off Gold again to a new all-time high.
Daily digest market movers: Gold considered a safe haven
- Investors and traders are parking their cash under Gold, away from tech stocks, whilst being safe from the fresh lows in US yields as inflation concerns abate, Bloomberg reports.
- At 14:45 GMT, S&P Global will release the January final reading for the Purchasing Managers Index. The ISM Services PMI is expected to stay stable at 52.8.
- At 15:00 GMT, the Institute for Supply Management (ISM) will also release its PMI data for the Services sector as a whole:
- The PMI is expected to tick up to 54.3 from 54.1 in December.
- The Prices Paid component was at 64.4 last time and has no forecast.
- The CME FedWatch tool shows an 83.5% chance of keeping interest rate unchanged in the March 19 meeting, compared to 16.5% for a 25 basis points rate cut.
Technical Analysis: China market opens
Gold is on a tear again, and with China heading back into markets after the Chinese New Year holidays, expect to see a catch-up move in assets. With the Bullion rally heading into its fifth day on Wednesday, expect Chinese traders to try to catch up with it, meaning that any brief dip or pullback will be bought with interest. Since there are no reference levels that bear historic value anymore, the intraday Pivot Point levels are becoming increasingly important.
The Pivot Point level for this Wednesday is the first nearby support at $2,831. From there, S1 support should come in at $2,818, though it does not look the best. Instead, look for S2 support at $2,793, which roughly coincides with$2,790 (the previous high of October 31, 2024) as a more significant level.
On the other side, R2 resistance at $2,869 is the next level to watch, followed by the logic big figures such as $2,880 and $2,900. Further up, some analysts and strategists have already called for $3,000.
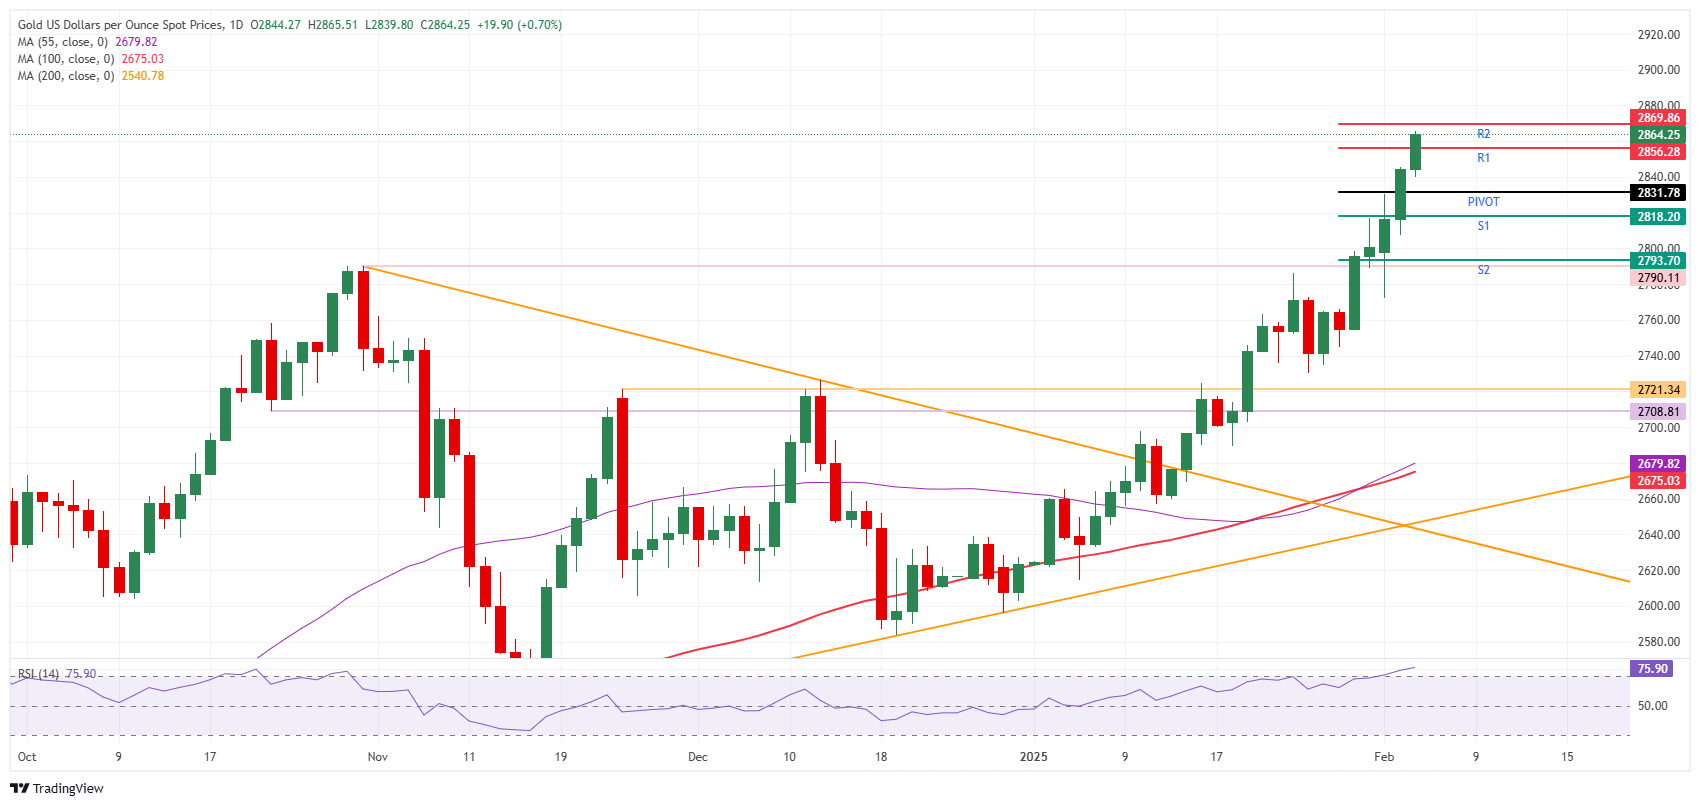
XAU/USD: Daily Chart
Gold FAQs
Gold has played a key role in human’s history as it has been widely used as a store of value and medium of exchange. Currently, apart from its shine and usage for jewelry, the precious metal is widely seen as a safe-haven asset, meaning that it is considered a good investment during turbulent times. Gold is also widely seen as a hedge against inflation and against depreciating currencies as it doesn’t rely on any specific issuer or government.
Central banks are the biggest Gold holders. In their aim to support their currencies in turbulent times, central banks tend to diversify their reserves and buy Gold to improve the perceived strength of the economy and the currency. High Gold reserves can be a source of trust for a country’s solvency. Central banks added 1,136 tonnes of Gold worth around $70 billion to their reserves in 2022, according to data from the World Gold Council. This is the highest yearly purchase since records began. Central banks from emerging economies such as China, India and Turkey are quickly increasing their Gold reserves.
Gold has an inverse correlation with the US Dollar and US Treasuries, which are both major reserve and safe-haven assets. When the Dollar depreciates, Gold tends to rise, enabling investors and central banks to diversify their assets in turbulent times. Gold is also inversely correlated with risk assets. A rally in the stock market tends to weaken Gold price, while sell-offs in riskier markets tend to favor the precious metal.
The price can move due to a wide range of factors. Geopolitical instability or fears of a deep recession can quickly make Gold price escalate due to its safe-haven status. As a yield-less asset, Gold tends to rise with lower interest rates, while higher cost of money usually weighs down on the yellow metal. Still, most moves depend on how the US Dollar (USD) behaves as the asset is priced in dollars (XAU/USD). A strong Dollar tends to keep the price of Gold controlled, whereas a weaker Dollar is likely to push Gold prices up.
-
11:00
Eurozone Producer Price Index (YoY) came in at 0%, above forecasts (-0.1%) in December
-
11:00
Eurozone Producer Price Index (MoM) meets expectations (0.4%) in December
-
10:50
USD: Some data to watch amid tariff news – ING
The US Dollar (USD) has continued to lose ground since the US border deal with Mexico and Canada was agreed on Monday. The focus is now on China, and a relatively measured response by Beijing to Trump’s tariffs is keeping markets optimistic that some deal can be struck before China’s retaliatory tariffs kick in on 10 January. AUD/USD – a key proxy for China sentiment – has entirely erased its short-term risk premium (i.e. undervaluation), ING's FX analyst Francesco Pesole notes.
Protectionism story remains the key driver
"A consensus US-China deal does seem the most likely scenario, but we sense markets are under-pricing the risk of a more prolonged trade spat. Tariffs on China aren’t as impactful on US consumers/producers as those on Canada and Mexico, and that allows Trump to take his time to discuss a deal. Indeed, Trump has indicated he is in no rush to speak to China's President Xi Jinping. We suspect the balance of risks for the likes of AUD and NZD – which are pricing in a deal – is skewed to the downside."
"In other news, markets are treating Trump’s announced intention to take over the Gaza Strip and evacuate Palestinians to neighbouring countries with scepticism. Should we see hints that the US is planning to deploy troops in the Middle East, the market implications can be risk-off, oil-positive and dollar-positive, as Arab nations should firmly oppose the move. For now, the protectionism story remains the key driver, even though US macro news is regaining some centrality."
"Today, we’ll get ADP employment figures for January, which are expected to come in a bit stronger than December at 150k. Those have not had good predictive power for actual payrolls, but can still move the market. The other important release of the day is the ISM services surveys; the consensus is for consolidation in the main index around 54, although greater scrutiny should be on the price paid subindex, which spiked to 64 in December, sparking inflation concerns."
-
10:41
NZD/USD: Likely to trade in a 0.5510/0.5705 range – UOB Group
New Zealand Dollar (NZD) is likely to trade in a 0.5605/0.5680 range. In the longer run, current price movements are likely part of a 0.5510/0.5705 range trading phase, UOB Group's FX analysts Quek Ser Leang and Peter Chia note.
Sight increase in upward momentum
24-HOUR VIEW: "Following Monday’s choppy price action, we indicated yesterday that 'the outlook is unclear after the sharp swings.' We expected NZD to 'trade in a range between 0.5570 and 0.5670.' NZD subsequently traded in a narrower range than expected (0.5583/0.5655). We continue to expect NZD to trade in a range today. However, there has been a slight increase in upward momentum, and this suggests a higher range of 0.5605/0.5680."
1-3 WEEKS VIEW: "There is not much to add to our update from yesterday (04 Feb, spot at 0.5625). As highlighted, “the current price movements appear to be part of a range trading phase, likely between 0.5510 and 0.5705.”
-
10:37
CAD: A bit more upside room, in the near term – ING
The Canadian Dollar (CAD) is reemerging from the tariff scare and is now up 1.5% since Friday’s close. There is a residual 1% risk premium embedded into USD/CAD in our estimation, which suggests some additional room on the downside for the pair if tariff risks are entirely priced out, ING's FX analyst Francesco Pesole notes.
Risks remain skewed to the 1.45 handle towards the summer
"That said, we are not sure markets will or should move to a completely optimistic stance on the US-Canada trade spat. Even if the worst-case scenario of 25% duties may be averted (although tariffs are only delayed for 30 days), there are no clear hints Canada could be spared in another round of trade-related, and not border-related – universal tariffs."
"So, if in the short term we can surely see a move to 1.42 in USD/CAD, the risks remain skewed to the 1.45 handle towards the summer."
-
10:36
Silver price today: Silver rises, according to FXStreet data
Silver prices (XAG/USD) rose on Wednesday, according to FXStreet data. Silver trades at $32.46 per troy ounce, up 1.11% from the $32.10 it cost on Tuesday.
Silver prices have increased by 12.34% since the beginning of the year.
Unit measure Silver Price Today in USD Troy Ounce 32.46 1 Gram 1.04
The Gold/Silver ratio, which shows the number of ounces of Silver needed to equal the value of one ounce of Gold, stood at 88.42 on Wednesday, down from 88.60 on Tuesday.
Silver FAQs
Silver is a precious metal highly traded among investors. It has been historically used as a store of value and a medium of exchange. Although less popular than Gold, traders may turn to Silver to diversify their investment portfolio, for its intrinsic value or as a potential hedge during high-inflation periods. Investors can buy physical Silver, in coins or in bars, or trade it through vehicles such as Exchange Traded Funds, which track its price on international markets.
Silver prices can move due to a wide range of factors. Geopolitical instability or fears of a deep recession can make Silver price escalate due to its safe-haven status, although to a lesser extent than Gold's. As a yieldless asset, Silver tends to rise with lower interest rates. Its moves also depend on how the US Dollar (USD) behaves as the asset is priced in dollars (XAG/USD). A strong Dollar tends to keep the price of Silver at bay, whereas a weaker Dollar is likely to propel prices up. Other factors such as investment demand, mining supply – Silver is much more abundant than Gold – and recycling rates can also affect prices.
Silver is widely used in industry, particularly in sectors such as electronics or solar energy, as it has one of the highest electric conductivity of all metals – more than Copper and Gold. A surge in demand can increase prices, while a decline tends to lower them. Dynamics in the US, Chinese and Indian economies can also contribute to price swings: for the US and particularly China, their big industrial sectors use Silver in various processes; in India, consumers’ demand for the precious metal for jewellery also plays a key role in setting prices.
Silver prices tend to follow Gold's moves. When Gold prices rise, Silver typically follows suit, as their status as safe-haven assets is similar. The Gold/Silver ratio, which shows the number of ounces of Silver needed to equal the value of one ounce of Gold, may help to determine the relative valuation between both metals. Some investors may consider a high ratio as an indicator that Silver is undervalued, or Gold is overvalued. On the contrary, a low ratio might suggest that Gold is undervalued relative to Silver.
(An automation tool was used in creating this post.)
-
10:35
AUD/USD: Unlikely to reach the major resistance at 0.6310 – UOB Group
Australian Dollar (AUD) could break above 0.6265; any further advance is unlikely to reach the major resistance at 0.6310. In the longer run, downward momentum has largely faded; AUD is expected to trade in a range between 0.6080 and 0.6310, UOB Group's FX analysts Quek Ser Leang and Peter Chia note.
Downward momentum has largely faded
24-HOUR VIEW: "Yesterday, when AUD was at 0.6215, we were of view that it 'could rise, but any advance is likely part of a higher 0.6155/0.6265 range.' We were also of the view that AUD 'is not expected to break clearly above 0.6265.' AUD then dipped briefly to 0.6171, rose to a high of 0.6262 before closing at 0.6257 (+0.47%). There has been an increase in momentum, and today, a break above 0.6265 will not be surprising. However, overbought conditions suggest any further advance is unlikely to reach the major resistance at 0.6310 (there is another resistance level at 0.6285). To maintain the momentum, AUD must remain above 0.6200 (minor support is at 0.6225)." 1-3 WEEKS VIEW: "Our update from yesterday (04 Feb, spot at 0.6215) still stands. As highlighted, the buildup in downward momentum from Monday “has largely faded.” For now, AUD is expected to trade in a range, probably between 0.6080 and 0.6310."
-
10:30
United Kingdom S&P Global/CIPS Services PMI below expectations (51.2) in January: Actual (50.9)
-
10:30
United Kingdom S&P Global/CIPS Composite PMI registered at 50.6, below expectations (50.9) in January
-
10:13
USD/CHF holds losses below 0.9050 as US Dollar undergoes a downward correction
- USD/CHF loses ground as the US Dollar weakens for the third consecutive session on Wednesday.
- Safe-haven demand for the Swiss Franc rises due to escalating US-China trade tensions.
- Traders await Thursday’s Swiss Unemployment Rate to gain further insight into the labor market.
USD/CHF continues its decline for the second straight day, trading near 0.9030 during European hours on Wednesday. This downturn is primarily driven by a weaker US Dollar (USD), which is undergoing a technical correction.
The US Dollar Index (DXY), which tracks the USD against six major currencies, remains under pressure for the third consecutive session, hovering around 107.70 at the time of writing. Meanwhile, market participants await Friday’s US Nonfarm Payrolls (NFP) data, which could influence the Federal Reserve’s (Fed) monetary policy stance.
Adding to the USD’s weakness, US President Donald Trump has agreed to a 30-day suspension of the proposed 25% tariffs on Canadian and Mexican imports. This decision follows commitments from Canadian Prime Minister Justin Trudeau and Mexican President Claudia Sheinbaum to enhance border security in response to concerns over illegal immigration and drug trafficking.
Further weighing on the USD/CHF pair, safe-haven demand for the Swiss Franc (CHF) could have increased due to escalating US-China trade tensions. In retaliation for the new 10% US tariff imposed on Tuesday, China has implemented a 15% tariff on US coal and liquefied natural gas (LNG) imports, along with an additional 10% tariff on crude Oil, farm equipment, and certain automobiles.
On the Swiss economic front, the SVME Purchasing Managers' Index (PMI) inched up to 47.5 in January from 47.0 in December, though it fell short of market expectations of 49.0. The rise was tempered by declines in order backlogs and purchasing inventories, data showed on Monday. Investors now turn their attention to Switzerland’s Unemployment Rate, set to be released by the State Secretariat for Economic Affairs (SECO) on Thursday, which will provide further insight into the labor market.
Swiss Franc FAQs
The Swiss Franc (CHF) is Switzerland’s official currency. It is among the top ten most traded currencies globally, reaching volumes that well exceed the size of the Swiss economy. Its value is determined by the broad market sentiment, the country’s economic health or action taken by the Swiss National Bank (SNB), among other factors. Between 2011 and 2015, the Swiss Franc was pegged to the Euro (EUR). The peg was abruptly removed, resulting in a more than 20% increase in the Franc’s value, causing a turmoil in markets. Even though the peg isn’t in force anymore, CHF fortunes tend to be highly correlated with the Euro ones due to the high dependency of the Swiss economy on the neighboring Eurozone.
The Swiss Franc (CHF) is considered a safe-haven asset, or a currency that investors tend to buy in times of market stress. This is due to the perceived status of Switzerland in the world: a stable economy, a strong export sector, big central bank reserves or a longstanding political stance towards neutrality in global conflicts make the country’s currency a good choice for investors fleeing from risks. Turbulent times are likely to strengthen CHF value against other currencies that are seen as more risky to invest in.
The Swiss National Bank (SNB) meets four times a year – once every quarter, less than other major central banks – to decide on monetary policy. The bank aims for an annual inflation rate of less than 2%. When inflation is above target or forecasted to be above target in the foreseeable future, the bank will attempt to tame price growth by raising its policy rate. Higher interest rates are generally positive for the Swiss Franc (CHF) as they lead to higher yields, making the country a more attractive place for investors. On the contrary, lower interest rates tend to weaken CHF.
Macroeconomic data releases in Switzerland are key to assessing the state of the economy and can impact the Swiss Franc’s (CHF) valuation. The Swiss economy is broadly stable, but any sudden change in economic growth, inflation, current account or the central bank’s currency reserves have the potential to trigger moves in CHF. Generally, high economic growth, low unemployment and high confidence are good for CHF. Conversely, if economic data points to weakening momentum, CHF is likely to depreciate.
As a small and open economy, Switzerland is heavily dependent on the health of the neighboring Eurozone economies. The broader European Union is Switzerland’s main economic partner and a key political ally, so macroeconomic and monetary policy stability in the Eurozone is essential for Switzerland and, thus, for the Swiss Franc (CHF). With such dependency, some models suggest that the correlation between the fortunes of the Euro (EUR) and the CHF is more than 90%, or close to perfect.
-
10:01
Italy Retail Sales n.s.a (YoY) fell from previous 1.1% to 0.6% in December
-
10:01
Italy Retail Sales s.a. (MoM) came in at 0.6%, above forecasts (0.1%) in December
-
10:00
Eurozone HCOB Composite PMI meets forecasts (50.2) in January
-
10:00
Eurozone HCOB Services PMI below expectations (51.4) in January: Actual (51.3)
-
09:55
Germany HCOB Services PMI in line with forecasts (52.5) in January
-
09:55
Germany HCOB Composite PMI registered at 50.5 above expectations (50.1) in January
-
09:51
Gas: Market remains nervous over EU storage levels – ING
TTF prices settled 3.25% lower yesterday following China’s retaliatory tariffs on US LNG, ING's commodity expert Warren Patterson notes.
Appetite for speculators to increase longs is likely limited
"The market remains relatively nervous over storage levels and the bigger job Europe will face to refill storage over the injection season. However, one would expect the market to face some resistance around current levels (in the absence of any supply shocks)."
"Gas is deep in the coal switching range, even when considering the recent strength in EUA prices. Furthermore, the investment fund long in TTF seems fairly stretched and so the appetite for speculators to increase this significantly more (in the absence of a bullish catalyst) is likely limited."
-
09:50
France HCOB Composite PMI came in at 47.6 below forecasts (48.3) in January
-
09:50
France HCOB Services PMI below forecasts (48.9) in January: Actual (48.2)
-
09:48
GBP/USD: A sustained break above 1.2530 is unlikely – UOB Group
The Pound Sterling (GBP) could rise further; overbought conditions suggest a sustained break above 1.2530 is unlikely. In the longer run, for the time being, GBP is expected to trade in a range of 1.2245/1.2530, UOB Group's FX analysts Quek Ser Leang and Peter Chia note.
GBP is expected to trade in a range of 1.2245/1.2530
24-HOUR VIEW: "While we indicated yesterday that “the rapid rise in GBP has scope to extend,” we highlighted that “any advance is unlikely to break clearly above 1.2475.” We added, “the major resistance at 1.2530 is not expected to come under threat.” Our view of GBP advancing was not wrong, even though it rose more than expected to 1.2492. Today, GBP could rise further, but given the overbought conditions, a sustained break above 1.2530 appears unlikely. Support levels are at 1.2450 and 1.2420."
1-3 WEEKS VIEW: "We highlighted yesterday (04 Feb, spot at 1.2430) that “for the time being, we expect GBP to trade in a range of 1.2245/1.2530.” GBP subsequently rose to 1.2492, and while momentum is beginning to build, it is not sufficient to suggest a sustained advance. In other words, our view remains unchanged for now."
-
09:45
Italy HCOB Services PMI came in at 50.4, below expectations (50.5) in January
-
09:40
EUR: Still reluctant to chase euro much higher – ING
We stick to our call that EUR/USD will start to lose support once crossing 1.040, as the euro remains broadly unattractive from a macro fundamental perspective and Trump has indicated that the EU should be next on the tariff list. A EUR:USD two-year swap rate gap at -185bp is a mirror of that – via the monetary policy channel – and a key disincentive to chase EUR/USD much higher, ING's FX analyst Francesco Pesole notes.
EUR/USD to start losing support once crossing 1.040
"Domestically, the eurozone calendar is quite quiet for the remainder of the week. Trade news will dominate in EUR/USD price action, although we’ll be interested to hear whether the slightly hotter-than-expected inflation figures trigger some minor change in the narrative by ECB members. Chief Economist Philip Lane speaks this afternoon."
"EUR/JPY downside remains interesting. Japanese nominal cash wages accelerated to 4.8% YoY in December, well above the 3.7% consensus. Real earnings were up 0.6% YoY. That reinforces our call for two rate hikes by the Bank of Japan this year and improves the outlook for the yen."
-
09:40
Pound Sterling faces pressure as BoE’s policy decision looms large
- The Pound Sterling declines against its major peers as traders price in a 25 bps interest rate cut by the BoE on Thursday.
- Investors should brace for high volatility amid uncertainty over US-China trade relations.
- The US Dollar will be guided by the US ADP Employment Change and the ISM Services PMI data for January on Wednesday.
The Pound Sterling (GBP) underperforms its major peers, except the US Dollar (USD), on Wednesday as investors turn cautious ahead of the Bank of England’s (BoE) monetary policy decision, which will be announced on Thursday.
The BoE is almost certain to reduce its key borrowing rates by 25 basis points (bps) to 4.50%, with an 8-1 vote split. This would be the third interest rate cut by the BoE in its current policy-easing cycle. Monetary Policy Committee (MPC) member Catherine Mann, who has been an outspoken hawk, is expected to support keeping interest rates steady at 4.75%.
Traders are confident about the BoE cutting interest rates on Thursday as inflationary pressures in the United Kingdom (UK) decelerated at a faster-than-expected pace in December. Inflation in the services sector – which is closely tracked by BoE officials – grew at a moderate pace of 4.4%, compared to 5% growth in November. Also, a sharp decline in the Retail Sales data for December boosted BoE dovish bets.
Market participants are also anticipating that the BoE will cut interest rates by 56 bps this year beyond the policy meeting on Thursday.
British Pound PRICE Today
The table below shows the percentage change of British Pound (GBP) against listed major currencies today. British Pound was the strongest against the US Dollar.
USD EUR GBP JPY CAD AUD NZD CHF USD -0.12% -0.08% -0.74% -0.16% -0.20% -0.39% -0.12% EUR 0.12% 0.04% -0.61% -0.05% -0.08% -0.28% -0.00% GBP 0.08% -0.04% -0.63% -0.08% -0.11% -0.31% -0.04% JPY 0.74% 0.61% 0.63% 0.57% 0.53% 0.32% 0.61% CAD 0.16% 0.05% 0.08% -0.57% -0.04% -0.24% 0.04% AUD 0.20% 0.08% 0.11% -0.53% 0.04% -0.20% 0.08% NZD 0.39% 0.28% 0.31% -0.32% 0.24% 0.20% 0.28% CHF 0.12% 0.00% 0.04% -0.61% -0.04% -0.08% -0.28% The heat map shows percentage changes of major currencies against each other. The base currency is picked from the left column, while the quote currency is picked from the top row. For example, if you pick the British Pound from the left column and move along the horizontal line to the US Dollar, the percentage change displayed in the box will represent GBP (base)/USD (quote).
Daily digest market movers: Pound Sterling rises against US Dollar ahead of US data
- The Pound Sterling gains to near 1.2500 against the US Dollar in Wednesday’s European session. The GBP/USD pair advances as the US Dollar gives up its initial weekly gains as it loses risk-premium after United States (US) President Donald Trump postponed tariffs on Canada and Mexico.
- Market participants have interpreted this scenario as President Trump’s negotiation tactic to close better deals with his major trading partners. Trump called for an immediate suspension of 25% tariff orders on his North American peers after they agreed to cooperate on criminal enforcement.
- Still, investors are hesitant to go all-in for risky assets as a trade war between two powerhouses, the US and China, is brewing. On Tuesday, China responded swiftly to Trump’s 10% tariffs by imposing levies on various US exports, including farm equipment, some autos, and energy items such as Coal and Liquefied Natural Gas (LNG).
- On the economic front, the US Dollar will be guided by the US ADP Employment Change for the private sector and the ISM Services Purchasing Managers Index (PMI) data for January, which will be published during North American trading hours.
- Economists estimate the private sector to have employed 150K new workers, higher than 122K in December. Meanwhile, the Services PMI, which gauges activities in the services sector that account for two-thirds of the US economy, is estimated to have advanced to 54.3 from the former release of 54.1.
- The economic data will influence market expectations for how long the Federal Reserve (Fed) will keep interest rates at their current levels this year.
Technical Analysis: Pound Sterling rises to near 50-day EMA

The Pound Sterling extends its winning streak for the third trading day against the US Dollar on Wednesday. The GBP/USD advances to near the 50-day Exponential Moving Average (EMA) around 1.2500.
The 14-day Relative Strength Index (RSI) oscillates inside the 40.00-60.00 range, suggesting a sideways trend.
Looking down, the January 13 low of 1.2100 and the October 2023 low of 1.2050 will act as key support zones for the pair. On the upside, the December 30 high of 1.2607 will act as key resistance.
Pound Sterling FAQs
The Pound Sterling (GBP) is the oldest currency in the world (886 AD) and the official currency of the United Kingdom. It is the fourth most traded unit for foreign exchange (FX) in the world, accounting for 12% of all transactions, averaging $630 billion a day, according to 2022 data. Its key trading pairs are GBP/USD, also known as ‘Cable’, which accounts for 11% of FX, GBP/JPY, or the ‘Dragon’ as it is known by traders (3%), and EUR/GBP (2%). The Pound Sterling is issued by the Bank of England (BoE).
The single most important factor influencing the value of the Pound Sterling is monetary policy decided by the Bank of England. The BoE bases its decisions on whether it has achieved its primary goal of “price stability” – a steady inflation rate of around 2%. Its primary tool for achieving this is the adjustment of interest rates. When inflation is too high, the BoE will try to rein it in by raising interest rates, making it more expensive for people and businesses to access credit. This is generally positive for GBP, as higher interest rates make the UK a more attractive place for global investors to park their money. When inflation falls too low it is a sign economic growth is slowing. In this scenario, the BoE will consider lowering interest rates to cheapen credit so businesses will borrow more to invest in growth-generating projects.
Data releases gauge the health of the economy and can impact the value of the Pound Sterling. Indicators such as GDP, Manufacturing and Services PMIs, and employment can all influence the direction of the GBP. A strong economy is good for Sterling. Not only does it attract more foreign investment but it may encourage the BoE to put up interest rates, which will directly strengthen GBP. Otherwise, if economic data is weak, the Pound Sterling is likely to fall.
Another significant data release for the Pound Sterling is the Trade Balance. This indicator measures the difference between what a country earns from its exports and what it spends on imports over a given period. If a country produces highly sought-after exports, its currency will benefit purely from the extra demand created from foreign buyers seeking to purchase these goods. Therefore, a positive net Trade Balance strengthens a currency and vice versa for a negative balance.
-
09:38
EUR/USD: Unlikely to break clearly above 1.0425 – UOB Group
Euro (EUR) could continue to rise, but any advance is unlikely to break clearly above 1.0425. In the longer run, outlook is unclear; EUR could trade in a broad range of 1.0250/1.0490 for the time being, UOB Group's FX analysts Quek Ser Leang and Peter Chia note.
EUR can trade in a broad range
24-HOUR VIEW: "EUR traded in a volatile manner two days ago, as it whipsawed and traded in a broad range. Yesterday, we pointed out that 'the volatile price action has resulted in a mixed outlook.' We also pointed out that EUR 'could continue to trade in a choppy manner, probably between 1.0255 and 1.0370.' EUR dipped to 1.0271 before rising to a high of 1.0387. Despite the advance, upward momentum has not increased significantly. However, EUR could continue to rise, but any advance is unlikely to break clearly above 1.0425. The major resistance at 1.0490 is unlikely to come into view. Support is at 1.0335; a breach of 1.0290 would indicate that the current upward pressure has eased."
1-3 WEEKS VIEW: "Two days ago (03 Feb, spot at 1.0245), we indicated that 'the risk is for further EUR weakness.' However, we highlighted that 'it remains to be seen if it can break and remain below 1.0100.' Yesterday, EUR rose sharply and broke above our ‘strong resistance’ of 1.0380, invalidating our view. The outlook is unclear for now, and EUR could trade in a broad range of 1.0250/1.0490 for the time being."
-
09:28
Silver Price Forecast: XAG/USD marks three-month highs near $32.50 amid risk-off mood
- Silver prices surged to a three-month high of $32.38 on Wednesday.
- Safe-haven metals gain ground amid risk-off mood following global trade and economic uncertainties.
- Traders await Friday’s US Nonfarm Payrolls, which is expected a slight slowdown in job creation for January.
Silver price (XAG/USD) rises for the third successive session, trading around $32.30 per troy ounce, during the European hours on Wednesday. The safe-haven metals like Silver gain ground due to increased risk aversion following global trade and economic uncertainties.
In response to the new 10% US tariff that took effect on Tuesday, China imposed a 15% tariff on US coal and liquefied natural gas (LNG) imports, along with an additional 10% tariff on crude oil, farm equipment, and certain automobiles.
However, traders remain hopeful for a potential resolution between the United States (US) and China, similar to the agreements reached with Mexico and Canada. US President Donald Trump stated on Monday that he expects to speak with China soon but warned, “If we can't reach a deal with China, the tariffs will be very, very substantial.” However, no further developments have been reported.
Trump, earlier this week, announced a temporary suspension of tariffs on Mexico and Canada after their leaders agreed to deploy 10,000 troops to the US border to combat drug trafficking. The tariffs initially imposed two days earlier—25% on Mexican and Canadian goods have been postponed for at least 30 days.
The dollar-denominated Silver attracts buyers as the US Dollar (USD) goes through a technical downward correction. The US Dollar Index (DXY), which measures the US Dollar’s value against six major currencies, remains under downward pressure for the third successive day, trading around 107.70 at the time of writing. Meanwhile, traders brace for Friday’s US Nonfarm Payrolls (NFP) data, which is expected to shape the Federal Reserve’s (Fed) monetary policy direction.
Silver, which does not yield interest, is benefiting from the dovish stance of major central banks. The Bank of Canada (BoC) has halted its quantitative tightening and joined Sweden’s Riksbank in cutting interest rates. Last week, the European Central Bank (ECB) lowered its Deposit Facility Rate by 25 basis points (bps) to 2.75%, while both the Reserve Bank of India (RBI) and the People’s Bank of China (PBoC) have signaled potential rate cuts ahead. Additionally, markets expect the US Federal Reserve (Fed) to implement two rate cuts this year.
Silver FAQs
Silver is a precious metal highly traded among investors. It has been historically used as a store of value and a medium of exchange. Although less popular than Gold, traders may turn to Silver to diversify their investment portfolio, for its intrinsic value or as a potential hedge during high-inflation periods. Investors can buy physical Silver, in coins or in bars, or trade it through vehicles such as Exchange Traded Funds, which track its price on international markets.
Silver prices can move due to a wide range of factors. Geopolitical instability or fears of a deep recession can make Silver price escalate due to its safe-haven status, although to a lesser extent than Gold's. As a yieldless asset, Silver tends to rise with lower interest rates. Its moves also depend on how the US Dollar (USD) behaves as the asset is priced in dollars (XAG/USD). A strong Dollar tends to keep the price of Silver at bay, whereas a weaker Dollar is likely to propel prices up. Other factors such as investment demand, mining supply – Silver is much more abundant than Gold – and recycling rates can also affect prices.
Silver is widely used in industry, particularly in sectors such as electronics or solar energy, as it has one of the highest electric conductivity of all metals – more than Copper and Gold. A surge in demand can increase prices, while a decline tends to lower them. Dynamics in the US, Chinese and Indian economies can also contribute to price swings: for the US and particularly China, their big industrial sectors use Silver in various processes; in India, consumers’ demand for the precious metal for jewellery also plays a key role in setting prices.
Silver prices tend to follow Gold's moves. When Gold prices rise, Silver typically follows suit, as their status as safe-haven assets is similar. The Gold/Silver ratio, which shows the number of ounces of Silver needed to equal the value of one ounce of Gold, may help to determine the relative valuation between both metals. Some investors may consider a high ratio as an indicator that Silver is undervalued, or Gold is overvalued. On the contrary, a low ratio might suggest that Gold is undervalued relative to Silver.
-
09:15
Spain HCOB Services PMI came in at 54.9, below expectations (57.1) in January
-
09:14
ECB’s de Guindos: I see inflation approaching the ECB's target
European Central Bank (ECB) Vice President Luis de Guindos said on Wednesday that “I see inflation approaching the ECB's target.”
Further comments
I'm not sure where ECB interest rates will end up.
Neutral rate is not very useful in policy setting.
May see inflation tick up in the next months on energy.
The vicious circle of trade tariffs should be avoided.
Market reaction
EUR/USD keeps its range near 1.0400 following these comments, up 0.22% on the day.
ECB FAQs
The European Central Bank (ECB) in Frankfurt, Germany, is the reserve bank for the Eurozone. The ECB sets interest rates and manages monetary policy for the region. The ECB primary mandate is to maintain price stability, which means keeping inflation at around 2%. Its primary tool for achieving this is by raising or lowering interest rates. Relatively high interest rates will usually result in a stronger Euro and vice versa. The ECB Governing Council makes monetary policy decisions at meetings held eight times a year. Decisions are made by heads of the Eurozone national banks and six permanent members, including the President of the ECB, Christine Lagarde.
In extreme situations, the European Central Bank can enact a policy tool called Quantitative Easing. QE is the process by which the ECB prints Euros and uses them to buy assets – usually government or corporate bonds – from banks and other financial institutions. QE usually results in a weaker Euro. QE is a last resort when simply lowering interest rates is unlikely to achieve the objective of price stability. The ECB used it during the Great Financial Crisis in 2009-11, in 2015 when inflation remained stubbornly low, as well as during the covid pandemic.
Quantitative tightening (QT) is the reverse of QE. It is undertaken after QE when an economic recovery is underway and inflation starts rising. Whilst in QE the European Central Bank (ECB) purchases government and corporate bonds from financial institutions to provide them with liquidity, in QT the ECB stops buying more bonds, and stops reinvesting the principal maturing on the bonds it already holds. It is usually positive (or bullish) for the Euro.
-
08:54
Forex Today: US Dollar retreats, Gold renews record-high as markets await US data
Here is what you need to know on Wednesday, February 5:
After weakening against its major rivals on improving risk mood and disappointing US data on Tuesday, the US Dollar (USD) struggles to hold its ground early Wednesday. Later in the session, the US economic calendar will feature ADP Employment Change and ISM Services Purchasing Managers Index (PMI) data for January. Investors will continue to scrutinize comments from central bank officials throughout the day as well.
US Dollar PRICE This week
The table below shows the percentage change of US Dollar (USD) against listed major currencies this week. US Dollar was the weakest against the Canadian Dollar.
USD EUR GBP JPY CAD AUD NZD CHF USD -0.34% -0.79% -1.07% -2.66% -0.91% -1.35% -1.27% EUR 0.34% -0.05% 0.59% -1.05% -0.12% 0.29% 0.36% GBP 0.79% 0.05% -0.46% -1.00% -0.06% 0.34% 0.41% JPY 1.07% -0.59% 0.46% -1.61% 0.30% 0.65% 0.43% CAD 2.66% 1.05% 1.00% 1.61% 0.69% 1.35% 1.43% AUD 0.91% 0.12% 0.06% -0.30% -0.69% 0.40% 0.47% NZD 1.35% -0.29% -0.34% -0.65% -1.35% -0.40% 0.08% CHF 1.27% -0.36% -0.41% -0.43% -1.43% -0.47% -0.08% The heat map shows percentage changes of major currencies against each other. The base currency is picked from the left column, while the quote currency is picked from the top row. For example, if you pick the US Dollar from the left column and move along the horizontal line to the Japanese Yen, the percentage change displayed in the box will represent USD (base)/JPY (quote).
The USD Index lost about 0.4% on Tuesday after the US Bureau of Labor Statistics reported that JOLTS Job Openings declined to 7.6 million in December, falling short of the market expectation of 8 million. Additionally, Wall Street's main indexes gained traction after the opening bell, pointing to a positive shift in market mood that didn't allow the USD to stage a rebound. Early Wednesday, however, US stock index futures trade in negative territory.
During the Asian trading hours on Wednesday, the US Customs and Border Protection issued a notice on, noting that additional US tariffs of 10% will apply to Hong Kong as well as mainland China. Meanwhile, the data from China showed that the Caixin Services PMI declined to 51 in January from 52.2 in December.
EUR/USD benefited from the broad USD weakness and registered daily gains on Tuesday. The pair clings to small daily gains but stays below 1.0400 in the European morning on Wednesday. Eurostat will publish Producer Price Index data for December later in the session.
Japan's Economy Minister Ryosei Akazawa noted on Wednesday that the government’s focus is to eradicate Japan's deflationary mindset. “With an ambitious goal to boost minimum wages, the government is trying to eradicate deflationary mindset,” he added. USD/JPY stays under heavy bearish pressure to begin the European session and trades at its lowest level since mid-December near 153.00.
GBP/USD closed in positive territory for the second consecutive day on Tuesday. The pair stays relatively quiet and fluctuates in a tight channel below 1.2500 in the European morning on Wednesday.
The Unemployment Rate in New Zealand rose to 5.1% in the fourth-quarter from 4.8% in the third quarter, Statistics New Zealand reported on Wednesday. This reading came in line with the market expectation and failed to trigger a noticeable market reaction. At the time of press, NZD/USD was trading marginally higher on the day, above 0.5650.
Gold preserves its bullish momentum and trades at a new all-time high above $2,860. Escalating geopolitical tensions after US President Donald Trump proposed resettling Palestinians in neighboring countries seem to be fuelling XAU/USD's rally.
Gold FAQs
Gold has played a key role in human’s history as it has been widely used as a store of value and medium of exchange. Currently, apart from its shine and usage for jewelry, the precious metal is widely seen as a safe-haven asset, meaning that it is considered a good investment during turbulent times. Gold is also widely seen as a hedge against inflation and against depreciating currencies as it doesn’t rely on any specific issuer or government.
Central banks are the biggest Gold holders. In their aim to support their currencies in turbulent times, central banks tend to diversify their reserves and buy Gold to improve the perceived strength of the economy and the currency. High Gold reserves can be a source of trust for a country’s solvency. Central banks added 1,136 tonnes of Gold worth around $70 billion to their reserves in 2022, according to data from the World Gold Council. This is the highest yearly purchase since records began. Central banks from emerging economies such as China, India and Turkey are quickly increasing their Gold reserves.
Gold has an inverse correlation with the US Dollar and US Treasuries, which are both major reserve and safe-haven assets. When the Dollar depreciates, Gold tends to rise, enabling investors and central banks to diversify their assets in turbulent times. Gold is also inversely correlated with risk assets. A rally in the stock market tends to weaken Gold price, while sell-offs in riskier markets tend to favor the precious metal.
The price can move due to a wide range of factors. Geopolitical instability or fears of a deep recession can quickly make Gold price escalate due to its safe-haven status. As a yield-less asset, Gold tends to rise with lower interest rates, while higher cost of money usually weighs down on the yellow metal. Still, most moves depend on how the US Dollar (USD) behaves as the asset is priced in dollars (XAU/USD). A strong Dollar tends to keep the price of Gold controlled, whereas a weaker Dollar is likely to push Gold prices up.
-
08:45
France Industrial Output (MoM) came in at -0.4% below forecasts (-0.1%) in December
-
07:19
EU prepares to hit Big Tech in retaliation for Trump’s tariffs – FT
Citing two officials with knowledge of the plans, the Financial Times (FT) reported on Wednesday that the European Commission is preparing to deploy its “anti-coercion instrument” (ACI) in a potential retaliation to US President Donald Trump’s tariffs, which would enable the European Union (EU) to target US service sectors like Big Tech.
-
07:00
Russia S&P Global Services PMI climbed from previous 51.2 to 54.6 in January
-
06:47
USD/INR maintains position above 87.00 after HSBC PMI data release
- USD/INR holds ground amid rising trade tensions between the US and China.
- India HSBC Composite Purchasing Managers’ Index fell to a 14-month low of 57.7, from the previous 59.2 reading.
- Traders await Friday’s US Nonfarm Payrolls, which is expected a slight slowdown in job creation for January.
USD/INR continues its upward momentum for the fourth consecutive day, trading around 87.10 during Wednesday’s Asian session. The risk-sensitive Indian Rupee (INR) remains under pressure due to increased risk aversion following rising trade tensions between the US and China.
On the economic front, the seasonally adjusted India HSBC Composite Purchasing Managers’ Index (PMI) dropped from 59.2 in December to a 14-month low of 57.7. Despite the decline, the reading remains above the long-term average, signaling continued economic expansion. Meanwhile, the Services PMI registered at 56.5 in January, reflecting strong growth, though it slipped from 59.3 in December to its lowest level since November 2022.
In response to the new 10% US tariff that took effect on Tuesday, China imposed a 15% tariff on US coal and liquefied natural gas (LNG) imports, along with an additional 10% tariff on crude oil, farm equipment, and certain automobiles.
Despite the escalating trade dispute between the United States and China, traders remain hopeful for a potential resolution, similar to the agreements reached with Mexico and Canada. US President Donald Trump stated on Monday that he expects to speak with China soon but warned, “If we can't reach a deal with China, the tariffs will be very, very substantial.” However, no further developments have been reported.
Meanwhile, investors anticipate a 25-basis-point rate cut in the Reserve Bank of India's (RBI) upcoming monetary policy meeting on Friday, amid slowing economic growth. Market optimism has been further buoyed by expectations following the FY2026 Budget.
Looking ahead, traders await Friday’s US Nonfarm Payrolls (NFP) report, which is expected to influence the Federal Reserve’s (Fed) monetary policy direction. Consensus estimates suggest a slight slowdown in job creation for January 2025.
Economic Indicator
HSBC Composite PMI
The Composite Purchasing Managers Index (PMI), released on a monthly basis by S&P Global and HSBC Bank, is a leading indicator gauging business activity in India This d by weighting together comparable manufacturing and services indices using official manufacturing and services annual value added. The index varies between 0 and 100, with levels of 50.0 signaling no change over the previous month. A reading above 50 indicates that the Indian private economy is generally expanding, a bullish sign for the Indian Rupee (INR). Meanwhile, a reading below 50 signals that the activity is generally declining, which is seen as bearish for INR.
Read more.Last release: Wed Feb 05, 2025 05:00
Frequency: Monthly
Actual: 57.7
Consensus: 57.9
Previous: 57.9
Source: S&P Global
-
06:23
EUR/USD lacks firm intraday direction, stuck in a range around 1.0375-1.0380 zone
- EUR/USD consolidates in a range near the weekly high touched earlier this Wednesday.
- The USD struggles to lure buyers amid Fed rate cut bets and lends support to the major.
- Concerns about Trump’s trade tariffs and dovish ECB weigh on the Euro and cap the pair.
The EUR/USD pair struggles to capitalize on this week's solid recovery from the 1.0200 neighborhood, or the lowest level since January 13, and oscillates in a range near the weekly top touched earlier this Wednesday. Spot prices currently trade around the 1.0375-1.0380 region, nearly unchanged for the day amid mixed fundamental cues.
The Job Openings and Labor Turnover Survey (JOLTS) published on Tuesday pointed to a slowdown in the US labor market and supports prospects for further policy easing by the Federal Reserve (Fed). In fact, the markets are pricing in the possibility that the US central bank will lower borrowing costs twice this year. Apart from this, the risk-on mood keeps the safe-haven US Dollar (USD) depressed near the weekly low, which, in turn, is seen acting as a tailwind for the EUR/USD pair.
Traders, however, seem reluctant to place aggressive bullish bets in the wake of concerns that US President Donald Trump would slap tariffs on goods from the European Union. Adding to this, the European Central Bank's (ECB) dovish stance, which overshadowed a rise in the Eurozone Harmonized Index of Consumer Prices (HICP) at an annual rate of 2.5% in January, is seen undermining the Euro and contributing to keeping a lid on any meaningful upside for the EUR/USD pair.
Traders now look forward to the release of the final Eurozone Services PMI. Meanwhile, the US economic docket features the release of the ADP report on private-sector employment and ISM Services PMI. Apart from this, speeches by influential FOMC members will drive the USD demand and provide a fresh impetus to the EUR/USD pair. The focus, however, remains glued to the US monthly employment details – popularly known as the Nonfarm Payrolls (NFP) report on Friday.
Euro FAQs
The Euro is the currency for the 19 European Union countries that belong to the Eurozone. It is the second most heavily traded currency in the world behind the US Dollar. In 2022, it accounted for 31% of all foreign exchange transactions, with an average daily turnover of over $2.2 trillion a day. EUR/USD is the most heavily traded currency pair in the world, accounting for an estimated 30% off all transactions, followed by EUR/JPY (4%), EUR/GBP (3%) and EUR/AUD (2%).
The European Central Bank (ECB) in Frankfurt, Germany, is the reserve bank for the Eurozone. The ECB sets interest rates and manages monetary policy. The ECB’s primary mandate is to maintain price stability, which means either controlling inflation or stimulating growth. Its primary tool is the raising or lowering of interest rates. Relatively high interest rates – or the expectation of higher rates – will usually benefit the Euro and vice versa. The ECB Governing Council makes monetary policy decisions at meetings held eight times a year. Decisions are made by heads of the Eurozone national banks and six permanent members, including the President of the ECB, Christine Lagarde.
Eurozone inflation data, measured by the Harmonized Index of Consumer Prices (HICP), is an important econometric for the Euro. If inflation rises more than expected, especially if above the ECB’s 2% target, it obliges the ECB to raise interest rates to bring it back under control. Relatively high interest rates compared to its counterparts will usually benefit the Euro, as it makes the region more attractive as a place for global investors to park their money.
Data releases gauge the health of the economy and can impact on the Euro. Indicators such as GDP, Manufacturing and Services PMIs, employment, and consumer sentiment surveys can all influence the direction of the single currency. A strong economy is good for the Euro. Not only does it attract more foreign investment but it may encourage the ECB to put up interest rates, which will directly strengthen the Euro. Otherwise, if economic data is weak, the Euro is likely to fall. Economic data for the four largest economies in the euro area (Germany, France, Italy and Spain) are especially significant, as they account for 75% of the Eurozone’s economy.
Another significant data release for the Euro is the Trade Balance. This indicator measures the difference between what a country earns from its exports and what it spends on imports over a given period. If a country produces highly sought after exports then its currency will gain in value purely from the extra demand created from foreign buyers seeking to purchase these goods. Therefore, a positive net Trade Balance strengthens a currency and vice versa for a negative balance.
Tariffs FAQs
Tariffs are customs duties levied on certain merchandise imports or a category of products. Tariffs are designed to help local producers and manufacturers be more competitive in the market by providing a price advantage over similar goods that can be imported. Tariffs are widely used as tools of protectionism, along with trade barriers and import quotas.
Although tariffs and taxes both generate government revenue to fund public goods and services, they have several distinctions. Tariffs are prepaid at the port of entry, while taxes are paid at the time of purchase. Taxes are imposed on individual taxpayers and businesses, while tariffs are paid by importers.
There are two schools of thought among economists regarding the usage of tariffs. While some argue that tariffs are necessary to protect domestic industries and address trade imbalances, others see them as a harmful tool that could potentially drive prices higher over the long term and lead to a damaging trade war by encouraging tit-for-tat tariffs.
During the run-up to the presidential election in November 2024, Donald Trump made it clear that he intends to use tariffs to support the US economy and American producers. In 2024, Mexico, China and Canada accounted for 42% of total US imports. In this period, Mexico stood out as the top exporter with $466.6 billion, according to the US Census Bureau. Hence, Trump wants to focus on these three nations when imposing tariffs. He also plans to use the revenue generated through tariffs to lower personal income taxes.
-
06:00
Singapore Retail Sales (MoM) rose from previous -2.8% to -1.5% in December
-
06:00
Singapore Retail Sales (YoY) fell from previous -0.7% to -2.9% in December
-
06:00
India HSBC Composite PMI came in at 57.7, below expectations (57.9) in January
-
06:00
India HSBC Services PMI below forecasts (56.8) in January: Actual (56.5)
-
05:46
EUR/JPY falls to near 159.00 amid rising wages in Japan
- EUR/JPY depreciates as rising wages bolster the odds of the BoJ rate hikes again.
- Japan’s Labor Cash Earnings jumped 4.8% YoY in December, rising from 3.9% in November.
- The Euro remains under pressure as investors brace for a potential Trump's tariff targeting the Eurozone.
EUR/JPY retreats after gains in the previous session, trading near 159.00 during Asian hours on Wednesday. The decline of the EUR/JPY cross is driven by a stronger Japanese Yen (JPY), supported by rising wages in Japan and growing expectations that the Bank of Japan (BoJ) will further hike interest rates.
Japan’s Labor Cash Earnings surged 4.8% year-on-year in December, up from 3.9% in November, exceeding the market forecast of 3.8%. This marks the highest wage growth in nearly three decades. Additionally, inflation-adjusted real wages, which indicate consumer purchasing power, increased by 0.6% in December, recording a second consecutive month of positive growth.
More on data, the Jibun Bank Composite Purchasing Managers’ Index (PMI) rose to 51.1 in January 2025 from 50.5 in December, signaling the third straight month of expansion in private sector activity. Meanwhile, the Services PMI was revised upward to 53.0 from a preliminary estimate of 52.7, following a final reading of 50.9 in the prior month.
EUR/JPY may face further downside as the Japanese Yen finds additional support from safe-haven flows amid escalating US-China trade tensions. On Wednesday, the US Customs and Border Protection announced that new tariffs of 10% would be applied to both Hong Kong and mainland China.
The Euro (EUR) remains under pressure as investors anticipate potential tariff threats from US President Donald Trump against the Eurozone. Over the weekend, Trump stated that he would “definitely” impose tariffs, accusing the bloc of unfair trade practices by not purchasing enough US cars and farm products. He claimed that the EU “takes almost nothing, and we take everything from them.”
In response, French President Emmanuel Macron warned that the European Union (EU) would retaliate if its interests were threatened. “If our commercial interests are attacked, Europe, as a true power, will have to make itself respected and therefore react,” Macron stated, as reported by The Guardian.
Economic Indicator
Labor Cash Earnings (YoY)
This indicator, released by the Ministry of Health, Labor and Welfare, shows the average income, before taxes, per regular employee. It includes overtime pay and bonuses but it doesn't take into account earnings from holding financial assets nor capital gains. Higher income puts upward pressures on consumption, and is inflationary for the Japanese economy. Generally, a higher-than-expected reading is bullish for the Japanese Yen (JPY), while a below-the-market consensus result is bearish.
Read more.Last release: Tue Feb 04, 2025 23:30
Frequency: Monthly
Actual: 4.8%
Consensus: 3.8%
Previous: 3%
-
05:35
India Gold price today: Gold rises, according to FXStreet data
Gold prices rose in India on Wednesday, according to data compiled by FXStreet.
The price for Gold stood at 7,997.48 Indian Rupees (INR) per gram, up compared with the INR 7,965.92 it cost on Tuesday.
The price for Gold increased to INR 93,281.70 per tola from INR 92,912.91 per tola a day earlier.
Unit measure Gold Price in INR 1 Gram 7,997.48 10 Grams 79,975.37 Tola 93,281.70 Troy Ounce 248,749.70 FXStreet calculates Gold prices in India by adapting international prices (USD/INR) to the local currency and measurement units. Prices are updated daily based on the market rates taken at the time of publication. Prices are just for reference and local rates could diverge slightly.
Gold FAQs
Gold has played a key role in human’s history as it has been widely used as a store of value and medium of exchange. Currently, apart from its shine and usage for jewelry, the precious metal is widely seen as a safe-haven asset, meaning that it is considered a good investment during turbulent times. Gold is also widely seen as a hedge against inflation and against depreciating currencies as it doesn’t rely on any specific issuer or government.
Central banks are the biggest Gold holders. In their aim to support their currencies in turbulent times, central banks tend to diversify their reserves and buy Gold to improve the perceived strength of the economy and the currency. High Gold reserves can be a source of trust for a country’s solvency. Central banks added 1,136 tonnes of Gold worth around $70 billion to their reserves in 2022, according to data from the World Gold Council. This is the highest yearly purchase since records began. Central banks from emerging economies such as China, India and Turkey are quickly increasing their Gold reserves.
Gold has an inverse correlation with the US Dollar and US Treasuries, which are both major reserve and safe-haven assets. When the Dollar depreciates, Gold tends to rise, enabling investors and central banks to diversify their assets in turbulent times. Gold is also inversely correlated with risk assets. A rally in the stock market tends to weaken Gold price, while sell-offs in riskier markets tend to favor the precious metal.
The price can move due to a wide range of factors. Geopolitical instability or fears of a deep recession can quickly make Gold price escalate due to its safe-haven status. As a yield-less asset, Gold tends to rise with lower interest rates, while higher cost of money usually weighs down on the yellow metal. Still, most moves depend on how the US Dollar (USD) behaves as the asset is priced in dollars (XAU/USD). A strong Dollar tends to keep the price of Gold controlled, whereas a weaker Dollar is likely to push Gold prices up.
(An automation tool was used in creating this post.)
-
05:35
GBP/USD holds steady below 1.2500; softer USD acts as a tailwind
- GBP/USD consolidates near the top end of its weekly trading range.
- Traders seem reluctant ahead of the key BoE meeting on Thursday.
- The USD hangs near the weekly low and lends support to the major.
The GBP/USD pair struggles to capitalize on its strong gains registered over the past two days and consolidates near a one-week top, below the 1.2500 psychological mark during the Asian session on Wednesday. The downside, however, remains cushioned amid some follow-through US Dollar (USD) selling.
In fact, the USD Index (DXY), which tracks the Greenback against a basket of currencies, hangs near the weekly low amid the prospects for further policy easing by the Federal Reserve (Fed). The bets were reaffirmed by the Job Openings and Labor Turnover Survey (JOLTS) released on Tuesday, which pointed to a slowdown in the US labor market and should allow the Fed to lower borrowing costs further despite stick inflation.
Meanwhile, the global risk sentiment remains supported by the optimism led by US President Donald Trump's decision to delay tariffs on Canadian and Mexican imports, which helped ease concerns about a trade war and its impact on the global economy. This is evident from a generally positive tone around the equity markets, which is seen as another factor undermining the safe-haven buck and acting as a tailwind for the GBP/USD pair.
Investors, however, remain concerned about the potential fallout from trade tensions between the US and China – the world's top two economies. This, along with the Fed's hawkish outlook, helps limit the downside for the USD and caps the upside for the GBP/USD pair. Traders also seem reluctant and might opt to move to the sidelines ahead of the key central bank event risk – the Bank of England (BoE) policy meeting on Thursday.
Pound Sterling FAQs
The Pound Sterling (GBP) is the oldest currency in the world (886 AD) and the official currency of the United Kingdom. It is the fourth most traded unit for foreign exchange (FX) in the world, accounting for 12% of all transactions, averaging $630 billion a day, according to 2022 data. Its key trading pairs are GBP/USD, also known as ‘Cable’, which accounts for 11% of FX, GBP/JPY, or the ‘Dragon’ as it is known by traders (3%), and EUR/GBP (2%). The Pound Sterling is issued by the Bank of England (BoE).
The single most important factor influencing the value of the Pound Sterling is monetary policy decided by the Bank of England. The BoE bases its decisions on whether it has achieved its primary goal of “price stability” – a steady inflation rate of around 2%. Its primary tool for achieving this is the adjustment of interest rates. When inflation is too high, the BoE will try to rein it in by raising interest rates, making it more expensive for people and businesses to access credit. This is generally positive for GBP, as higher interest rates make the UK a more attractive place for global investors to park their money. When inflation falls too low it is a sign economic growth is slowing. In this scenario, the BoE will consider lowering interest rates to cheapen credit so businesses will borrow more to invest in growth-generating projects.
Data releases gauge the health of the economy and can impact the value of the Pound Sterling. Indicators such as GDP, Manufacturing and Services PMIs, and employment can all influence the direction of the GBP. A strong economy is good for Sterling. Not only does it attract more foreign investment but it may encourage the BoE to put up interest rates, which will directly strengthen GBP. Otherwise, if economic data is weak, the Pound Sterling is likely to fall.
Another significant data release for the Pound Sterling is the Trade Balance. This indicator measures the difference between what a country earns from its exports and what it spends on imports over a given period. If a country produces highly sought-after exports, its currency will benefit purely from the extra demand created from foreign buyers seeking to purchase these goods. Therefore, a positive net Trade Balance strengthens a currency and vice versa for a negative balance.
-
05:29
FX option expiries for Feb 5 NY cut
FX option expiries for Feb 5 NY cut at 10:00 Eastern Time via DTCC can be found below.
EUR/USD: EUR amounts
- 1.0300 1.3b
- 1.0335 1b
- 1.0400 815m
- 1.0425 957m
- 1.0430 965m
- 1.0500 1.9b
USD/JPY: USD amounts
- 153.25 1.2b
- 154.00 1.3b
- 155.60 630m
USD/CHF: USD amounts
- 0.9050 675m
AUD/USD: AUD amounts
- 0.6260 449m
USD/CAD: USD amounts
- 1.4240 1.1b
- 1.4325 940m
- 1.4500 800m
- 1.4530 882m
- 1.4600 1.7b
-
05:24
Gold price continues scaling higher; fresh record high and counting
- Gold price continues to attract safe-haven flows amid renewed US-China trade war fears.
- Fed rate cut bets undermine the USD and further lend support to the XAU/USD pair.
- A slightly overbought RSI on the daily chart warrants some caution for bullish traders.
Gold price (XAU/USD) prolongs its upward trajectory through the Asian session on Wednesday and advances to a fresh all-time peak, around the $2,854 region in the last hour. Investors remain concerned about the economic fallout from US President Donald Trump's trade tariffs, which continues to underpin demand for the safe-haven bullion. Furthermore, the JOLTS data released on Tuesday pointed to slowing momentum in the US labor market and could force the Federal Reserve (Fed) to maintain its easing cycle despite sticky inflation. This turns out to be another factor that contributes to driving flows towards the non-yielding yellow metal.
Meanwhile, the prospects for further policy easing by the Fed keep the US Dollar (USD) depressed near the weekly low touched on Tuesday, which is seen lending additional support to the Gold prices. That said, Trump's decision to delay tariffs against Canada and Mexico remains supportive of the risk-on mood and could cap gains for the commodity amid overbought conditions on the daily chart. This makes it prudent to wait for a near-term consolidation or a modest pullback before placing fresh bullish bets around the XAU/USD. Traders now look to the US ADP report on private-sector employment and the US ISM Services PMI for some impetus.
Gold price uptrend remains uninterrupted as investors continue to seek refuge in safe-haven assets
- China retaliated to US President Donald Trump's new duties and imposed targeted tariffs on US imports, fueling trade war fears between the world's top two economies and lifting the safe-haven Gold price to a fresh record high on Wednesday.
- The Job Openings and Labor Turnover Survey (JOLTS) published by the US Bureau of Labor Statistics on Tuesday showed that the number of job openings on the last business day of December stood at 7.6 million, down from 8.09 million previous.
- The data pointed to a slowdown in the job market, which could allow the Federal Reserve to cut rates further. This keeps the US Dollar bulls on the defensive near the weekly low and turns out to be another factor that benefits the XAU/USD pair.
- Trump offered concessions to Canada and Mexico by delaying the 25% trade tariffs for 30 days, fueling hopes that a global trade war could be averted, though it does little to dent the bullish sentiment around the safe-haven precious metal.
- Wednesday's US economic docket features the release of the ADP report on private-sector employment and ISM Services PMI. The data should influence the USD and produce short-term trading opportunities around the commodity.
- The focus, however, will remain on the closely-watched US monthly employment detail – popularly known as the Nonfarm Payrolls (NFP) report on Friday. Apart from this, tariff headlines should infuse volatility in the markets.
Gold price needs to consolidate recent strong gains before extending a well-established uptrend
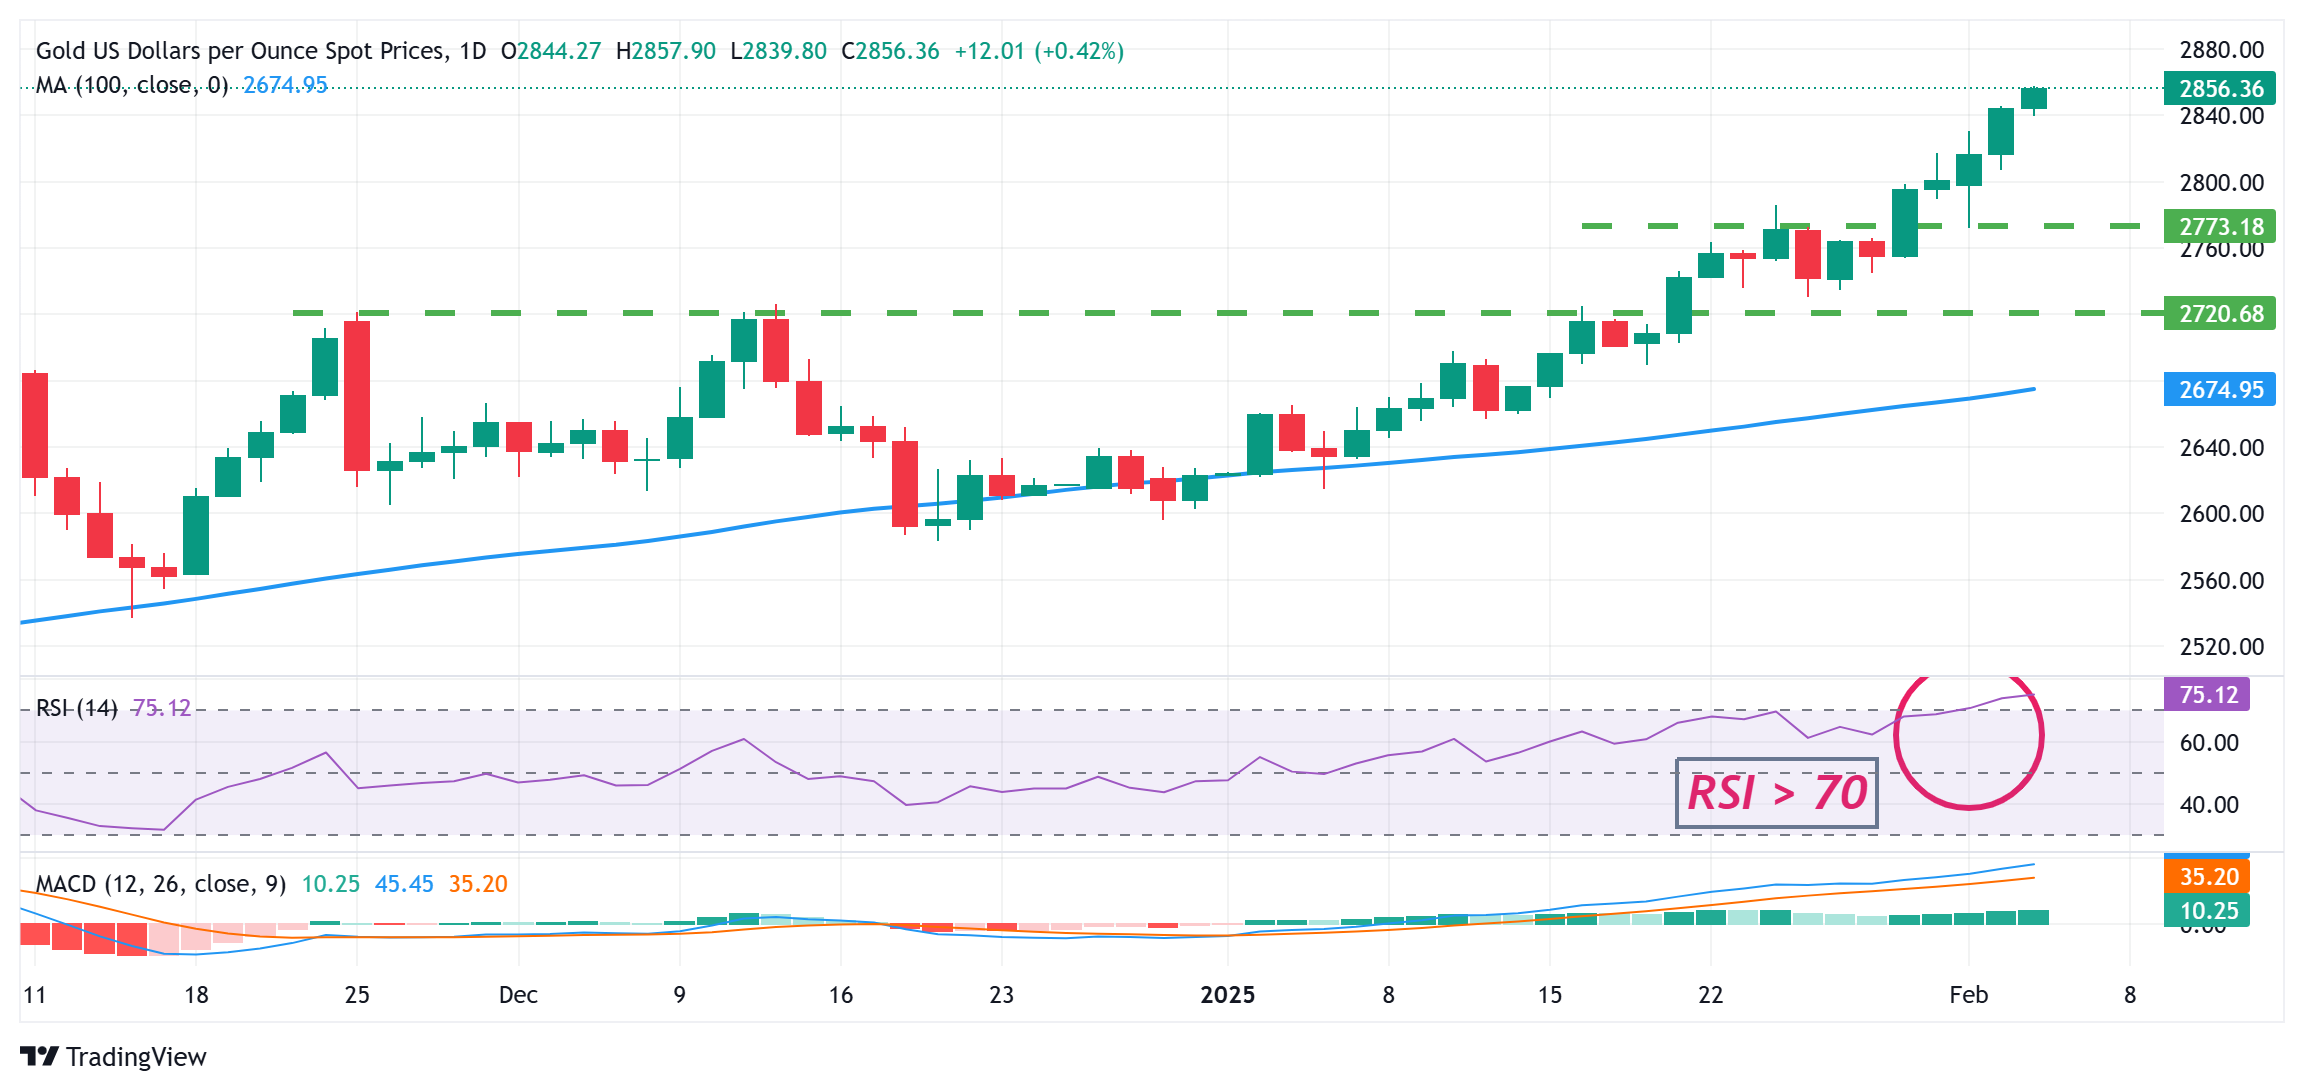
From a technical perspective, the Relative Strength Index (RSI) on hourly and daily charts is flashing slightly overbought conditions, warranting some caution for bullish traders. That said, the recent breakout momentum beyond the $2,800 mark suggests that the path of least resistance for the Gold price remains to the upside. This, in turn, supports prospects for an extension of the recent well-established uptrend from the December 2024 swing low.
In the meantime, any corrective slide now seems to find some support near the $2,830 area ahead of the $2,800 mark. A further decline could be seen as a buying opportunity and is more likely to remain limited near the $2,773-2,772 horizontal resistance breakpoint, now turned support. A convincing break below the latter, however, might prompt some technical selling and pave the way for deeper losses.
Gold FAQs
Gold has played a key role in human’s history as it has been widely used as a store of value and medium of exchange. Currently, apart from its shine and usage for jewelry, the precious metal is widely seen as a safe-haven asset, meaning that it is considered a good investment during turbulent times. Gold is also widely seen as a hedge against inflation and against depreciating currencies as it doesn’t rely on any specific issuer or government.
Central banks are the biggest Gold holders. In their aim to support their currencies in turbulent times, central banks tend to diversify their reserves and buy Gold to improve the perceived strength of the economy and the currency. High Gold reserves can be a source of trust for a country’s solvency. Central banks added 1,136 tonnes of Gold worth around $70 billion to their reserves in 2022, according to data from the World Gold Council. This is the highest yearly purchase since records began. Central banks from emerging economies such as China, India and Turkey are quickly increasing their Gold reserves.
Gold has an inverse correlation with the US Dollar and US Treasuries, which are both major reserve and safe-haven assets. When the Dollar depreciates, Gold tends to rise, enabling investors and central banks to diversify their assets in turbulent times. Gold is also inversely correlated with risk assets. A rally in the stock market tends to weaken Gold price, while sell-offs in riskier markets tend to favor the precious metal.
The price can move due to a wide range of factors. Geopolitical instability or fears of a deep recession can quickly make Gold price escalate due to its safe-haven status. As a yield-less asset, Gold tends to rise with lower interest rates, while higher cost of money usually weighs down on the yellow metal. Still, most moves depend on how the US Dollar (USD) behaves as the asset is priced in dollars (XAU/USD). A strong Dollar tends to keep the price of Gold controlled, whereas a weaker Dollar is likely to push Gold prices up.
Tariffs FAQs
Tariffs are customs duties levied on certain merchandise imports or a category of products. Tariffs are designed to help local producers and manufacturers be more competitive in the market by providing a price advantage over similar goods that can be imported. Tariffs are widely used as tools of protectionism, along with trade barriers and import quotas.
Although tariffs and taxes both generate government revenue to fund public goods and services, they have several distinctions. Tariffs are prepaid at the port of entry, while taxes are paid at the time of purchase. Taxes are imposed on individual taxpayers and businesses, while tariffs are paid by importers.
There are two schools of thought among economists regarding the usage of tariffs. While some argue that tariffs are necessary to protect domestic industries and address trade imbalances, others see them as a harmful tool that could potentially drive prices higher over the long term and lead to a damaging trade war by encouraging tit-for-tat tariffs.
During the run-up to the presidential election in November 2024, Donald Trump made it clear that he intends to use tariffs to support the US economy and American producers. In 2024, Mexico, China and Canada accounted for 42% of total US imports. In this period, Mexico stood out as the top exporter with $466.6 billion, according to the US Census Bureau. Hence, Trump wants to focus on these three nations when imposing tariffs. He also plans to use the revenue generated through tariffs to lower personal income taxes.
-
05:10
Japan’s Akazawa: Government’s focus is to eradicate Japan's deflationary mindset
Japan's Economy Minister Ryosei Akazawa noted on Wednesday that the ”government’s focus is to eradicate Japan's deflationary mindset.”
“With an ambitious goal to boost minimum wages, the government is trying to eradicate deflationary mindset,” he added.
Market reaction
USD/JPY was last seen trading 0.70% lower on the day at around 153.25.
-
05:08
Indonesia Gross Domestic Product (YoY) registered at 5.02% above expectations (4.98%) in 4Q
-
05:08
Indonesia Gross Domestic Product (QoQ) below expectations (0.56%) in 4Q: Actual (0.53%)
-
04:50
US Customs and Border Protection says additional 10% tariffs will apply to Hong Kong and mainland China
The US Customs and Border Protection issued a notice on Wednesday, noting that additional US tariffs of 10% will apply to Hong Kong as well as mainland China.
No further details are provided on the same.
US-China Trade War FAQs
Generally speaking, a trade war is an economic conflict between two or more countries due to extreme protectionism on one end. It implies the creation of trade barriers, such as tariffs, which result in counter-barriers, escalating import costs, and hence the cost of living.
An economic conflict between the United States (US) and China began early in 2018, when President Donald Trump set trade barriers on China, claiming unfair commercial practices and intellectual property theft from the Asian giant. China took retaliatory action, imposing tariffs on multiple US goods, such as automobiles and soybeans. Tensions escalated until the two countries signed the US-China Phase One trade deal in January 2020. The agreement required structural reforms and other changes to China’s economic and trade regime and pretended to restore stability and trust between the two nations. However, the Coronavirus pandemic took the focus out of the conflict. Yet, it is worth mentioning that President Joe Biden, who took office after Trump, kept tariffs in place and even added some additional levies.
The return of Donald Trump to the White House as the 47th US President has sparked a fresh wave of tensions between the two countries. During the 2024 election campaign, Trump pledged to impose 60% tariffs on China once he returned to office, which he did on January 20, 2025. With Trump back, the US-China trade war is meant to resume where it was left, with tit-for-tat policies affecting the global economic landscape amid disruptions in global supply chains, resulting in a reduction in spending, particularly investment, and directly feeding into the Consumer Price Index inflation.
-
04:47
BoJ official: Central bank sees underlying inflation gradually heading toward 2%
An official at the Bank of Japan (BoJ) said on Wednesday that the “BoJ sees underlying inflation gradually heading toward 2%.”
Additional comments
Price rises post-pandemic have been driven mostly by cost-push factors, such as rising import costs from weak Yen.
Expect cost-push inflation pressure to gradually dissipate ahead.
Services prices rising moderately.
-
04:46
WTI trades near $72.00, moves little as market downplays US-China trade tensions
- WTI moves little as the market shrugs off concerns over US-China trade war while support from Iran-related supply concerns remains.
- Trump reinstated his "maximum pressure" campaign, aiming to cut Iran’s Oil exports to zero.
- US API Weekly Crude Oil Stock rose by 5.025 million barrels in the previous week, against a previous 2.86-million-barrel build.
West Texas Intermediate (WTI) crude oil price remains in negative territory for the third consecutive session, trading around $72.20 per barrel during Asian hours on Wednesday. Crude Oil prices may decline further amid growing concerns over the US-China trade war. China's Commerce Ministry announced a 15% tariff on US coal and liquefied natural gas (LNG) imports, along with an additional 10% tariff on crude oil, farm equipment, and certain automobiles.
Crude Oil prices fluctuated widely on Tuesday, with WTI dropping by as much as 3%—its lowest since December 31—after China retaliated against the new 10% US tariff. However, Oil prices rebounded as supply risks appear linked to US President Donald Trump's intensified economic pressure on Iran.
On Tuesday, Trump reinstated his "maximum pressure" campaign to curb Iran’s nuclear program by aiming to cut the country’s Oil exports to zero and limit its regional influence. The move could impact around 1.5 million barrels per day of Iranian Oil exports.
The American Petroleum Institute (API) reported a significant rise in US crude Oil inventories, with stocks increasing by 5.025 million barrels for the week ending January 31, following a 2.86 million barrel builds the previous week. This marked the third straight week of inventory growth, exceeding expectations of a 3.17 million barrel build.
On Monday, the Organization of the Petroleum Exporting Countries and its allies (OPEC+) reaffirmed plans to gradually increase oil production from April and removed the US Energy Information Administration (EIA) from its list of monitoring sources.
WTI Oil FAQs
WTI Oil is a type of Crude Oil sold on international markets. The WTI stands for West Texas Intermediate, one of three major types including Brent and Dubai Crude. WTI is also referred to as “light” and “sweet” because of its relatively low gravity and sulfur content respectively. It is considered a high quality Oil that is easily refined. It is sourced in the United States and distributed via the Cushing hub, which is considered “The Pipeline Crossroads of the World”. It is a benchmark for the Oil market and WTI price is frequently quoted in the media.
Like all assets, supply and demand are the key drivers of WTI Oil price. As such, global growth can be a driver of increased demand and vice versa for weak global growth. Political instability, wars, and sanctions can disrupt supply and impact prices. The decisions of OPEC, a group of major Oil-producing countries, is another key driver of price. The value of the US Dollar influences the price of WTI Crude Oil, since Oil is predominantly traded in US Dollars, thus a weaker US Dollar can make Oil more affordable and vice versa.
The weekly Oil inventory reports published by the American Petroleum Institute (API) and the Energy Information Agency (EIA) impact the price of WTI Oil. Changes in inventories reflect fluctuating supply and demand. If the data shows a drop in inventories it can indicate increased demand, pushing up Oil price. Higher inventories can reflect increased supply, pushing down prices. API’s report is published every Tuesday and EIA’s the day after. Their results are usually similar, falling within 1% of each other 75% of the time. The EIA data is considered more reliable, since it is a government agency.
OPEC (Organization of the Petroleum Exporting Countries) is a group of 12 Oil-producing nations who collectively decide production quotas for member countries at twice-yearly meetings. Their decisions often impact WTI Oil prices. When OPEC decides to lower quotas, it can tighten supply, pushing up Oil prices. When OPEC increases production, it has the opposite effect. OPEC+ refers to an expanded group that includes ten extra non-OPEC members, the most notable of which is Russia.
-
03:40
USD/CAD consolidates above 1.4300 mark; upside potential seems limited
- USD/CAD struggles to gain any meaningful traction and hangs near a two-week trough.
- Subdued Oil prices and the BoC’s dovish outlook undermine the Loonie and cap the pair.
- The USD languishes near the weekly low and further acts as a headwind for spot prices.
The USD/CAD pair enters a bearish consolidation phase after registering heavy losses over the past two days and holds above the 1.4300 mark during the Asian session on Wednesday. Moreover, the fundamental backdrop warrants some caution before confirming that a sharp pullback from a two-decade high touched on Monday has run its course.
Crude Oil prices struggle to capitalize on the overnight bounce from the year-to-date (YTD) low amid US-China trade tensions. This, along with the Bank of Canada's (BoC) dovish outlook, undermines the commodity-linked Loonie and acts as a tailwind for the USD/CAD pair. That said, a weaker US Dollar (USD) is holding back traders from placing aggressive bullish bets around the currency pair.
In fact, the USD Index (DXY), which tracks the Greenback against a basket of currencies, languishes near the weekly low amid expectations that the Federal Reserve (Fed) will lower borrowing costs further by the end of this year. The bets were reaffirmed by the Job Openings and Labor Turnover Survey (JOLTS) released on Tuesday, which pointed to a slowdown in the US labor market.
Apart from this, US President Donald Trump's decision to delay the 25% trade tariffs on Canadian and Mexican imports by 30 days contributes to capping the USD/CAD pair. Traders now look forward to the US economic docket – featuring the release of the ADP report on private-sector employment and the ISM Services PMI. This, along with Oil price dynamics, should provide some impetus to spot prices.
Canadian Dollar FAQs
The key factors driving the Canadian Dollar (CAD) are the level of interest rates set by the Bank of Canada (BoC), the price of Oil, Canada’s largest export, the health of its economy, inflation and the Trade Balance, which is the difference between the value of Canada’s exports versus its imports. Other factors include market sentiment – whether investors are taking on more risky assets (risk-on) or seeking safe-havens (risk-off) – with risk-on being CAD-positive. As its largest trading partner, the health of the US economy is also a key factor influencing the Canadian Dollar.
The Bank of Canada (BoC) has a significant influence on the Canadian Dollar by setting the level of interest rates that banks can lend to one another. This influences the level of interest rates for everyone. The main goal of the BoC is to maintain inflation at 1-3% by adjusting interest rates up or down. Relatively higher interest rates tend to be positive for the CAD. The Bank of Canada can also use quantitative easing and tightening to influence credit conditions, with the former CAD-negative and the latter CAD-positive.
The price of Oil is a key factor impacting the value of the Canadian Dollar. Petroleum is Canada’s biggest export, so Oil price tends to have an immediate impact on the CAD value. Generally, if Oil price rises CAD also goes up, as aggregate demand for the currency increases. The opposite is the case if the price of Oil falls. Higher Oil prices also tend to result in a greater likelihood of a positive Trade Balance, which is also supportive of the CAD.
While inflation had always traditionally been thought of as a negative factor for a currency since it lowers the value of money, the opposite has actually been the case in modern times with the relaxation of cross-border capital controls. Higher inflation tends to lead central banks to put up interest rates which attracts more capital inflows from global investors seeking a lucrative place to keep their money. This increases demand for the local currency, which in Canada’s case is the Canadian Dollar.
Macroeconomic data releases gauge the health of the economy and can have an impact on the Canadian Dollar. Indicators such as GDP, Manufacturing and Services PMIs, employment, and consumer sentiment surveys can all influence the direction of the CAD. A strong economy is good for the Canadian Dollar. Not only does it attract more foreign investment but it may encourage the Bank of Canada to put up interest rates, leading to a stronger currency. If economic data is weak, however, the CAD is likely to fall.
Tariffs FAQs
Tariffs are customs duties levied on certain merchandise imports or a category of products. Tariffs are designed to help local producers and manufacturers be more competitive in the market by providing a price advantage over similar goods that can be imported. Tariffs are widely used as tools of protectionism, along with trade barriers and import quotas.
Although tariffs and taxes both generate government revenue to fund public goods and services, they have several distinctions. Tariffs are prepaid at the port of entry, while taxes are paid at the time of purchase. Taxes are imposed on individual taxpayers and businesses, while tariffs are paid by importers.
There are two schools of thought among economists regarding the usage of tariffs. While some argue that tariffs are necessary to protect domestic industries and address trade imbalances, others see them as a harmful tool that could potentially drive prices higher over the long term and lead to a damaging trade war by encouraging tit-for-tat tariffs.
During the run-up to the presidential election in November 2024, Donald Trump made it clear that he intends to use tariffs to support the US economy and American producers. In 2024, Mexico, China and Canada accounted for 42% of total US imports. In this period, Mexico stood out as the top exporter with $466.6 billion, according to the US Census Bureau. Hence, Trump wants to focus on these three nations when imposing tariffs. He also plans to use the revenue generated through tariffs to lower personal income taxes.
-
03:20
Japanese Yen rallies on strong wage growth data; USD/JPY slumps to mid-153.00s
- The Japanese Yen jumps to over a one-month top against the USD amid BoJ rate hike bets.
- Expectations for a further narrowing of the Japan-US rate differential also underpin the JPY.
- A positive risk tone might cap the safe-haven JPY amid worries about Trump’s trade tariffs.
The Japanese Yen (JPY) attracts fresh buyers after data released during the Asian session on Wednesday showed a rise in Japan's real wages, which reaffirms bets that the Bank of Japan (BoJ) will raise interest rates again. This marks a big divergence in comparison to expectations that the Federal Reserve (Fed) will lower borrowing costs twice by the end of this year. The resultant narrowing of the rate differential between Japan and the US further benefits the lower-yielding JPY.
Apart from this, a softer US Dollar (USD) dragged the USD/JPY pair to mid-153.0s, or its lowest level since December 18 in the last hour. Meanwhile, investors remain worried that Japan would also be an eventual target for US President Donald Trump's trade tariffs. This, along with the risk-on mood, might hold back traders from placing fresh bullish bets around the safe-haven JPY. Nevertheless, the fundamental backdrop supports prospects for further JPY appreciation.
Japanese Yen strengthens as a rise in Japan’s real wages lifts BoJ rate hike bets
- Preliminary government data released earlier this Wednesday revealed that inflation-adjusted real wages in Japan climbed 0.6% from the year before in December. Adding to this, the previous month's reading was revised to show a 0.5% rise against a 0.3% drop reported originally.
- Meanwhile, the consumer inflation rate that the government uses to calculate real wages accelerated from November's 3.4% to 4.2%, or the fastest pace since January 2023. This, in turn, supports prospects for further policy tightening by the Bank of Japan and lifts the Japanese Yen.
- A survey compiled by S&P Global Market Intelligence showed that Japan's service activity expanded for a third straight month in January. In fact, the au Jibun Bank Service Purchasing Managers’ Index (PMI) rose from 50.9 to 53.0 in January, marking the highest level since September 2024.
- The US Bureau of Labor Statistics (BLS) reported in the Job Openings and Labor Turnover Survey (JOLTS) on Tuesday that the number of job openings on the last business day of December stood at 7.6 million. This was below the 8.09 million openings in November and expectations of 8 million.
- The data pointed to a slowdown in the job market, which could allow the Federal Reserve to cut rates further. This marks a big divergence in comparison to the hawkish BoJ expectations and drags the USD/JPY pair to over a one-month low during the Asian session on Wednesday.
- Fed Vice Chairman Philip Jefferson said on Tuesday that there is no need to hurry further rate cuts as a strong economy makes caution appropriate. Interest rates are likely to fall over the medium term and the Fed faces uncertainty around government policy, Jefferson added further.
- US President Donald Trump offered concessions to Canada and Mexico by delaying the 25% trade tariffs for 30 days. Adding to this hopes for a trade breakthrough between the US and China help to ease trade war fears and remain supportive of the prevalent risk-on environment.
- Investors remain worried that Japan would also be an eventual target for Trump's trade tariffs. Japan's Prime Minister Shigeru Ishiba is set to meet with Trump later this week and their conversation may provide more hints about the risk as Japan has a large trade surplus with the US.
- Traders now look forward to the US economic docket – featuring the release of the ADP report on private-sector employment and the ISM Services PMI. The data provide some impetus to the US Dollar ahead of the closely-watched US Nonfarm Payrolls report on Friday.
USD/JPY seems vulnerable to slide further; breakdown below the 154.00 mark in play
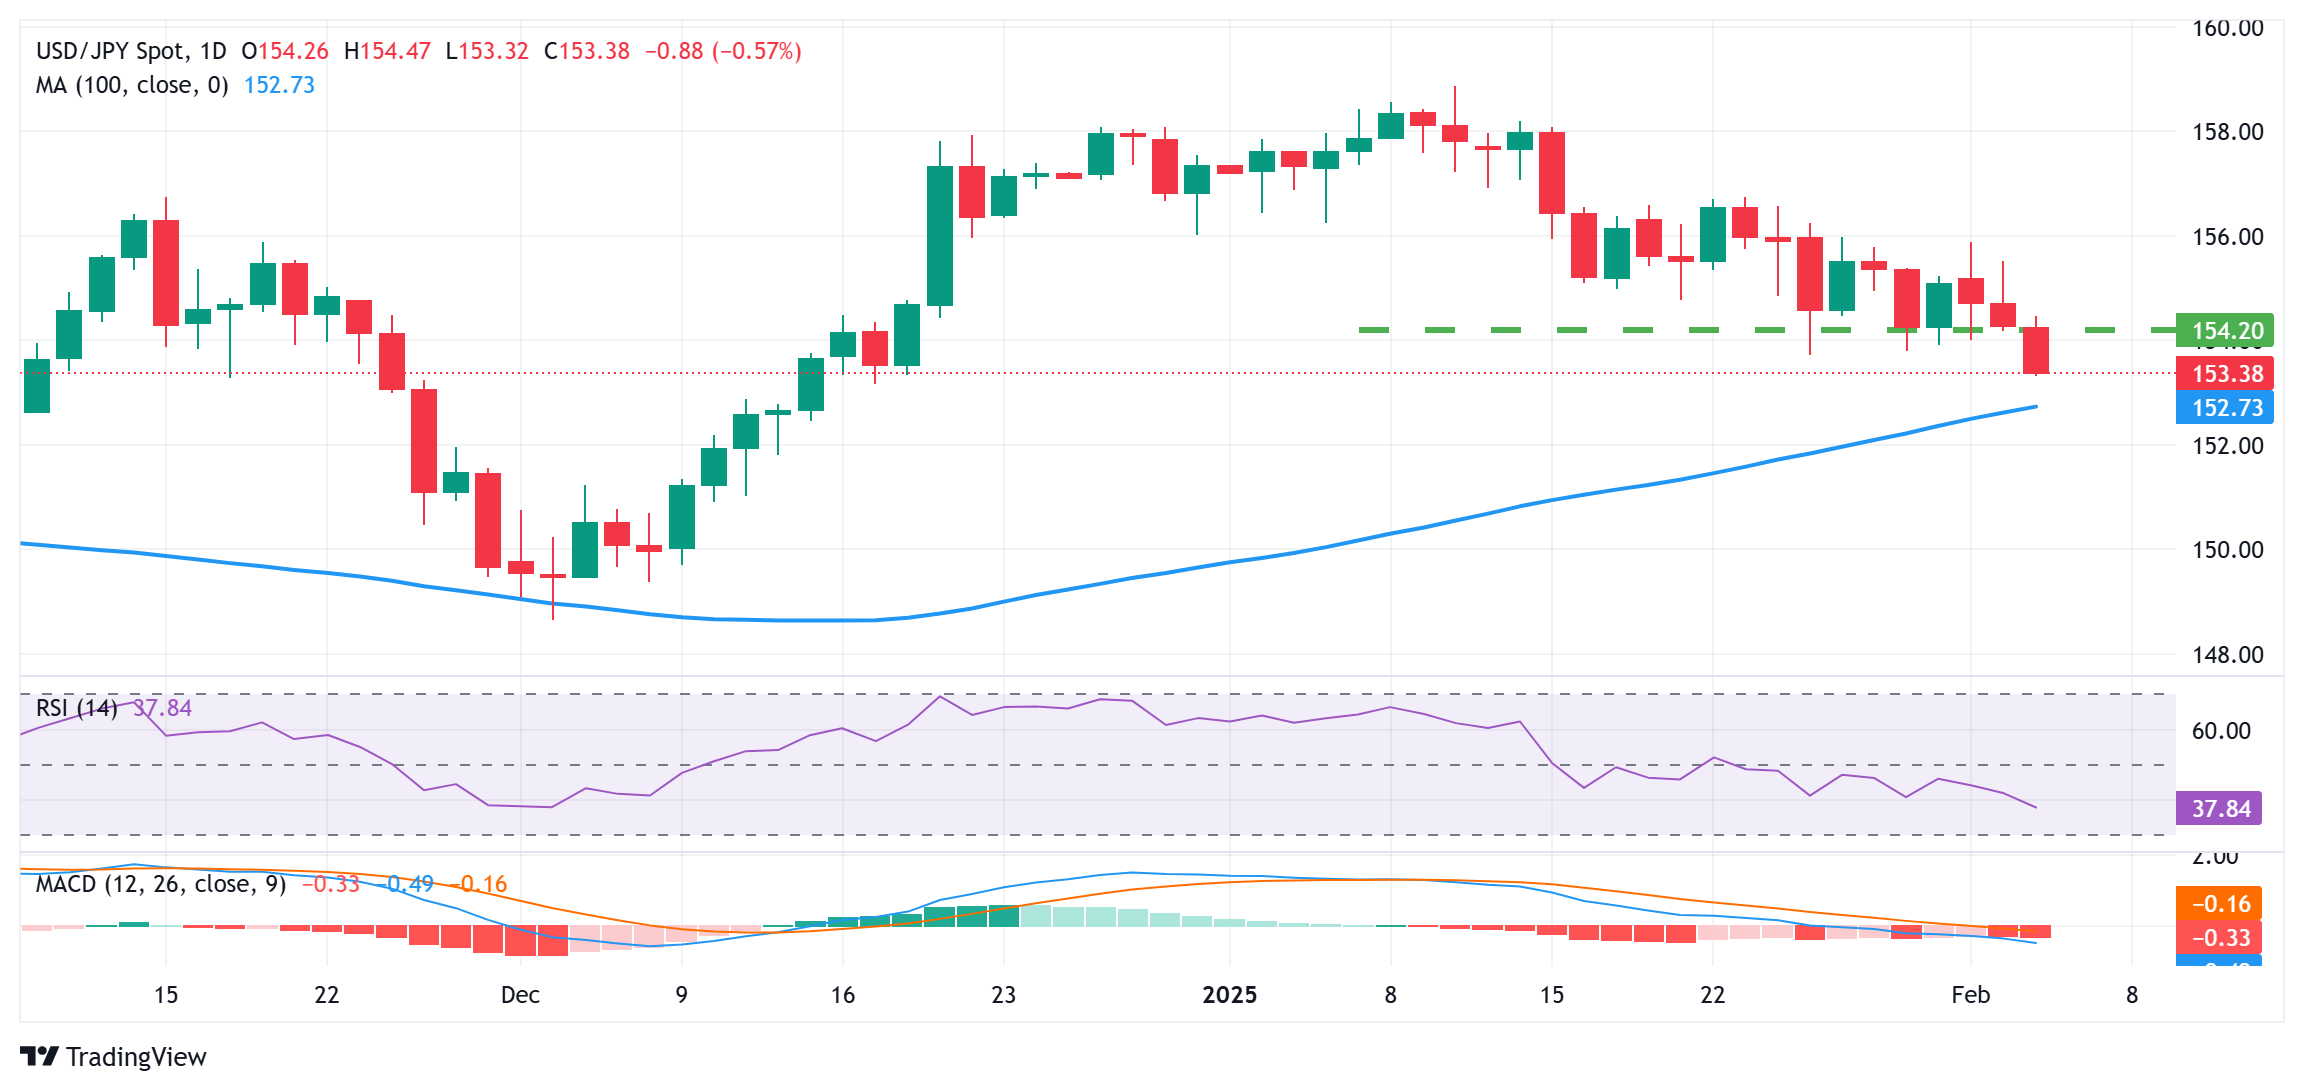
From a technical perspective, the intraday breakdown and acceptance below the 154.00 mark could be seen as a fresh trigger for bearish traders. Moreover, oscillators on the daily chart have been gaining negative traction and are still away from being in the oversold territory. This, in turn, suggests that the path of least resistance for the USD/JPY pair is to the downside and supports prospects for a further depreciating move. Hence, a subsequent fall towards the 153.00 mark, en route to the 100-day Simple Moving Average (SMA), currently pegged near the 152.45 region, looks like a distinct possibility.
On the flip side, any attempted recovery might now confront immediate resistance near the 154.00 round figure. Some follow-through buying, however, might prompt a short-covering rally and lift the USD/JPY pair to the 154.70-154.75 intermediate hurdle en route to the 155.00 psychological mark. Meanwhile, a further move up could be seen as a selling opportunity and remain capped near the 155.25-155.30 region. The latter should act as a key pivotal point, which if cleared decisively will negate the negative outlook and shift the near-term bias in favor of bullish traders.
Economic Indicator
Labor Cash Earnings (YoY)
This indicator, released by the Ministry of Health, Labor and Welfare, shows the average income, before taxes, per regular employee. It includes overtime pay and bonuses but it doesn't take into account earnings from holding financial assets nor capital gains. Higher income puts upward pressures on consumption, and is inflationary for the Japanese economy. Generally, a higher-than-expected reading is bullish for the Japanese Yen (JPY), while a below-the-market consensus result is bearish.
Read more.Last release: Tue Feb 04, 2025 23:30
Frequency: Monthly
Actual: 4.8%
Consensus: 3.8%
Previous: 3%
Tariffs FAQs
Tariffs are customs duties levied on certain merchandise imports or a category of products. Tariffs are designed to help local producers and manufacturers be more competitive in the market by providing a price advantage over similar goods that can be imported. Tariffs are widely used as tools of protectionism, along with trade barriers and import quotas.
Although tariffs and taxes both generate government revenue to fund public goods and services, they have several distinctions. Tariffs are prepaid at the port of entry, while taxes are paid at the time of purchase. Taxes are imposed on individual taxpayers and businesses, while tariffs are paid by importers.
There are two schools of thought among economists regarding the usage of tariffs. While some argue that tariffs are necessary to protect domestic industries and address trade imbalances, others see them as a harmful tool that could potentially drive prices higher over the long term and lead to a damaging trade war by encouraging tit-for-tat tariffs.
During the run-up to the presidential election in November 2024, Donald Trump made it clear that he intends to use tariffs to support the US economy and American producers. In 2024, Mexico, China and Canada accounted for 42% of total US imports. In this period, Mexico stood out as the top exporter with $466.6 billion, according to the US Census Bureau. Hence, Trump wants to focus on these three nations when imposing tariffs. He also plans to use the revenue generated through tariffs to lower personal income taxes.
-
03:15
NZD/USD hovers around 0.5650 following labor market data, China’s Services PMI
- NZD/USD remains silent following the release of domestic employment figures on Wednesday.
- China's Services PMI dropped to 51.0 in January from 52.2 in December, falling short of the expected 52.3.
- Traders anticipate Friday’s US Nonfarm Payrolls (NFP), which is expected to show a slight slowdown in job growth for January.
NZD/USD remains steady following the release of the Caixin Services Purchasing Managers’ Index (PMI) from China, New Zealand’s close trading partner. The New Zealand Dollar (NZD) also avoided to react on the domestic labor market data. The pair trades around 0.5650 during the Asian hours on Wednesday.
China's Services PMI unexpectedly fell to 51.0 in January from 52.2 in December. The data surprised to the downside, missing the estimated 52.3 figure.
New Zealand's Unemployment Rate climbed to 5.1% in Q4 2024, up from 4.8% in the previous period, in line with market expectations and reaching its highest level since September 2020. The Employment Rate edged down to 67.4% from 67.7%, while the underutilization rate increased slightly to 12.1% from 11.6% in the previous quarter.
The New Zealand Dollar (NZD) could struggle due to a risk-off sentiment following rising fears over US-China trade tensions. China retaliated against the new 10% US tariff that took effect on Tuesday. However, Trump stated on Monday afternoon that he would likely speak with China. He also warned, "If we can't reach a deal with China, the tariffs will be very, very substantial." However, no further update is available.
China’s Commerce Ministry announced that it will impose a 15% tariff on US coal and liquefied natural gas (LNG) imports, along with an additional 10% tariff on crude Oil, farm equipment, and certain automobiles. Additionally, to "safeguard national security interests," China is implementing export controls on tungsten, tellurium, ruthenium, molybdenum, and related products.
The US Dollar Index (DXY), which measures the US Dollar’s value against six major currencies, remains under downward pressure for the third successive day, trading around 108.00 at the time of writing. Meanwhile, traders brace for Friday’s US Nonfarm Payrolls (NFP) data, which is expected to shape the Federal Reserve’s (Fed) monetary policy direction.
Economic Indicator
Caixin Services PMI
The Caixin Services Purchasing Managers Index (PMI), released on a monthly basis by Caixin Insight Group and S&P Global, is a leading indicator gauging business activity in China’s services sector. The data is derived from surveys of senior executives at both private-sector and state-owned companies. Survey responses reflect the change, if any, in the current month compared to the previous month and can anticipate changing trends in official data series such as Gross Domestic Product (GDP), industrial production, employment and inflation. The index varies between 0 and 100, with levels of 50.0 signaling no change over the previous month. A reading above 50 indicates that the services economy is generally expanding, a bullish sign for the Renminbi (CNY). Meanwhile, a reading below 50 signals that activity among service providers is generally declining, which is seen as bearish for CNY.
Read more.Last release: Wed Feb 05, 2025 01:45
Frequency: Monthly
Actual: 51
Consensus: 52.3
Previous: 52.2
Source: IHS Markit
-
02:47
China’s Caixin Services PMI unexpectedly drops to 51 in January vs. 52.3 expected
China's Services Purchasing Managers' Index (PMI) unexpectedly fell to 51 in January from 52.2 in December, the latest data published by Caixin showed Wednesday.
The data surprised to the downside, missing the estimated 52.3 figure.
AUD/USD reaction to China’s Services PMI
At the time of writing, the AUD/USD pair is losing 0.08% on the day near 0.6250, undermined by the discouraging Chinese data.
Australian Dollar FAQs
One of the most significant factors for the Australian Dollar (AUD) is the level of interest rates set by the Reserve Bank of Australia (RBA). Because Australia is a resource-rich country another key driver is the price of its biggest export, Iron Ore. The health of the Chinese economy, its largest trading partner, is a factor, as well as inflation in Australia, its growth rate and Trade Balance. Market sentiment – whether investors are taking on more risky assets (risk-on) or seeking safe-havens (risk-off) – is also a factor, with risk-on positive for AUD.
The Reserve Bank of Australia (RBA) influences the Australian Dollar (AUD) by setting the level of interest rates that Australian banks can lend to each other. This influences the level of interest rates in the economy as a whole. The main goal of the RBA is to maintain a stable inflation rate of 2-3% by adjusting interest rates up or down. Relatively high interest rates compared to other major central banks support the AUD, and the opposite for relatively low. The RBA can also use quantitative easing and tightening to influence credit conditions, with the former AUD-negative and the latter AUD-positive.
China is Australia’s largest trading partner so the health of the Chinese economy is a major influence on the value of the Australian Dollar (AUD). When the Chinese economy is doing well it purchases more raw materials, goods and services from Australia, lifting demand for the AUD, and pushing up its value. The opposite is the case when the Chinese economy is not growing as fast as expected. Positive or negative surprises in Chinese growth data, therefore, often have a direct impact on the Australian Dollar and its pairs.
Iron Ore is Australia’s largest export, accounting for $118 billion a year according to data from 2021, with China as its primary destination. The price of Iron Ore, therefore, can be a driver of the Australian Dollar. Generally, if the price of Iron Ore rises, AUD also goes up, as aggregate demand for the currency increases. The opposite is the case if the price of Iron Ore falls. Higher Iron Ore prices also tend to result in a greater likelihood of a positive Trade Balance for Australia, which is also positive of the AUD.
The Trade Balance, which is the difference between what a country earns from its exports versus what it pays for its imports, is another factor that can influence the value of the Australian Dollar. If Australia produces highly sought after exports, then its currency will gain in value purely from the surplus demand created from foreign buyers seeking to purchase its exports versus what it spends to purchase imports. Therefore, a positive net Trade Balance strengthens the AUD, with the opposite effect if the Trade Balance is negative.
-
02:46
China Caixin Services PMI below expectations (52.3) in January: Actual (51)
-
02:35
Fed’s Jefferson: No need to hurry further rate cuts; strong economy makes caution appropriate
Federal Reserve (Fed) Vice Chairman Philip Jefferson was on the wires late Tuesday, commenting on the economic and interest rates outlooks.
Key quotes
No need to hurry further rate cuts; strong economy makes caution appropriate.
Interest rates likely to fall over medium term.
Expect disinflation to continue, though progress may be slow.
Fed faces uncertainty around government policy.
Expect growth and labor market conditions to remain solid.
-
02:25
Australian Dollar edges lower amid rising fears over US-China trade war
- The Australian Dollar struggles as risk-off sentiment intensifies due to escalating US-China trade tensions.
- Australia’s Judo Bank Composite PMI rose to 51.1 in January from 50.2 in December, signaling a modest expansion.
- Fed’s Daly stated that the central bank remains in a wait-and-see stance, emphasizing the impact of economic uncertainty on policymaking.
The Australian Dollar (AUD) edges lower against the US Dollar (USD) amid an increased risk aversion following rising fears over US-China trade tensions. The AUD/USD pair failed to draw support from the improved Judo Bank Purchasing Managers Index (PMI) released on Wednesday.
Australia’s Judo Bank Composite PMI climbed to 51.1 in January from 50.2 in December, reflecting modest growth in private sector activity. Meanwhile, the Judo Bank Services PMI rose to 51.2 from 50.8, marking the twelfth consecutive month of expansion in the services sector. Although the growth was moderate, it was the strongest since August.
The AUD may further depreciate amid the increased likelihood that the Reserve Bank of Australia (RBA) could consider a rate cut in February. The RBA has maintained the Official Cash Rate (OCR) at 4.35% since November 2023, emphasizing that inflation must “sustainably” return to its 2%-3% target range before any policy easing.
The Aussie Dollar faces challenges as market volatility remains a concern as investors closely watch the ongoing trade war between the United States (US) and China, Australia’s key trading partner. China retaliated against the new 10% US tariff that took effect on Tuesday. However, Trump stated on Monday afternoon that he would likely speak with China within the next 24 hours. He also warned, "If we can't reach a deal with China, the tariffs will be very, very substantial."
Australian Dollar remains under pressure amid increased risk aversion
- The US Dollar Index (DXY), which measures the US Dollar’s value against six major currencies, remains under downward pressure for the third successive day, trading around 108.00 at the time of writing. Meanwhile, traders brace for Friday’s US Nonfarm Payrolls (NFP) data, which is expected to shape the Federal Reserve’s (Fed) monetary policy direction.
- President Trump has agreed to a 30-day suspension of the proposed 25% tariffs on Canadian and Mexican imports. This decision comes after Canadian Prime Minister Justin Trudeau and Mexican President Claudia Sheinbaum committed to enhancing border security measures to address concerns over illegal immigration and drug trafficking.
- China’s Commerce Ministry announced that it will impose a 15% tariff on US coal and liquefied natural gas (LNG) imports, along with an additional 10% tariff on crude Oil, farm equipment, and certain automobiles. Additionally, to "safeguard national security interests," China is implementing export controls on tungsten, tellurium, ruthenium, molybdenum, and related products.
- According to the Financial Times, Chinese exporters are intensifying their efforts to offshore production in response to Trump’s tariffs. Manufacturers in China are accelerating plans to relocate production to other countries, including the Middle East, to avoid US tariffs. Other tactics being considered include passing the increased costs onto US consumers and exploring alternative markets.
- The White House announced late Monday that US President Donald Trump signed an executive order to initiate the creation of a government-owned investment fund, according to Reuters. This fund could allow the US to profit from TikTok if an American buyer is secured. TikTok has until early April to find an approved partner or purchaser. Trump is pushing for the US to acquire a 50% stake in the company.
- JOLTS Job Openings fell to 7.6 million in December, missing the 8 million consensus estimate. The US labor market remains stable with total separations little changed at 5.3 million in December.
- The CME FedWatch Tool projects an 86% chance that the Fed will keep rates unchanged at its March meeting.
- San Francisco Fed Bank President Mary Daly stated on Tuesday that the central bank remains in a wait-and-see stance, emphasizing the impact of economic uncertainty on policymaking. While the economy is performing well and maintaining momentum, uncertainty persists. As a result, the Fed has the flexibility to carefully assess data before making policy adjustments.
Technical Analysis: Australian Dollar breaks above nine-day EMA and descending channel
The AUD/USD pair trades near 0.6250 on Wednesday, staying above the descending channel pattern on the daily chart, indicating a potential bullish shift. The 14-day Relative Strength Index (RSI) sits at the 50 level, reflecting neutral momentum. A sustained break above 50 on the RSI could confirm a stronger bullish trend.
On the upside, the AUD/USD pair could explore the area around its seven-week high at 0.6330 level, which was recorded on January 24.
The AUD/USD pair may find immediate support at the nine-day Exponential Moving Average (EMA) near 0.6240, followed by the upper boundary of the descending channel. A pullback to the channel would reinforce the bearish bias, potentially driving the pair toward the lower boundary of the descending channel around 0.6140.
AUD/USD: Daily Chart

Australian Dollar PRICE Today
The table below shows the percentage change of Australian Dollar (AUD) against listed major currencies today. Australian Dollar was the weakest against the Japanese Yen.
USD EUR GBP JPY CAD AUD NZD CHF USD 0.03% 0.04% -0.45% 0.03% 0.09% -0.08% 0.03% EUR -0.03% 0.00% -0.45% -0.01% 0.06% -0.12% -0.00% GBP -0.04% -0.01% -0.48% -0.01% 0.05% -0.12% -0.01% JPY 0.45% 0.45% 0.48% 0.46% 0.53% 0.34% 0.47% CAD -0.03% 0.01% 0.01% -0.46% 0.07% -0.11% 0.00% AUD -0.09% -0.06% -0.05% -0.53% -0.07% -0.18% -0.06% NZD 0.08% 0.12% 0.12% -0.34% 0.11% 0.18% 0.12% CHF -0.03% 0.00% 0.00% -0.47% -0.01% 0.06% -0.12% The heat map shows percentage changes of major currencies against each other. The base currency is picked from the left column, while the quote currency is picked from the top row. For example, if you pick the Australian Dollar from the left column and move along the horizontal line to the US Dollar, the percentage change displayed in the box will represent AUD (base)/USD (quote).
Australian Dollar FAQs
One of the most significant factors for the Australian Dollar (AUD) is the level of interest rates set by the Reserve Bank of Australia (RBA). Because Australia is a resource-rich country another key driver is the price of its biggest export, Iron Ore. The health of the Chinese economy, its largest trading partner, is a factor, as well as inflation in Australia, its growth rate and Trade Balance. Market sentiment – whether investors are taking on more risky assets (risk-on) or seeking safe-havens (risk-off) – is also a factor, with risk-on positive for AUD.
The Reserve Bank of Australia (RBA) influences the Australian Dollar (AUD) by setting the level of interest rates that Australian banks can lend to each other. This influences the level of interest rates in the economy as a whole. The main goal of the RBA is to maintain a stable inflation rate of 2-3% by adjusting interest rates up or down. Relatively high interest rates compared to other major central banks support the AUD, and the opposite for relatively low. The RBA can also use quantitative easing and tightening to influence credit conditions, with the former AUD-negative and the latter AUD-positive.
China is Australia’s largest trading partner so the health of the Chinese economy is a major influence on the value of the Australian Dollar (AUD). When the Chinese economy is doing well it purchases more raw materials, goods and services from Australia, lifting demand for the AUD, and pushing up its value. The opposite is the case when the Chinese economy is not growing as fast as expected. Positive or negative surprises in Chinese growth data, therefore, often have a direct impact on the Australian Dollar and its pairs.
Iron Ore is Australia’s largest export, accounting for $118 billion a year according to data from 2021, with China as its primary destination. The price of Iron Ore, therefore, can be a driver of the Australian Dollar. Generally, if the price of Iron Ore rises, AUD also goes up, as aggregate demand for the currency increases. The opposite is the case if the price of Iron Ore falls. Higher Iron Ore prices also tend to result in a greater likelihood of a positive Trade Balance for Australia, which is also positive of the AUD.
The Trade Balance, which is the difference between what a country earns from its exports versus what it pays for its imports, is another factor that can influence the value of the Australian Dollar. If Australia produces highly sought after exports, then its currency will gain in value purely from the surplus demand created from foreign buyers seeking to purchase its exports versus what it spends to purchase imports. Therefore, a positive net Trade Balance strengthens the AUD, with the opposite effect if the Trade Balance is negative.
-
02:15
PBOC sets USD/CNY reference rate at 7.1693
On Wednesday, the People’s Bank of China (PBOC) set the USD/CNY central rate for the trading session ahead at 7.1693 as compared to 7.2661 Reuters estimates.
PBOC FAQs
The primary monetary policy objectives of the People's Bank of China (PBoC) are to safeguard price stability, including exchange rate stability, and promote economic growth. China’s central bank also aims to implement financial reforms, such as opening and developing the financial market.
The PBoC is owned by the state of the People's Republic of China (PRC), so it is not considered an autonomous institution. The Chinese Communist Party (CCP) Committee Secretary, nominated by the Chairman of the State Council, has a key influence on the PBoC’s management and direction, not the governor. However, Mr. Pan Gongsheng currently holds both of these posts.
Unlike the Western economies, the PBoC uses a broader set of monetary policy instruments to achieve its objectives. The primary tools include a seven-day Reverse Repo Rate (RRR), Medium-term Lending Facility (MLF), foreign exchange interventions and Reserve Requirement Ratio (RRR). However, The Loan Prime Rate (LPR) is China’s benchmark interest rate. Changes to the LPR directly influence the rates that need to be paid in the market for loans and mortgages and the interest paid on savings. By changing the LPR, China’s central bank can also influence the exchange rates of the Chinese Renminbi.
Yes, China has 19 private banks – a small fraction of the financial system. The largest private banks are digital lenders WeBank and MYbank, which are backed by tech giants Tencent and Ant Group, per The Straits Times. In 2014, China allowed domestic lenders fully capitalized by private funds to operate in the state-dominated financial sector.
-
01:30
Japan Jibun Bank Services PMI came in at 53, above forecasts (52.7) in January
-
01:30
Japan Jibun Bank Services PMI came in at 53, above forecasts (52.7) in January
-
01:15
Currencies. Daily history for Tuesday, February 4, 2025
Pare Closed Change, % AUDUSD 0.62567 0.55 EURJPY 160.185 0.21 EURUSD 1.03797 0.44 GBPJPY 192.622 0.14 GBPUSD 1.24822 0.4 NZDUSD 0.56527 0.59 USDCAD 1.43219 -0.67 USDCHF 0.90501 -0.49 USDJPY 154.313 -0.24 -
01:02
New Zealand ANZ Commodity Price: 1.8% (January) vs 0.2%
-
00:58
EUR/USD bounces as market pressures abate
- EUR/USD gained 0.8% on Tuesday as trade wars turn hypothetical.
- President Trump’s tariff bluffs have been called by the markets after several delays.
- European economic data remains thin this week.
EUR/USD lurched higher by eight-tenths of one percent on Tuesday, regaining lost ground but failing to recapture the 1.0400 handle. Fiber has snapped a six-day losing streak, but overall bullish momentum remains thin with the Euro at the mercy of overall market flows and looming US Nonfarm Payrolls (NFP) figures.
EUR/USD’s early-week plunge toward 1.0200 sparked by impending tariffs from US President Donald Trump has firmly recovered ground after the Trump administration took any excuse it could find to avert its self-imposed threats to tax its own citizens for importing goods from other countries. Threats of a flat 10% import tax on European-produced goods are still on the cards, but last-minute pivots into concessions on nearly all of President Trump’s targeted countries, except for China, has left investors confident that the posturing is simply that and nothing more. 10% import fees on goods from China are still on the table, but President Trump also failed to follow through on his threat to arbitrarily double tariffs on any countries that retaliate.
To his credit, China’s retaliatory tariffs of 10% on US-made goods is a largely theatrical gesture; very few US-made goods make it overseas to Chinese markets, and the move is mostly symbolic. Investors are now tuning out most of President Trump’s trade rhetoric as the US administration fumbles its own setup, and future tariff threats are likely to have muted impacts as future concessions get priced in ahead of time.
The US ADP Employment Change data is set to be released on Wednesday; however, this erratic figure is not expected to generate significant movement. Additionally, the US ISM Services Purchasing Managers Index (PMI) report for January is anticipated, with projections indicating a rise from 54.1 to 54.3. The most critical US data point this week will be Friday’s Nonfarm Payrolls, which is predicted to decline from 256K to 170K.
EUR/USD price forecast
EUR/USD found enough juice to halt a six-day backslide, but the pair still remains on the wrong side of the 1.0400 handle and the 50-day Exponential Moving Average (EMA) at 1.0440. Bullish momentum has waned out of technical oscillators, and Fiber price action is set for a sideways grind between 1.0500 and 1.0300.
EUR/USD daily chart
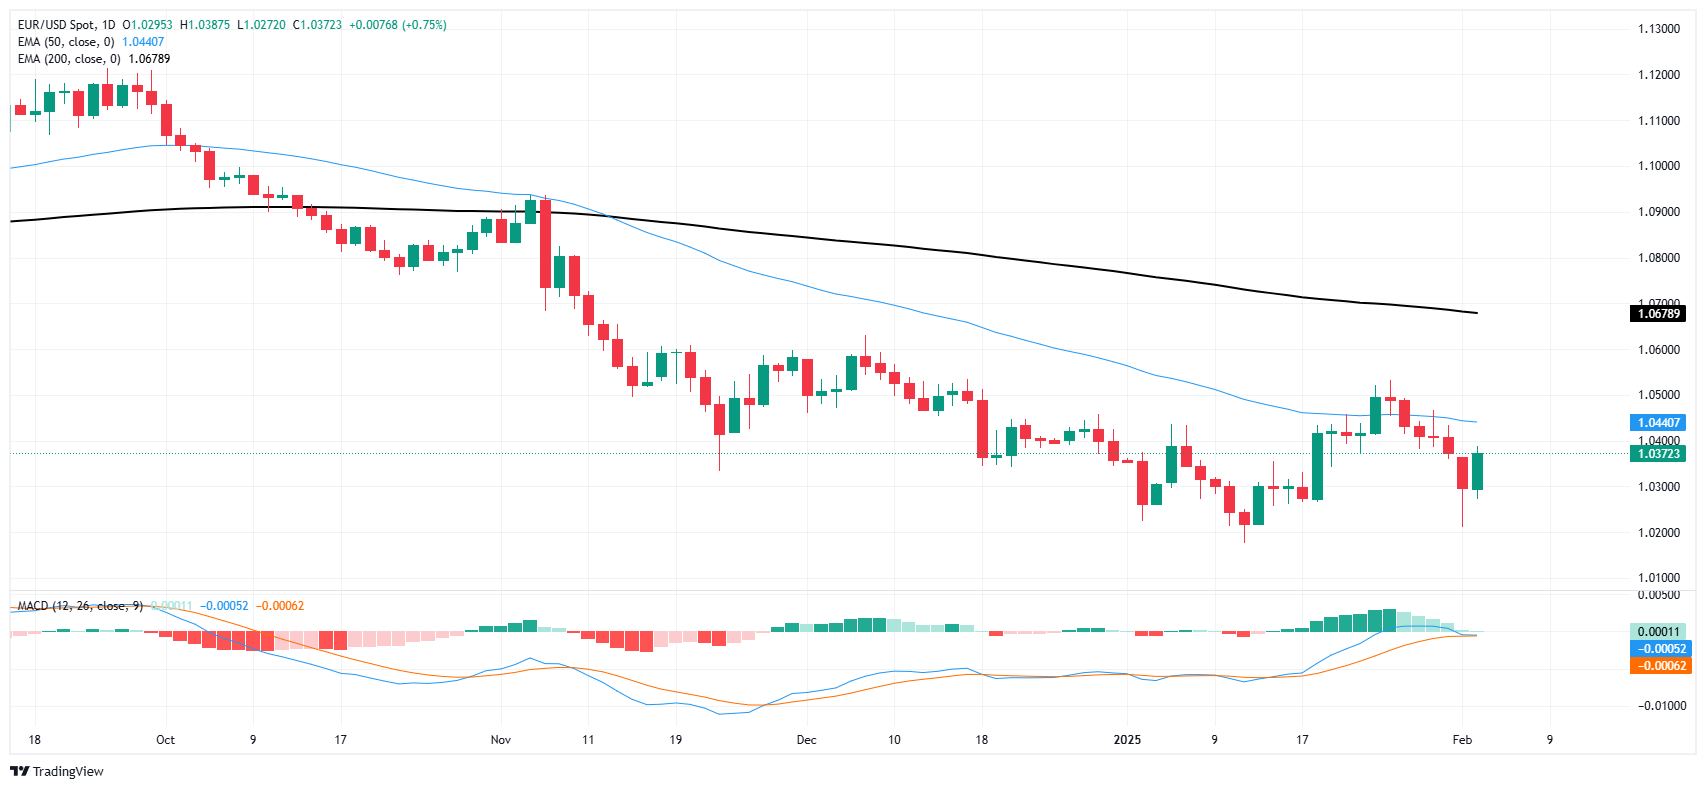
Euro FAQs
The Euro is the currency for the 19 European Union countries that belong to the Eurozone. It is the second most heavily traded currency in the world behind the US Dollar. In 2022, it accounted for 31% of all foreign exchange transactions, with an average daily turnover of over $2.2 trillion a day. EUR/USD is the most heavily traded currency pair in the world, accounting for an estimated 30% off all transactions, followed by EUR/JPY (4%), EUR/GBP (3%) and EUR/AUD (2%).
The European Central Bank (ECB) in Frankfurt, Germany, is the reserve bank for the Eurozone. The ECB sets interest rates and manages monetary policy. The ECB’s primary mandate is to maintain price stability, which means either controlling inflation or stimulating growth. Its primary tool is the raising or lowering of interest rates. Relatively high interest rates – or the expectation of higher rates – will usually benefit the Euro and vice versa. The ECB Governing Council makes monetary policy decisions at meetings held eight times a year. Decisions are made by heads of the Eurozone national banks and six permanent members, including the President of the ECB, Christine Lagarde.
Eurozone inflation data, measured by the Harmonized Index of Consumer Prices (HICP), is an important econometric for the Euro. If inflation rises more than expected, especially if above the ECB’s 2% target, it obliges the ECB to raise interest rates to bring it back under control. Relatively high interest rates compared to its counterparts will usually benefit the Euro, as it makes the region more attractive as a place for global investors to park their money.
Data releases gauge the health of the economy and can impact on the Euro. Indicators such as GDP, Manufacturing and Services PMIs, employment, and consumer sentiment surveys can all influence the direction of the single currency. A strong economy is good for the Euro. Not only does it attract more foreign investment but it may encourage the ECB to put up interest rates, which will directly strengthen the Euro. Otherwise, if economic data is weak, the Euro is likely to fall. Economic data for the four largest economies in the euro area (Germany, France, Italy and Spain) are especially significant, as they account for 75% of the Eurozone’s economy.
Another significant data release for the Euro is the Trade Balance. This indicator measures the difference between what a country earns from its exports and what it spends on imports over a given period. If a country produces highly sought after exports then its currency will gain in value purely from the extra demand created from foreign buyers seeking to purchase these goods. Therefore, a positive net Trade Balance strengthens a currency and vice versa for a negative balance.
-
00:41
GBP/USD extends recovery but remains on shaky ground
- GBP/USD climbed 0.6% on Tuesday as tariff threats ease.
- President Trump’s trade war threats are fading into the background.
- Data remains mid-tier until BoE’s rate call on Thursday and Friday’s US NFP.
GBP/USD continued to grind higher on Tuesday, extending a recovery after the week’s early plunge on trade war concerns sparked by US President Donald Trump’s sweeping threats to impose stiff tariffs on his own constituents in an effort to punish some of the US’ closest trade allies. Tariffs, which were supposed to go into effect on Tuesday, have been kicked down the road another 30 days, marking President Trump’s third consecutive walk back of his own threats as he secures concessions that were largely already given to the previous administration.
The midweek session will be a thin affair on the economic data docket with geopolitical headlines fading into background noise as investors tune out President Trump’s long-winded diatribe of perceived grievances. Even if his tariff talk had a chance of materializing, the UK is unlikely to draw any specific trade ire from Donald Trump.
US ADP Employment Change figures are due on Wednesday, but the janky figure is unlikely to spark much momentum. US ISM Services Purchasing Managers Index (PMI) activity survey results for January are also expected, but the figure is forecast to shift to 54.3 from 54.1. The key US print this week will be Friday’s Nonfarm Payrolls, slated to ease to 170K from 256K.
The Bank of England’s (BoE) upcoming rate call on Thursday is broadly expected to deliver a quarter point cut to markets. With the US Federal Reserve (Fed) firmly embedded in a wait-and-see stance over inconsistent US policy, Cable’s interest rate differential is set to widen slightly this week, capping bullish potential.
GBP/USD price forecast
GBP/USD climbed a little over six-tenths of one percent, clawing back to 1.2480, but the pair still remains capped below the 1.2500 handle as the 50-day Exponential Moving Average (EMA) weighs on near-term price action.
A successful break to the upside could send Cable bids back into the 200-day EMA at 1.2700, but a return to recent lows near 1.2100 is also on the cards as price action wastes a bullish turnaround in the Moving Average Convergence-Divergence (MACD) oscillator.
GBP/USD daily chart
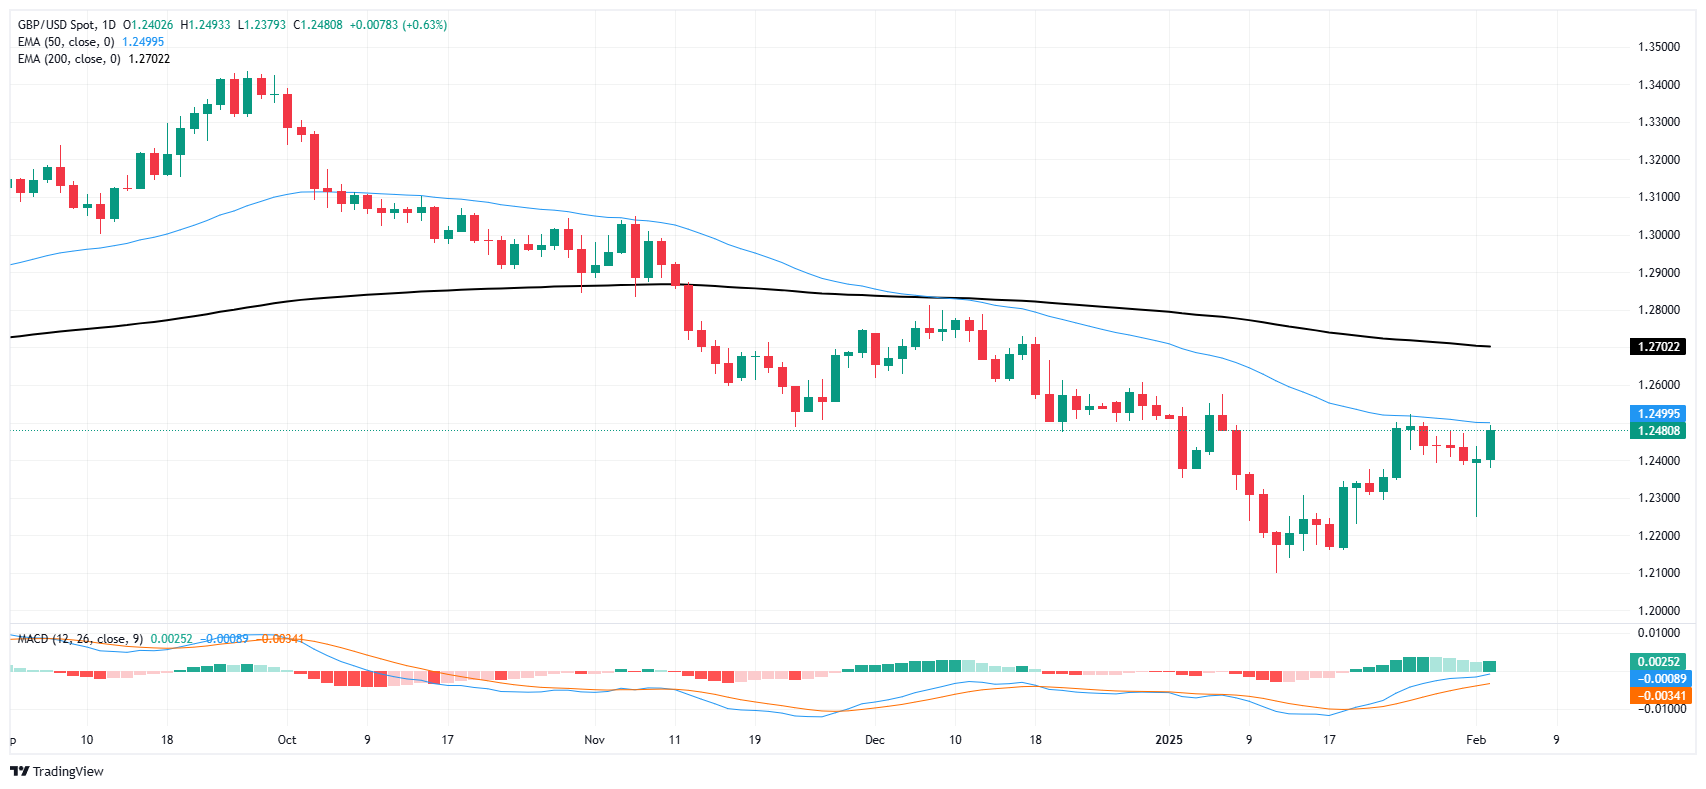
Pound Sterling FAQs
The Pound Sterling (GBP) is the oldest currency in the world (886 AD) and the official currency of the United Kingdom. It is the fourth most traded unit for foreign exchange (FX) in the world, accounting for 12% of all transactions, averaging $630 billion a day, according to 2022 data. Its key trading pairs are GBP/USD, also known as ‘Cable’, which accounts for 11% of FX, GBP/JPY, or the ‘Dragon’ as it is known by traders (3%), and EUR/GBP (2%). The Pound Sterling is issued by the Bank of England (BoE).
The single most important factor influencing the value of the Pound Sterling is monetary policy decided by the Bank of England. The BoE bases its decisions on whether it has achieved its primary goal of “price stability” – a steady inflation rate of around 2%. Its primary tool for achieving this is the adjustment of interest rates. When inflation is too high, the BoE will try to rein it in by raising interest rates, making it more expensive for people and businesses to access credit. This is generally positive for GBP, as higher interest rates make the UK a more attractive place for global investors to park their money. When inflation falls too low it is a sign economic growth is slowing. In this scenario, the BoE will consider lowering interest rates to cheapen credit so businesses will borrow more to invest in growth-generating projects.
Data releases gauge the health of the economy and can impact the value of the Pound Sterling. Indicators such as GDP, Manufacturing and Services PMIs, and employment can all influence the direction of the GBP. A strong economy is good for Sterling. Not only does it attract more foreign investment but it may encourage the BoE to put up interest rates, which will directly strengthen GBP. Otherwise, if economic data is weak, the Pound Sterling is likely to fall.
Another significant data release for the Pound Sterling is the Trade Balance. This indicator measures the difference between what a country earns from its exports and what it spends on imports over a given period. If a country produces highly sought-after exports, its currency will benefit purely from the extra demand created from foreign buyers seeking to purchase these goods. Therefore, a positive net Trade Balance strengthens a currency and vice versa for a negative balance.
-
00:30
Japan Labor Cash Earnings (YoY) above forecasts (3.8%) in December: Actual (4.8%)
-
00:00
South Korea Consumer Price Index Growth (YoY) came in at 2.2%, above expectations (1.97%) in January
-
00:00
South Korea Consumer Price Index Growth (MoM) registered at 0.7% above expectations (0.44%) in January
-