Noticias del mercado
-
23:59
Schedule for today,Friday, Jul 14’2017 (GMT0)
04:30 Japan Industrial Production (YoY) (Finally) May 5.7% 6.8%
04:30 Japan Industrial Production (MoM) (Finally) May 4.0% -3.3%
09:00 Eurozone Trade balance unadjusted May 17.9
12:30 U.S. Retail Sales YoY June 3.8%
12:30 U.S. Retail sales June -0.3% 0.1%
12:30 U.S. Retail sales excluding auto July -0.3% 0.2%
12:30 U.S. CPI excluding food and energy, m/m June 0.1% 0.2%
12:30 U.S. CPI, m/m June -0.1% 0.1%
12:30 U.S. CPI, Y/Y June 1.9% 1.7%
12:30 U.S. CPI excluding food and energy, Y/Y June 1.7% 1.7%
13:15 U.S. Capacity Utilization June 76.6% 76.7%
13:15 U.S. Industrial Production (MoM) June 0% 0.3%
13:15 U.S. Industrial Production YoY June 2.2%
13:30 U.S. FOMC Member Kaplan Speak
14:00 U.S. Reuters/Michigan Consumer Sentiment Index (Preliminary) July 95.1 95
14:00 U.S. Business inventories May -0.2% 0.3%
17:00 U.S. Baker Hughes Oil Rig Count July 763
-
20:00
U.S.: Federal budget , June -90 (forecast -35)
-
16:22
U.S. treasury 2-year, 10-year note yields edge lower after U.S. jobless claims, PPI data
-
16:01
Fed's Yellen says agrees systemic risk remains in housing, suggests reform move forward
-
Agrees could find ways to 'reduce the burden' of Volcker rule
-
-
15:51
Option expiries for today's 10:00 ET NY cut
EURUSD: 1.1200 (EUR 1.3bln) 1.1240 (550m) 1.1300 (730m) 1.1390-00 (890m) 1.1440-50 (1.2bln)
USDJPY:112.55 (590m) 113.20-30 (1.2bln) 113.50-60 (1.1bln) 113.90-00 (700m)
EURGBP: 0.8790 (EUR 240m)
EURJPY: 128.00 (EUR 580m) 128.50 (710m)
AUDUSD: 0.7540 (AUD 475m) 0.7620 (500m) 0.7660 (360m)
USDCAD: 1.2940-50 (1.25bln) 1.3000 (525m) 1.3075 (600m) 1.3200 (1.37bln)
-
14:37
US initial jobless claims in line with expectations last week
In the week ending July 8, the advance figure for seasonally adjusted initial claims was 247,000, a decrease of 3,000 from the previous week's revised level. The previous week's level was revised up by 2,000 from 248,000 to 250,000. The 4-week moving average was 245,750, an increase of 2,250 from the previous week's revised average. The previous week's average was revised up by 500 from 243,000 to 243,500.
-
14:36
Canadian new house price index rose 0.7%
Toronto was the largest contributor to the national gain, rising 1.1% from April to May. Builders linked higher prices to market conditions, a shortage of developed land and higher construction costs.
Prices for new houses in Vancouver rose for a third consecutive month, up 2.2% in May and the largest increase for this census metropolitan area since May 2007. Builders cited favourable market conditions as the main reason for the gain.
Builders in Guelph (+1.7%), London (+1.5%) and St. Catharines-Niagara (+0.9%) also reported market conditions as the primary driver of higher new house prices.
Prices were down in five metropolitan areas and unchanged in nine.
-
14:33
US producer price index little changed in June. Markets driven mostly by profit taking
The Producer Price Index for final demand increased 0.1 percent in June, seasonally adjusted, the U.S. Bureau of Labor Statistics reported today. Final demand prices were unchanged in May and rose 0.5 percent in April. On an unadjusted basis, the final demand index advanced 2.0 percent for the 12 months ended in June.
In June, almost 80 percent of the rise in the final demand index is attributable to prices for final demand services, which increased 0.2 percent. The index for final demand goods edged up 0.1 percent.
Prices for final demand less foods, energy, and trade services increased 0.2 percent in June. For the 12 months ended in June, the index for final demand less foods, energy, and trade services advanced 2.0 percent. -
14:31
Canada: New Housing Price Index, YoY, May 3.8%
-
14:30
U.S.: PPI excluding food and energy, Y/Y, June 1.9% (forecast 2%)
-
14:30
U.S.: Continuing Jobless Claims, 1945 (forecast 1950)
-
14:30
U.S.: PPI, y/y, June 2% (forecast 1.9%)
-
14:30
U.S.: PPI excluding food and energy, m/m, June 0.1% (forecast 0.2%)
-
14:30
U.S.: Initial Jobless Claims, 247 (forecast 245)
-
14:30
U.S.: PPI, m/m, June 0.1% (forecast -0.1%)
-
14:30
Canada: New Housing Price Index, MoM, May 0.7% (forecast 0.3%)
-
13:37
ECB could announce plans to wind down QE at its Sep 7 policy meeting -ECB officials
-
13:09
Spanish trade minister says post-Brexit relations with Britain will not be the same but aim for strong relationship and aim to avoid disruption to trade
-
12:13
British PM May has been clear that wants to work constructively across parliament on Brexit bill, what's most important is delivering will of people - Spokesman says
-
10:40
BoE expect to further tighten standards for credit card and other unsecured lending in Q3
-
Expect decrease in availability of unsecured household credit in q3 due to changing appetite for risk, changing economic outlook
-
Expect credit to corporate sector to remain unchanged in q3
-
Demand for mortgage lending to rise in q3, no change in unsecured lending; demand for borrowing by large companies to fall further in q3
-
Expect slight fall in availability of mortgage lending in q3 driven by declines in high loan-to-value lending
-
-
10:29
IEA says recent price weakness may lead U.S. shale firms to reassess prospects; while output might be gushing, profits are not
-
Global oil demand growth saw dramatic acceleration in q2, revises 2017 growth forecast up 100,000 bpd to 1.4 mln bpd
-
Sees hefty stock draw later in 2017 provided there is strong compliance with OPEC cuts and even if Libya, Nigeria output recovers further
-
Oil stocks fell in may to 266 mln barrels above 5-year average, vs 300 mln in april
-
Crude output rose by 340,000 bpd in june to highest level in 2017 on Saudi, Libyan, Nigerian increase
-
Compliance with cuts 78 pct in june vs 95 pct in may, lowest in 6 months; non-OPEC compliance 82 pct
-
-
09:25
Swiss index of producer and import prices fell by 0.1% in June
The total index of producer and import prices fell by 0.1% in June 2017 compared with the previous month, reaching the level of 99.7 points (December 2015 = 100 basis). The decline is mainly due to lower prices for scrap and wood products. Compared with June 2016, the price level of the total supply of domestic and imported products fell by 0.1 per cent.
This is evident from the figures of the Federal Statistical Office (FSO). The decline in the producer price index compared to the previous month was due in particular to the lower prices for scrap, as well as products for building carpentry and interior construction.
-
09:22
UK Trade Sec Fox: UK Will Look At ‘Bridging Mechanism’ If Needed For Brexit - Bloomberg
-
09:15
Switzerland: Producer & Import Prices, m/m, June -0.1% (forecast 0%)
-
09:15
Switzerland: Producer & Import Prices, y/y, June -0.1% (forecast 0%)
-
08:49
French CPI was stable for the second consecutive month
In June 2017, the Consumer Prices Index (CPI) was stable for the second consecutive month. Seasonally adjusted, it was unchanged too, after a downturn by 0.2% in May. Year on year, consumer prices slowed down slightly (+0.7% after +0.8%).
Over a month, the increase in services prices due to a seasonal rebound in airfares was offset by a drop in energy prices and a downturn in food prices. The prices of manufactured products rose barely over a month, as in the two previous months.
-
08:48
Positive start of trading expected on the main European stock markets: DAX + 0.1%, CAC 40 + 0.1%, FTSE 100 + 0.1%.
-
08:47
France: CPI, y/y, June 0.7% (forecast 0.7%)
-
08:45
France: CPI, m/m, June 0.0% (forecast 0.0%)
-
08:33
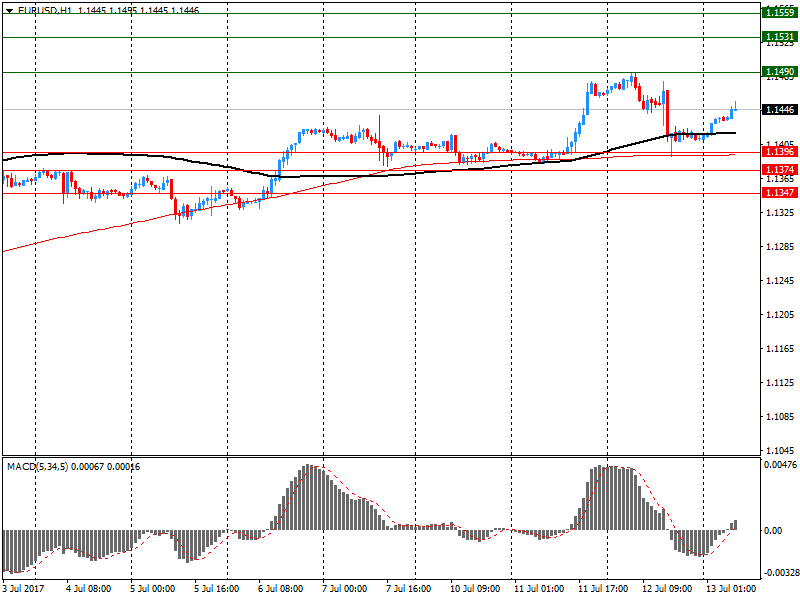
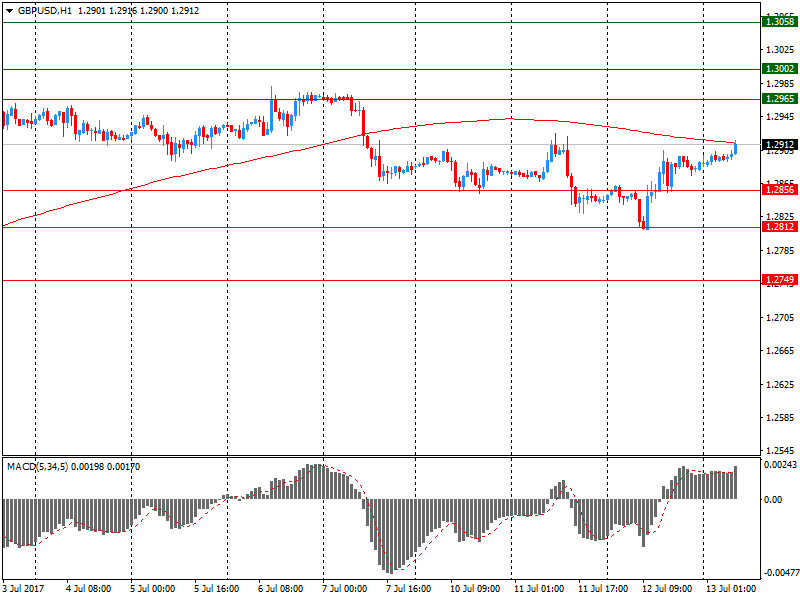
Options levels on thursday, July 13, 2017
EUR/USD
Resistance levels (open interest**, contracts)
$1.1559 (4090)
$1.1531 (2743)
$1.1490 (2974)
Price at time of writing this review: $1.1446
Support levels (open interest**, contracts):
$1.1396 (439)
$1.1374 (1350)
$1.1347 (1795)
Comments:
- Overall open interest on the CALL options and PUT options with the expiration date August, 4 is 62781 contracts (according to data from July, 12) with the maximum number of contracts with strike price $1,1500 (4090);
GBP/USD
Resistance levels (open interest**, contracts)
$1.3058 (2346)
$1.3002 (1690)
$1.2965 (1162)
Price at time of writing this review: $1.2912
Support levels (open interest**, contracts):
$1.2856 (313)
$1.2812 (2018)
$1.2749 (2784)
Comments:
- Overall open interest on the CALL options with the expiration date August, 4 is 24839 contracts, with the maximum number of contracts with strike price $1,3100 (3035);
- Overall open interest on the PUT options with the expiration date August, 4 is 23653 contracts, with the maximum number of contracts with strike price $1,2800 (2784);
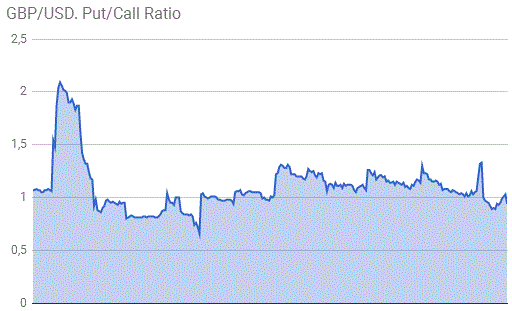
- The ratio of PUT/CALL was 0.95 versus 0.93 from the previous trading day according to data from July, 12
* - The Chicago Mercantile Exchange bulletin (CME) is used for the calculation.
** - Open interest takes into account the total number of option contracts that are open at the moment.
-
08:16
Trump says he spent 20 or 25 minutes with Russia's Putin on election meddling issue: "i said 'did you do it?' and he said 'no'" - Reuters interview
-
08:14
10-year U.S. treasury yield at 2.308 percent vs U.S. close of 2.327 percent on Wednesday
-
08:13
BoE's McCafferty say Bank of England should consider unwinding its 435 billion pound quantitative easing programme earlier than planned - The Times
-
08:11
New Zealand food prices rose 0.2 percent in June
Food prices rose 0.2 percent in the June 2017 month. However, after seasonal adjustment, food prices fell 0.3 percent.
In June 2017 compared with May 2017:
Fruit and vegetable prices fell 0.4 percent (down 6.5 percent after seasonal adjustment).
Meat, poultry, and fish prices rose 1.0 percent.
Grocery food prices fell 0.3 percent (down 0.3 percent after seasonal adjustment).
Non-alcoholic beverage prices rose 1.8 percent.
Restaurant meals and ready-to-eat food prices rose 0.2 percent.
-
08:10
Aussie Consumer Inflationary Expectations rose by 0.8% to 4.4%
The expected inflation rate (30-per-cent trimmed mean measure), reported in the Melbourne Institute Survey of Consumer Inflationary Expectations, rose by 0.8 percentage points to 4.4 per cent in July from 3.6 per cent in June. In June, the weighted proportion of respondents (excluding the 'don't know' category) expecting the inflation rate to fall within the 0-5 per cent range decreased by 3.6 percentage points to 66.4 per cent. The weighted mean of responses within this range rose by 0.2 percentage points to 2.5 per cent.
-
08:08
Chinese trade surplus totaled $42.8 billion in June
China's exports increased at a faster-than-expected pace in June, the General Administration of Customs said Thursday.
In dollar terms, exports grew 11.3 percent year-over-year in June, faster than the 8.9 percent rise economists had forecast.
Similarly, imports surged 17.2 percent in June from a year ago, bigger than the expected growth of 14.5 percent.
The trade surplus totaled $42.8 billion in June versus the expected surplus of $42.6 billion.
-
08:06
Consumer prices in Germany rose by 1.6% in June
Consumer prices in Germany rose by 1.6% in June 2017 compared with June 2016. This means that the inflation rate as measured by the consumer price index was slightly up, following a decrease to 1.5% in May 2017 (April 2017: +2.0%). Compared with May 2017, the consumer price index rose by 0.2% in June 2017. The Federal Statistical Office (Destatis) thus confirms its provisional overall results of 29 June 2017.
In June 2017, the development of energy prices had a downward effect on the overall inflation rate. Compared with the same month a year earlier, Energy prices remained unchanged in June 2017. The increase in energy prices thus slowed again (May 2017: +2.0%; April and March 2017: +5.1% each). The prices of some energy products (for example, electricity: +1.5%; heating oil: +0.9%; motor fuels: +0.2%) were slightly up in June 2017 on a year earlier. Decreases were observed for gas prices (-3.2%) and charges for central and district heating (-1.1%). Excluding energy (total), the inflation rate in June 2017 was +1.8%.
Food prices rose 2.8% from June 2016 to June 2017. The year-on-year increase in food prices thus accelerated again in June 2017 (May 2017: +2.4%; April 2017: +1.8%). In June 2017, prices were up on a year earlier especially for edible fats and oils (+25.9%), especially butter (+59.5%) was much more expensive. For all dairy products, too, consumers had to pay markedly more (+13.2%). Price increases were also recorded, among other things, for fish and fish products (+3.4%) and for meat and meat products (+1.8%), whereas prices were down especially for vegetables (-3.2%).
Excluding energy and food prices, the inflation rate was +1.6% in June 2017.
-
08:01
Germany: CPI, y/y , June 1.6% (forecast 1.6%)
-
08:01
Germany: CPI, m/m, June 0.2% (forecast 0.2%)
-
05:37
China: Trade Balance, bln, June 42.77 (forecast 42.44)
-
03:02
Australia: Consumer Inflation Expectation, July 4.4%
-
00:48
New Zealand: Food Prices Index, y/y, June 0,2%
-
00:17
Currencies. Daily history for Jul 12’2017:
(pare/closed(GMT +2)/change, %)
EUR/USD $1,1412 -0,46%
GBP/USD $1,2890 +0,35%
USD/CHF Chf0,9653 +0,19%
USD/JPY Y113,18 -0,68%
EUR/JPY Y129,17 -1,13%
GBP/JPY Y145,89 -0,33%
AUD/USD $0,7677 +0,55%
NZD/USD $0,7258 +0,51%
USD/CAD C$1,2744 -1,37%
-
00:00
Schedule for today,Thursday, Jul 13’2017 (GMT0)
01:00 Australia Consumer Inflation Expectation July 3.6%
02:00 China Trade Balance, bln June 40.79 42.44
06:00 Germany CPI, m/m (Finally) June -0.2% 0.2%
06:00 Germany CPI, y/y (Finally) June 1.5% 1.6%
06:45 France CPI, y/y (Finally) June 0.8% 0.7%
06:45 France CPI, m/m (Finally) June 0.0% 0.0%
07:15 Switzerland Producer & Import Prices, y/y June 0.1% 0%
07:15 Switzerland Producer & Import Prices, m/m June -0.3% 0%
08:30 United Kingdom BOE Credit Conditions Survey
09:00 U.S. IEA Monthly Report
12:30 Canada New Housing Price Index, MoM May 0.8%
12:30 Canada New Housing Price Index, YoY May 3.9%
12:30 U.S. Continuing Jobless Claims 1956 1950
12:30 U.S. Initial Jobless Claims 248 245
12:30 U.S. PPI excluding food and energy, Y/Y June 2.1% 2%
12:30 U.S. PPI excluding food and energy, m/m June 0.3% 0.2%
12:30 U.S. PPI, m/m June 0% -0.1%
12:30 U.S. PPI, y/y June 2.4% 1.9%
14:00 U.S. Federal Reserve Chair Janet Yellen Testifies
15:30 U.S. FOMC Member Charles Evans Speaks
17:00 U.S. FOMC Member Brainard Speaks
18:00 U.S. Federal budget June -88 -35
22:30 New Zealand Business NZ PMI June 58.5
-


