Noticias del mercado
-
23:47
Fed's Waller: Markets are “way out in front”
Federal Reserve Governor Christopher Waller crossed the wires and said Friday's inflation report was "just one data point," and that markets are "way out in front". This is a theme that is gathering pace in the open as per the following article:
-
US Dollar bulls could start to emerge in the opening sessions
Key quotes
- Will need to see a run of CPI reports to take a foot off the brake.
- Positive that goods prices came down with some moderation in services, but it needs to continue.
- Fed caught "flatfooted" in 2021 when inflation seemed to moderate then "exploded".
- 7.7% cpi inflation is "enormous," fed still has a long way to go, rates will stay high for a while.
- Rates will not fall until there is "clear, strong evidence" inflation is falling.
- Starting to see a little softening in the labor market, but the "shocking part" is that strength that remains after rate increases.
- "Critical" that u.s. gets inflation down and "fairly quickly" if possible.
- So far inflation expectations a couple years out seem to be holding.
- US policy rate is "not that high" given level of inflation.;
- Rate hikes so far has not "broken anything
- The US housing market needed to slow down.
- US housing markets "will be okay".
- US household balance sheets remain in good shape.
- Was always going to be a communications challenge to signal slowdown in the pace of hikes, fed "is not softening".
- Signal was to pay attention to the endpoint not the pace of rate increases, and until inflation slows the endpoint is "a ways out".
- Fed keeping an eye on the balance sheet, don't want to "crush" holdings in a way that will cause problems in markets
- A "benchmark" target may be about 8 to 10 percent of GDP.
US Dollar technical analysis
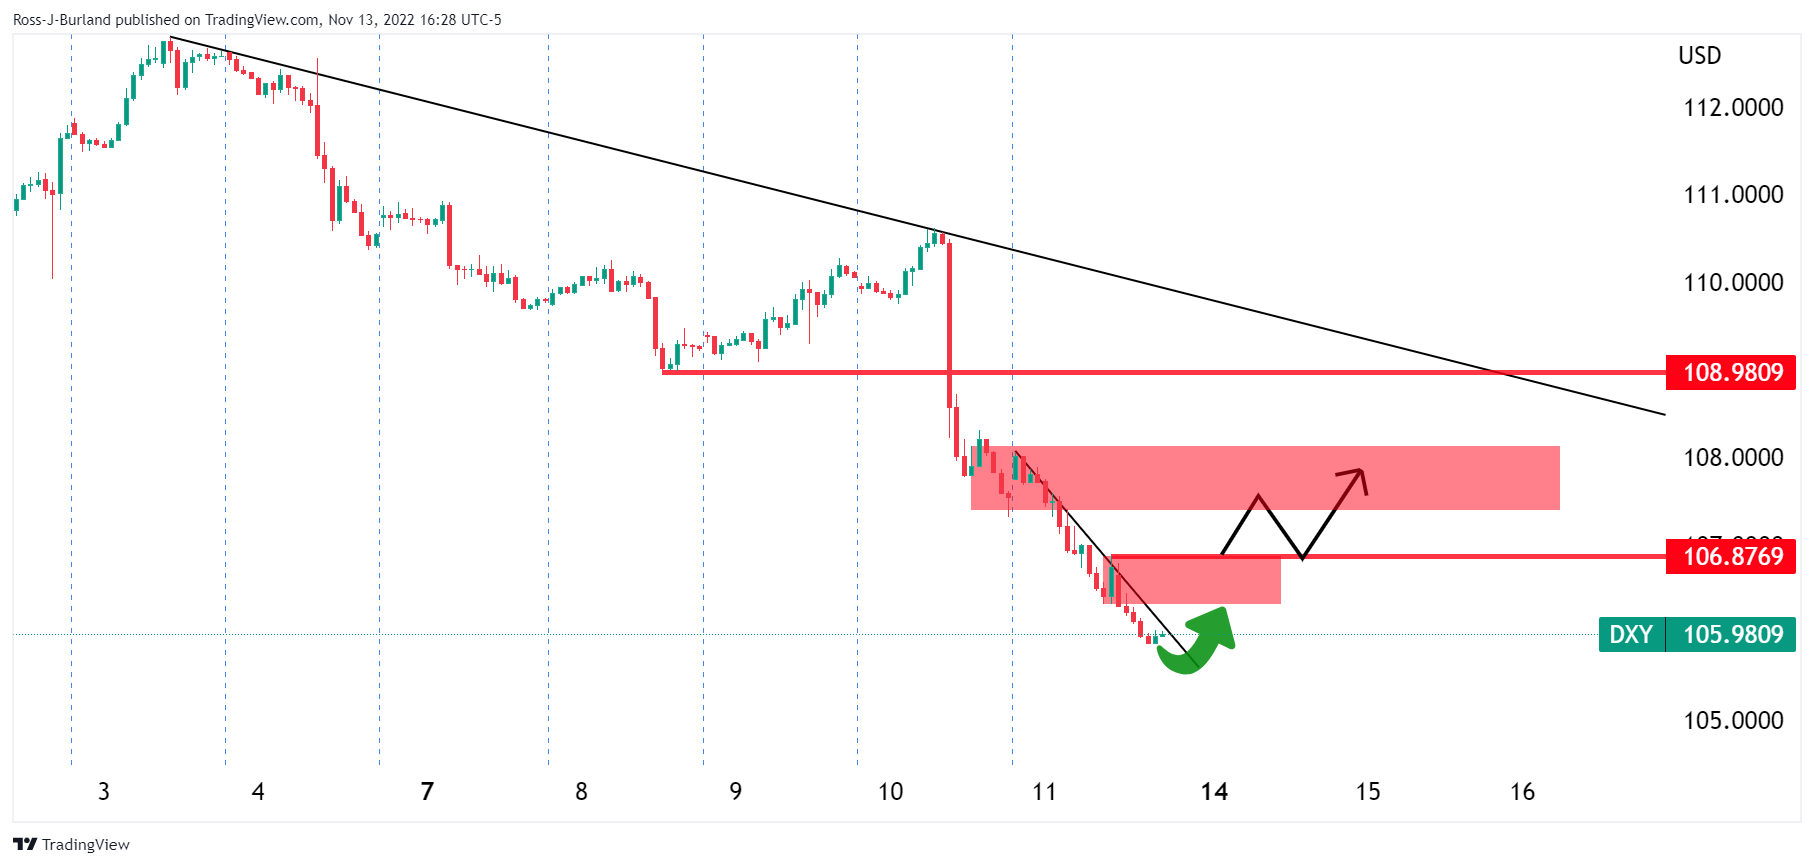
From a 1-hour perspective the bulls will be on the look out for whether there can be a break in the near-term resistance around 106.90.
-
-
23:42
NZDUSD Price Analysis: Pullback remains elusive beyond 0.6020
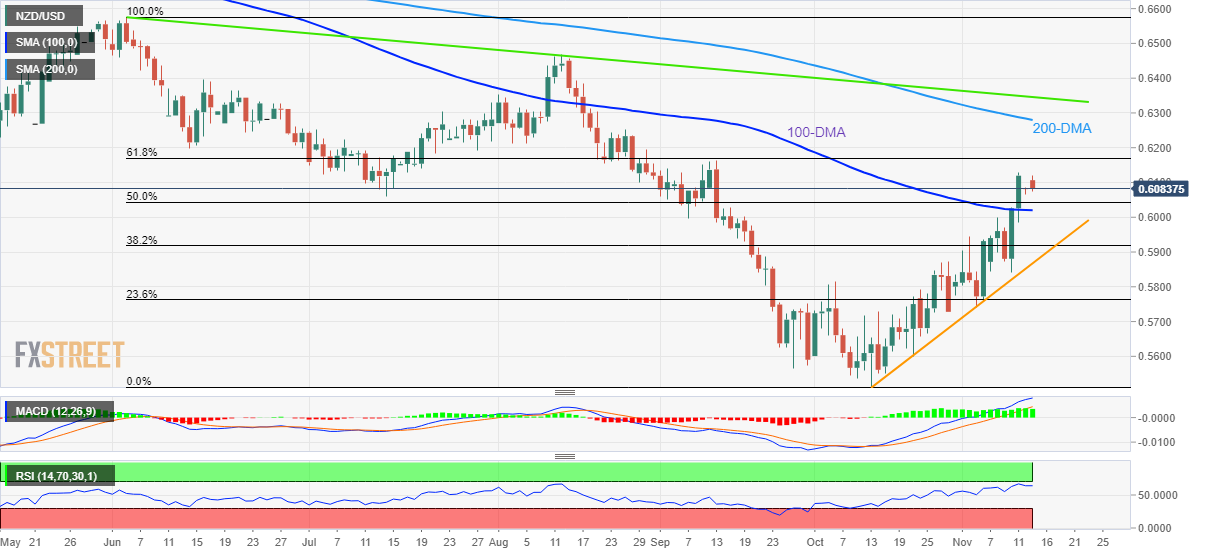
- NZDUSD retreats from a two-month high amid nearly overbought RSI.
- Sustained trading above 100-DMA, bullish MACD signals keep buyers hopeful.
- 61.8% Fibonacci retracement, 200-DMA level challenge further upside.
NZDUSD snaps a two-day uptrend to pare recent gains at the highest levels since September, down 0.80% around 0.6080 during early Monday morning in Asia.
In doing so, the Kiwi pair eases below the 61.8% Fibonacci retracement level of its June-October downside amid nearly overbought conditions of RSI (14).
Even so, NZDUSD defends the previous week’s breakout of the 100-DMA level surrounding 0.6020, which in turn joins the bullish MACD signals to keep the buyers hopeful.
Even if the quote breaks the aforementioned DMA support, a one-month-old ascending support line near 0.5870 and the early October swing high near 0.5815 will act as additional downside filters before welcoming the bears.
Alternatively, the 61.8% Fibonacci retracement level near 0.6170, also known as the Golden Ratio, could restrict the short-term NZDUSD upside.
Following that, tops marked during late August, around 0.6250, will precede the 200-DMA level near 0.6280, which could challenge the NZDUSD pair’s further upside.
Overall, NZDUSD remains on the buyer’s radar unless providing sustained trading below the 100-DMA.
It should be noted that a downward-sloping resistance line from June, close to 0.6350, appears the last defense of the NZDUSD bears.
NZDUSD: Daily chart
Trend: Limited downside expected
-
23:31
Gold Price Forecast: XAUUSD advances towards $1,800 amid a decline in odds for hefty Fed’s rate hike
- Gold price is aiming to capture the $1,800 hurdle amid sheer optimism in the market.
- Economists at Danske Bank are of the view that the risk of persistent inflation has not vanished.
- Wednesday’s Retail Sales data is seen higher at 0.9% despite a decline in the inflation data.
Gold price (XAUUSD) has climbed above the critical resistance of $1,770.00 in the early Tokyo session. The precious metal has become a darling asset for market participants in the past week after the US October inflation report disclosed easing price pressures. The gold prices are set for further rally towards the crucial resistance of $1,800.00 as a decline in the inflationary pressures is promising that the Federal Reserve (Fed) won’t look for hefty rate hikes in its December monetary policy.
Meanwhile, a decline in the US dollar index (DXY) after plummeting US Consumer Confidence has also strengthened the gold’s rally. The sentiment data dropped to 54.7 vs. the projections of 59.5. Going forward, the price action in the US bond market will be keenly watched after an extended weekend.
Contrary to the improved risk appetite due to a decline in the US inflation rate, economists at Danske Bank are of the view that price pressures in the US are set to persist. “While markets have reacted very positively to the October CPI print, we continue to see further risks of more persistent inflation and think it is too early to trade a clear Fed pivot.”
Going forward, Wednesday’s Retail Sales data will remain in the spotlight. The monthly data is seen higher at 0.9% vs. the prior release of 0%. An incline in retail demand in spite of a monthly decline in price pressures indicates solid retail demand by households.
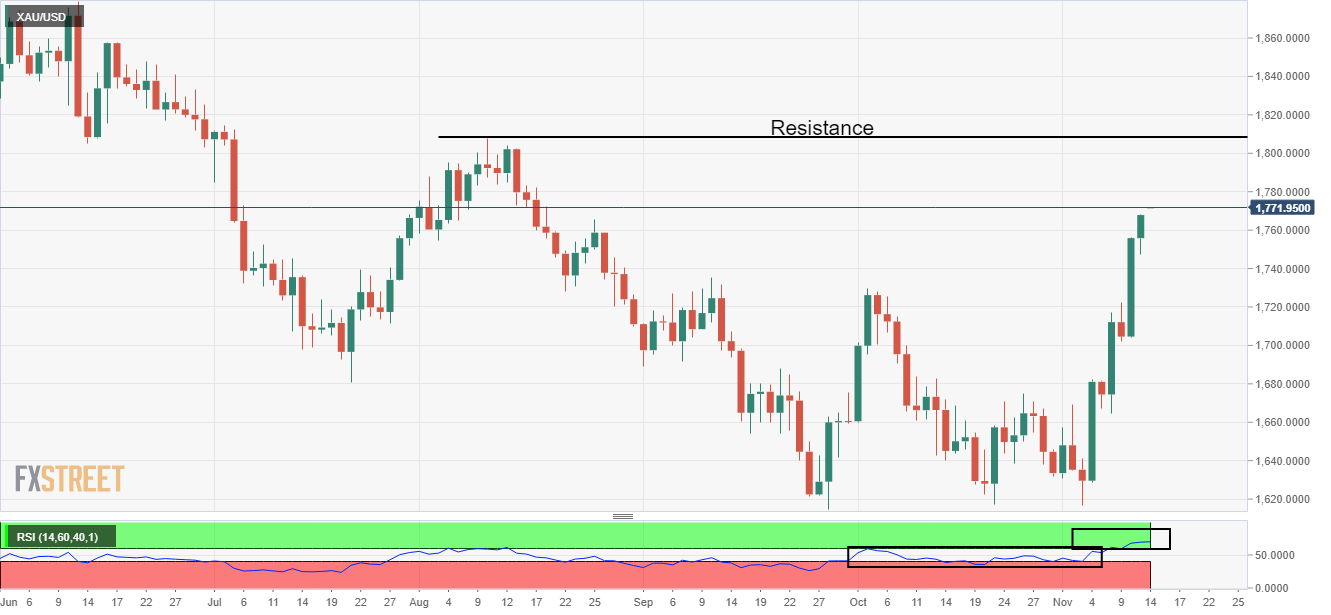
Gold technical analysis
On a daily scale, the gold price is marching towards the horizontal resistance plotted from August 10 high at $1,807.93. The Relative Strength Index (RSI) (14) has shifted into the bullish range of 60.00-80.00, which indicates that the gold bulls are playing the upside momentum.
Gold daily chart
-
23:26
New Zealand Business NZ PSI rose from previous 55.8 to 57.4 in October
-
23:21
GBPUSD retreats towards 1.1750 ahead of key UK data, Autumn Statement
- GBPUSD eases from the highest levels in 11 weeks.
- Chatters over Fed’s pivot risk-on mood previously drowned the US dollar.
- UK’s Chancellor Jeremy Hunt placates fears from upcoming financial bill, BOE Governor Andrew Bailey favored further rate hikes.
- US Retail Sales, UK data dump could help bulls to keep the reins but risk catalysts are more important for clear directions.
GBPUSD begins the key week on a back foot, as it retreats from the highest levels since late August 26 to 1.1775, amid anxiety ahead of crucial data/events. That said, the Cable pair posted the biggest weekly gains since March 2020 in the last amid broad US dollar weakness and optimism surrounding the UK government’s ability to takeout Britain from the recession, despite the short-term pain.
Having witnessed mixed UK data for growth and industrial output on Friday, UK Finance Minister Jeremy Hunt tried to defend his plans for the budget, as most of it includes filling the Great Britain Pound (GBP) 50 billion mismatches in government finances. In doing so, the Tory diplomat turns down the chatters over ending the energy bill while also mentioning that the financial plan will not be all bad news. On Friday, UK Chancellor Hunt said, “I am under no illusion that there is a tough road ahead – one which will require extremely difficult decisions to restore confidence and economic stability.”
Additionally, the preliminary prints of the UK’s Q3 GDP signaled that the British economy contracted by 0.20% QoQ versus -0.50% market consensus and the previous expansion of the 0.20% QoQ figure. It should be noted that the monthly GDP came downbeat to -0.6% MoM for September and other scheduled data from the UK also were mixed, which in turn should have restricted the market's reaction.
Following the data, Bank of England (BOE) policymaker Jonathan Haskel said on Friday that it's important for the monetary policy to stand firm against the risk of persistent inflationary pressure, as reported by Reuters. Further, BOE Governor Andrew Bailey said on Friday, “more increases to interest rates likely in the coming months.”
It should be noted that UK Prime Minister Rishi Sunak’s (PM) academics and the credence among Conservatives join the latest efforts to smoothen Brexit talks to also favor the GBPUSD bulls.
On the other hand, the first readings of the University of Michigan Consumer Confidence Index for November dropped to 54.7 versus 59.5 market expectations and 59.9 previous reading.
Not only the downbeat US data but talks of easing virus controls in China also boosted the risk appetite on Friday and exerted downside pressure on the US dollar. Earlier in the week, the softer US inflation data backed the talks of the Fed’s pivot and drowned the US currency. Recently, Fed Governor Christopher Waller said Fed can begin to consider moving at a slower pace.
Moving on, this week is important for the GBPUSD traders not only because it has the key data like Retail Sales and Consumer Price Index (CPI) for October but also because it will offer the Autumn Statement. Additionally, the Group of 20 Nations (G20) meeting in Bali will be eyed too as the UK and Europe are preparing to snub Russia there.
Given the recent positive sentiment and the talks of easy rate hikes from the US Federal Reserve (Fed), GBPUSD is likely to remain firmer despite the week-start consolidation.
Technical analysis
A daily closing beyond the 100-DMA and a downward sloping trend line from late May, respectively around 1.1660 and 1.1750, directs the GBPUSD buyers towards the late August swing high near 1.1900.
-
22:54
EURUSD sees no barricades till 1.0400, focus shifts to Eurozone GDP data
- EURUSD is advancing towards 1.0400 amid US Inflation-fuelled optimism in the market.
- The US bond market may see roller-coaster moves after an extended weekend.
- Investors will keep an eye on Eurozone GDP data for further cues.
The EURUSD pair is marching towards the round-level resistance of 1.0400 as the current upside momentum doesn’t seem getting exhausted sooner. After a decline in the US Consumer Price Index (CPI) data, the asset has recorded two back-to-back long full-bodied bullish candles, which indicates the strength of the Euro bulls.
Market mood is extremely bullish as S&P500 has reached to near 4,000 levels in no time. Investors believe that the current decline in the US inflation rate is meaningful for a slowdown in the pace of hiking interest rates by the Federal Reserve (Fed). Also, the expectations of a recession situation have trimmed dramatically. Meanwhile, the US dollar index (DXY) has refreshed its three-month low at 106.28 as the risk aversion theme has lost its ground amid optimism in the overall market.
The 10-year US Treasury yields have dropped to 3.8% as chances for a fifth consecutive 75 basis point (bps) rate hike have dropped to a mere 17%, as per the CME FedWatch tool. It is worth noting that the US bond market was closed on Friday on account of Veterans Day. Therefore, power-pack action is expected on Monday.
Apart from that, a marginal increment in US long-term inflation expectations has not made any major impact on the strength of the risk appetite theme. Last week, the University of Michigan reported that five-year consumer inflation expectations have improved to 3.0% from the prior release of 2.9%.
This week, investors will keep an eye on Eurozone’s growth numbers, which are seen on Tuesday. As per the consensus, the annual Gross Domestic Data (GDP) is expected to remain stable at 2.1%. The economy is facing the turbulence of soaring inflation, energy crisis, and supply chain bottlenecks due to Russia-Ukraine tensions. Therefore, stable GDP data might be supportive of the shared currency.
-
22:32
US Dollar bulls could start to emerge in the opening sessions
- US Dollar is meeting a key support area for the open.
- Bulls are lurking on the backside of the hourly trendline.
The US Dollar DXY index broke out of the week's channel between 111.25 and 109.40 in the final two days of the week on the back of the US Consumer Price Index. DXY dropped to a fresh low of 106.28 on Friday, extending the post-CPI dump into a fresh layer of potential support.
O(n Friday, the US Treasury market was closed for the Veterans Day Holiday, but investors cheered a slight softening of China’s COVID restrictions which helped risk assets to run higher, weighing on the greenback as investors favored riskier currencies. DXY was down about 3.8% over two sessions, on pace for its largest two-day percentage loss since March 2009.
For the week ahead, Federal Reserve speakers are likely to push back on the overly dovish market reaction after the October CPI report. This could see the greenback correct as the following analysis will illustrate. ''Officials will make clear that following the positive news on the inflation front, there must be further evidence of sustained monthly core inflation that is more in line with their 2% target,'' analysts at TD Securities argued. ''And given the persistent strength of the labor market, this may take a while.''
US Dollar technical analysis
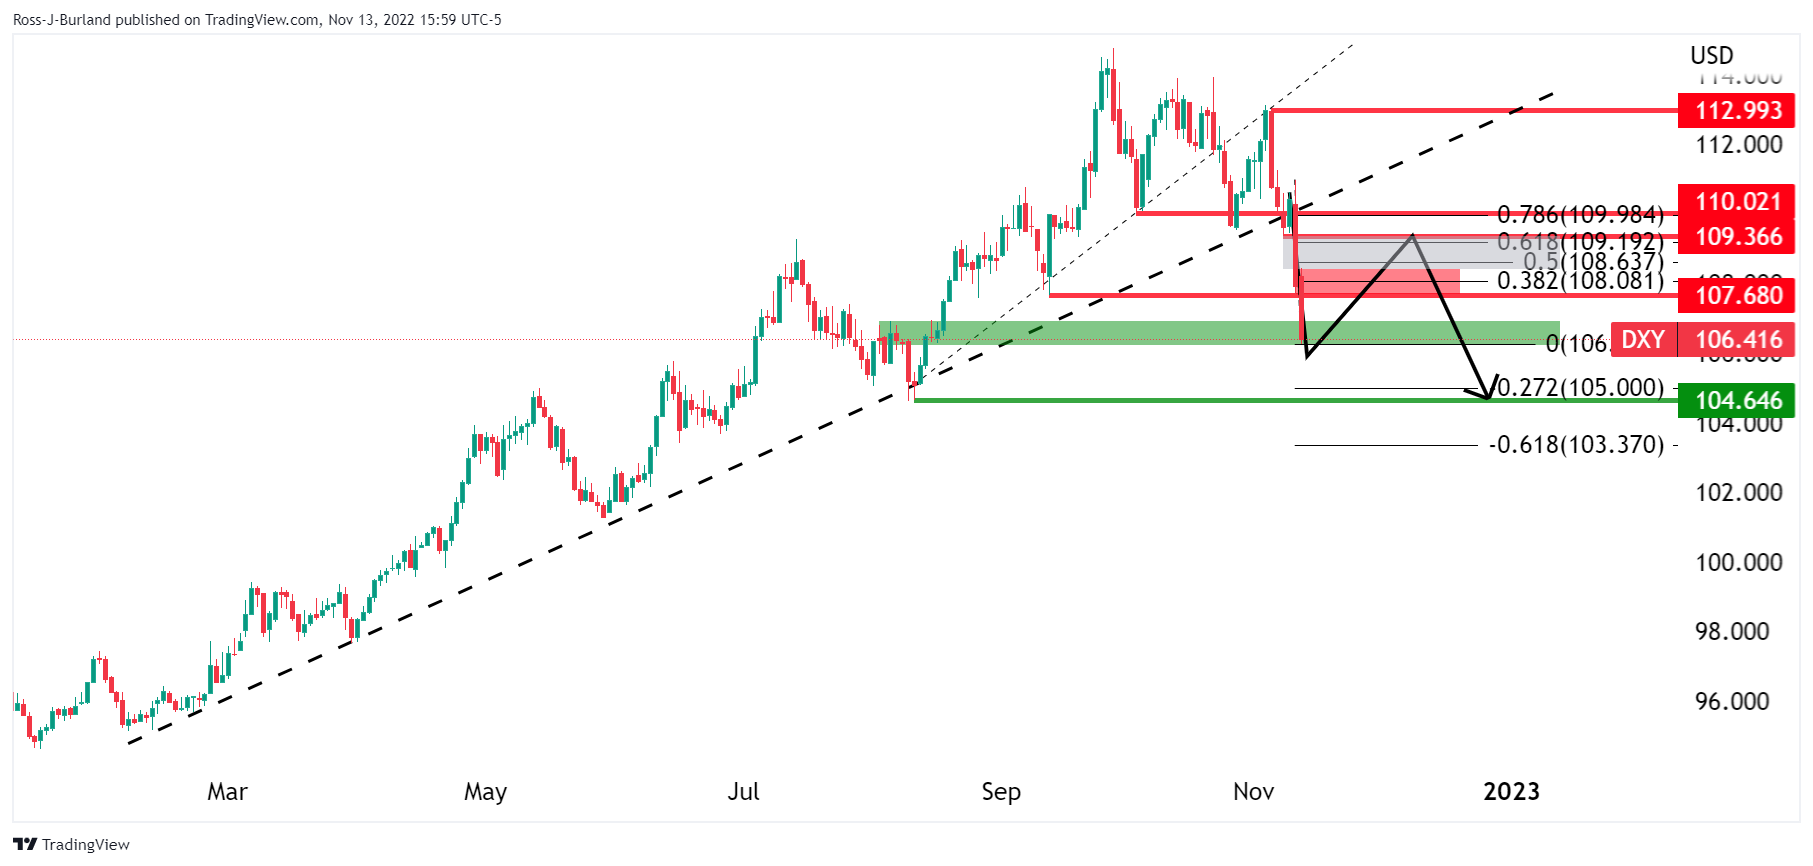
The bears are now meeting support at the lower quarter of the 106 area which could serve as a foundation for a significant correction. A break of 108.00 opens the risk of a prolonged reversion up the Fibonacci scale towards 109.50.
Meanwhile, eyes will be on the lower time frames for confirmation of a deceleration of the downside:

The index remains on the front side of the micro trendline on the hourly trend, so until it breaks through, the downside remains intact.
-
21:38
AUDUSD Price Analysis: A deceleration opens risk of a break to 0.6650 and below
- AUDUSD bears are lurking below 0.6750 for the open.
- 0.6620 and 0.657 are guarding the 0.6550 target area.
As per the prior analysis heading towards the final sessions for the week, AUDUSD Price Analysis: Bears hold the fort at a 50% mean reversion, the price indeed was held off by the bears for a test into the 0.64 figure and a touch below as follows:
AUDUSD prior analysis
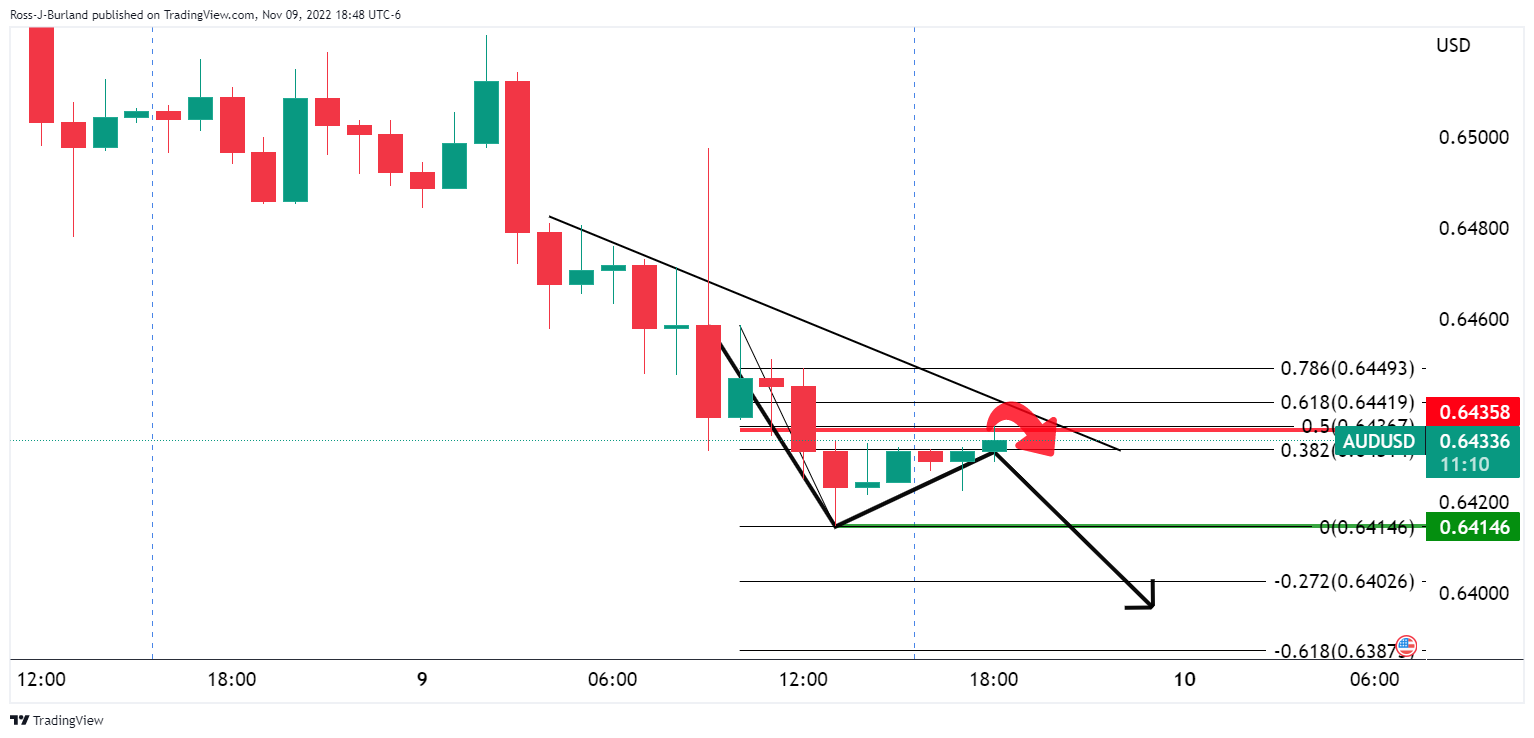
The analysis explained that the bears were still in play on the hourly chart while below the 50% mean reversion level. There were prospects of a downside extension to test 0.6400 the figure as illustrated above, unfolding as follows:
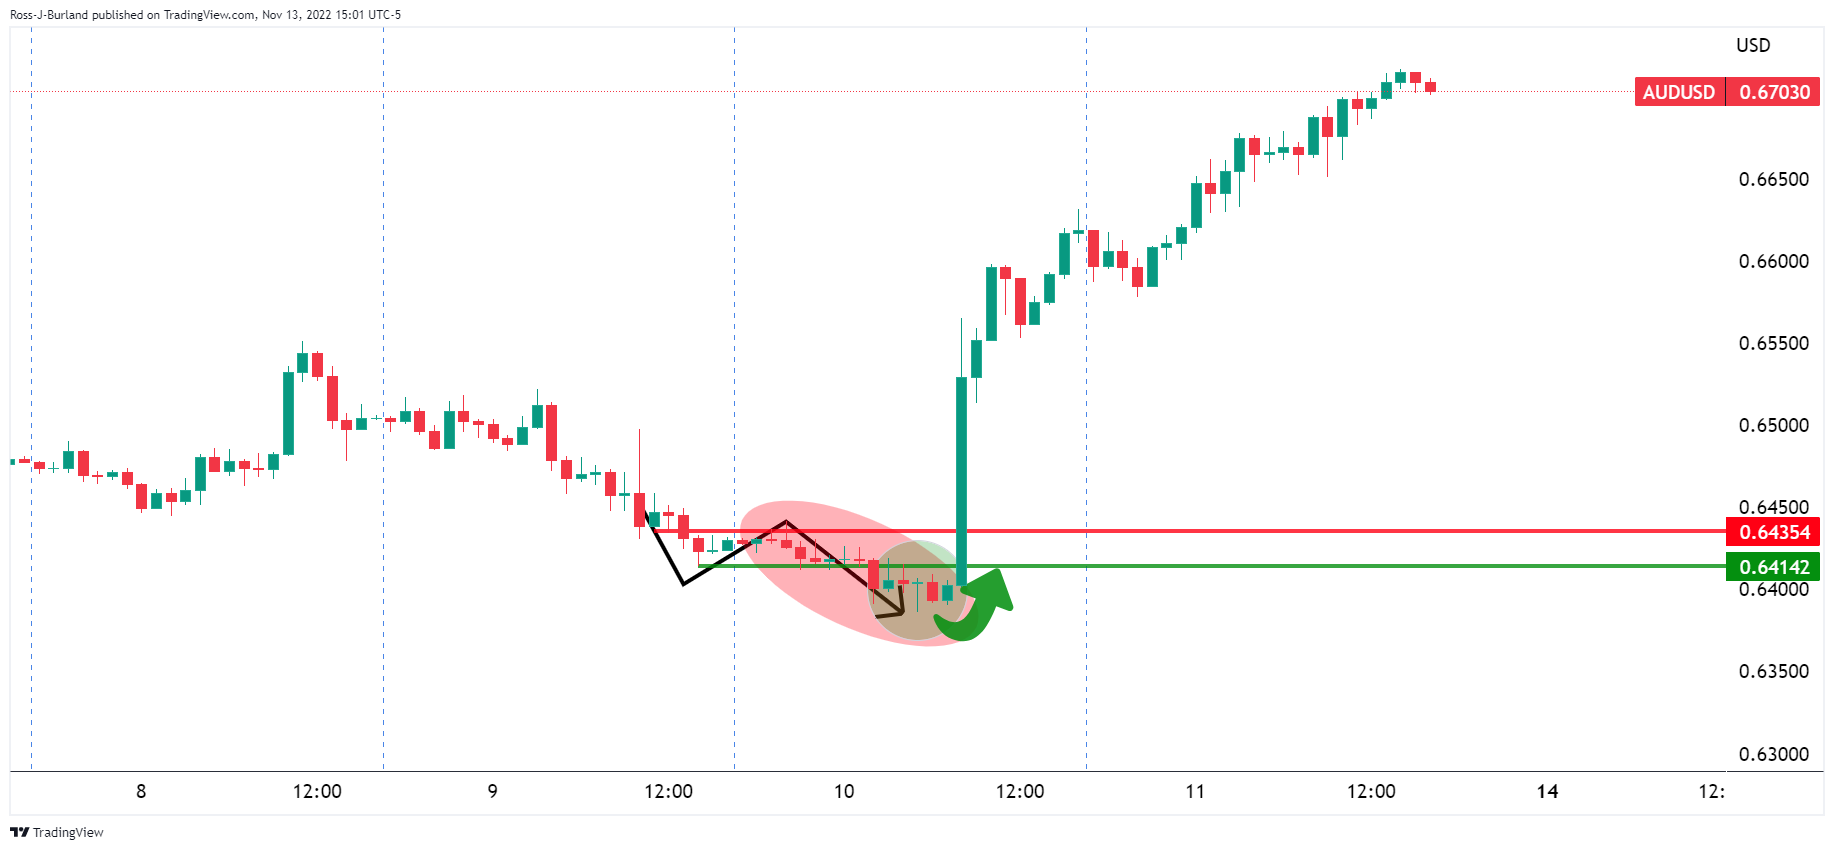
AUDUSD outlook
AUDUSD weekly chart
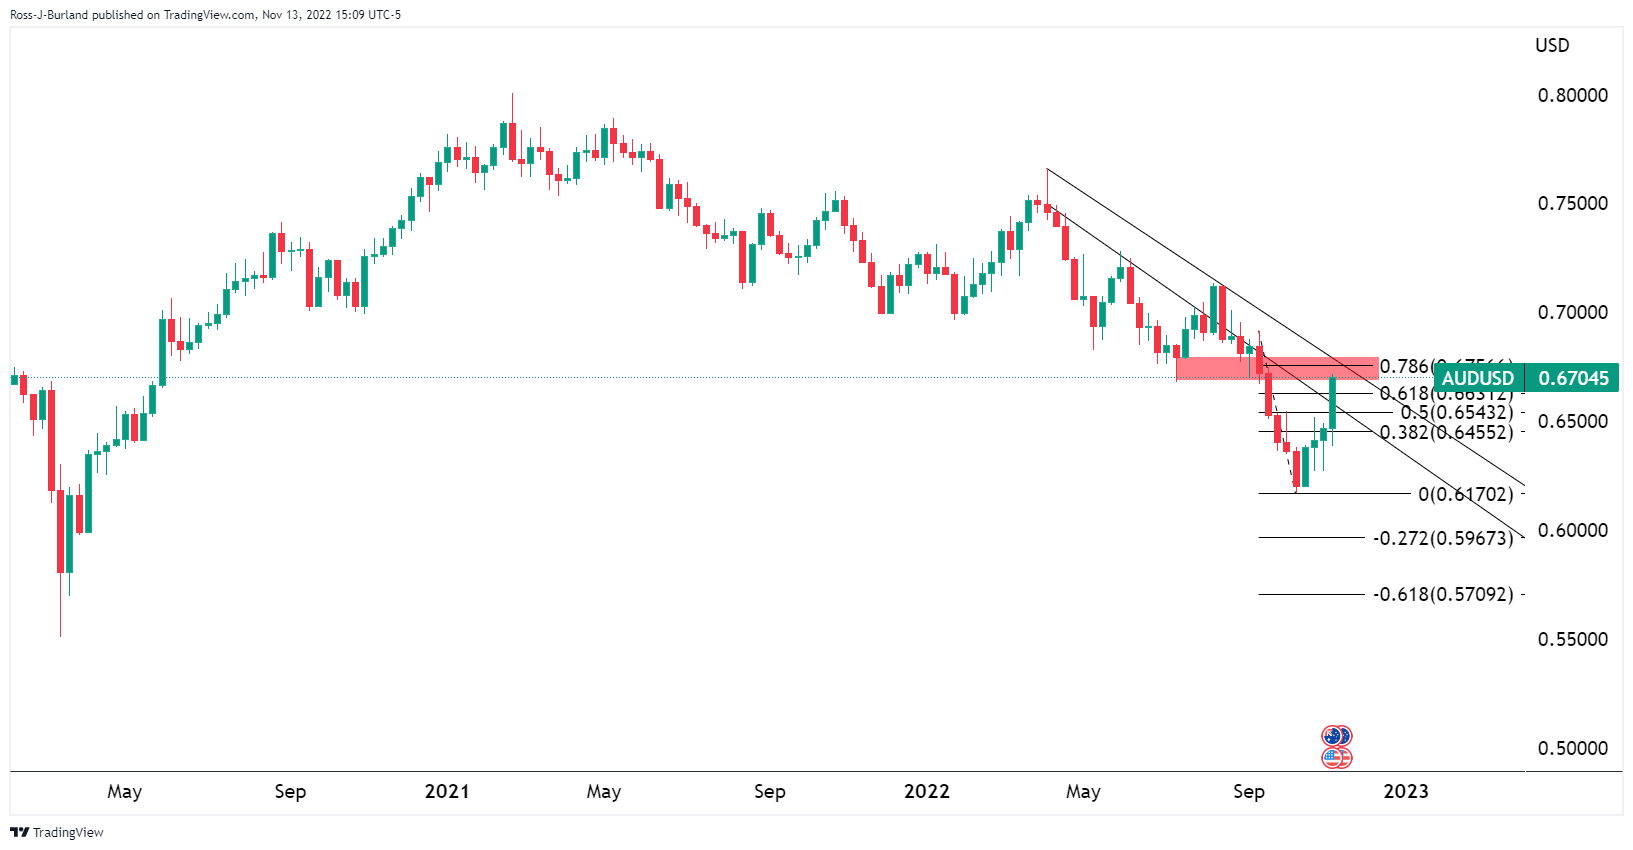
From a weekly perspective, the price is meeting a critical area of resistance and the downside is up for grabs in the open. While there are prospects of a move higher, deeper into the resistance, any deceleration in the correction could be an opportunity for the bears for the opening sessions this week.
AUDUSD daily chart

With the price in resistance, as it stands, a support zone around 0.6550 is eyed as a downside target while on the front side of the bearish trend.
AUDUSD H4 chart
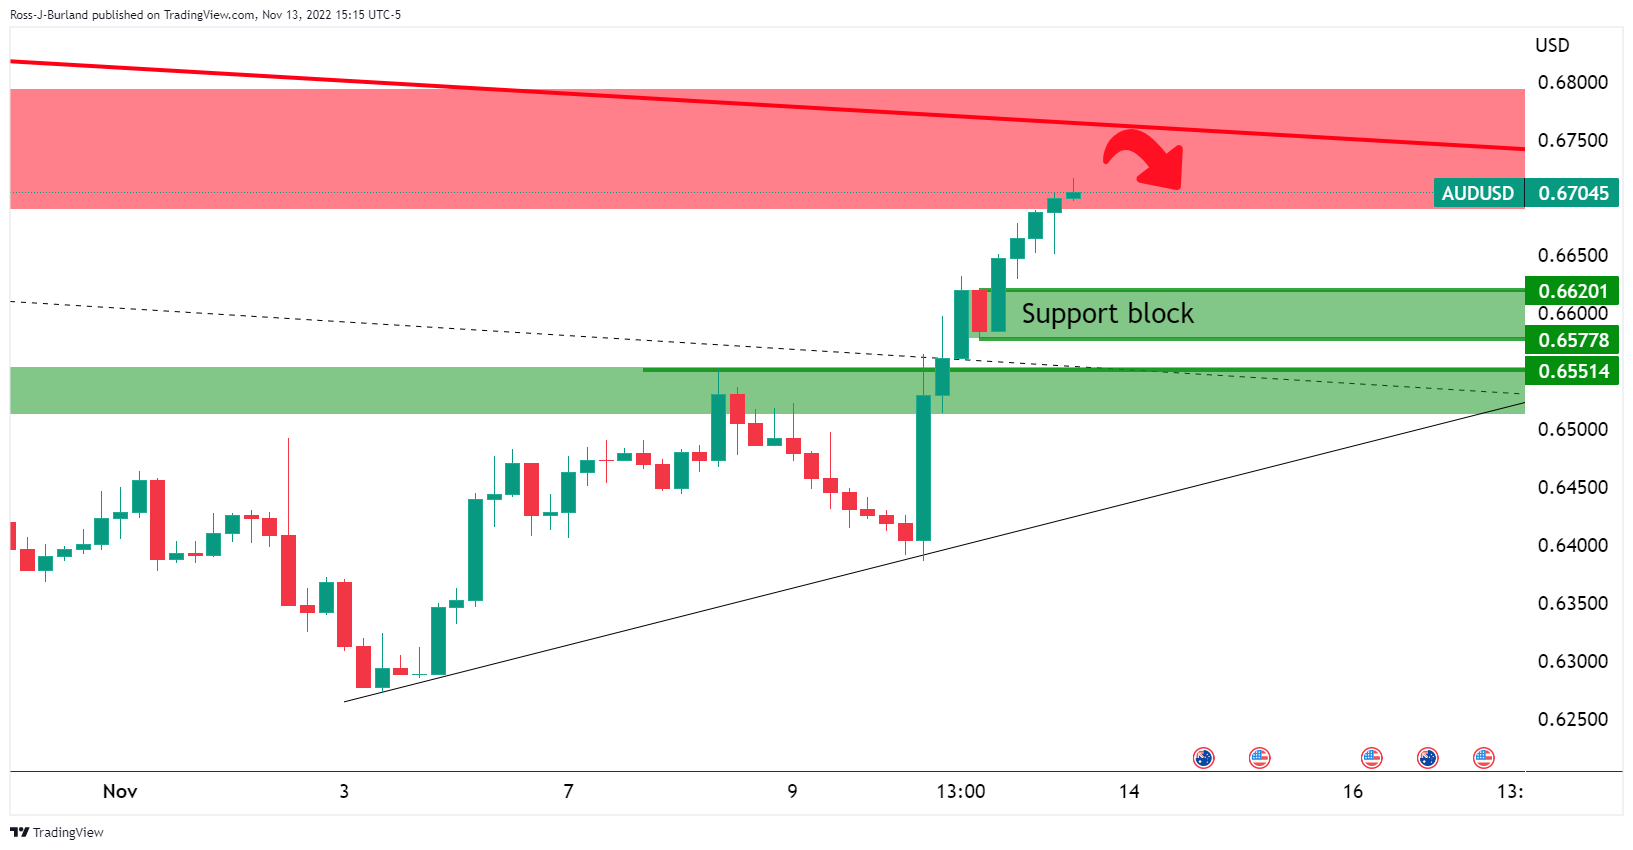
The 4-hour chart shows the support block located at 0.6620 and 0.6577, guarding the 0.6550 target area.
AUDUSD H1 chart
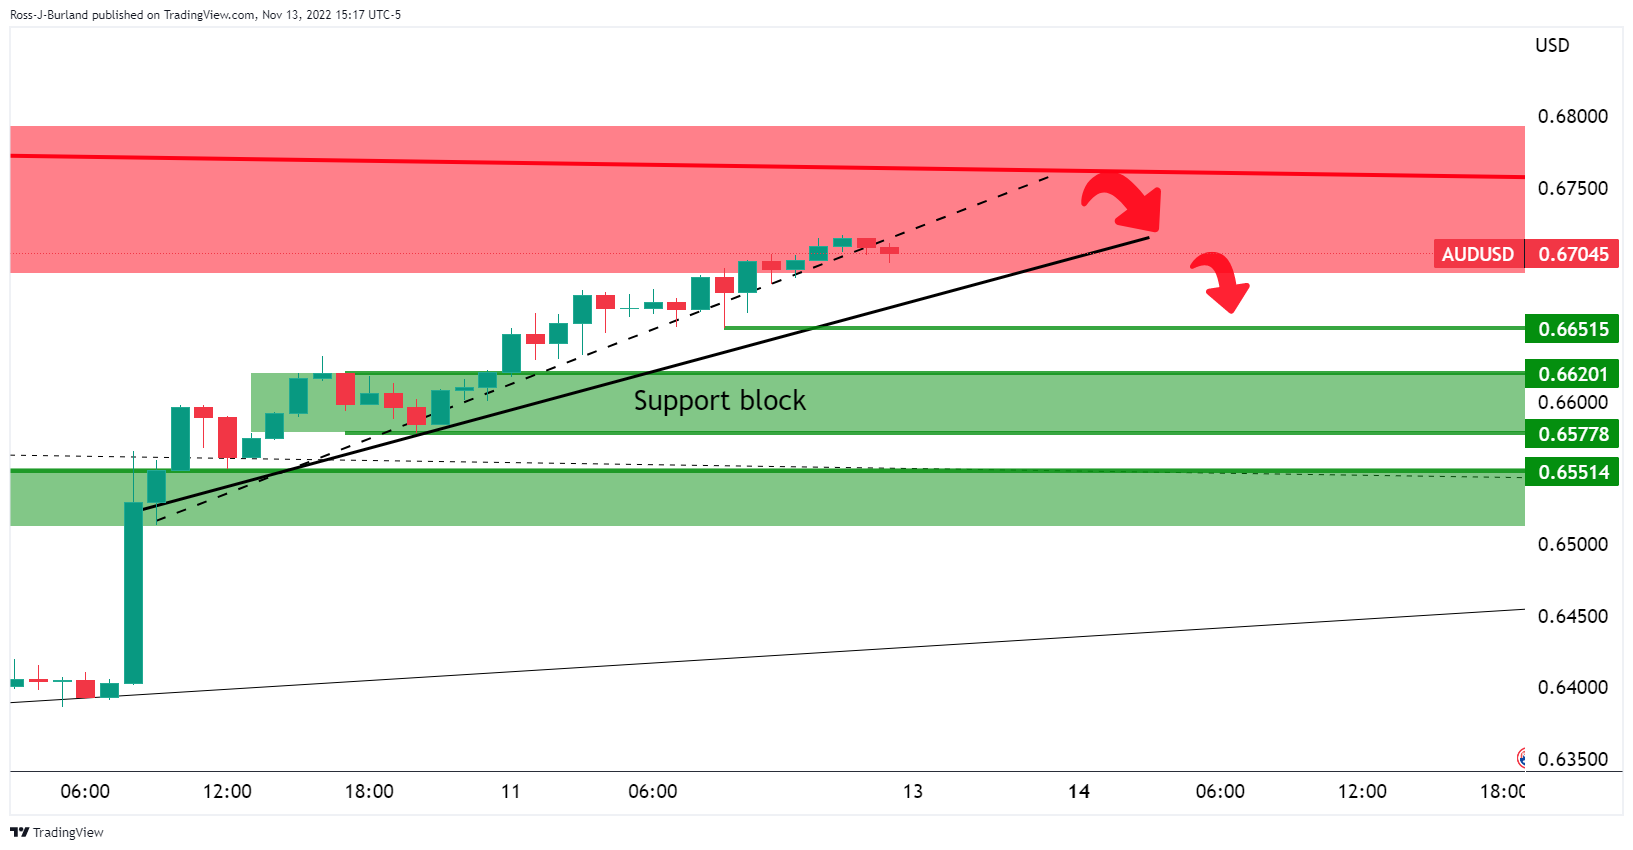
The price is decelerating on the hourly chart on the break of the micro trendline and hourly close below it. However, there is some way to go until the 0.6650s below the next support line, although bears will be lurking in the open this week while the price remains below 0.6750, tempted to face tests above.
-