Noticias del mercado
-
20:00
U.S.: Fed Interest Rate Decision , 1.5% (forecast 1.5%)
-
18:55
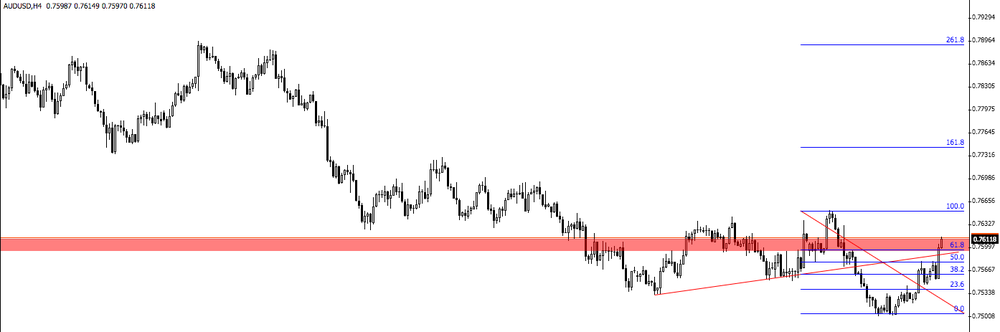
AUD/USD 4-hour time frame chart
AUD/USD has been depreciating on the last few hours.
However, now the price is testing below the upside trend line which might be interesting to go short in this pair.
We would like to remember you that at 19:00 we have news about Federal Funds Rate.
-
16:41
U.S. commercial crude oil inventories decreased by 5.1 million barrels from the previous week
U.S. commercial crude oil inventories (excluding those in the Strategic Petroleum Reserve) decreased by 5.1 million barrels from the previous week. At 443.0 million barrels, U.S. crude oil inventories are in the middle of the average range for this time of year.
Total motor gasoline inventories increased by 5.7 million barrels last week, and are in the upper half of the average range. Both finished gasoline inventories and blending components inventories increased last week. Distillate fuel inventories decreased by 1.4 million barrels last week and are in the lower half of the average range for this time of year. Propane/propylene inventories increased by 0.2 million barrels last week, and are in the middle of the average range. Total commercial petroleum inventories decreased by 2.6 million barrels last week.
-
16:30
U.S.: Crude Oil Inventories, December -5.117 (forecast -3.759)
-
15:27
U.S Federal Reserve expected today to raise the interest rate by 0.25% to 1.50%. Decision at 19:00 GMT, press conference - 19:30 GMT. Buy the rumors sell the news scenario?
-
14:51
Forex option contracts rolling off today at 14.00 GMT:
EURUSD: 1.1650 (EUR 535m) 1.1675 (715m) 1.1700 (1.5bn)1.1750 (990m)1.1800-05 (1.2bn) 1.1825-30 (835m) 1.1845-50 (950m) 1.1870-75 (695m) 1.1890-00 (1.5bn)
USDJPY: 111.00 (USD 915m) 112.00 (850m) 112.40-50 (1.8bn) 112.70 (425m) 113.00-05 (615m) 113.30 (270m) 113.45-50 (1.7bn) 114.00 (965m) 115.00 (1.5bn) 115.50 (520m)
GBPUSD: 1.3300 (GBP 150m) 1.3350 (240m) 1.3400 (220m)
EURGBP: 0.8675 (EUR 420m) 0.8775 (1.3bn) 0.8805-07 (580m)
USDCHF: 0.9900 (USD 120m) 1.0000 (260m)
USDCAD: 1.2680-85 (USD 625m) 1.2810 (155m) 1.2860 (150m)
AUDUSD: 0.7530 (AUD 215m) 0.7600 (155m)
-
14:46
U.S CPI rose less than expected last month
November on a seasonally adjusted basis, the U.S. Bureau of Labor Statistics reported today. Over the last 12 months, the all items index rose 2.2 percent.
The energy index rose 3.9 percent and accounted for about three-fourths of the all items increase. The gasoline index increased 7.3 percent, and the other
energy component indexes also rose. The food index was unchanged in November, with the index for food at home declining slightly.
The index for all items less food and energy increased 0.1 percent in November. The shelter index continued to rise, and the indexes for motor vehicle insurance,used cars and trucks, and new vehicles also increased. The indexes for apparel, airline fares, and household furnishings and operations all declined in November. -
14:30
U.S.: CPI, m/m , November 0.4% (forecast 0.4%)
-
14:30
U.S.: CPI, Y/Y, November 2.2% (forecast 2.2%)
-
14:30
U.S.: CPI excluding food and energy, Y/Y, November 1.7% (forecast 1.8%)
-
14:30
U.S.: CPI excluding food and energy, m/m, November 0.1% (forecast 0.2%)
-
12:54
EUR/USD Analysis - update
EUR/USD is getting close to the support zone which might be interesting to see how the price reacts on that zone.
If the price breaks below the support level then we can expect a strong bearish movement.
Otherwise, if the price starts rejecting the support zone then we might see a slight correction on the price.

-
11:43
BoJ Gov Kuroda: hope Japan's economy remains stable, prices and wages rise gradually next year
-
Flexible mindset becomes increasingly important in guiding monetary policy
-
Japan's economy in "very good shape"
-
Will guide monetary policy appropriately reflecting state of economy
-
-
11:08
Euro area industrial production rose more than expected in October
In October 2017 compared with September 2017, seasonally adjusted industrial production rose by 0.2% in the euro area (EA19) and by 0.3% in the EU28, according to estimates from Eurostat, the statistical office of the European Union. In September 2017, the industrial production fell by 0.5% in both zones. In October 2017 compared with October 2016, industrial production increased by 3.7% in the euro area and by 4.2% in the EU28.
-
11:06
Employment increased by 0.4% in the euro area (EA19) and by 0.3% in the EU28 in Q3
The number of persons employed increased by 0.4% in the euro area (EA19) and by 0.3% in the EU28 in the third quarter of 2017 compared with the previous quarter, according to national accounts estimates published by Eurostat, the statistical office of the European Union. In the second quarter of 2017, employment increased by 0.4% in the euro area and by 0.5% in the EU28. These figures are seasonally adjusted. Compared with the same quarter of the previous year, employment increased by 1.7% in the euro area and by 1.8% in the EU28 in the third quarter of 2017 (after +1.6% and +1.7% respectively in the second quarter of 2017)
-
11:00
Eurozone: Industrial production, (MoM), October 0.2% (forecast 0.0%)
-
11:00
Eurozone: Industrial Production (YoY), October 3.7% (forecast 3.5%)
-
11:00
Eurozone: Employment Change, Quarter III 0.4% (forecast 0.4%)
-
10:35
UK average weekly earnings rose 2.5% in October
Latest estimates show that average weekly earnings for employees in Great Britain in nominal terms (that is, not adjusted for price inflation) increased by 2.5% including bonuses and by 2.3% excluding bonuses, compared with a year earlier.
Latest estimates show that average weekly earnings for employees in Great Britain in real terms (that is, adjusted for price inflation) fell by 0.2% including bonuses, and fell by 0.4% excluding bonuses, compared with a year earlier.
-
10:33
UK unemployment rate up 0.1% vs estimates to 4.3%
Estimates from the Labour Force Survey show that, between May to July 2017 and August to October 2017, the number of people in work fell, the number of unemployed people also fell, and the number of people aged from 16 to 64 not working and not seeking or available to work (economically inactive) increased.
There were 32.08 million people in work, 56,000 fewer than for May to July 2017 but 325,000 more than for a year earlier.
There were 1.43 million unemployed people (people not in work but seeking and available to work), 26,000 fewer than for May to July 2017 and 182,000 fewer than for a year earlier.
The unemployment rate (the proportion of those in work plus those unemployed, that were unemployed) was 4.3%, down from 4.8% for a year earlier and the joint lowest since 1975.
-
10:30
United Kingdom: Average Earnings, 3m/y , October 2.5% (forecast 2.5%)
-
10:30
United Kingdom: Average earnings ex bonuses, 3 m/y, October 2.3% (forecast 2.2%)
-
10:30
United Kingdom: ILO Unemployment Rate, October 4.3% (forecast 4.2%)
-
10:30
United Kingdom: Claimant count , November 5.9 (forecast 3.2)
-
10:18
Italian industrial production rose less than expected in October
In October 2017 the seasonally adjusted industrial production index increased by 0.5% compared with the previous month. The percentage change of the average of the last three months with respect to the previous three months was +0.8.
The calendar adjusted industrial production index increased by 3.1% compared with October 2016 (calendar working days being 22 versus 21 days in October 2016); in the period January-October 2017 the percentage change was +2.9 compared with the same period of 2016.
The unadjusted industrial production index increased by 6.4% compared with October 2016.
-
10:16
Russian deputy foreign minister says Russia welcomes U.S. Tillerson's statement about readiness to hold direct dialogue North Korea - Interfax
-
10:02
Forex option contracts rolling off today at 14.00 GMT:
EUR/USD: 1.1650 (531 m), 1.1675 (707 m), 1.1700 (1.4 b), 1.1750 (990 m), 1.1800-05 (1.1 b), 1.1825-30 (834 m), 1.1845-50 (950 m), 1.1870-75 (692 m), 1.1890-00 (1.4 b)
USD/JPY: 111.00 (915 m), 112.00-12 (842 m), 112.40-50 (1.7 b), 112.68-70 (421 m), 113.00-05 (615 m), 113.30 (270 m), 113.45-50 (1.7 b), 114.00 (965 m), 115.00 (1.4 b), 115.50 (520 m)
GBP/USD: 1.3300 (141 m), 1.3350 (240 m), 1.3400 (216 m)
USD/CHF: 0.9900 (120 m), 1.0000 (256 m)
USD/CAD: 1.2680-85 (621 m), 1.2810 (155 m), 1.2860-61 (150 m)
AUD/USD: 0.7530 (211 m), 0.7600 (153 m)
EUR/GBP: 0.8675 (420 m), 0.8775 (1.3 b), 0.8805-07 (580 m)
-
09:35
Major stock exchanges in Europe trading in the red zone: FTSE 7493.87 -6.54 -0.09%, DAX 13152.60 -30.93 -0.23%, CAC 5413.41 -13.78 -0.25%
-
08:36
Options levels on wednesday, December 13, 2017
EUR/USD
Resistance levels (open interest**, contracts)
$1.1909 (3842)
$1.1861 (1024)
$1.1835 (616)
Price at time of writing this review: $1.1744
Support levels (open interest**, contracts):
$1.1672 (4174)
$1.1632 (3539)
$1.1589 (2170)
Comments:
- Overall open interest on the CALL options and PUT options with the expiration date January, 5 is 92479 contracts (according to data from December, 12) with the maximum number of contracts with strike price $1,1800 (4776);
GBP/USD
Resistance levels (open interest**, contracts)
$1.3483 (2100)
$1.3437 (1430)
$1.3389 (507)
Price at time of writing this review: $1.3325
Support levels (open interest**, contracts):
$1.3259 (1614)
$1.3230 (2413)
$1.3196 (2164)
Comments:
- Overall open interest on the CALL options with the expiration date January, 5 is 30110 contracts, with the maximum number of contracts with strike price $1,3500 (3796);
- Overall open interest on the PUT options with the expiration date January, 5 is 29285 contracts, with the maximum number of contracts with strike price $1,2900 (2426);
- The ratio of PUT/CALL was 0.97 versus 0.97 from the previous trading day according to data from December, 12
* - The Chicago Mercantile Exchange bulletin (CME) is used for the calculation.
** - Open interest takes into account the total number of option contracts that are open at the moment.
-
08:35
U.S. 10-year treasuries yield at 2.399 percent vs U.S. close of 2.403 percent on tuesday
-
08:33
Democrat Doug Jones wins election as U.S. senator from Alabama @ AP
-
08:32
German selling prices in wholesale trade increased by 3.3% y/y
As reported by the Federal Statistical Office (Destatis), the selling prices in wholesale trade increased by 3.3% in November 2017 from the corresponding month of the preceding year. In October 2017 and in September 2017 the annual rates of change were +3.0% and +3.4%, respectively.
From October 2017 to November 2017 the index rose by 0.5%.
-
08:30
German CPI up 0.3% in november
Consumer prices in Germany were 1.8% higher in November 2017 than in November 2016. This means that the inflation rate as measured by the consumer price index was again slightly up, after standing at +1.6% in October 2017 (September and August 2017: +1.8% each). Compared with October 2017, the consumer price index increased by 0.3% in November 2017. The Federal Statistical Office (Destatis) thus confirms its provisional overall results of 29 November 2017.
-
08:00
Germany: CPI, m/m, November 0.3% (forecast 0.3%)
-
08:00
Germany: CPI, y/y , November 1.8% (forecast 1.8%)
-
00:50
Japan: Core Machinery Orders, y/y, October 2.3% (forecast -2.8%)
-
00:50
Japan: Core Machinery Orders, October 5% (forecast 3.0%)
-
00:24
Currencies. Daily history for Dec 12’2017:
(pare/closed(GMT +3)/change, %)
EUR/USD $1,1740 -0,24%
GBP/USD $1,3316 -0,17%
USD/CHF Chf0,99133 -0,06%
USD/JPY Y113,54 0,00%
EUR/JPY Y133,31 -0,24%
GBP/JPY Y151,198 -0,18%
AUD/USD $0,7557 +0,42%
NZD/USD $0,6932 +0,34%
USD/CAD C$1,28647 +0,08%
-