Noticias del mercado
-
00:38
NZD/USD Price Analysis: Bulls struggle to hold gains, Kiwi outlook turns negative
- Kiwi tallies a three-day losing streak, end the week on a negative note with the pair stabilizing at 0.6115.
- NZD/USD outlook continues to skew bearish as bulls fail to maintain upward traction.
- Bucking the bearish trend, a break above 0.6150, the position of the 20-day SMA, is vital.
On Friday, the NZD/USD extended its losing streak to three days. Despite an attempt to rally which took the pair to a high of 0.6140, the bulls were unable to return to the positive side and the pair stabilized at 0.6115 The unsuccessful attempt to maintain gains solidifies the increasing bearish sentiment for the Kiwi. The currency pair must climb past the 20-day Simple Moving Average (SMA) situated at 0.6150 to brighten the otherwise negative outlook.
The Relative Strength Index (RSI) for the NZD/USD pair on the daily chart locates at 49, hinting at a shift of momentum towards more bearishness. Despite this downward shift, the RSI remains near the neutral zone. Furthermore, the Moving Average Convergence Divergence (MACD) continues to increase its red bars, indicating an amplified seller presence in the market.
NZD/USD daily chart
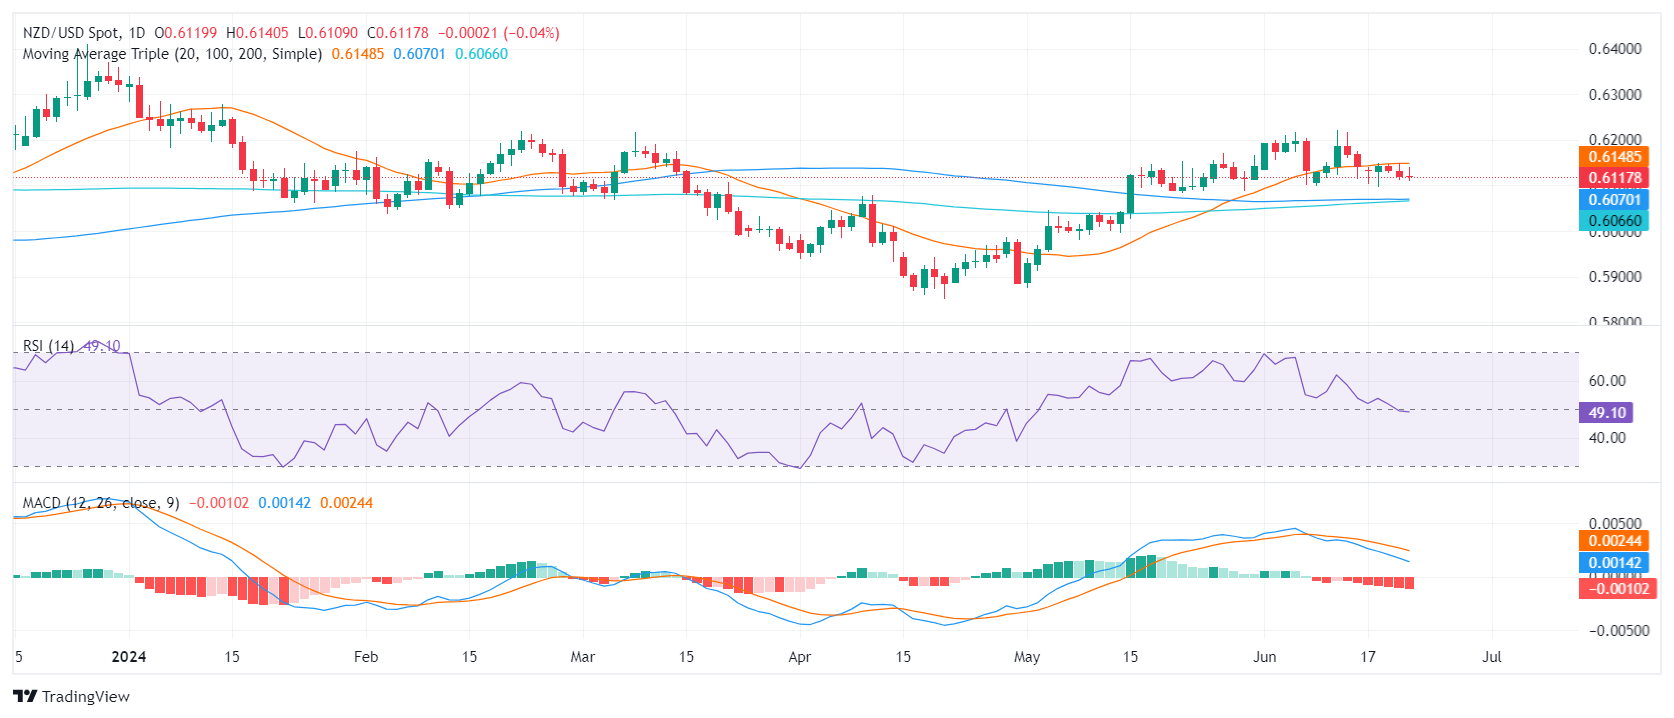
The NZD/USD finds immediate support near the 0.6100 level. Beneath that, additional support resides at the 100-day SMA at 0.6070 and the 200-day SMA at 0.6060. These levels could offer a robust defense should the pair extend its downside. A breach below these SMA convergence points might signal an intensifying sell-off scenario.
Conversely, the first resistance remains around the 20-day SMA level at 0.6150. Higher resistances are found at the 0.6170 and 0.6200 levels. A decisive breakout above these levels could possibly indicate an end to the current bearish market sentiment and start to favor the bulls.
-
00:11
Silver Price Analysis: XAG/USD sinks below $30.00 as bearish-engulfing pattern looms
- Silver declines 3.86% sparked by firm US Treasury yields and a strong US Dollar.
- Technical outlook shows a bearish engulfing pattern with RSI turning bearish, indicating potential further losses.
- Key support levels: 50-DMA at $29.09, $29.00, and MTD low of $28.66, with deeper support at 100-DMA of $26.60.
- Key resistance levels: June 7 high at $31.54, $32.00, and YTD high of $32.51.
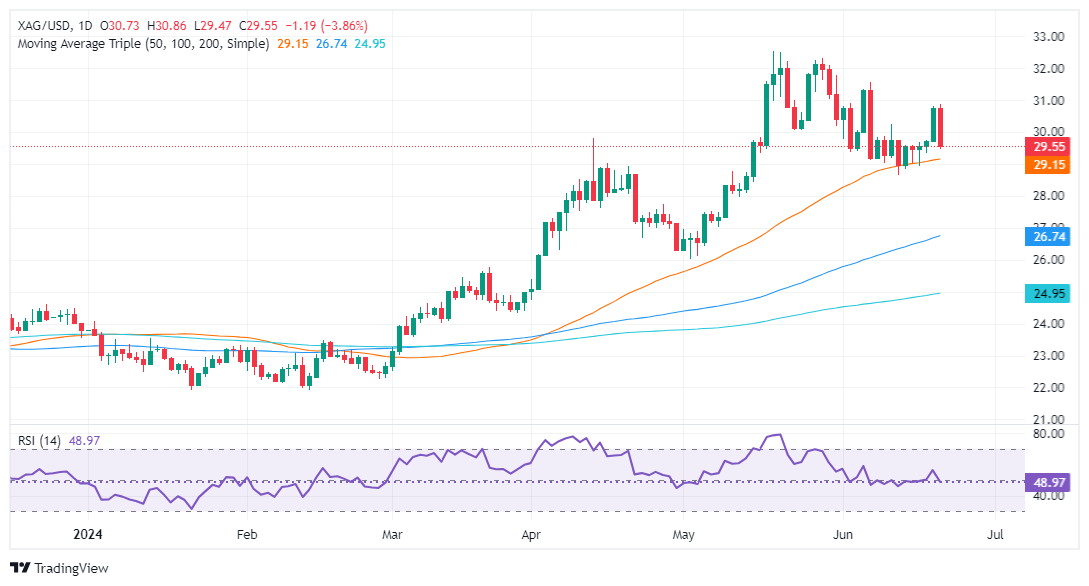
Silver price dropped sharply and snapped two days of gains amid firm US Treasury bond yields and a strong US Dollar. The grey metal trades at $29.53 , down 3.86%
XAG/USD Price Analysis: Technical outlook
Silver is still bullish biased though joining today and yesterday price action completed a ‘bearish engulfing,’ chart pattern. Momentum shifted in sellers’ favor as the Relative Strength Index (RSI) turned bearish and opened the door for further losses.
That said, XAG/USD's first support would be the 50-day moving average (DMA) at $29.09; it will expose $29.00. Breaching this level could lead to the MTD low of $28.66, ahead of a potential drop towards the 100-DMA at $26.60.
On the flip side, if XAG/USD resumes its uptrend, the next resistance level is the June 7 high of $31.54. Clearing this level would target $32.00 before challenging the year-to-date (YTD) high of $32.51.
XAG/USD Price Action – Daily Chart
-