Noticias del mercado
-
23:31
EUR/USD Price Analysis: Bears in the market and eye break of 1.0909
- EUR/USD is on the verge of a breakout.
- EUR/USD bears on the backside of the bullish trend.
EUR/USD has moved to the backside of the bullish trend and below 1.0990 which is now acting as a resistance structure.
EUR/USD weekly chart
The weekly chart shows that the price is pausing at a longer-term resistance area:
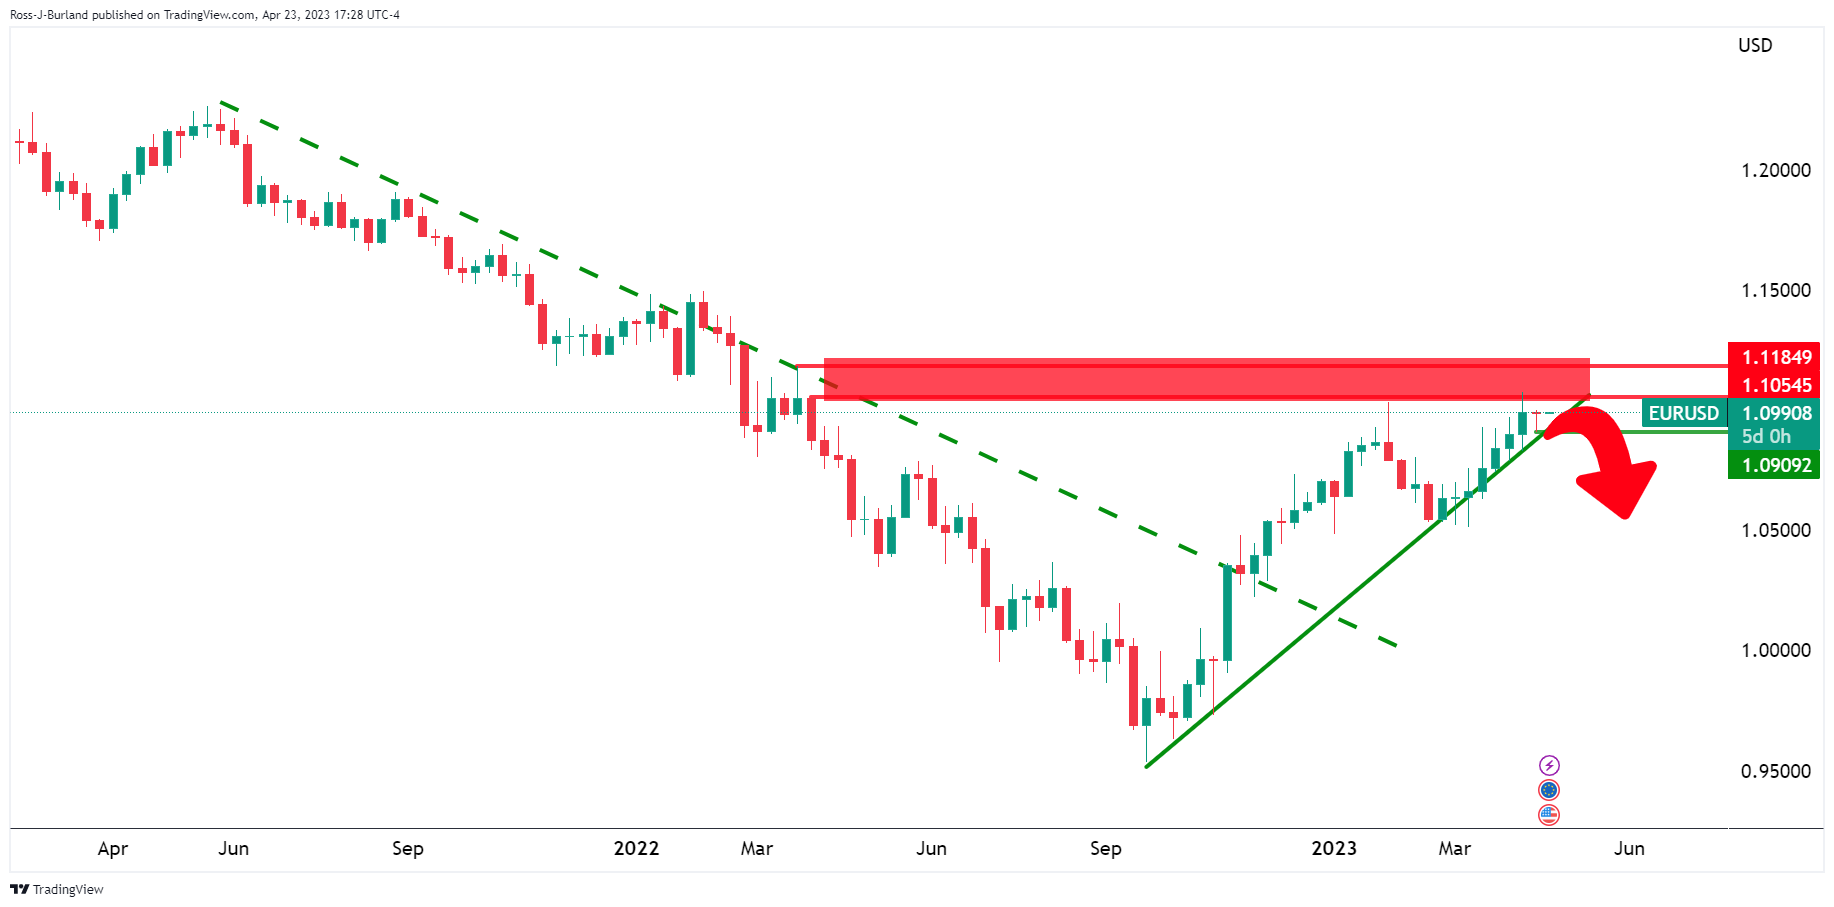
The following is a daily and lower timeframe analysis that illustrates the prospects of a move to test 1.0909 and the 1.0830s for the week ahead.
EUR/USD daily chart
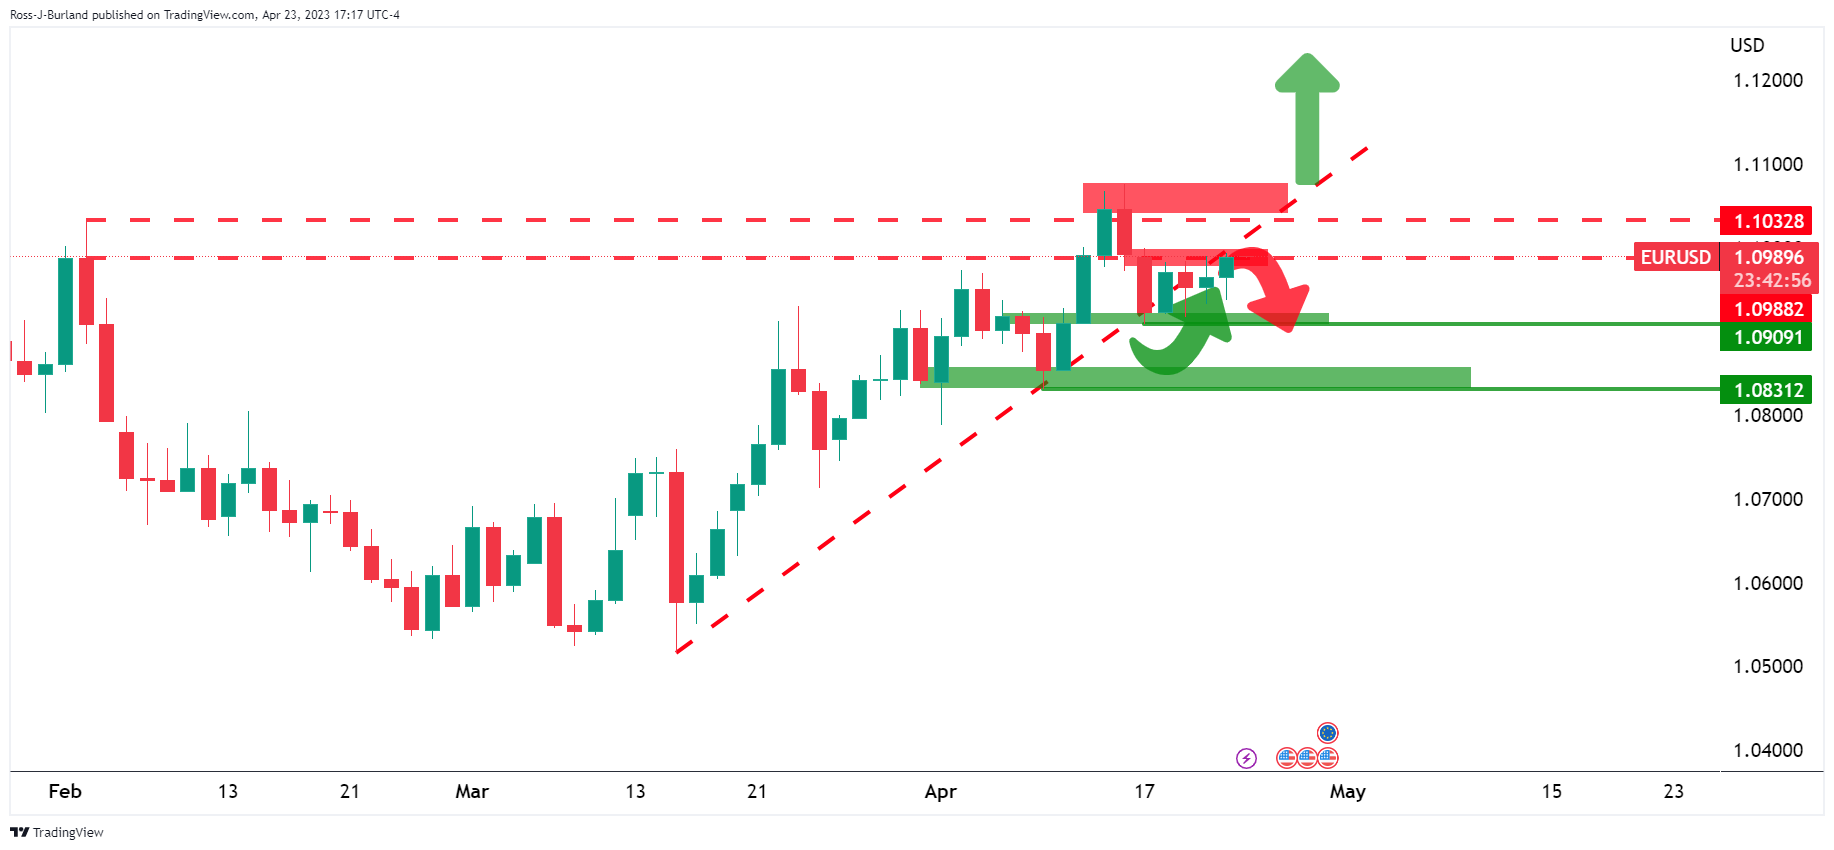
If the bears stay committed to the move below 1.1000 and to the back side of the bullish trend, then a break of 1.0910 opens the risk for lower levels:
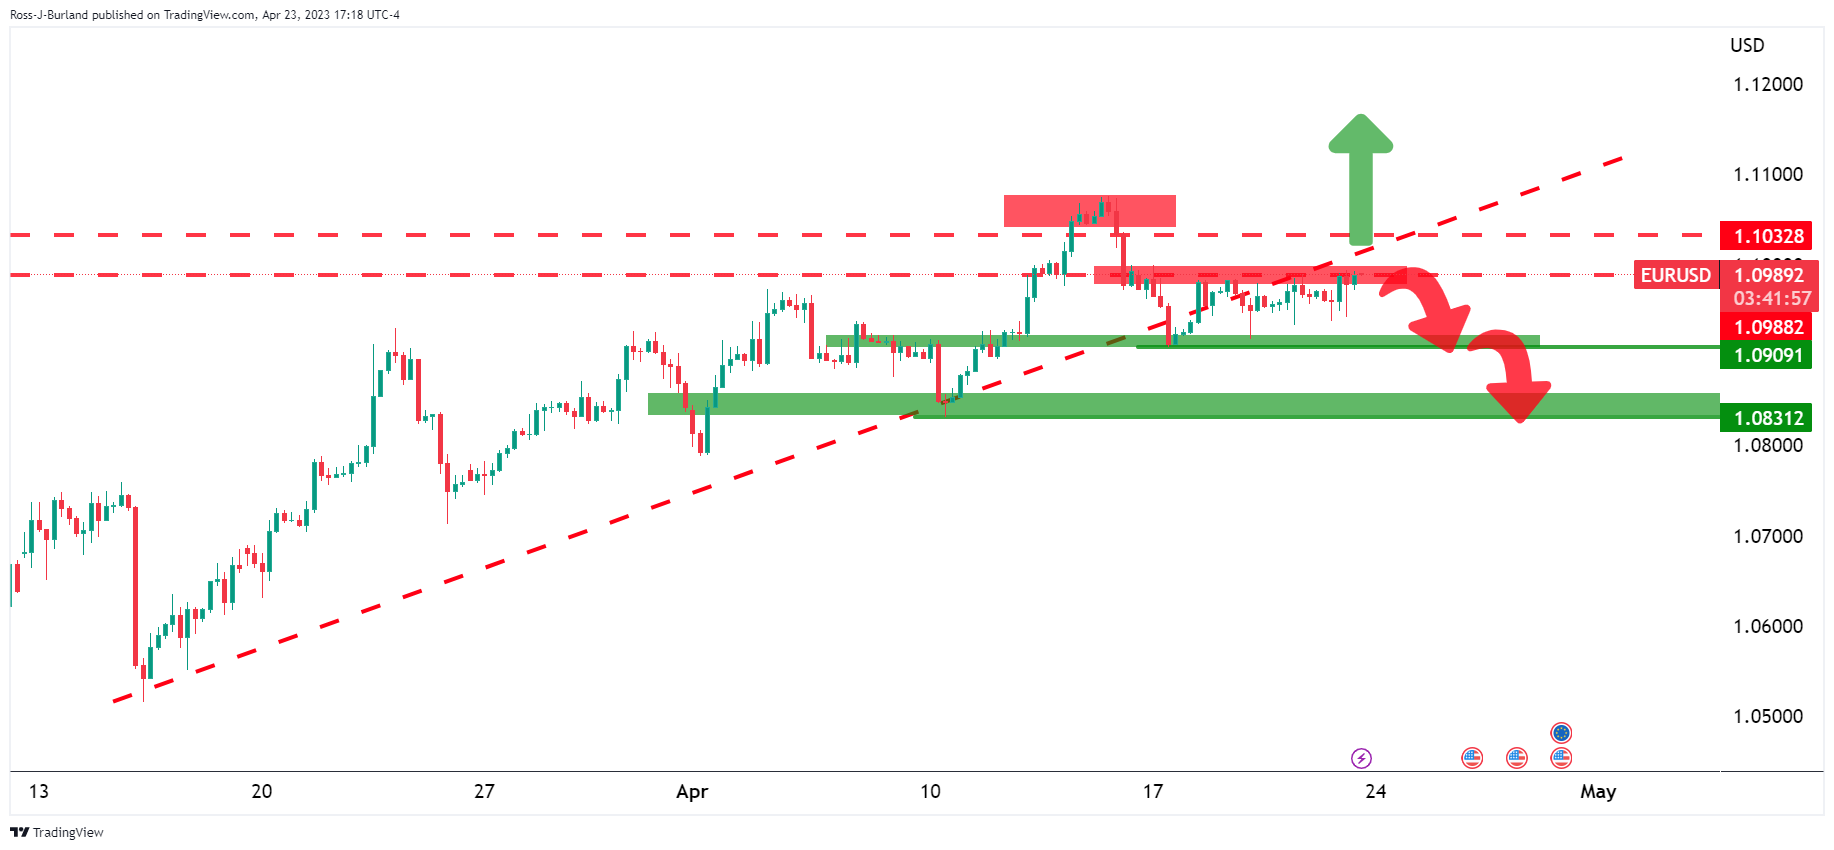
The 4-hour chart shows that the bulls are attempting to take back control and a break of 1.1090 and 1.1030 will possibly see further demand for higher to come.
-
22:45
EU said to get ready a ban on many goods passing through Russia
The EU is said to get ready a ban on many goods passing through Russia.
Meanwhile, it is reported that Russian troops are concentrating their efforts on conducting offensives toward Bakhmut, Avdiivka, and Marinka in Donetsk Oblast. Ukrainian troops repelled 58 Russian attacks in those directions on April 22, according to the military.
-
22:20
BoJ plans to examine its policy taken over past decades
The Sankei newspaper reported Sunday that the Bank of Japan is planning to review and inspect policies taken over the past decades, kicking off discussions at a two-day meeting scheduled for April 27 and 28 under newly-appointed Governor Kazuo Ueda.
Sankei reported that the BOJ will examine the reasons undergirding Japan’s stagnant economy so the central bank can come up with effective policies under Ueda.
Earlier this month, Ueda said he was open to the idea of a longer-term policy review.
-
22:19
AUD/USD Price Analysis: Bears aligned below 0.6710
- AUD/USD bears are in the market and price is offered below 0.6710.
- Bears seeking a break in support structure.
AUD/USD has been under pressure over the course of the past few days, despite a strong Australian labour market report for March and the resultant boost in expectations that the RBA may hike rates again as soon as early May. The US Dollar has been firmer, however, as this is seeing to an offer in the pair as the following illustrates:
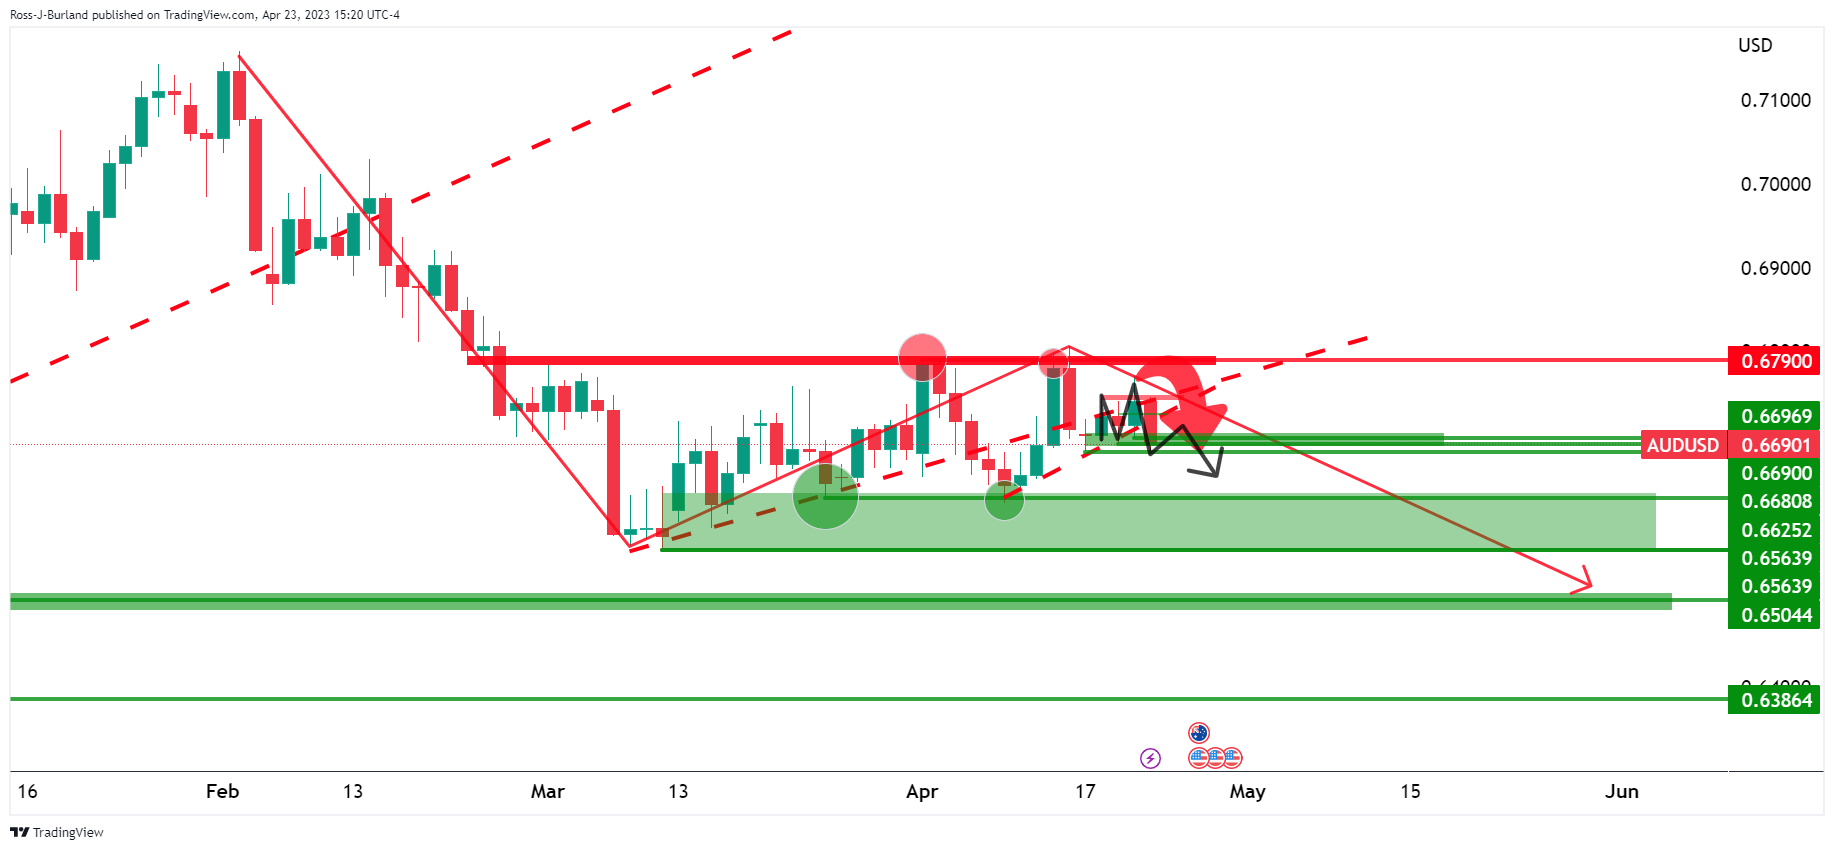
AUD/USD weekly chart
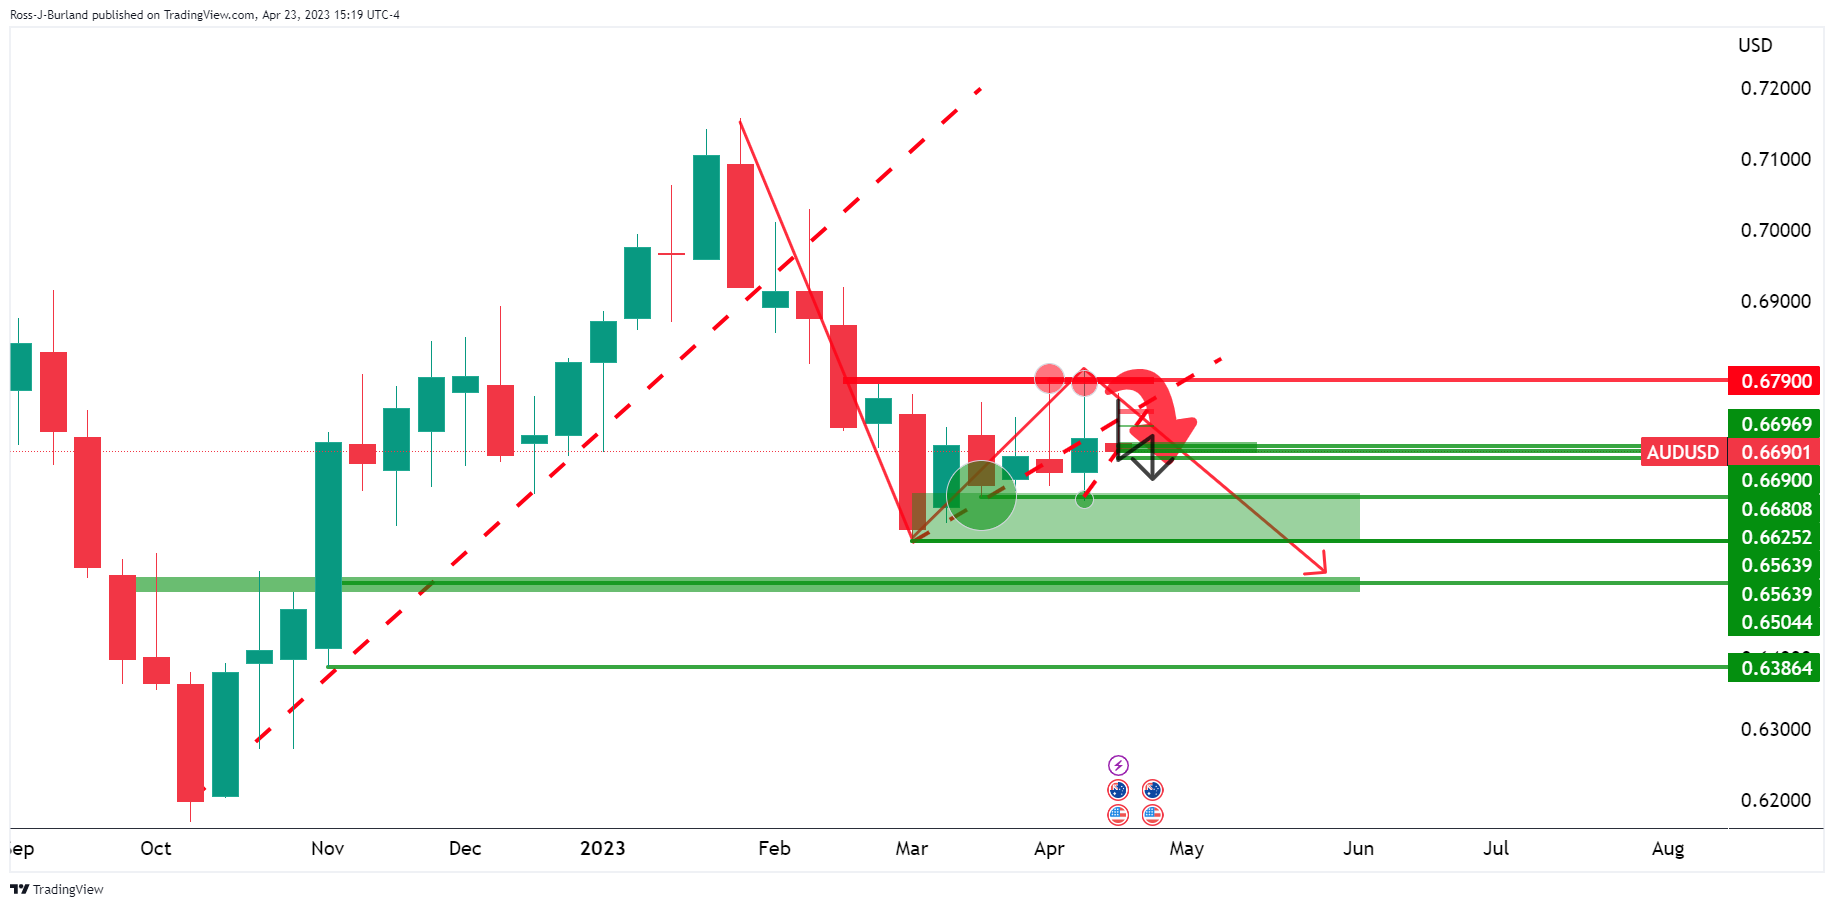
The weekly chart has the price coiling in the correction with the possibility of a downside continuation while stuck below 0.6790.
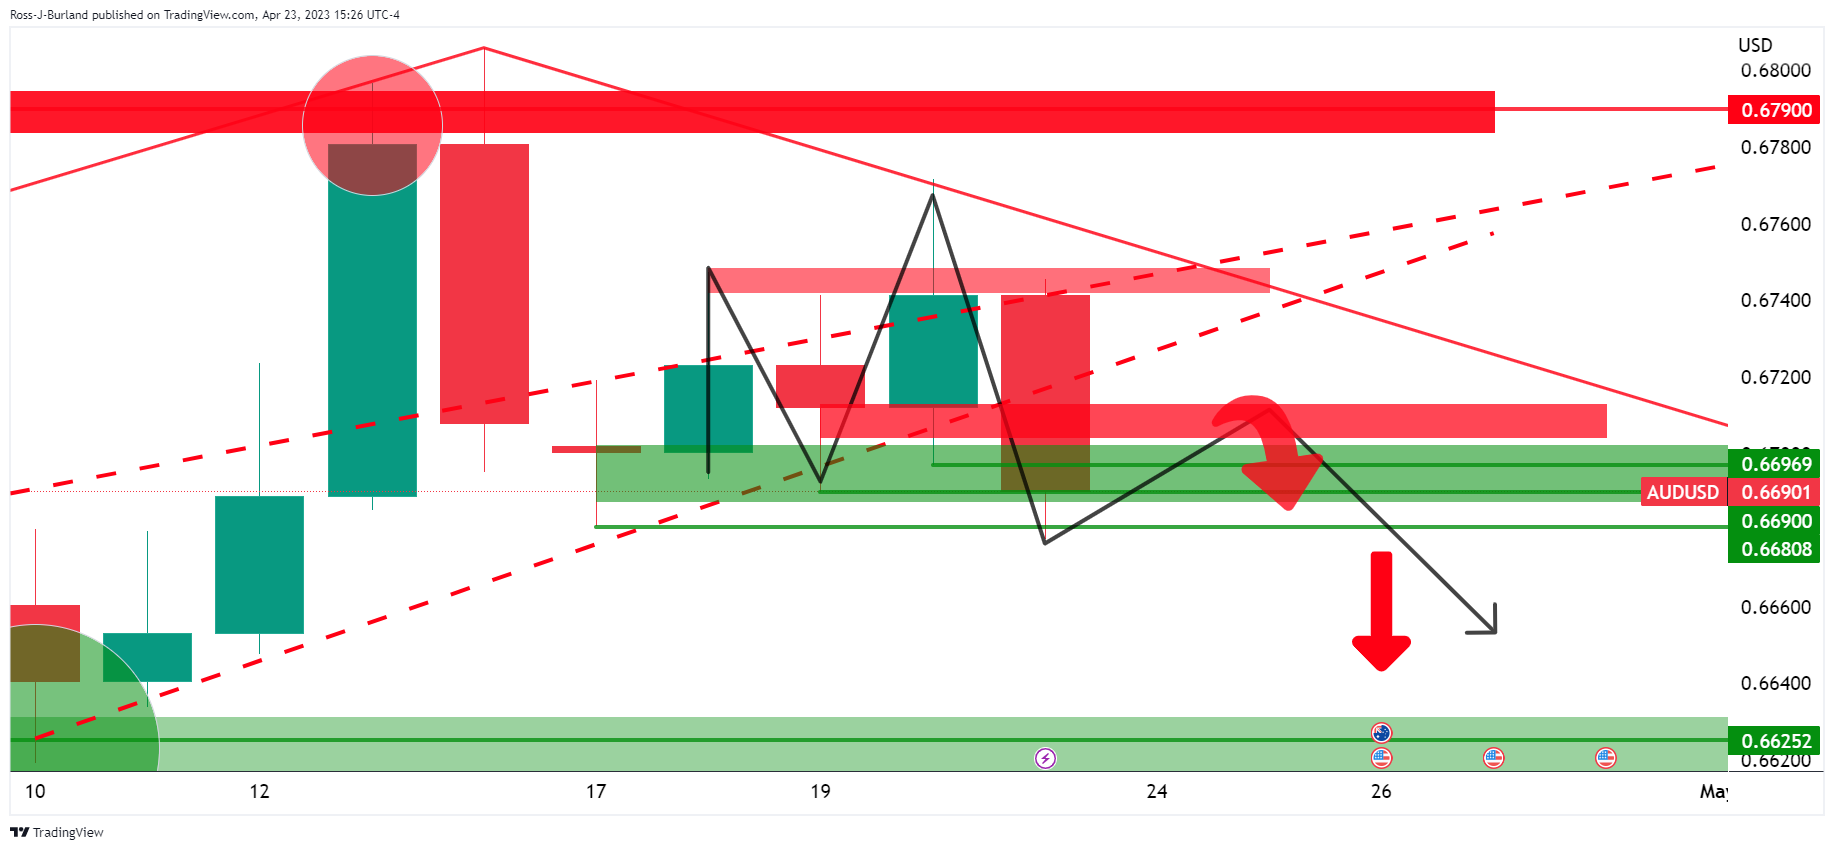
AUD/USD daily charts
The M-formation on the daily chart may act as the peak formation in the correction and lead to a move lower to break the structure on the downside.
AUD/USD H4 chart
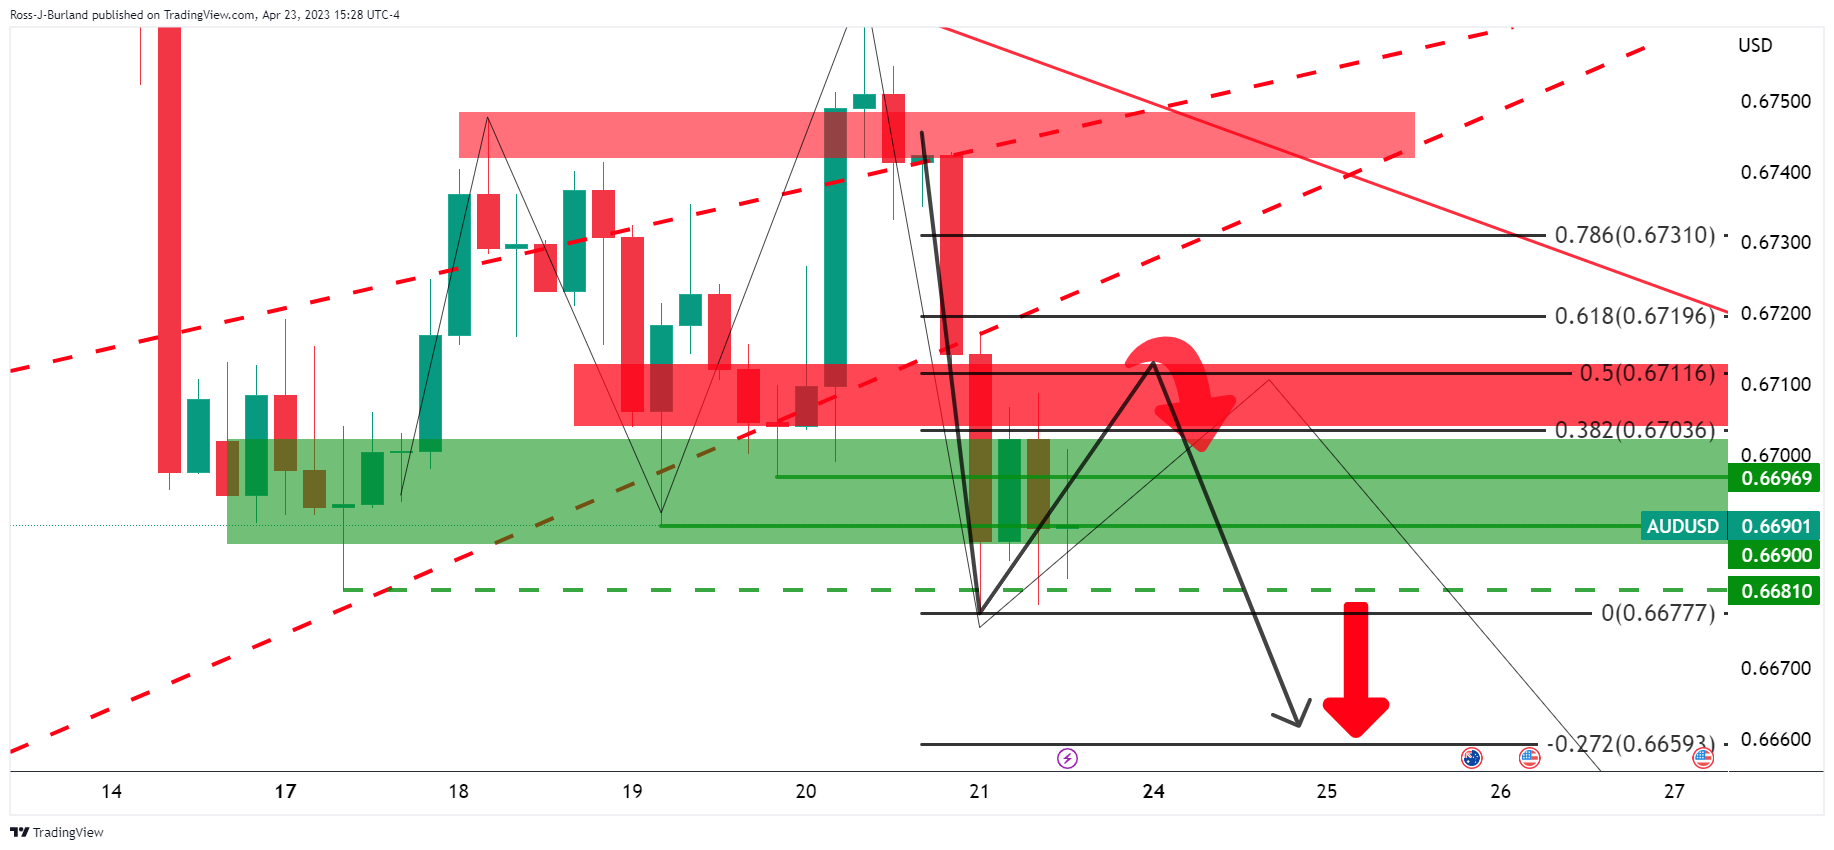
The four-hour chart´s 50% mean reversion level near 0.6710 aligns with the neckline of the pattern that could continue to act as resistance.
-