Noticias del mercado
-
23:57
Gold Price Forecast: XAU/USD sees upside above $1830 ahead of downbeat US Durable Goods Orders
- Gold price is expected to display an upside movement above $1,830.00.
- A downbeat performance looks likely from the US Durable Goods Orders.
- The gold prices are expected to display a lackluster performance on symmetrical triangle formation.
Gold price (XAU/USD) has displayed topsy-turvy moves in a range of $1,821.88-1,831.87 on Friday. The precious metal is expected to witness a decisive move as investors await US Durable Goods Orders data. As per the market consensus, the data is expected to slip to 0.1% from the prior print of 0.5%.
A decent slippage in the economic data is expected to underpin the gold prices going forward. The economic data carries a proper relation with the aggregate demand in the US economy. A higher Durable Goods Orders dictate that the household's demand is resilient. The lower estimates for the economic data could be the outcome of soaring inflation, which is hurting the paychecks of the households and henceforth the demand for the Durable Goods.
It is worth noting that the US economy reported the downbeat Purchase Managers Index (PMI) data. The Manufacturing and Services PMI, both aspects displayed a vulnerable performance. So, the downbeat estimates for the Durable Goods Orders after a vulnerable PMI may hurt the US dollar index (DXY) significantly. The DXY remained lackluster last week and is expected to perform weak on the continuous downbeat performance from the economic data.
Gold technical analysis
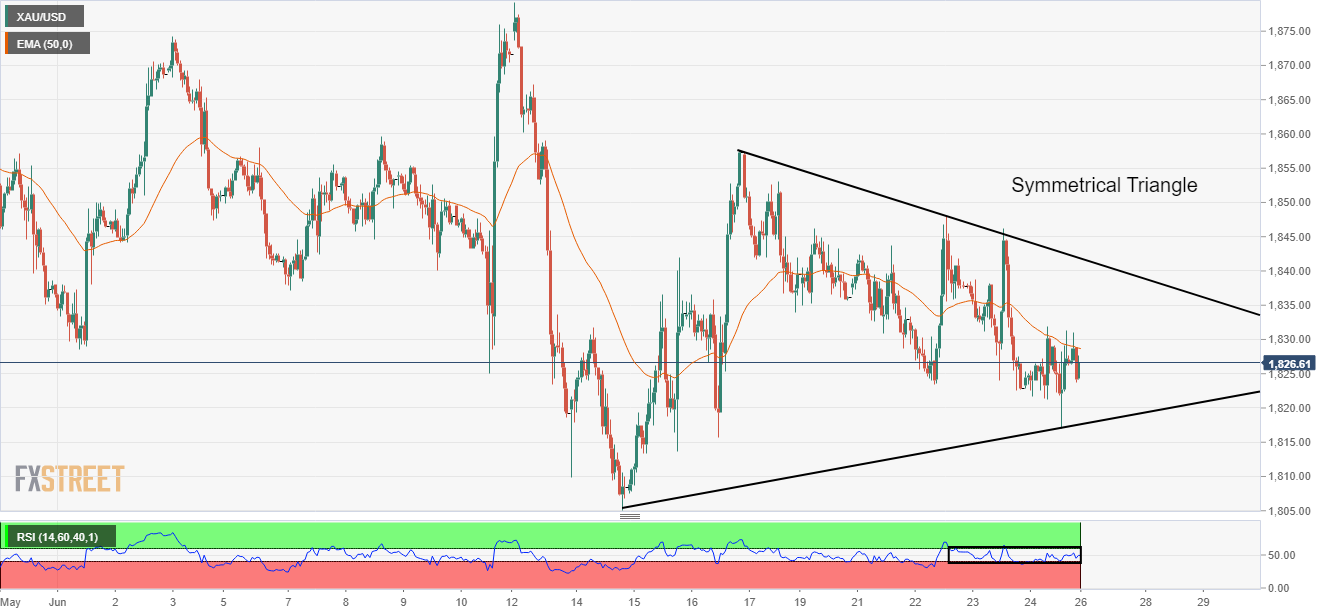
On an hourly scale, the gold prices are trading in a symmetrical triangle that signals a slippage in the volatility. The upward sloping trendline is placed from June 14 low at $1,805.11 while the downward sloping trendline is plotted from June 16 high at $1,857.88. The greenback bulls are defending the 50-period Exponential Moving Average (EMA) at $1,828.75. Meanwhile, the Relative Strength Index (RSI) (14) has shifted into a 40.00-60.00, which bolsters a rangebound move ahead.
Gold hourly chart
-
23:30
AUD/USD Price Analysis: A break from 0.6950 is on the cards
- AUD/USD bears lurking at short-term support in the open.
- Eyes on the lower quadrant of the New York session range.
AUD/USD is consolidated in the upper quadrant of the New York range. However, the price is coiling and a breakout in the near term could be imminent on either side of 0.6950.
AUD/USD, the M5 & M15 open
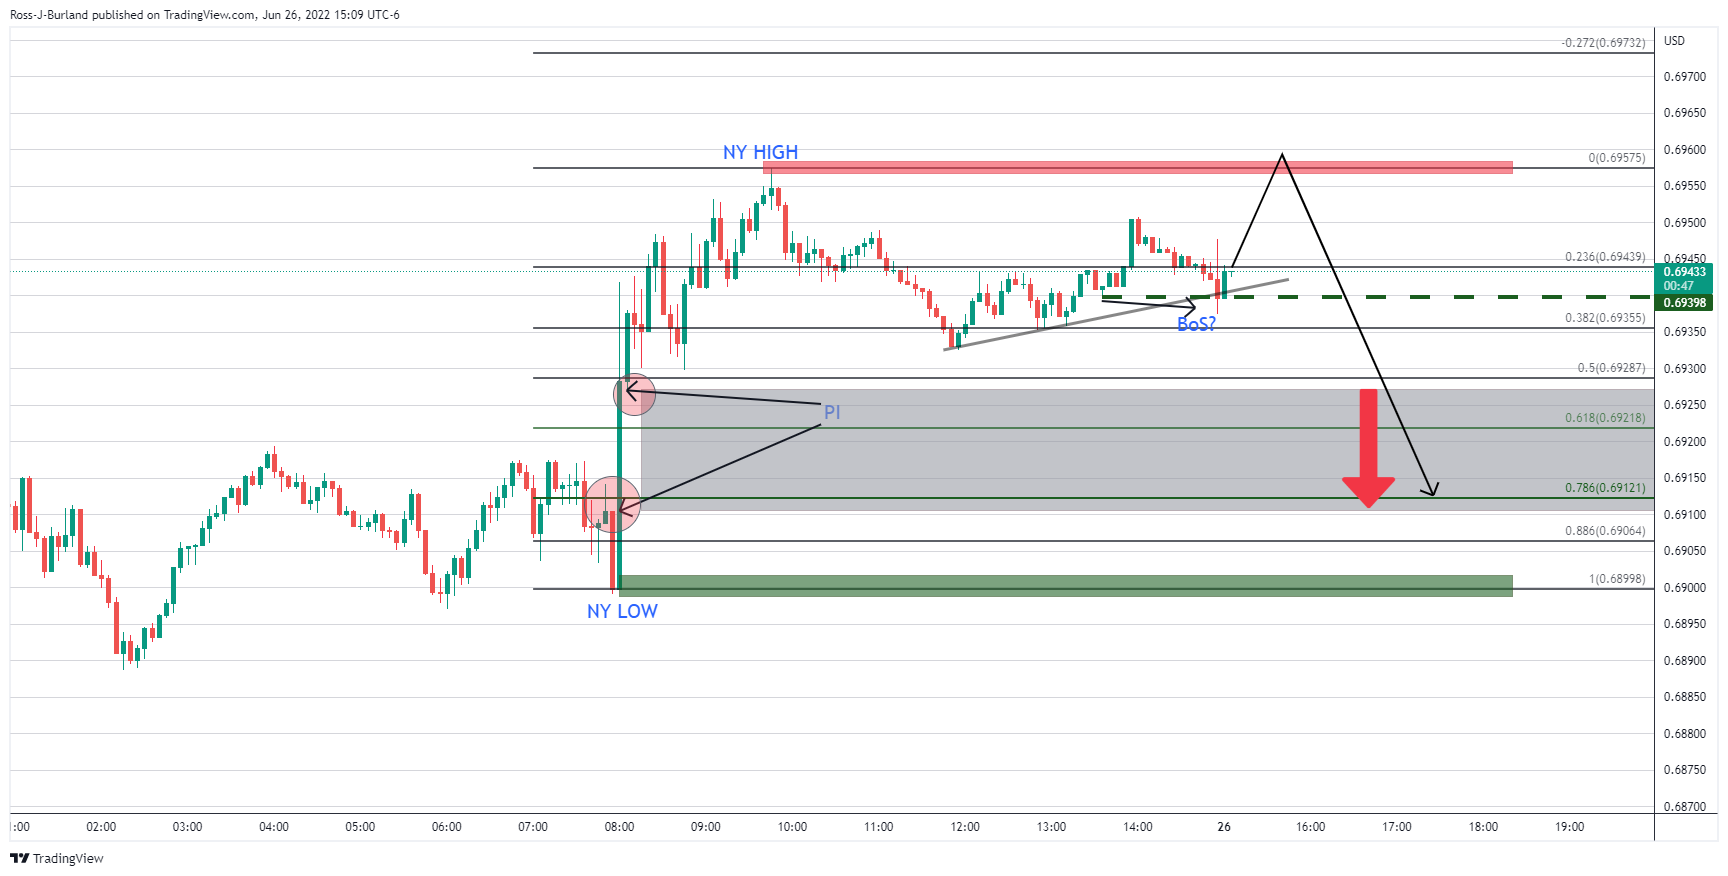
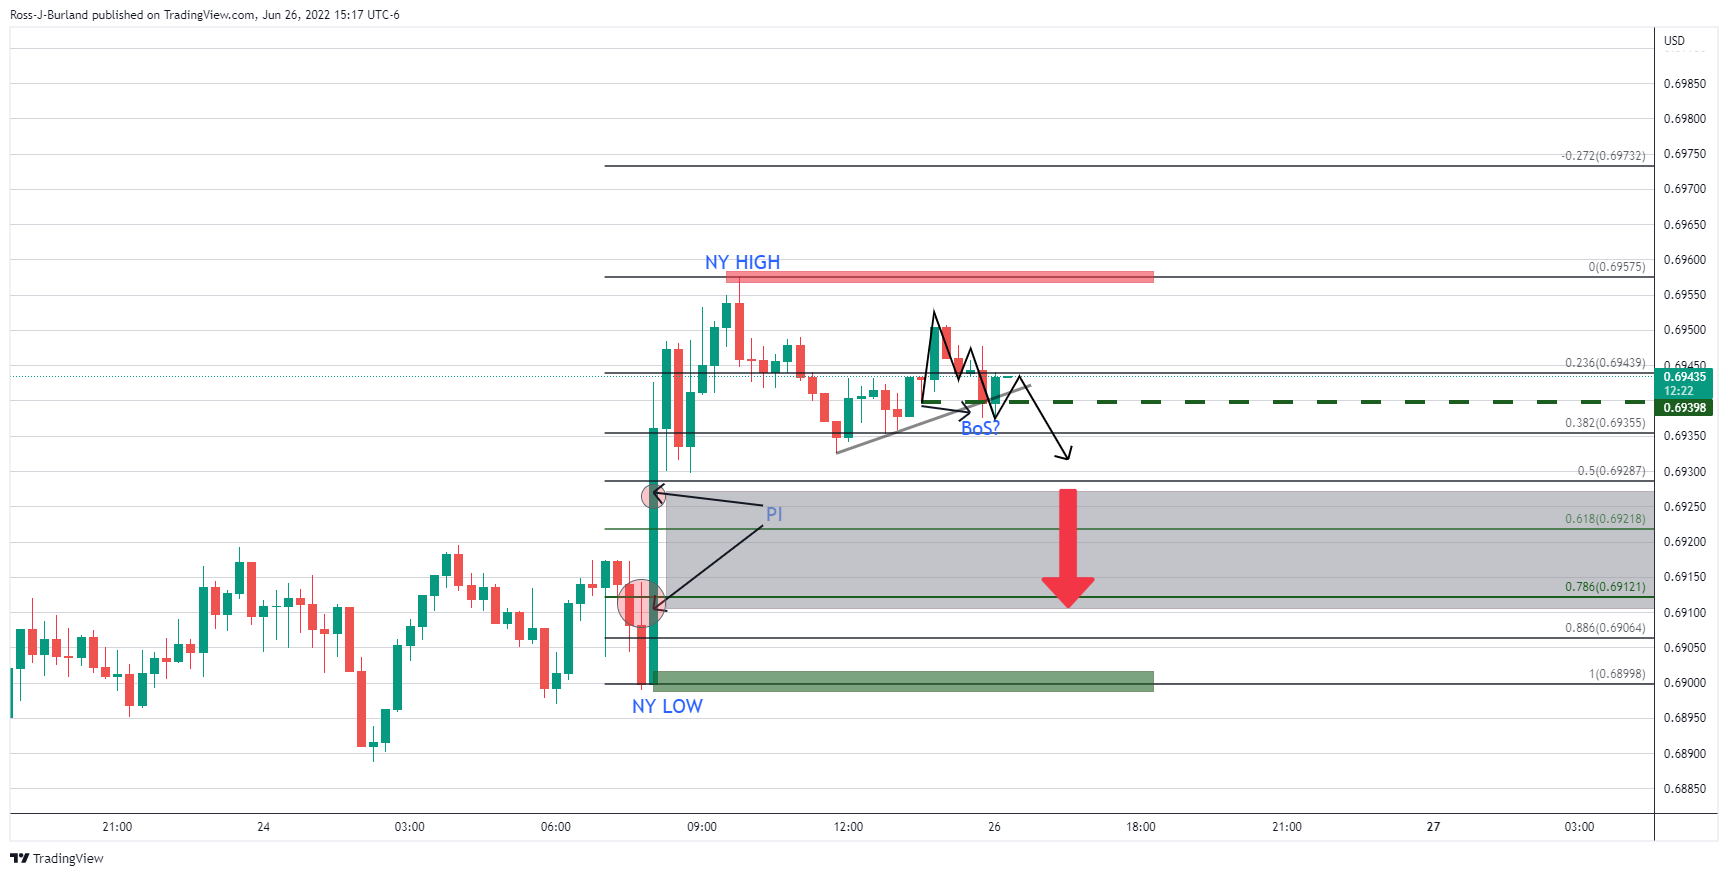
For the open, the price imbalance to the downside between 0.6930 and 0.6914 is compelling. However, there could be a push higher toward the New York highs, especially if the 0.6940 structure does not break. If it does, then this will be the equivalent of a 15-min move from the resistance of the M-formation:
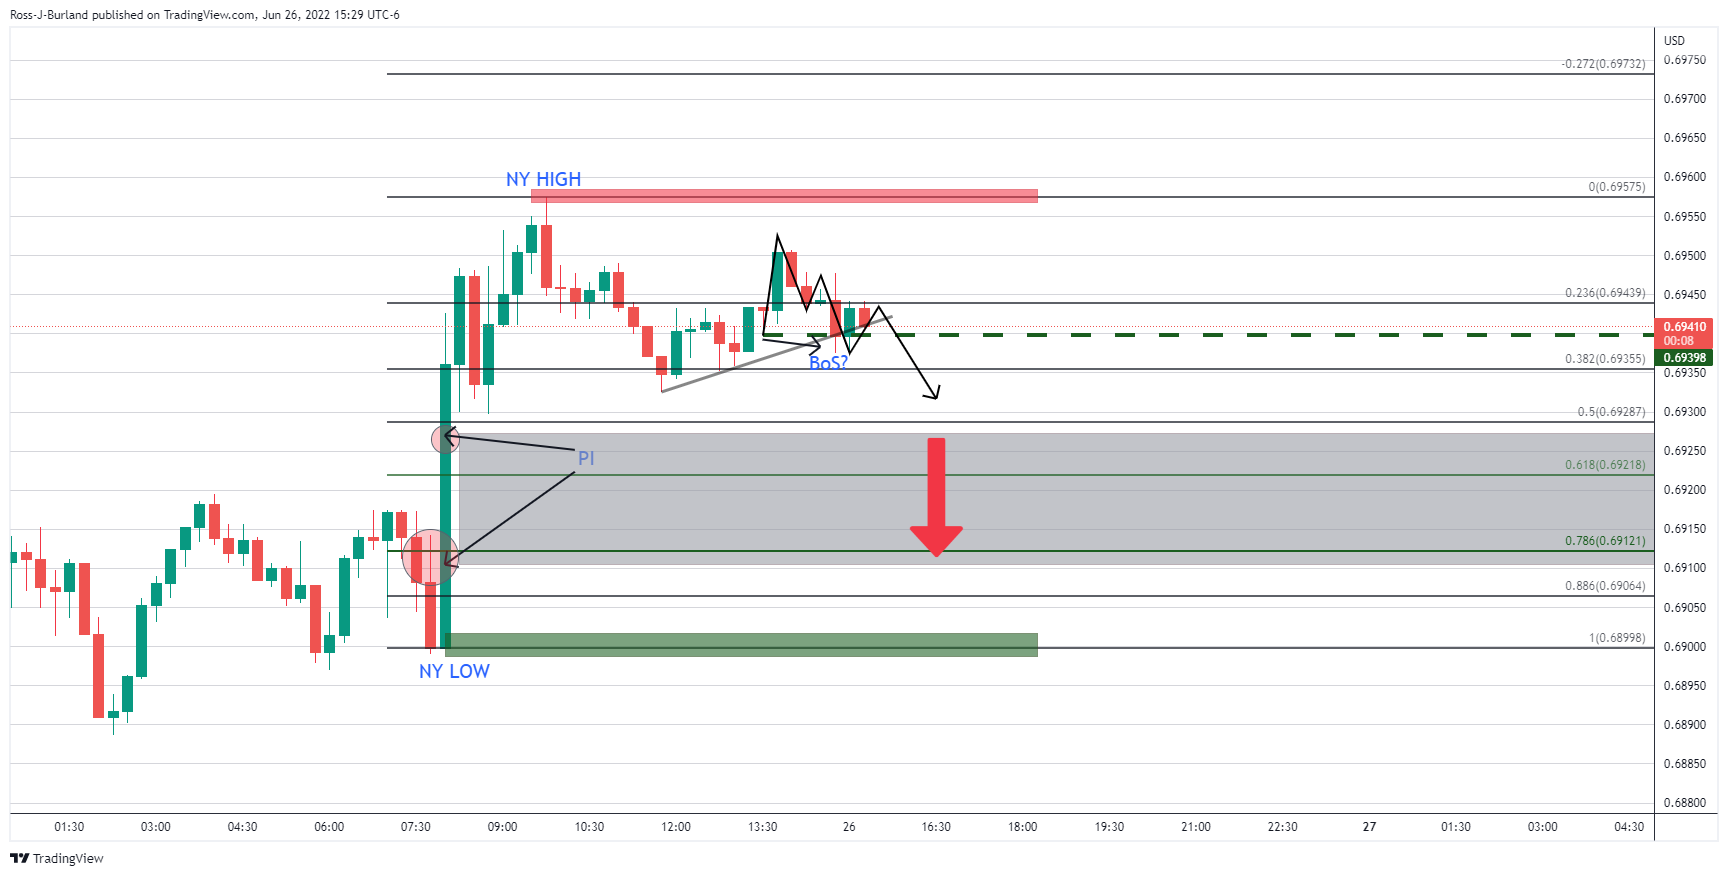
Meanwhile, the following is a top-down analysis outlining the price imbalances that can be watched for mitigation.
AUD/USD monthly chart
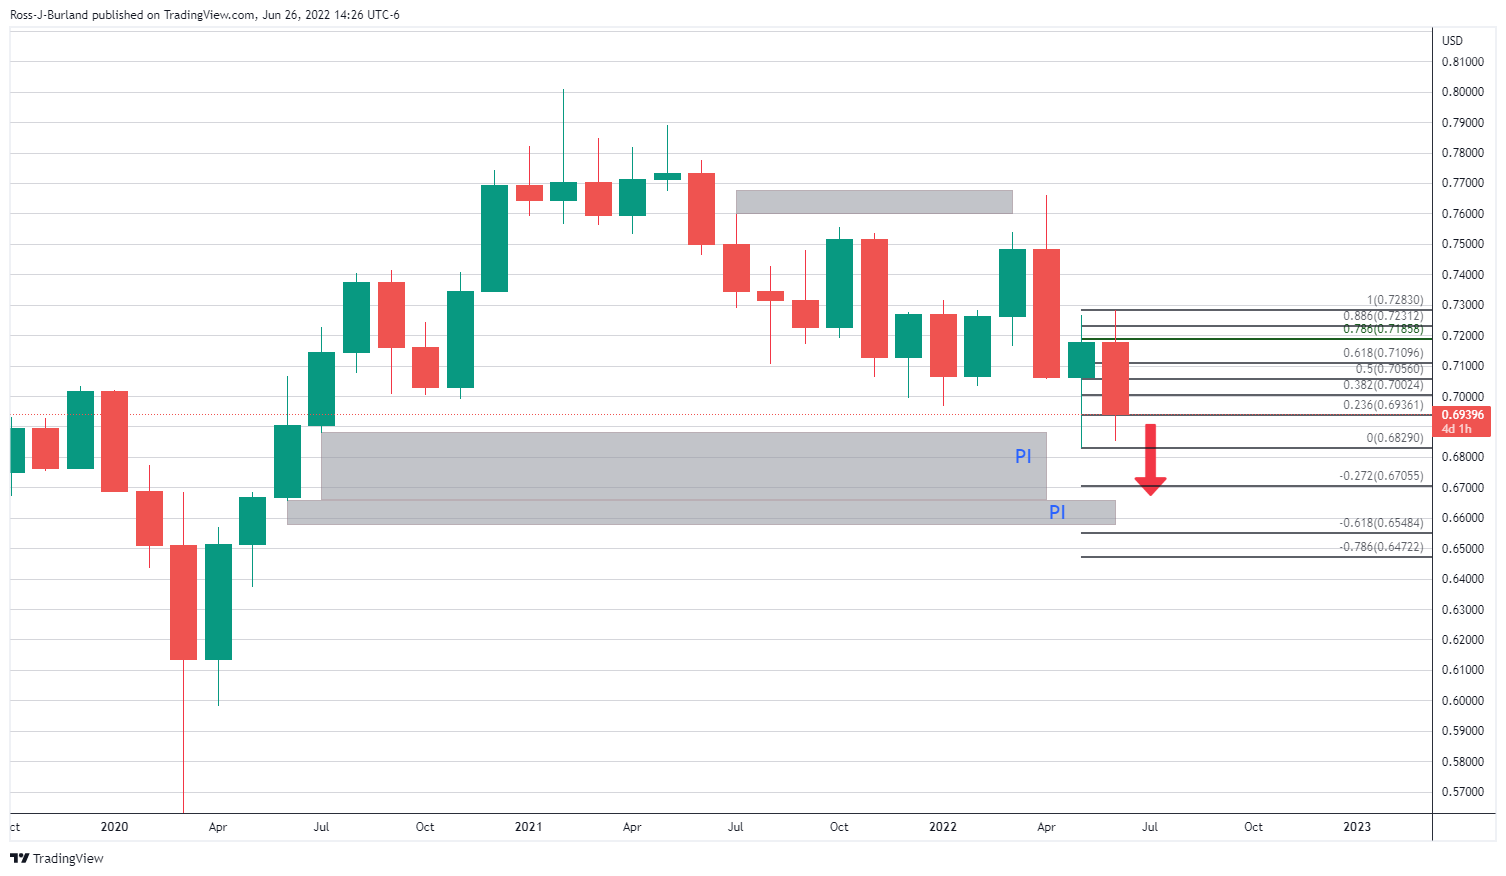
There is a case for the downside to mitigate the price imbalances below the market, as illustrated above.
AUD/USD daily chart
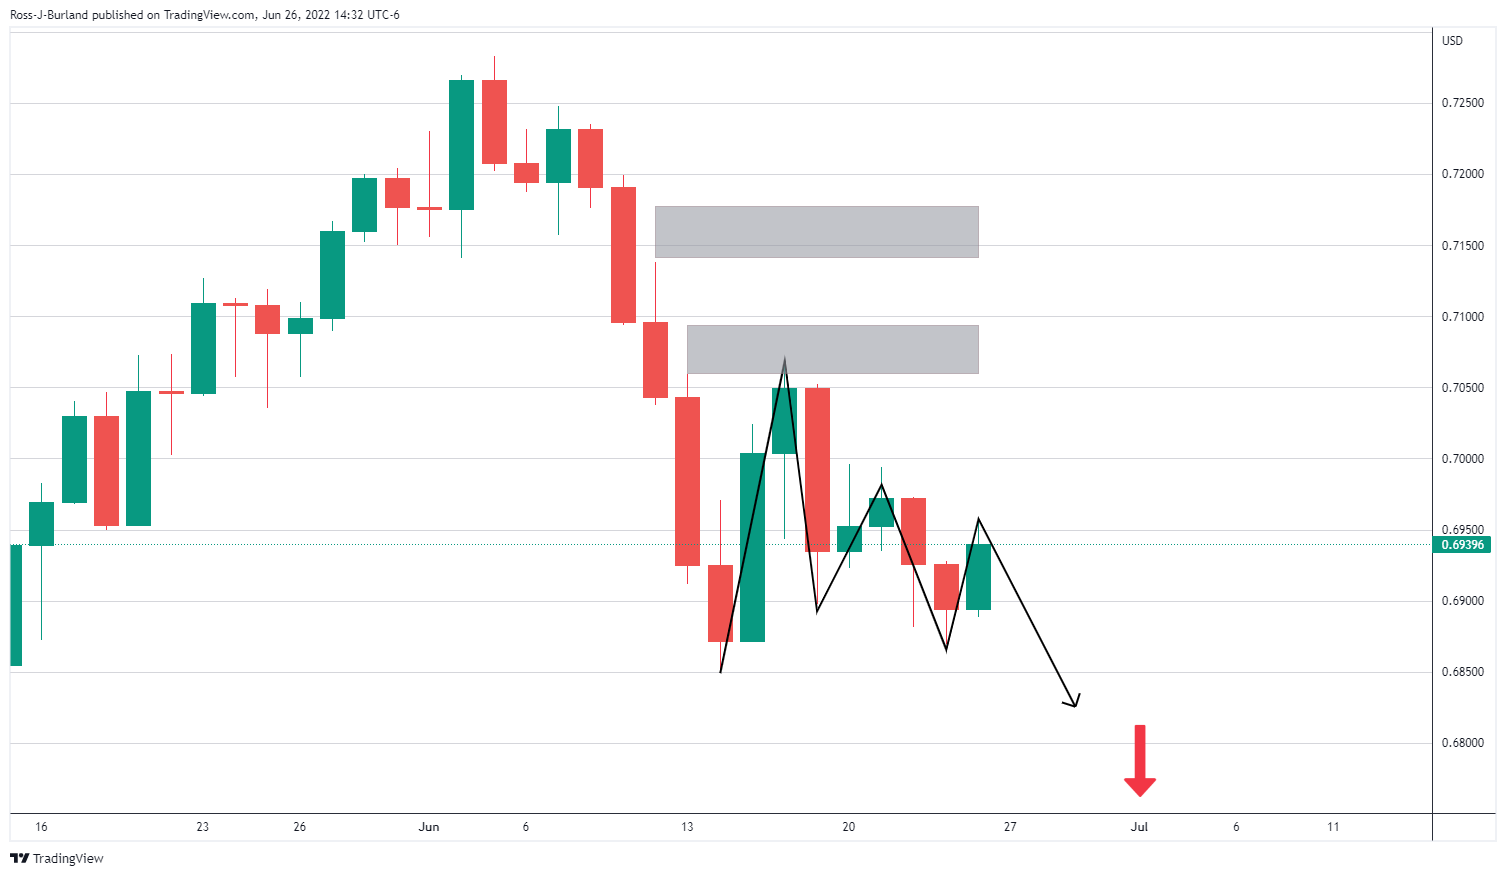
The price is testing the M-formation's neckline which could be the last defence before the bears move in.
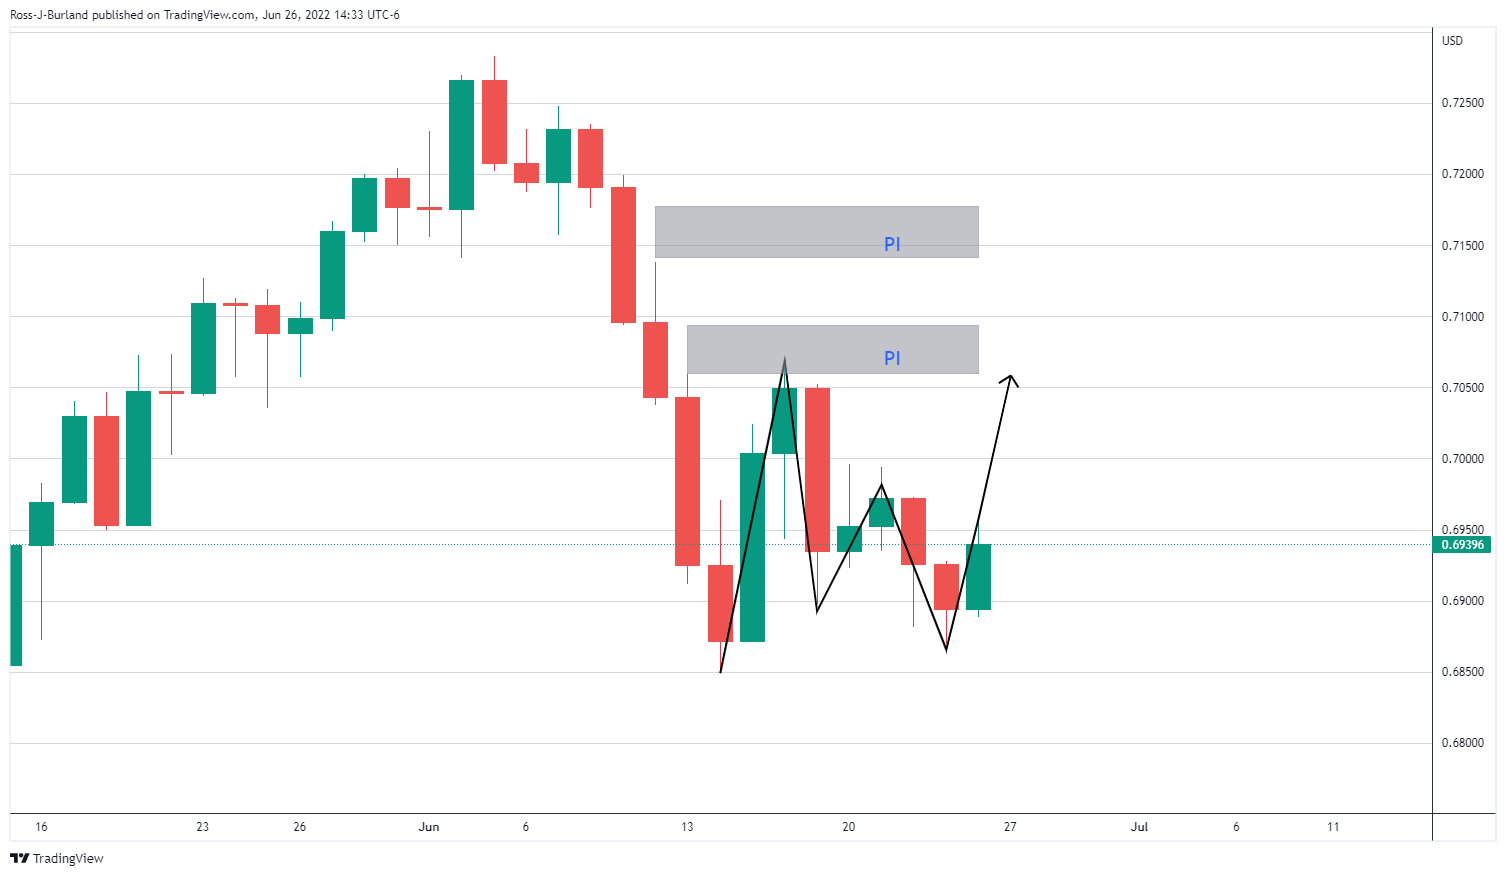
However, there are price imbalances to the upside and a break of the neckline around 0.6950 opens risk to the upside.
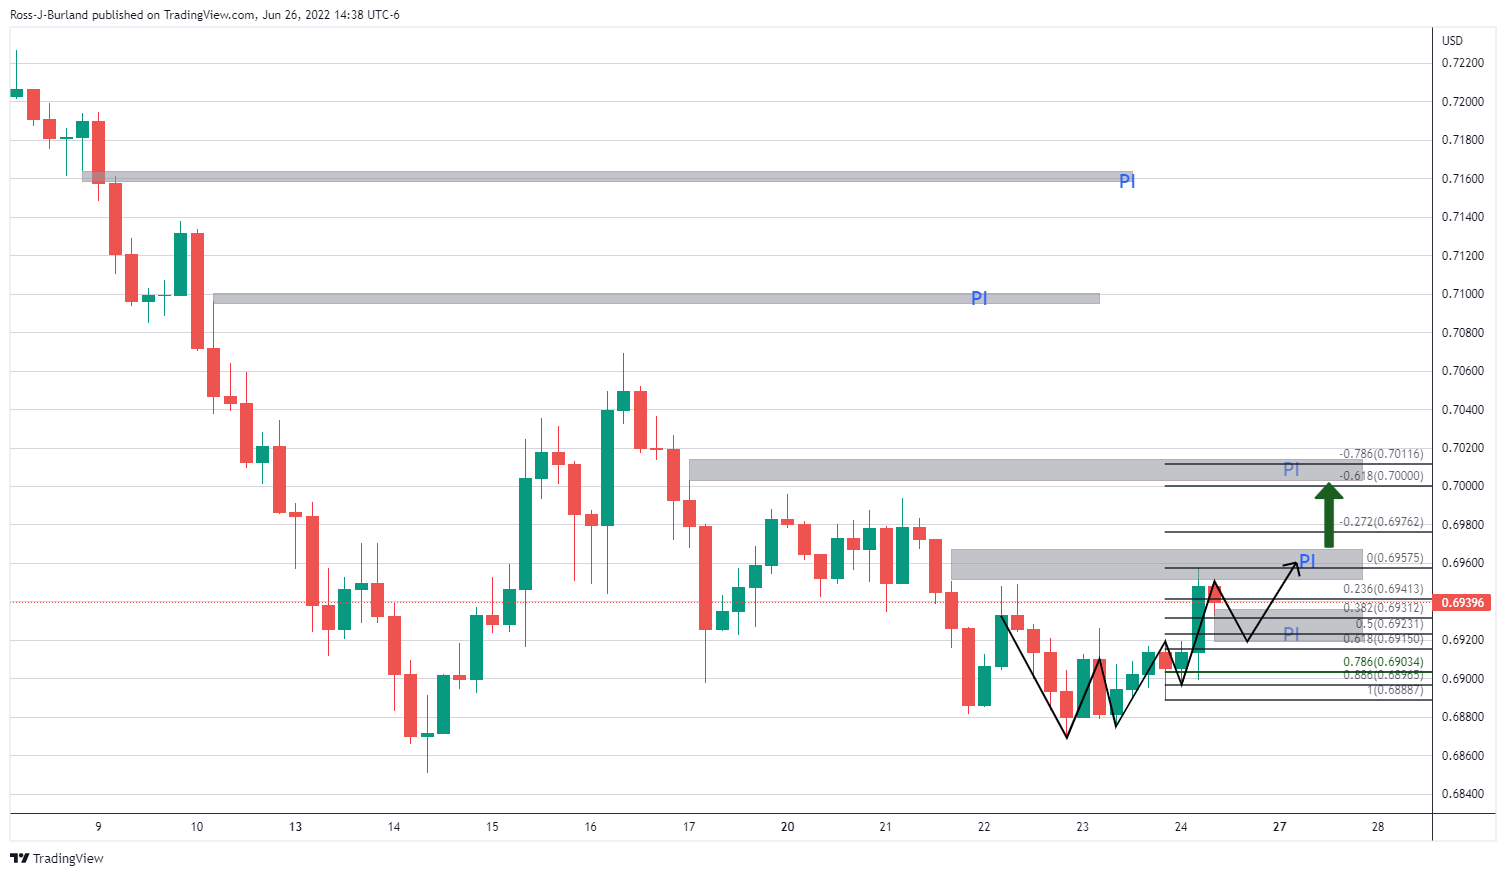
From an hourly perspective, there could be some mitigation to the downside first as follows:
The 15-min chart's M-formation is so far resisting the bulls:
Meanwhile, the US dollar will be key:
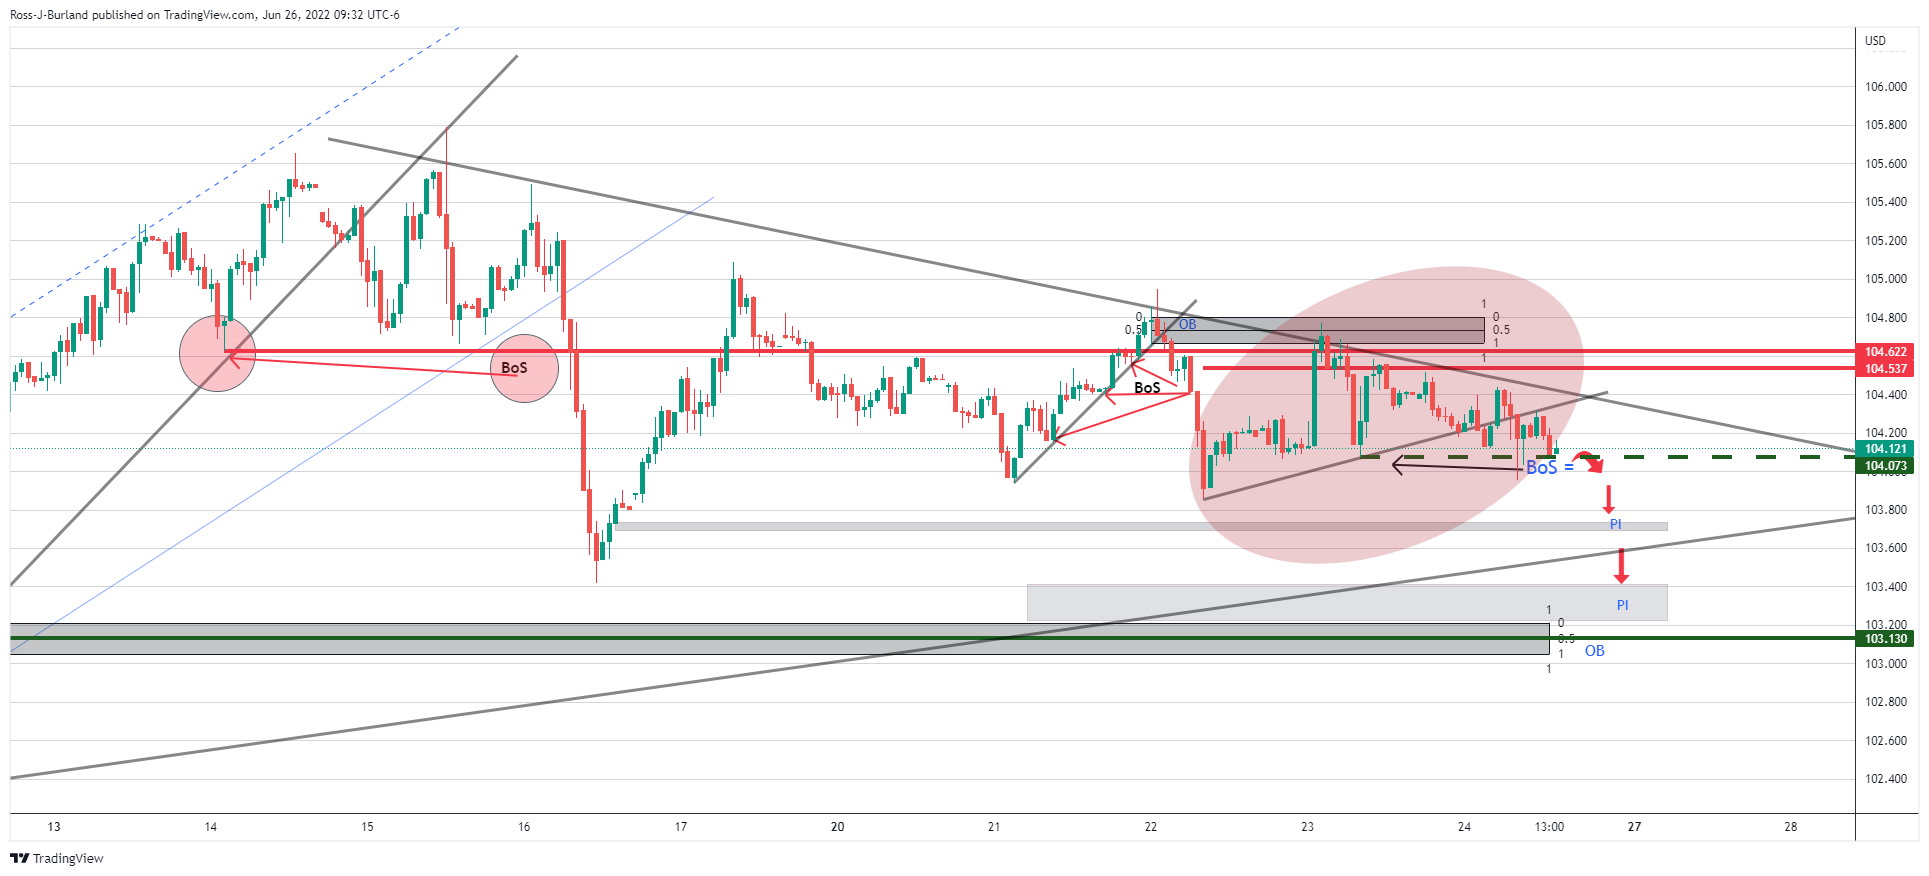
If there is more to come from the DXY bears, as the price breaks structure and heads towards the price imbalances and order block below near 103.10, the Aussie can enjoy a spell to the upside. This puts 0.7100 on the map for the week ahead.
-
 Material posted here is solely for information purposes and reliance on this may lead to losses. Past performances are not a reliable indicator of future results. Please read our full disclaimer