Noticias del mercado
-
23:45
NZD/USD licks its wounds near 0.6500 despite upbeat New Zealand trade numbers, Fed, US NFP eyed
- NZD/USD fades bounce off intraday low even as New Zealand trade numbers improved in December.
- New Zealand Trade Balance and Exports grew, Imports eased in December.
- Cautious mood ahead of bumper data/events exerts downside pressure on Kiwi price.
- China’s return from one-week-long holidays could entertain traders.
NZD/USD prints mild losses around 0.6480, holding lower grounds near the intraday bottom following the week-start gap-down. In doing so, the Kiwi pair fails to cheer the upbeat New Zealand (NZ) trade data, as well as portray the market’s cautious mood ahead of this week’s key data/events.
New Zealand’s headlines Trade Balance improved to $-475M MoM for December versus $-2,108M prior while the yearly figure rose to $-14.46B compared to $-14.98B previous readings. Further details suggest that the Imports eased to $7.19B compared to $8.52B whereas the Exports increased to $6.72B for December compared to $6.34B prior.
On the other hand, the better-than-expected fourth-quarter (Q4) Gross Domestic Product (GDP) and the Core Personal Consumption Expenditures (PCE) Price Index for December gained major attention. However, the actual releases were softer than their previous outcomes and hence signaled that the Federal Reserve’s (Fed) front-loading of interest rates has finally helped exert downside pressure on spending and inflation fears.
The aforementioned catalysts built market forecasts that the Fed may rethink its aggressive rate and the policy pivot. It’s worth observing, however, that the figures like Durable Goods Orders for December and Weekly Initial Jobless Claims were joined by the last comments from the Fed policymakers resisting policy pivot to keep the hawks hopeful, which in turn weighed on the Gold price.
Talking about the data, the Federal Reserve's preferred gauge of inflation, namely the Core Personal Consumption Expenditures (PCE) Price Index, matched 4.4% YoY market forecast versus 4.7% prior while the monthly figure rose to 0.3% versus 0.2% expected and previous readings. Further, the US Bureau of Economic Analysis' (BEA) first estimate of the US fourth quarter (Q4) Gross Domestic Product marked an annualized growth rate of 2.9% versus 2.6% expected and 3.2% prior. On the same line, the Durable Goods Orders jumped 5.6% in December versus 2.5% market forecast and -1.7% upwardly revised prior. Furthermore, the growth of Personal Consumption Expenditures Prices weakened to 3.2% QoQ in Q4 compared to 4.3% marked forecast and prior readings. Further, Core Personal Consumption Expenditures eased to 3.9% QoQ for Q4 from 4.7% previous readings, versus 5.3% expected.
Amid these plays, the US 10-year Treasury bond yields managed to snap a three-week south-run while posting 0.60% weekly gain to 3.50% by the end of Friday. Wall Street benchmarks, on the other hand, printed mixed weekly close. Furthermore, the US Dollar Index (DXY) managed to post the lowest weekly loss in three, down 0.07% to 101.92 at the latest, despite posting the third weekly downtrend and refreshing the eight-month low.
Having witnessed the initial reaction to New Zealand data, the NZD/USD pair traders should pay attention to China’s return and the reaction to the last week’s mostly upbeat US statistics, as well as preparations for this week’s Federal Reserve (Fed) decision. It’s worth noting that softer New Zealand inflation data has already reduced the importance of this week’s Q4 NZ jobs report. Other than the Fed decision, the US employment data for December and China’s official activity numbers for the said month will also be crucial for near-term directions.
Technical analysis
A clear downside break of a three-week-old ascending trend line lures NZD/USD sellers towards the 21-DMA support, close to 0.6400 round figure. Alternatively, a convergence of the support-turned-resistance line and a downward-sloping trend line from January 18, close to 0.6520, appears the key hurdle for the Kiwi bulls to tackle to retake control.
-
23:34
GBP/USD Price Analysis: Finds resistance around 1.2400 amid Fed-BoE policy-inspired volatility
- GBP/USD has dropped after facing barricades around 1.2400 despite the upbeat market mood.
- Volatility to remain squeezed ahead of the Fed-BoE interest rate policy.
- An oscillation by the RSI (14) in the 40.00-60.00 range indicates a consolidation head.
The GBP/USD pair has sensed selling interest near the round-level resistance of 1.2400 in early Asia after a gradual upside move. The cable is expected to remain on the tenterhooks as investors are shifting their focus toward the announcement of the interest rate decision by the Federal Reserve (Fed) and the Bank of England (BoE) this week.
Meanwhile, the risk appetite of the market participants has been improved after a decline in the United States core Personal Consumption Expenditure (PCE) price index (Dec), which signified that the overall demand is softening along with inflationary pressures. The US Dollar Index (DXY) is continuously declining from its capped upside around 101.80.
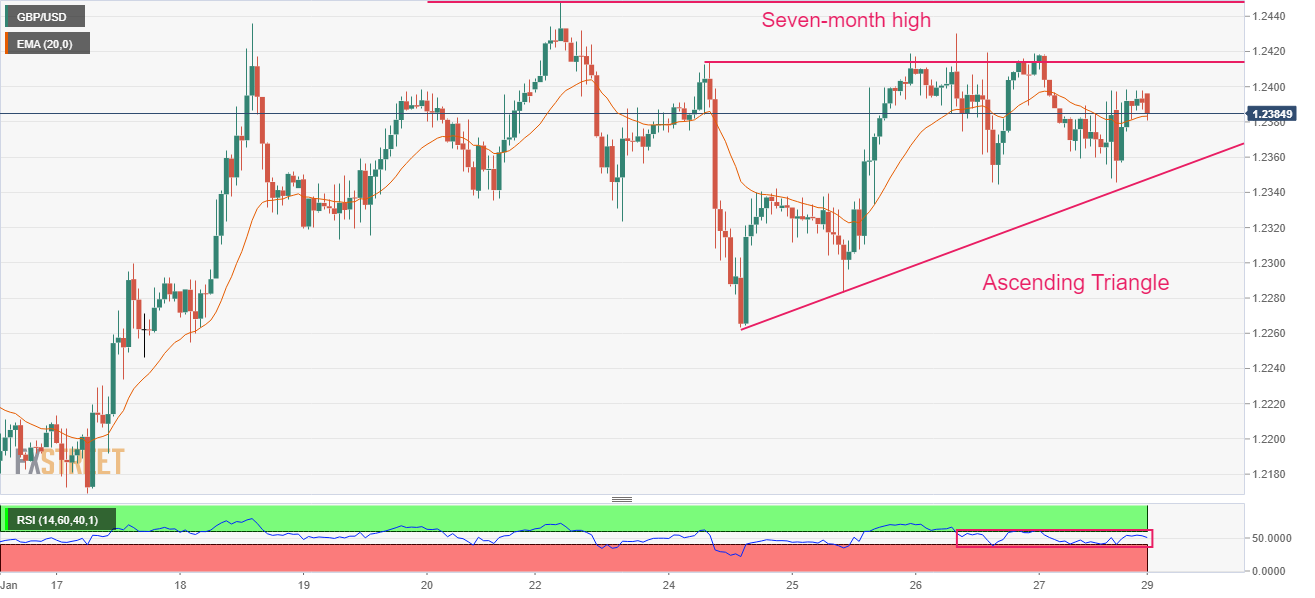
On an hourly scale, GBP/USD is auctioning in an Ascending Triangle chart pattern, which indicates a slippage in volatility. The rationale behind the volatility contraction should be the monetary policy announcements by the Fed and the BoE this week. The upward-sloping trendline of the above-mentioned chart pattern is plotted from January 24 low at 1.2263 while the horizontal resistance is placed from January 24 high around 1.2414.
The 20- period Exponential Moving Average (EMA) at 1.2382 is overlapping the cable, which indicates consolidation ahead.
Also, the Relative Strength Index (RSI) (14) is oscillating in a 40.00-60.00 range, which indicates an absence of a potential trigger for a decisive move.
Should the Cable break above the seven-month high of 1.2448 decisively, Pound Sterling bulls will drive the asset towards the psychological resistance of 1.2500 and the June 7 high around 1.2600.
The Cable will display a sheer downside if it drops below Monday’s low at 1.2171 as it will drag the major toward January 11 low at 1.2100 followed by the psychological support at 1.2000.
GBP/USD hourly chart
-
23:26
Gold Price Forecast: XAU/USD bears await Federal Reserve decision, United States Non-farm Payrolls
- Gold price stays depressed after probing five-week uptrend with bearish candlestick on weekly, support line break.
- Federal Reserve interest rate hikes in question as United States data flash mixed signals.
- Fears of US recession join easing inflation woes to challenge US Dollar buyers, probing XAU/USD bears.
- Hawkish Fed, upbeat US statistics could recall Gold sellers.
Gold price (XAU/USD) holds lower ground near $1,925 after posting an indecisive weekly closing as the metal traders await the key United States data and the Federal Reserve’s (Fed) monetary policy decision. Also important will be central bank meetings of the European Central Bank (ECB), Purchasing Managers’ Indexes data and the US employment numbers for January.
In doing so, the XAU/USD portrays the market’s inaction, as well as cautious mood ahead of the aforementioned catalysts, amid the absence of Chinese traders, Fed/ECB blackout and also due to the mixed US statistics.
Mixed United States statistics probe US Dollar bears, weigh on Gold price
Among the key data from the United States, better-than-expected fourth-quarter (Q4) Gross Domestic Product (GDP) and the Core Personal Consumption Expenditures (PCE) Price Index for December gained major attention. However, the actual releases were softer than their previous outcomes and hence signaled that the Federal Reserve’s (Fed) front-loading of interest rates has finally helped exert downside pressure on spending and inflation fears. That same built market forecasts that the Fed may rethink its aggressive rate and the policy pivot. It’s worth observing, however, that the figures like Durable Goods Orders for December and Weekly Initial Jobless Claims were joined by the last comments from the Fed policymakers resisting policy pivot to keep the hawks hopeful, which in turn weighed on the Gold price.
That said, the Federal Reserve's preferred gauge of inflation, namely the Core Personal Consumption Expenditures (PCE) Price Index, matched 4.4% YoY market forecast versus 4.7% prior while the monthly figure rose to 0.3% versus 0.2% expected and previous readings. Further, the US Bureau of Economic Analysis' (BEA) first estimate of the US fourth quarter (Q4) Gross Domestic Product marked an annualized growth rate of 2.9% versus 2.6% expected and 3.2% prior. On the same line, the Durable Goods Orders jumped 5.6% in December versus 2.5% market forecast and -1.7% upwardly revised prior. Furthermore, the growth of Personal Consumption Expenditures Prices weakened to 3.2% QoQ in Q4 compared to 4.3% marked forecast and prior readings. Further, Core Personal Consumption Expenditures eased to 3.9% QoQ for Q4 from 4.7% previous readings, versus 5.3% expected.
Even with the mixed US data, the US 10-year Treasury bond yields managed to snap a three-week south-run while posting 0.60% weekly gain to 3.50% by the end of Friday. Wall Street benchmarks, on the other hand, printed mixed weekly close.
Amid these plays, the US Dollar Index (DXY) managed to post the lowest weekly loss in three, down 0.07% to 101.92 at the latest, despite posting the third weekly downtrend and refreshing the eight-month low.
Given the inverse relationship between the Gold price and US Dollar, the XAU/USD bulls take a breather ahead of the key data/events.
Federal Reserve’s dovish hike can recall XAU/USD buyers
The aforementioned United States (US) data contrasts with the Federal Reserve (Fed) policymakers’ hesitance to welcome doves, which in turn will be interesting to watch for Gold traders. The reason could be linked to the nearness of the US central bank’s pivot rate of around 4.50% and the market’s talks of no rate hikes after a 0.25% increase in benchmark rates in February. That said, CME’s FedWatch tool suggests considerable favor for the 0.25% rate hike in this week’s monetary policy meeting of the Fed but nearly no supporters of one such move in March. Hence, a dovish hike is on the table and can tease the Gold buyers unless Fed Chairman Jerome Powell sounds hawkish.
Considering this, analysts at Australia and New Zealand Banking Group (ANZ) said, “After starting early and front-loading hikes last year, the Fed is expected to further reduce the amplitude of its hiking and raise the fed funds rate by 25b to 4.50–4.75%. We still think it is close to reaching levels where it will pause. However, the buoyancy in the labor market and slow pace with which services inflation is expected to fall remain problematic, underpinning our view that rates will stay at peak levels in 2023. “
United States employment data to direct post-Fed Gold moves
Apart from the Federal Reserve (Fed) concerns, the United States (US) monthly job report for January will also be important for Gold traders. As per the market forecasts, the headline Nonfarm Payrolls (NFP) is expected to ease to 175K from 223K prior while the Unemployment Rate might also inch up from 3.5% to 3.6%. It’s worth observing that an anticipated uptick in the Average Hourly Earnings, to 4.9% YoY versus 4.6% prior, might contradict the downbeat forecasts for top-tier job numbers and may defend Gold sellers.
Many more catalysts to entertain XAU/USD traders
Other than the Federal Reserve’s (Fed) showdown and the United States jobs report for January, the monetary policy verdict of the European Central Bank (ECB) will also be important for Gold traders as it affects the US Dollar via Euro (EUR) moves. Additionally, the Institute for Supply Management’s (ISM) Purchasing Managers’ Indexes (PMI) will provide extra directions to the XAU/USD traders.
It should be noted that the hawkish ECB outcome is on the table and could challenge the Gold sellers, by exerting downside pressure on the US Dollar. On the same line, the ISM Services PMI grabbed XAU/USD buyer’s attention after marking the first below-50 figure, suggesting a contraction in activities since June 2020, for December 2022 during early January. Hence, any further deterioration in the key US activity numbers could offer a bumpy road to the Gold sellers even if the Fed and US employment data favor XAU/USD weakness.
Also read: Gold Price Weekly Forecast: Bulls to remain in control as long as $1,900 stays intact
Gold price technical analysis
Gold price slipped into bear’s radar after breaking a two-week-old support line on Friday, now resistance around $1,940. Not only the support line break but the looming bear cross on the Moving Average Convergence and Divergence (MACD) indicator and a pullback in the Relative Strength (RSI) line, placed at 14, also teases the XAU/USD sellers.
Gold price: Daily chart
-D1-30012023-638106279547938278.png)
Trend: Further downside expected
Additionally favoring the Gold sellers is the “Gravestone Doji” bearish candlestick on the weekly formation, as well as overbought RSI (14) on the same timeframe.
Gold price: Weekly chart
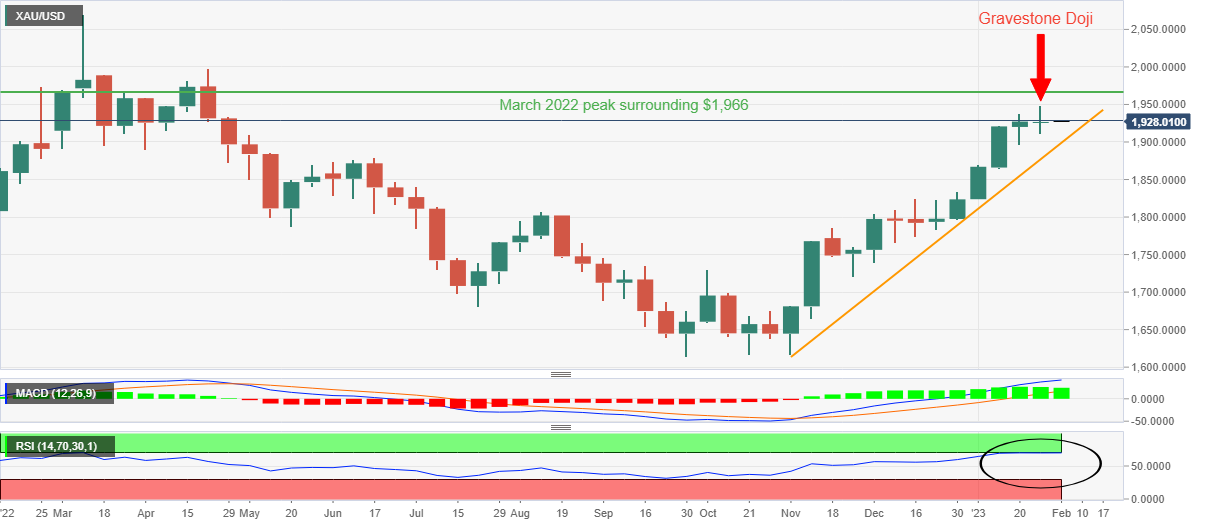
Trend: Pullback expected
That said, the $1,900 threshold and the January 18 swing low surrounding $1,896 restrict short-term Gold downside. Following that, the 21-Daily Moving Average (DMA), near $1,892 by the press time, could act as the last defense of the metal buyers.
On the flip side, the immediate support-turned-resistance line near $1,940 holds the key to the Gold buyer’s re-entry.
Following that, the multi-month high marked in the last week around $1,950 and March 2022 peak close to $1,966 will precede an upward-sloping resistance line from the mid-December 2022, surrounding $1,972 at the latest, to challenge the Gold bulls.
It’s worth noting that the XAU/USD run-up beyond the $1,972 hurdle won’t hesitate to challenge the $2,000 psychological magnet.
-
23:12
WSJ reports ''Fed debates whether wages or low unemployment will drive inflation''
The Wall Street Journal has written in the weekend press that ''stubbornly high inflation is finally easing as supply chain disruptions fade and interest rates at 15-year highs put the brakes on demand. Now, Federal Reserve officials have voiced unease that prices could reaccelerate because labour markets are so tight.''
''At issue is what’s the right way to forecast inflation: a bottoms-up analysis of recent readings on prices and wages that puts more weight on pandemic-driven idiosyncrasies — or a traditional top-down analysis of how far the economy is operating above or below its normal capacity,'' Nick Timiraos wrote, adding, ''Some inside the Fed, including its influential staff, put more weight on the latter, which would argue for tighter policy for longer. Others prefer the former, which could argue for a milder approach.''
US Dollar update, daily chart
The US Dollar edged up from eight-month lows on Friday despite slowing inflation data ahead of the Federal Reserve this week whereby investors are hoping that the central bank can engineer an economic soft landing and reduce its pace of aggressive monetary tightening.
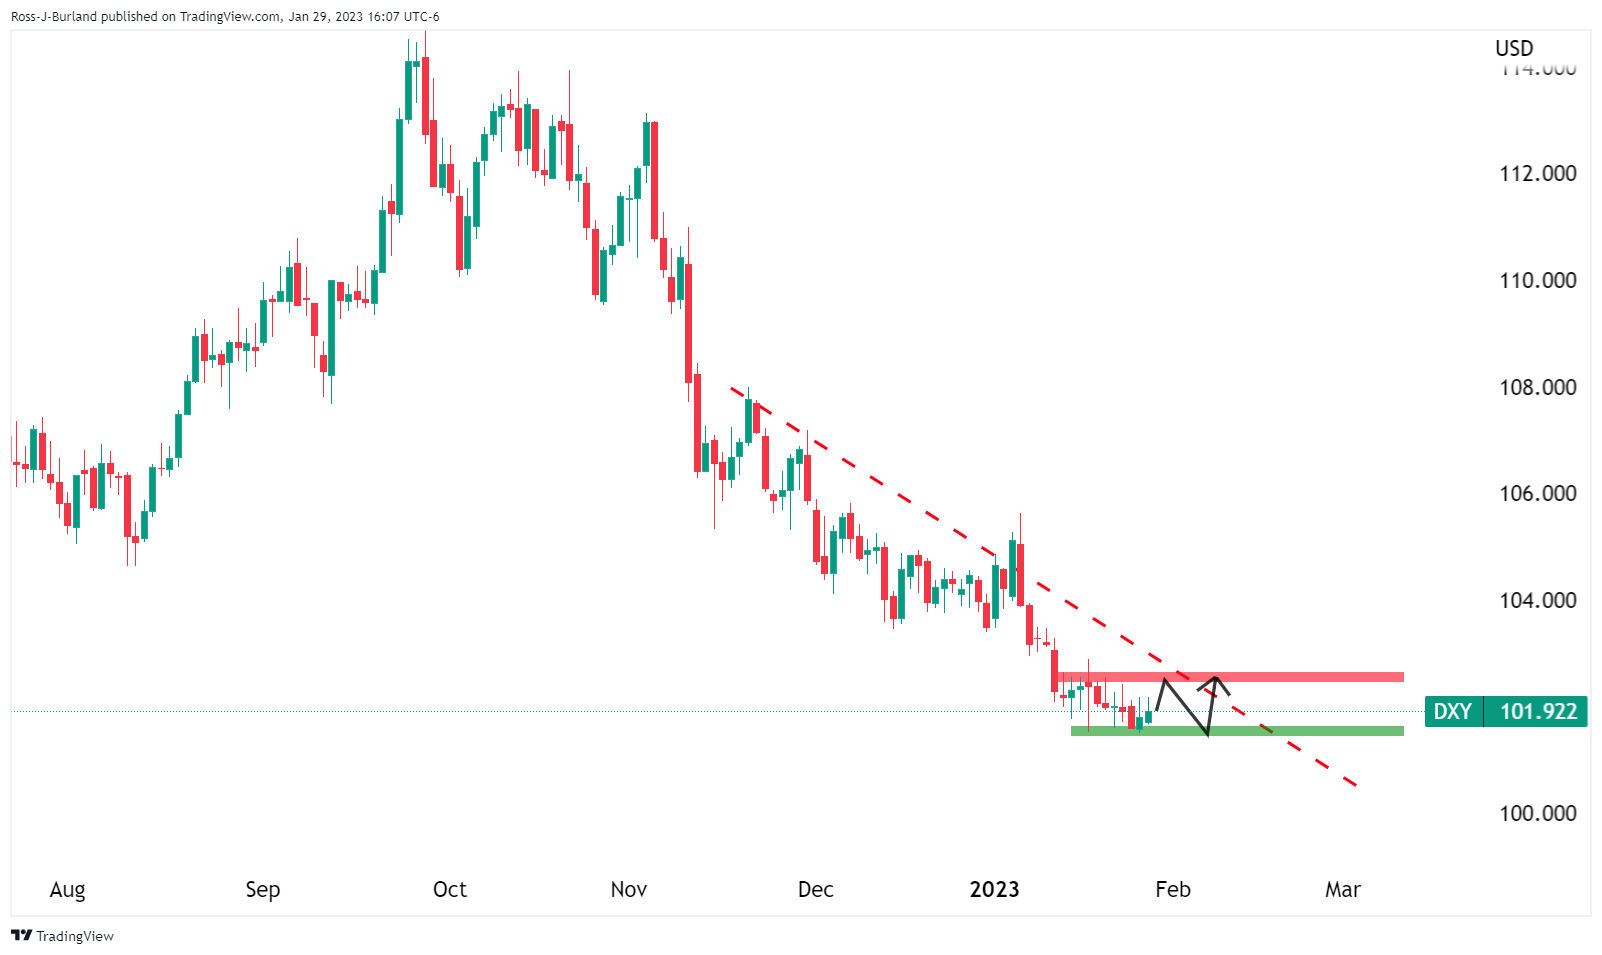
DXY is trapped between support and resistance in the front side of the daily bearish trend. However, should the Fed's communication still emphasize that it is not done yet in terms of tightening its policy stance, signalling that more rate hikes are still in the pipeline, US Dollar volatility could be extreme this week.
-
23:11
EUR/USD faces fragile barricades below 1.0900 ahead of German GDP data
- EUR/USD is looking to extend gains beyond 1.0870 amid the risk-on market mood.
- A decline in the US core PCE price index has strengthened the expectations of a smaller rate hike by the Fed.
- German GDP might remain stagnant in the last quarter of CY2022.
The EUR/USD pair is struggling to extend its recovery move above the immediate resistance of 1.0870 in the early Tokyo session. The major currency pair delivered a rebound move from the previous week’s low around 1.0840 amid a restricted upside in the US Dollar index (DXY).
The USD Index failed in delivering a break above the critical resistance of 101.80 as the United States Bureau of Economic Analysis reported a decline in the annual Federal Reserve (Fed)’s preferred inflation tool- core Personal Consumption Expenditure (PCE) Price Index (Dec) to 4.4% from the former release of 4.7%. However, the monthly PCE price index data escalated to 0.3% from the expectations and the prior release of 0.2%.
A decline in the core PCE data was already expected by the market participants considering the drop in the Consumer Price Index (CPI) and the Producer Price Index (PPI) for December month. This has bolstered the odds of a smaller interest rate hike by the Fed in its February monetary policy meeting, which is scheduled for Wednesday.
Investors’ risk appetite is solid as risk-perceived assets like S&P500 futures ended Friday and last week with significant gains. The 500-US stock basket posted gains straight for the third week despite softening demand. Meanwhile, the 10-year US Treasury yields managed to sustain above the critical resistance of 3.50%.
On the Eurozone front, investors will deliver a decent action after the release of the preliminary German Gross Domestic Product (GDP) (Q4) data on Monday. The economic data on a quarterly basis is seen at 0% lower than the prior figure of 0.4%. European Central Bank (ECB) policymakers have been reiterating that the ECB might face a slight recession, however, the odds of a deep recession have been trimmed considering the resilience in the economy due to the tight labor market and easing supply chain bottlenecks.
This week, the major focus will be on the interest rate decision by ECB President Christine Lagarde, which is scheduled for Thursday. As per the consensus, the ECB might hike the interest rates by 50 basis points (bps) to 2.50%.
-
23:00
PBoC to roll over lending tools to spur growth
Reuters reported that the People's Bank of China will roll over a lending tool for supporting carbon emission reduction to the end of 2024, The PBoC will also extend a re-lending tool for promoting the clean use of coal to the end of 2023.
''The move to extend the lending tools will help "precisely and effectively implement the prudent monetary policy, guide financial institutions to increase support for green development and other areas", the central bank said.
''Since 2020, when the world's second-largest economy was first jolted by the coronavirus, the central bank has expanded its arsenal of structural policy tools, including re-lending and rediscount facilities and other low-cost loans.''
''he central bank is poised to ramp up targeted support for troubled sectors through its structural policy tools, according to policy sources and analysts.''
-
22:56
AUD/USD Price Analysis: Inside day Friday opens risk of a lower close on Monday, 0.7050 eyed
- If Asia opens on the offer then a downside extension to test the previous day's lows near 0.7080 and then 0.7070 is eyed.
- There are risks of a move towards 0.7050 for the initial balance for the week.
- The daily average true range is around 80 pips, so a move much higher than 0.7130 would not be expected from a bearish perspective.
AUD/USD was the best performer for the G7 last week and AUD/USD bulls could be trapped up high for the week ahead which holds a number of key data events. The following illustrates a bearish bias for the initial balance of the week, Monday with 0.7050 eyed.
AUD/USD H1 chart
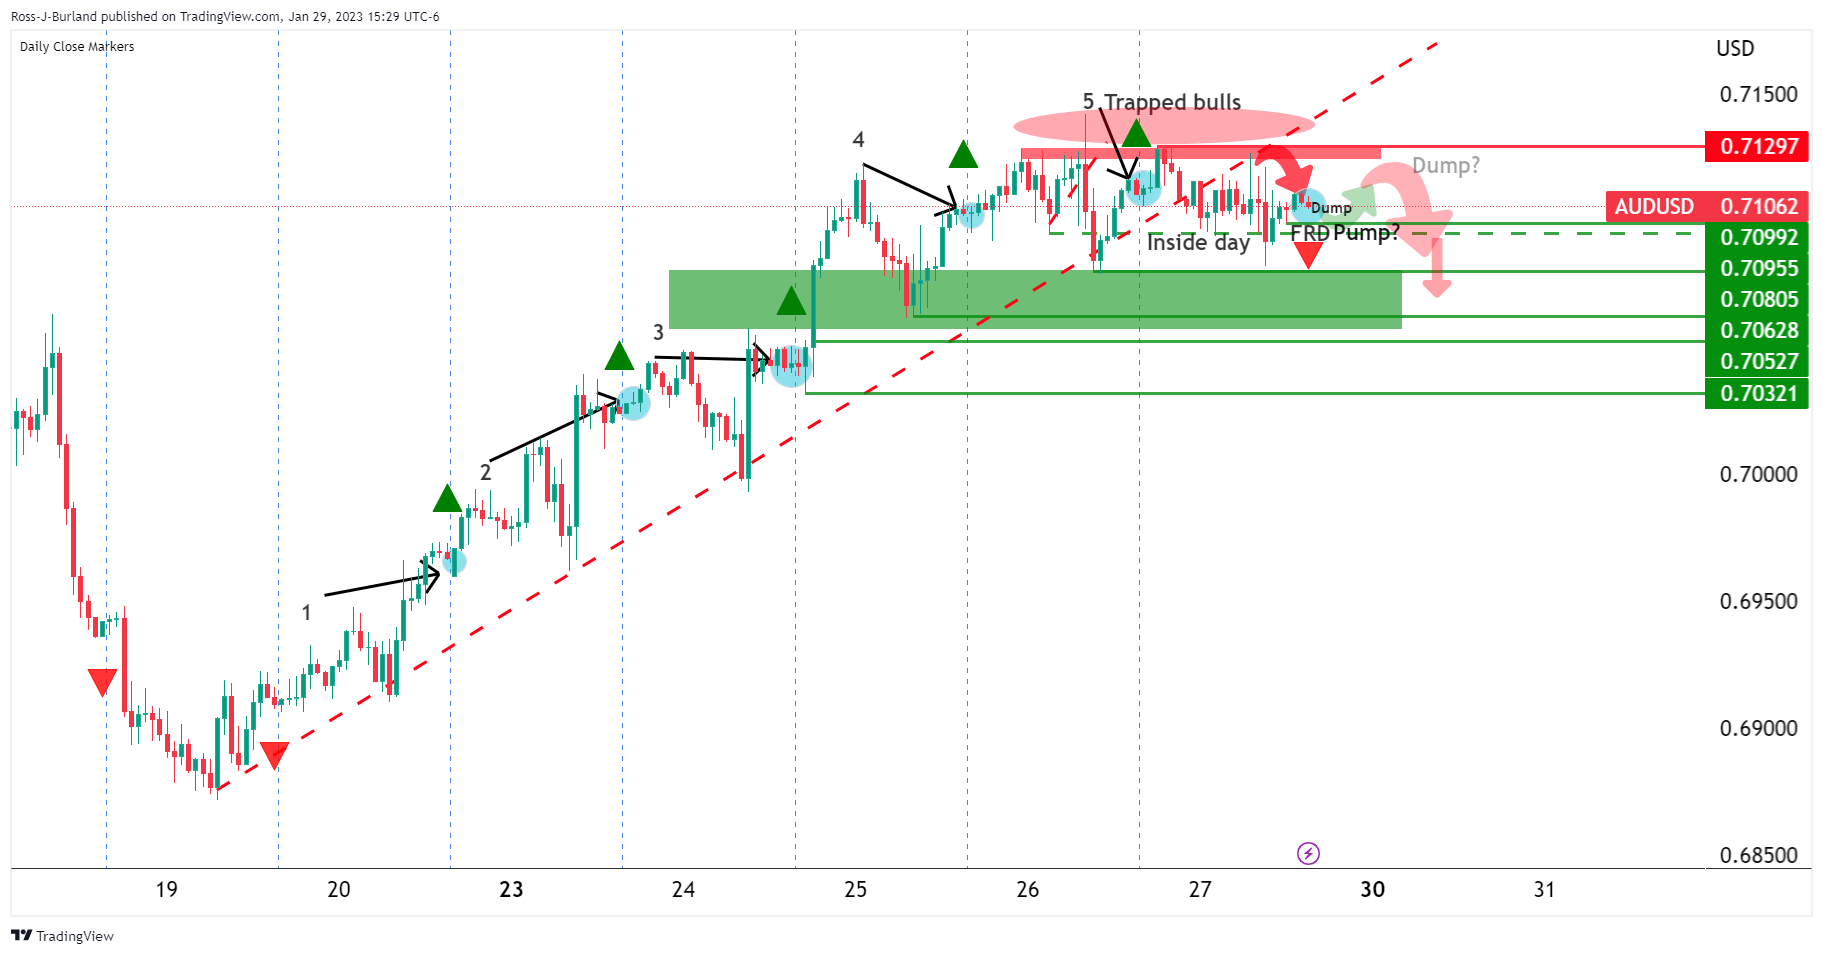
As per the above daily template on the hourly chart, we can see that the pair is consolidating at the top of 5 days of higher closes followed by the first red day, FRD, on Friday. An FRD is usually followed by a second, or third day of bearish closes which gives the bias for the day ahead, down. This can serve to help traders identify higher probability trade setups as they plan for the day, if not the day's ahead. In this particular scenario, Friday closed as an inside day. Inside days are often followed by a breakout of the highs or lows, one way or another.
During the last hours of Friday's business, there was a pump up from the lows of the day (that followed the dump) as follows:
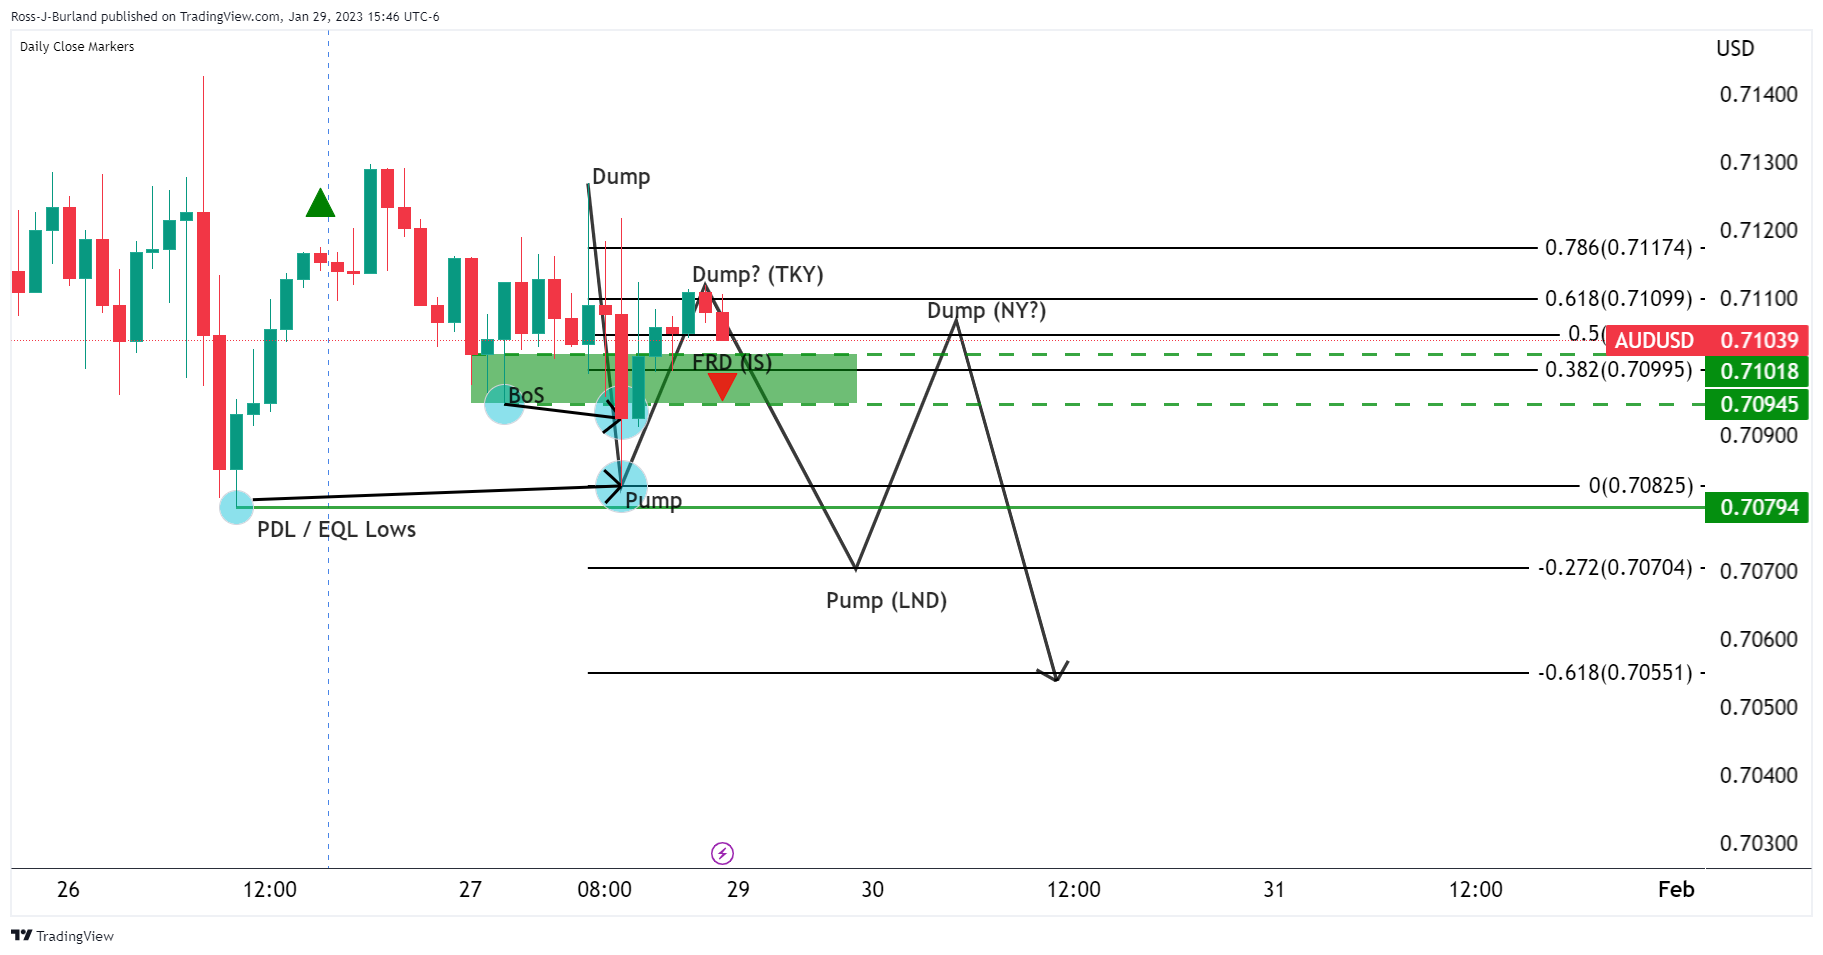
As illustrated, the break of structure, BoS, around 0.7100 was followed by a correction, the pump, into a 61.8% Fibonacci retracement that has acted as resistance on a stop hunt above 0.7100. This could be the makings of the opening dump in Asia.
If Asia opens on the offer then a downside extension to test the previous day's lows near 0.7080 with eyes lower to 0.7070 (-272% Fibo). This is where bulls would be expected to engage in London to move into the Asian session's range and if the day is going to close lower then New York traders will be looking to fade the market on tests of 0.7100 and a close below Friday's close of 0.7108.
This leaves risks of a move towards 0.7050 for the initial balance for the week. The daily average true range is around 80 pips, so a move much higher than 0.7130 would not be expected whereas 0.7050 is eyed in this bearish thesis.
-
22:46
New Zealand Trade Balance NZD (YoY) rose from previous $-14.63B to $-14.46B in December
-
22:46
New Zealand Trade Balance NZD (MoM): $-475M (December) vs $-1863M
-
22:46
New Zealand Imports fell from previous $8.54B to $7.19B in December
-
22:46
New Zealand Exports climbed from previous $6.68B to $6.72B in December
-