Noticias del mercado
-
23:52
EUR/USD Price analysis: Bulls eye an upside continuation towards 1.1070
- EUR/USD is holding up at a 38.2% Fibonacci retracement level
- Bulls could be in play for the opening sessions.
A subsequent upside continuation is a bias for the open.
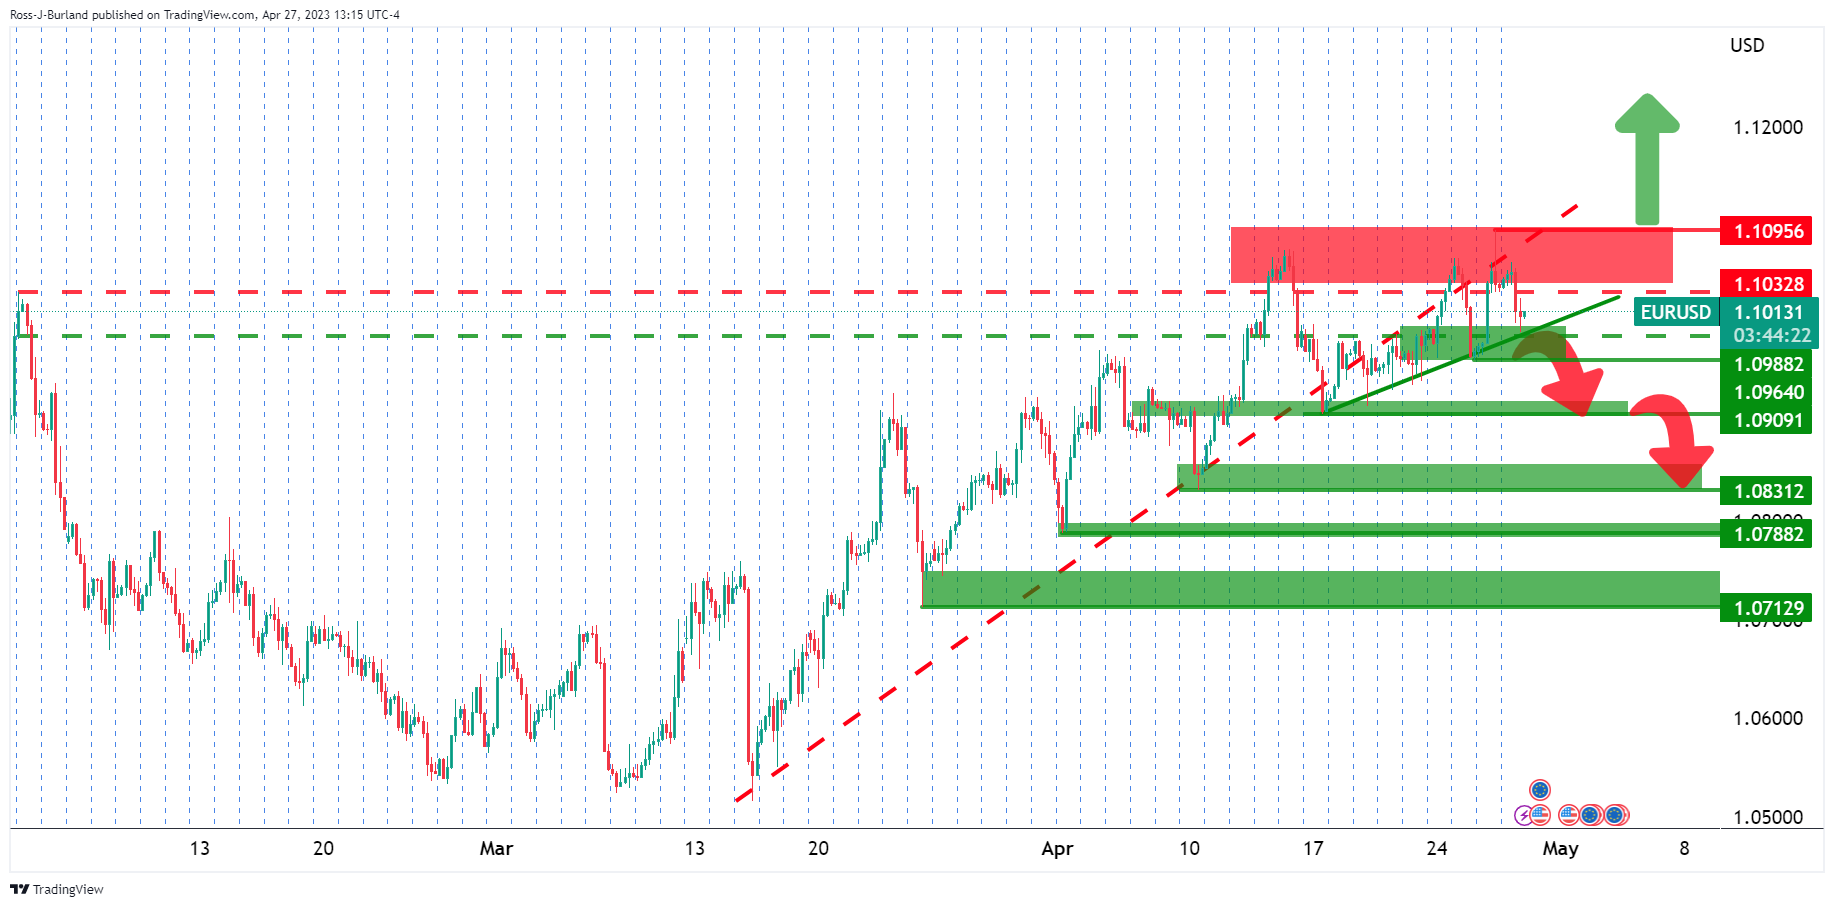
As per the prior analysis, EUR/USD Price Analysis: Bears are moving in and eye a run on length, EUR/USD ran into the 1.0960s and support structure as the following will illustrate.
EUR/USD H4 charts
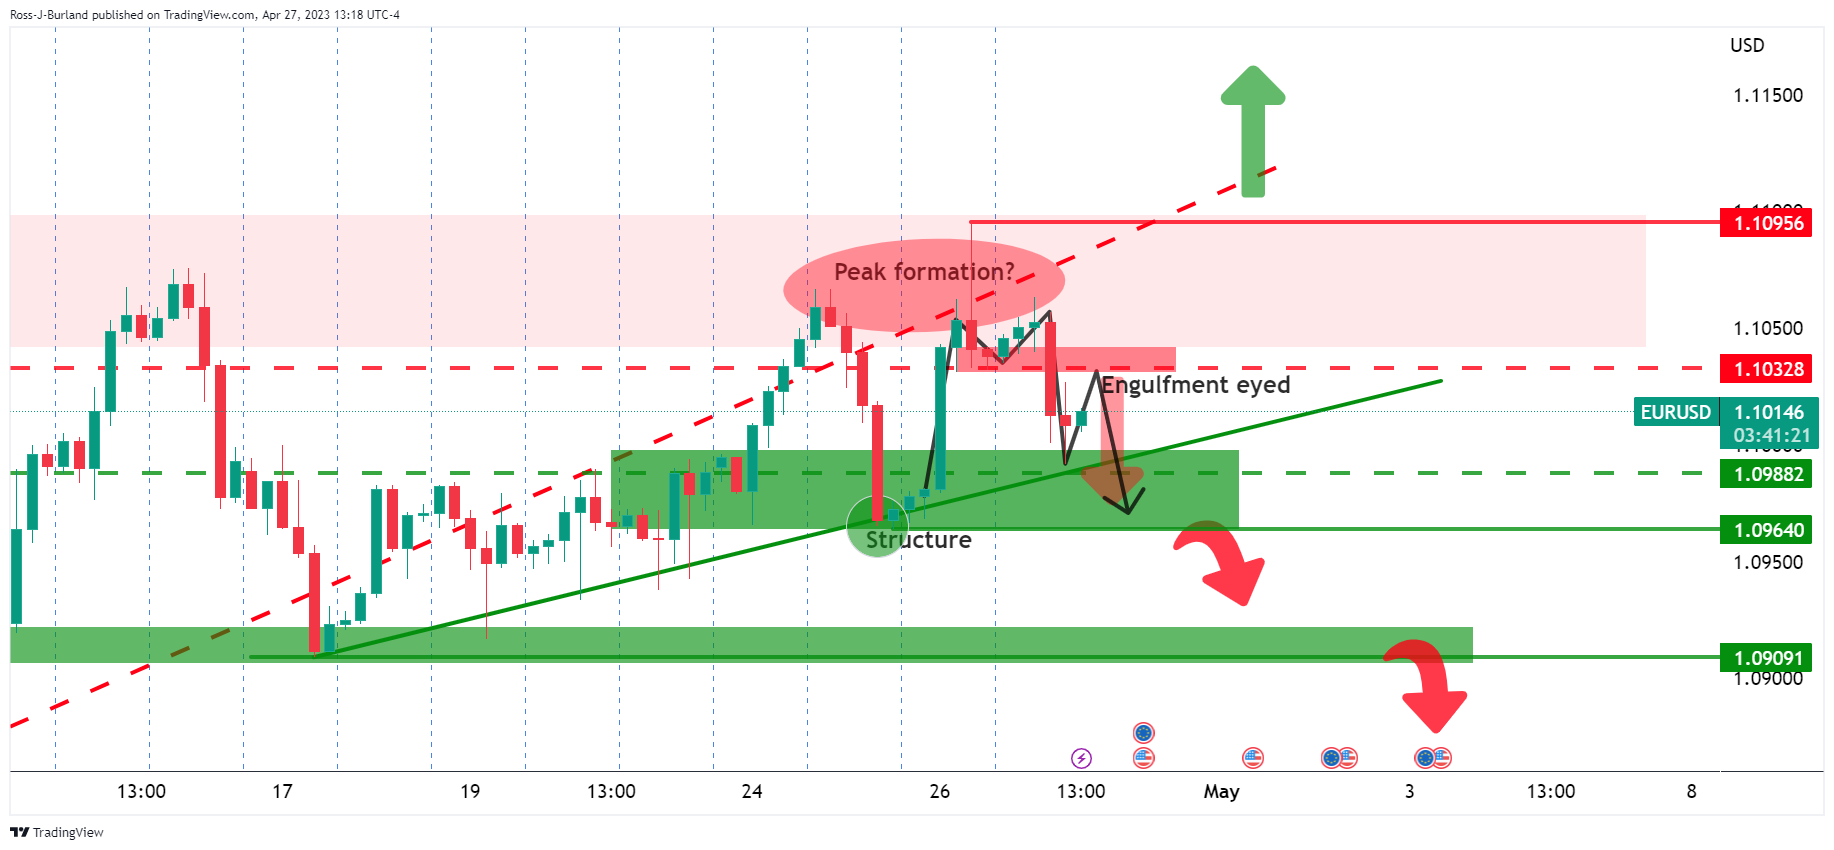
Zooming into the 4-hour charts, we had the M-formation with a test of the neckline resistance near the 1.1030s eyed before a strong test of the trendline support. An engulfment was eyed.
EUR/USD H1 chart
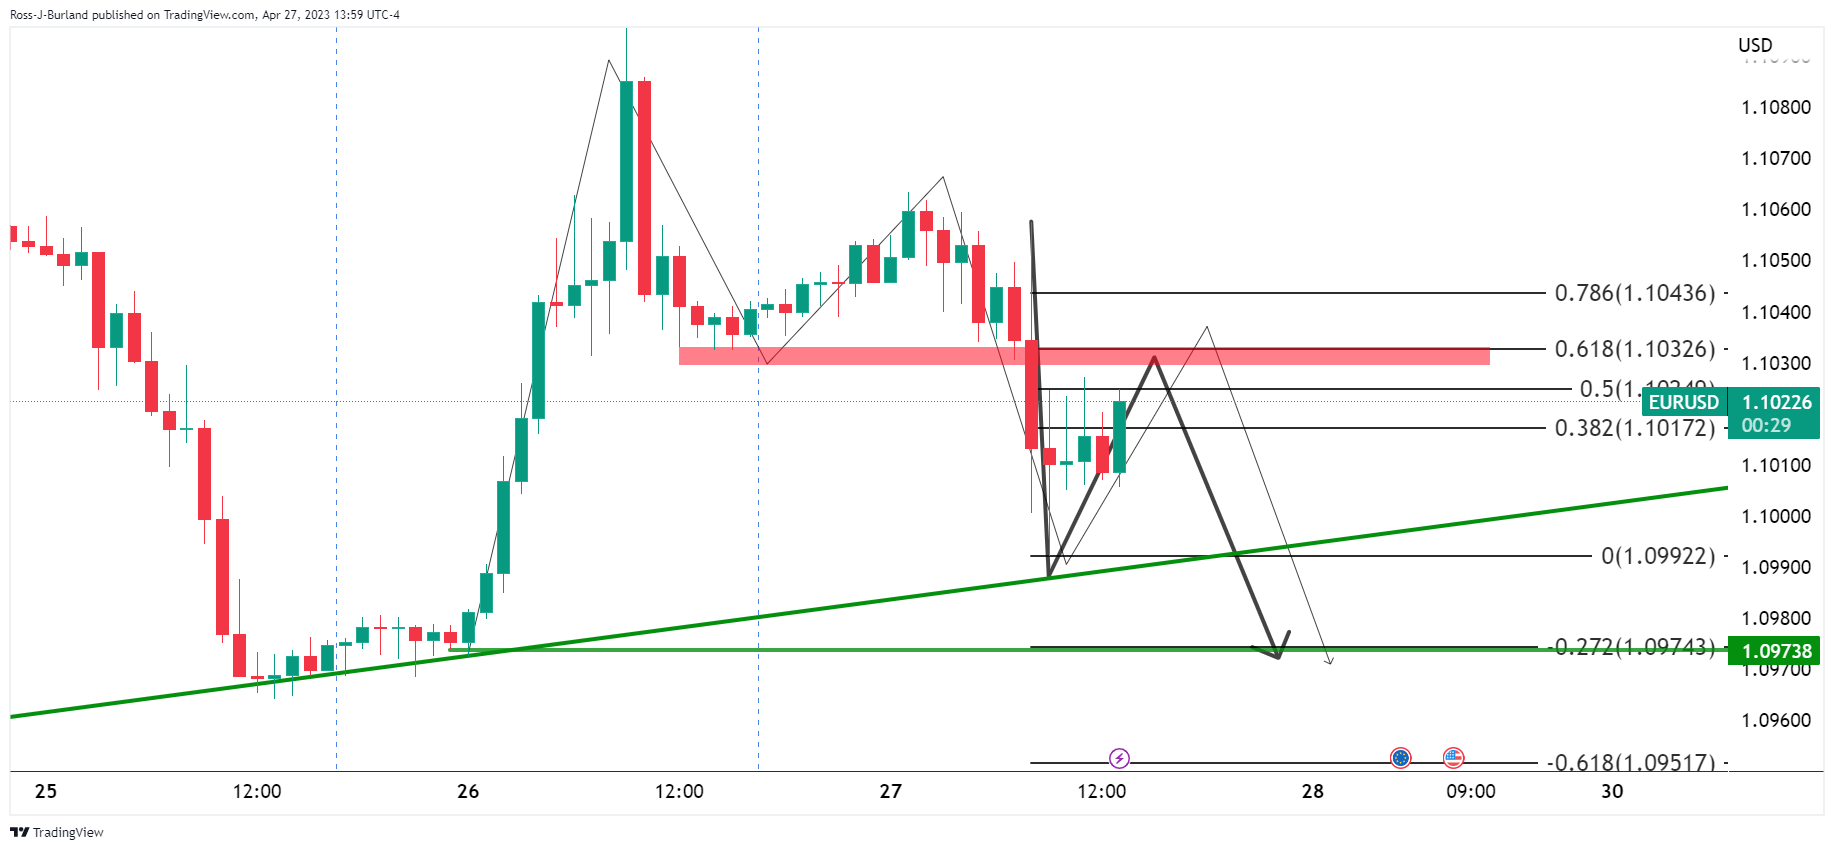
On the hourly chart, the thesis was playing out. A 61.8% Fibonacci retracement met the neckline resistance. Everything above was trapped volume, so the long squeeze thesis was a reasonable one into 1.0950s stops and the week´s lows.
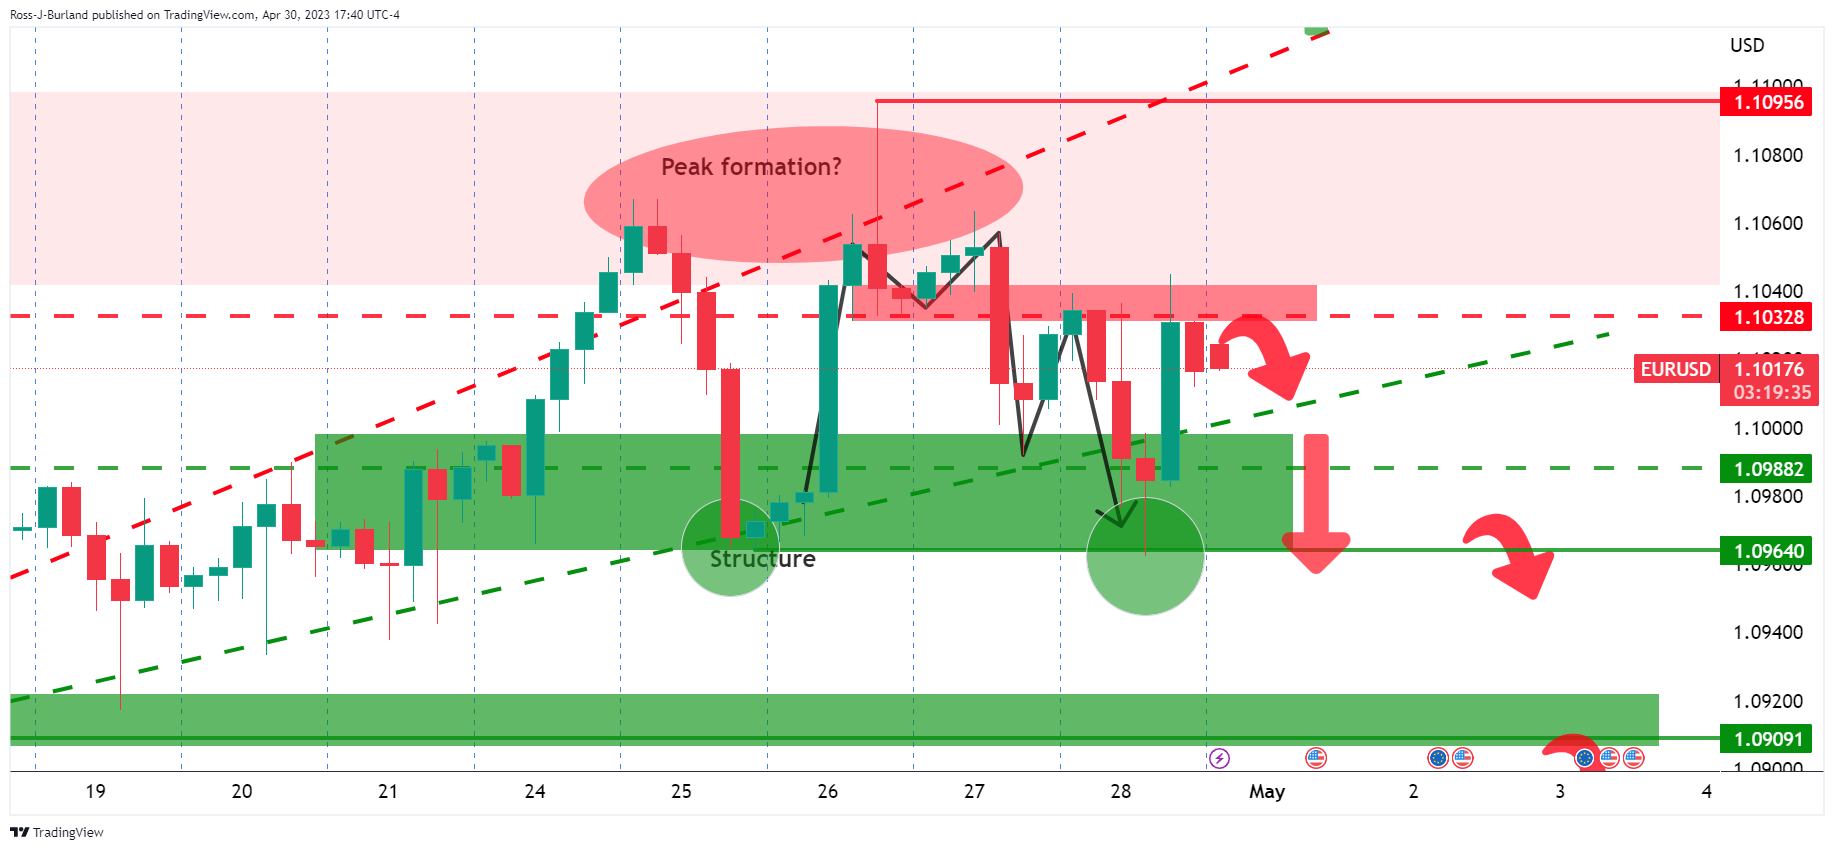
EUR/USD week template, M15 chart
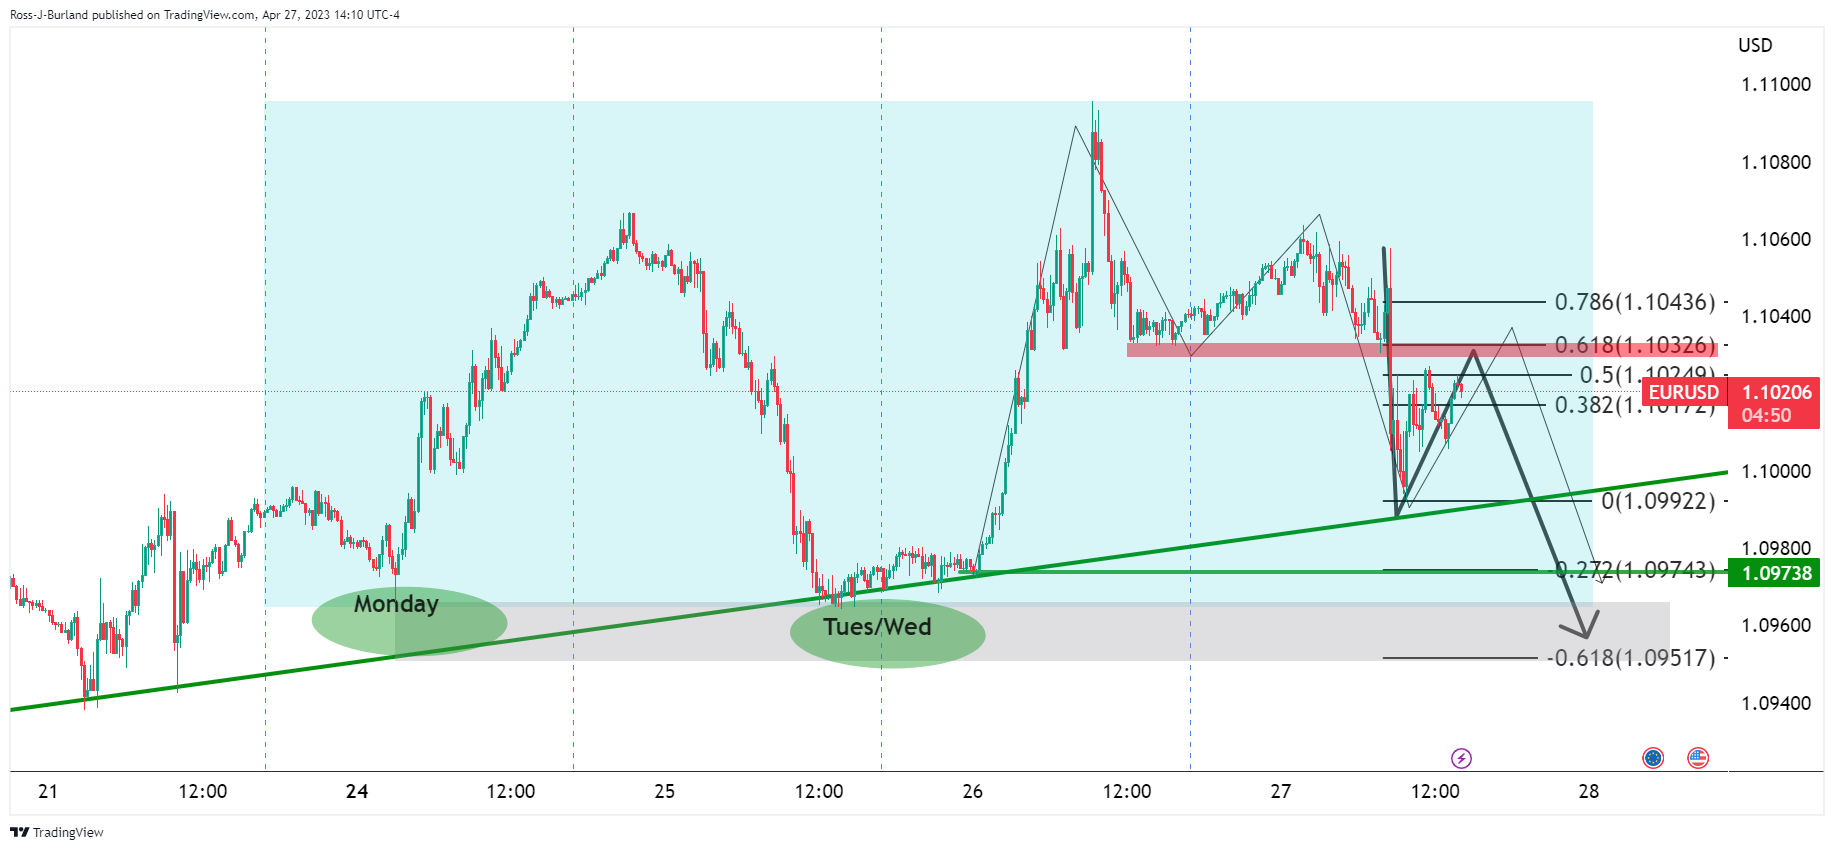
Monday and mid-week longs were still in the money with stop losses below eyed.
EUR/USD update
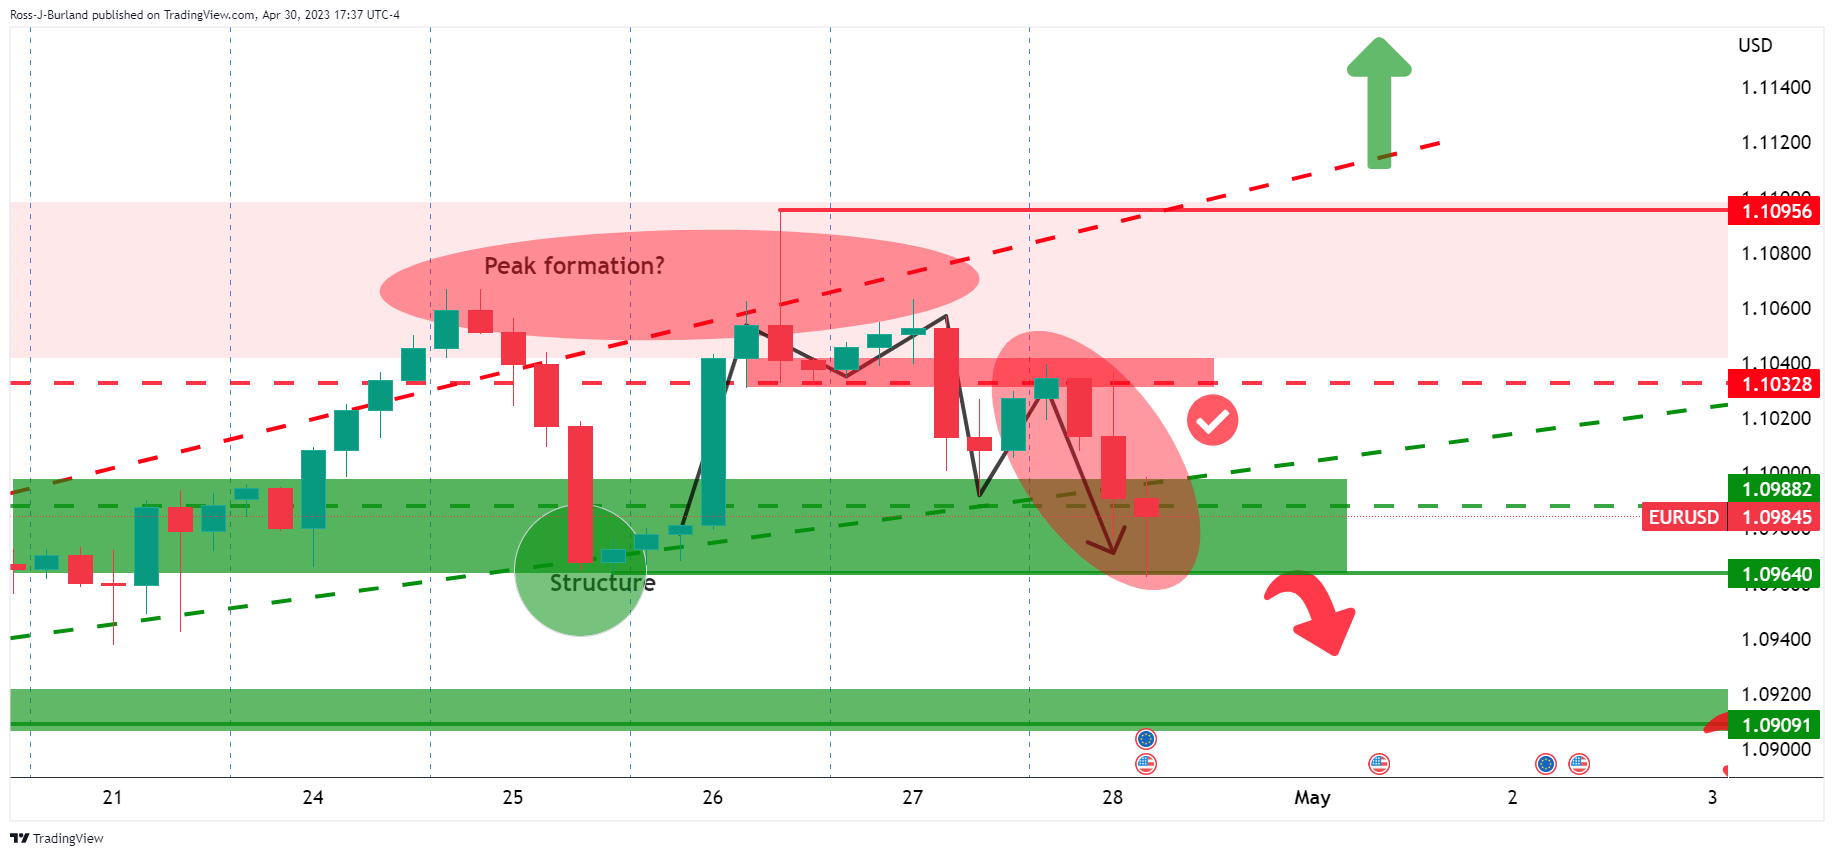
The price has moved back into the peak formation following the move to test the structure. This leaves the outlook neutral for the days ahead while the price is trapped between horizontal resistance and support. However ...
EUR/USD H1 chart
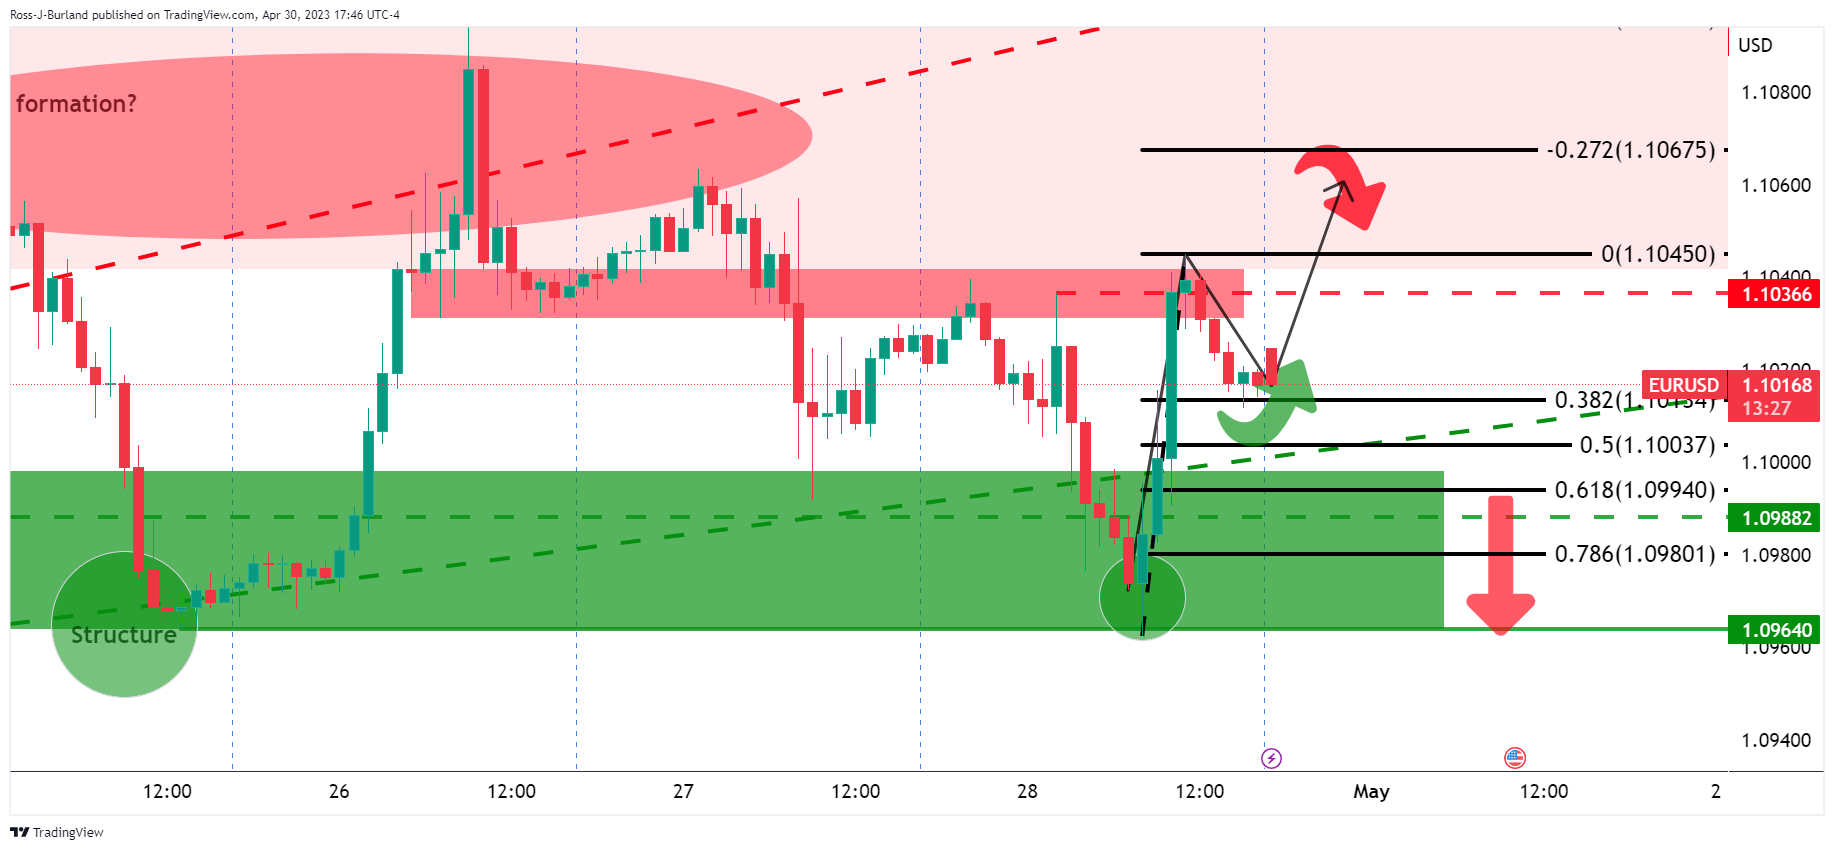
On the hourly chart, we have seen a break of the prior highs and the 38.2% Fibonacci retracement level is acting as support. A subsequent upside continuation is a bias for the open.
-
22:18
AUD/USD Price Analysis: Bears lurking in resistance, eyes on 0.6550s
- AUD/USD bears seeking a move to snap 0.6600.
- 0.6550s are vulnerable on a downside extension.
As per the prior analysis, AUD/USD Price Analysis: Bulls could be lurking at the fresh cycle lows but continuation not off the table, the bulls have indeed started to correct from the fresh lows, but still, the bearish bias persists as the following will illustrate.
AUD/USD prior analysis
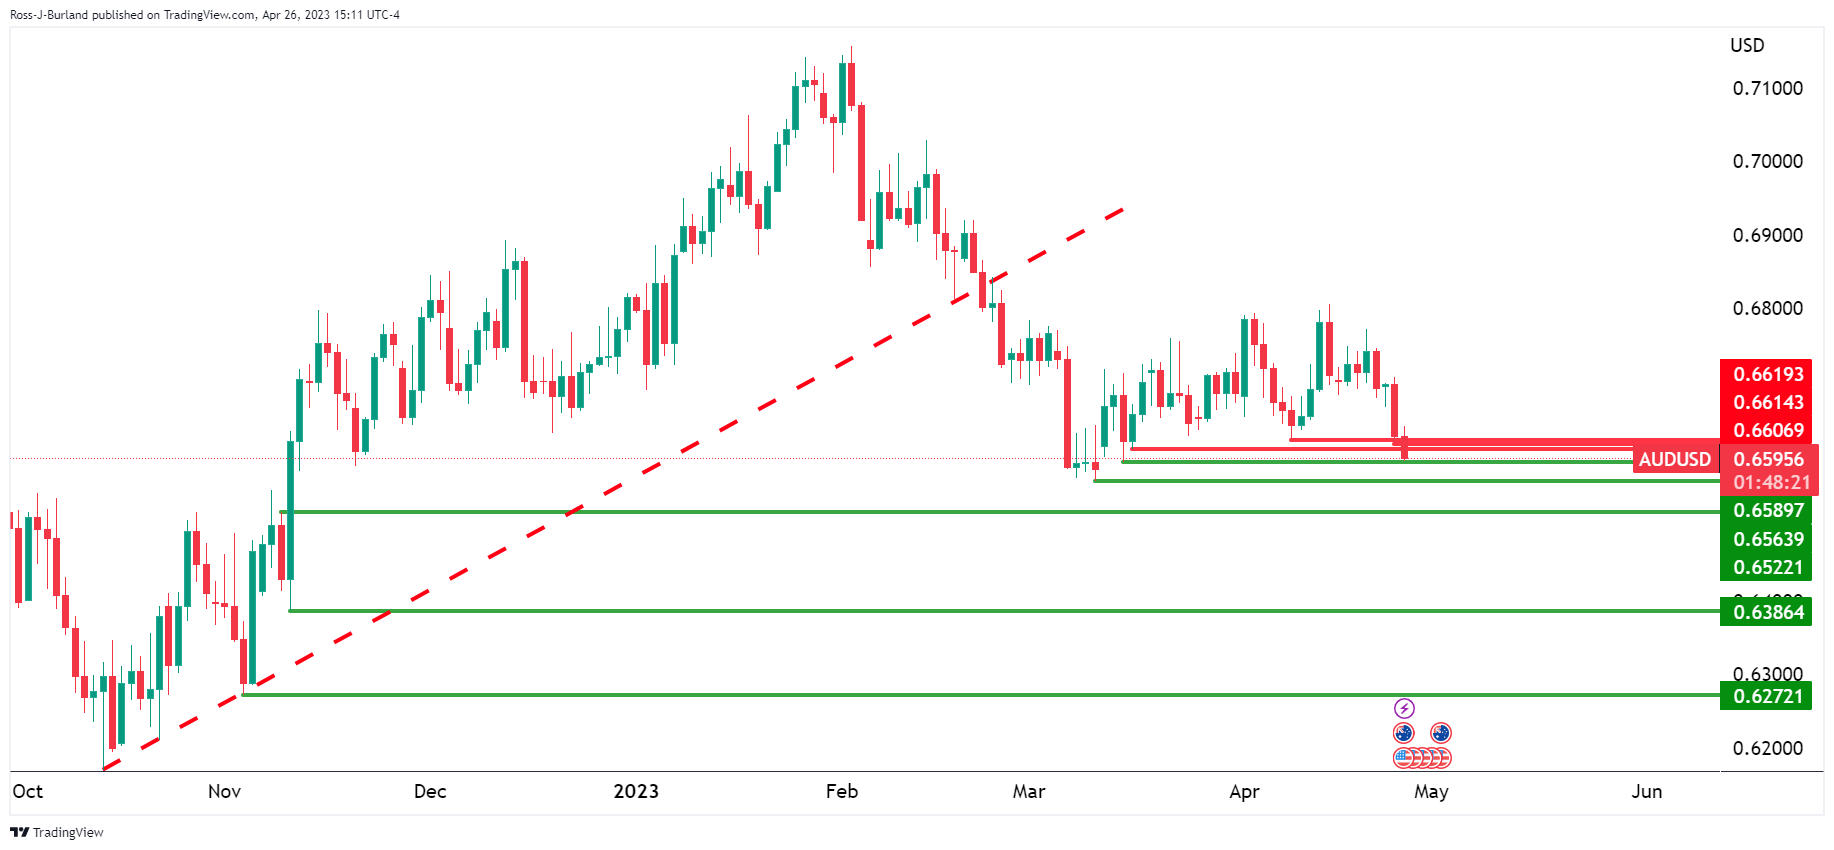
The M-formation on the daily chart was expected to act as the peak formation in a correction and lead to a move lower to break the structure on the downside.
AUD/USD H4 chart
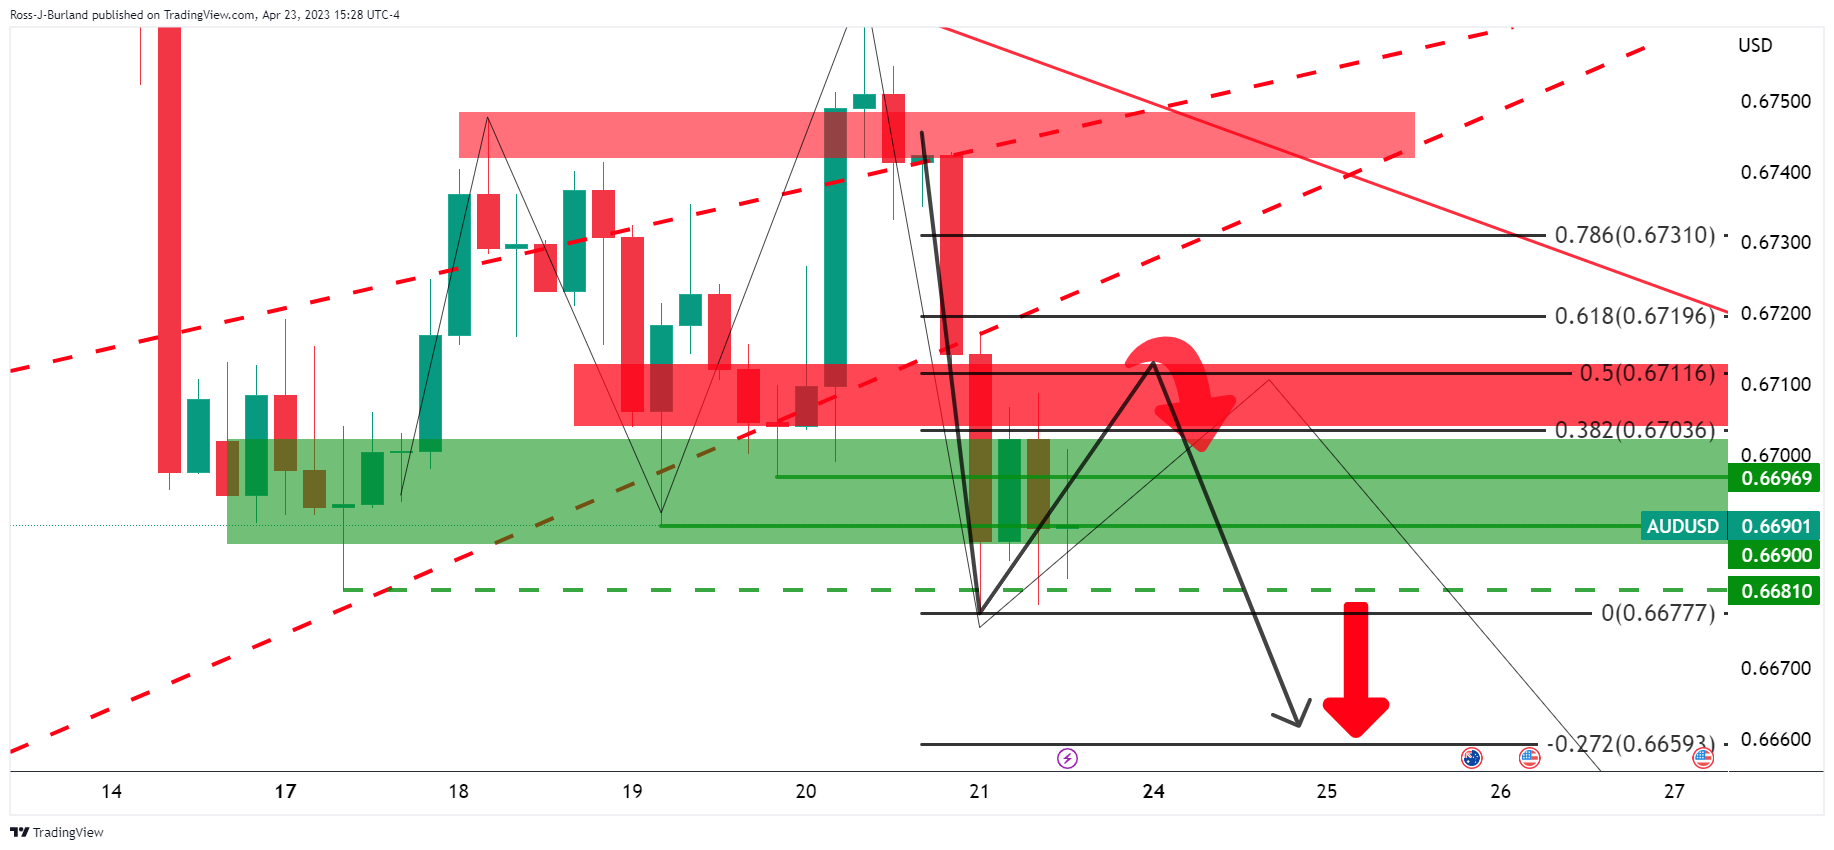
The four-hour chart´s 50% mean reversion level near 0.6710 aligned with the neckline of the pattern that could continue to act as resistance.
The price deteriorated but there had been a lack of momentum in the US Dollar and AUD/USD climbed back into the barroom brawl as follows:
In the bearish thrust, there was a break in structure which left the bias to the downside so long as the bears showed up and guarded the 0.67s.
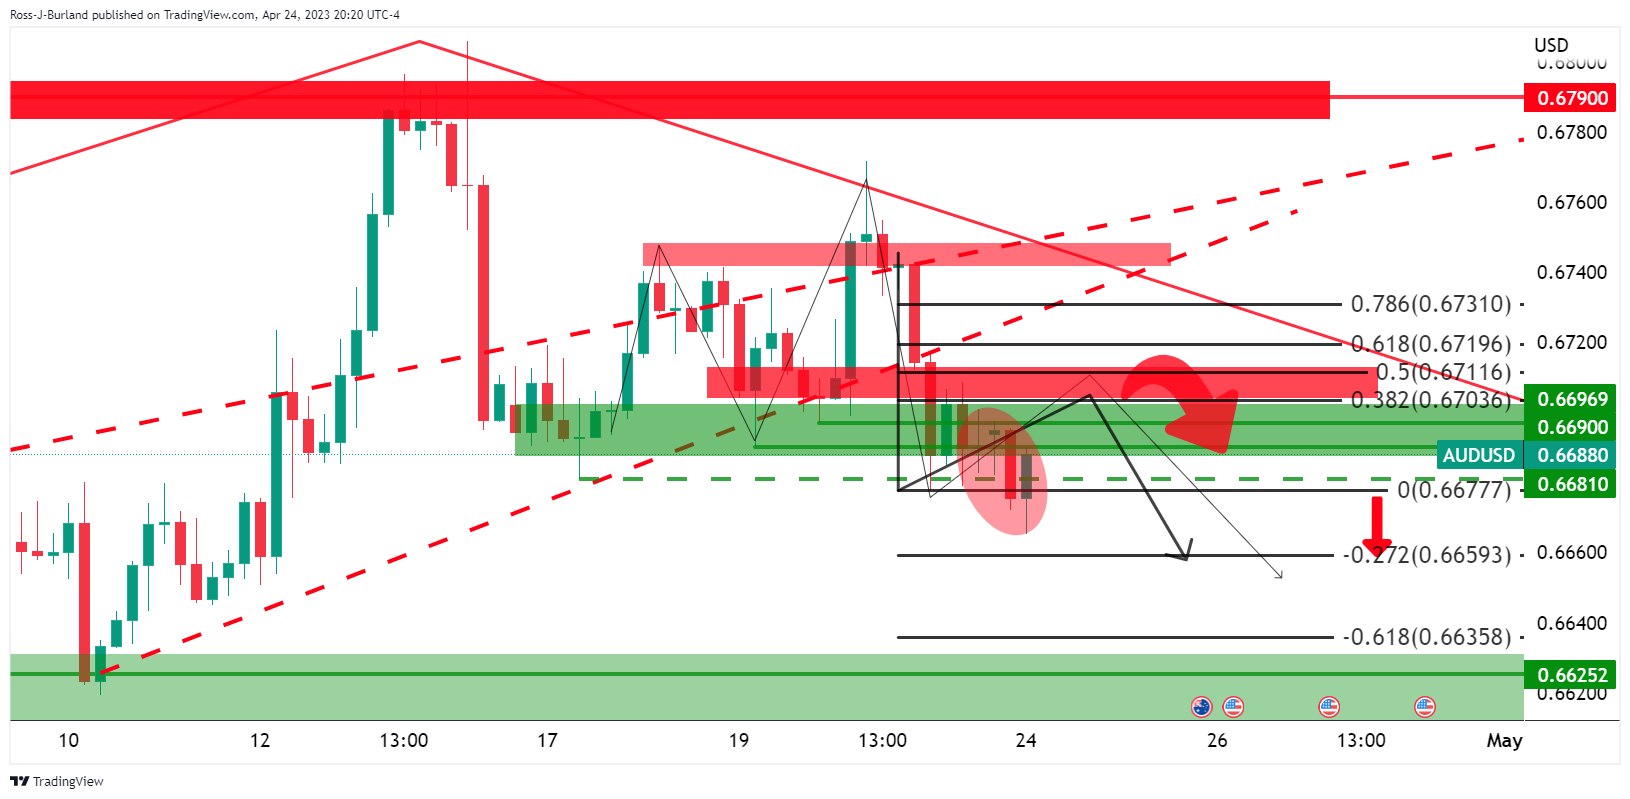
However, there was an adjustment to the daily chart´s Fibonaccis as follows:
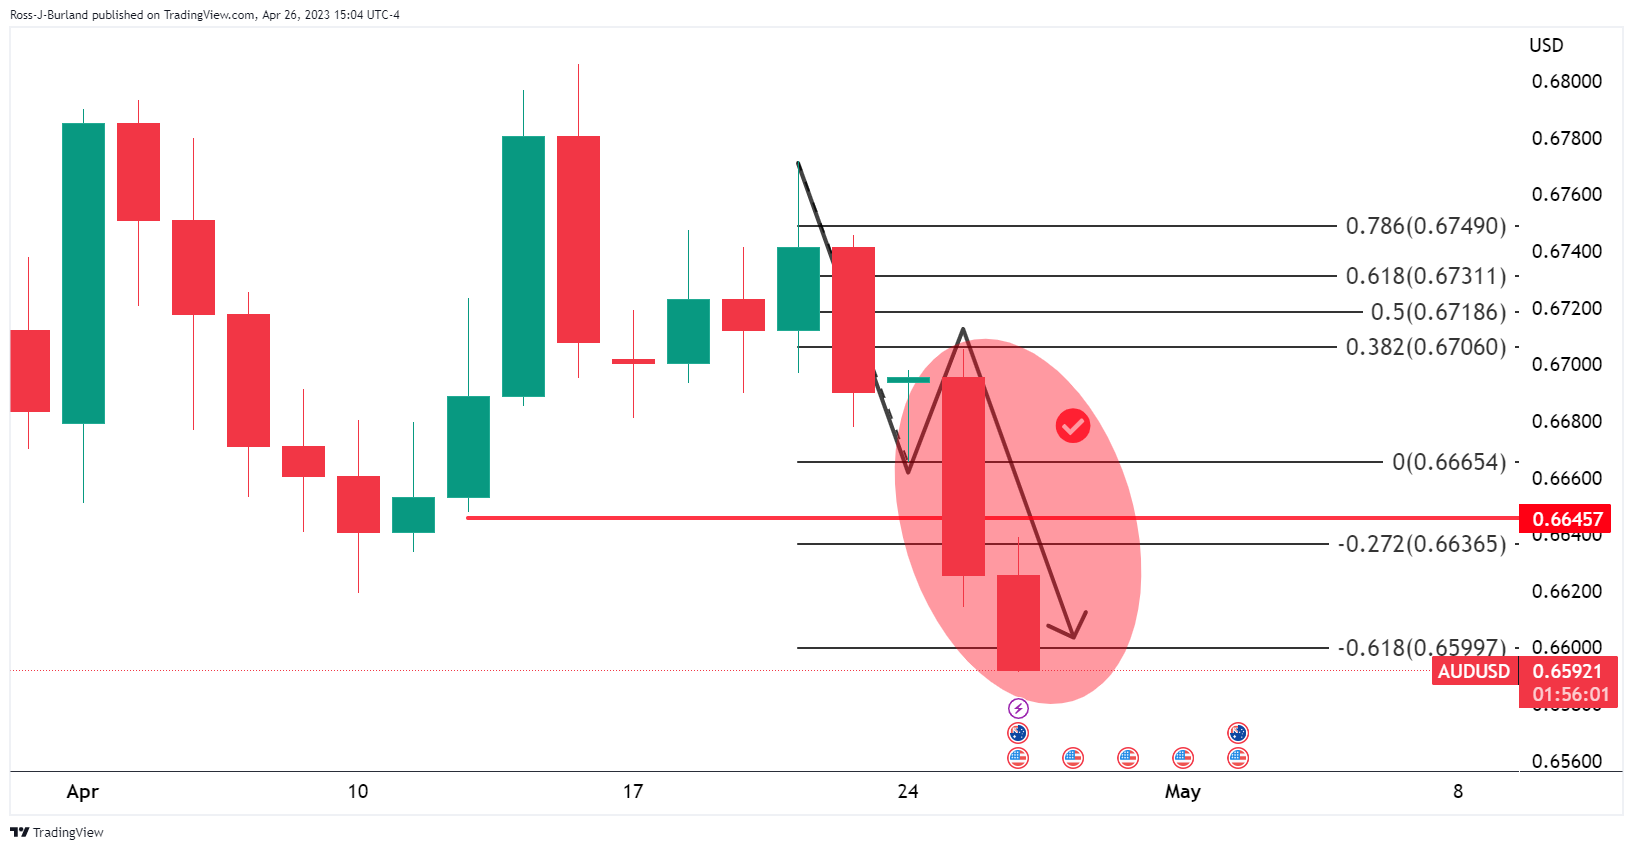
The 38.2% Fibonacci acted as resistance and we got a strong bearish impulse from there to test 0.6600 and the -61.8% Fibo.
There were long positions from below 0.6590 and 0.6560 that were expected to see the market move into and further out:
... there was a lot of downside potential below. However...
If the bulls stepped in, then there were prospects of a correction into prior support near the 38.2% Fibonacci. The 50% mean reversion aligned with the round 0.6650 number also.
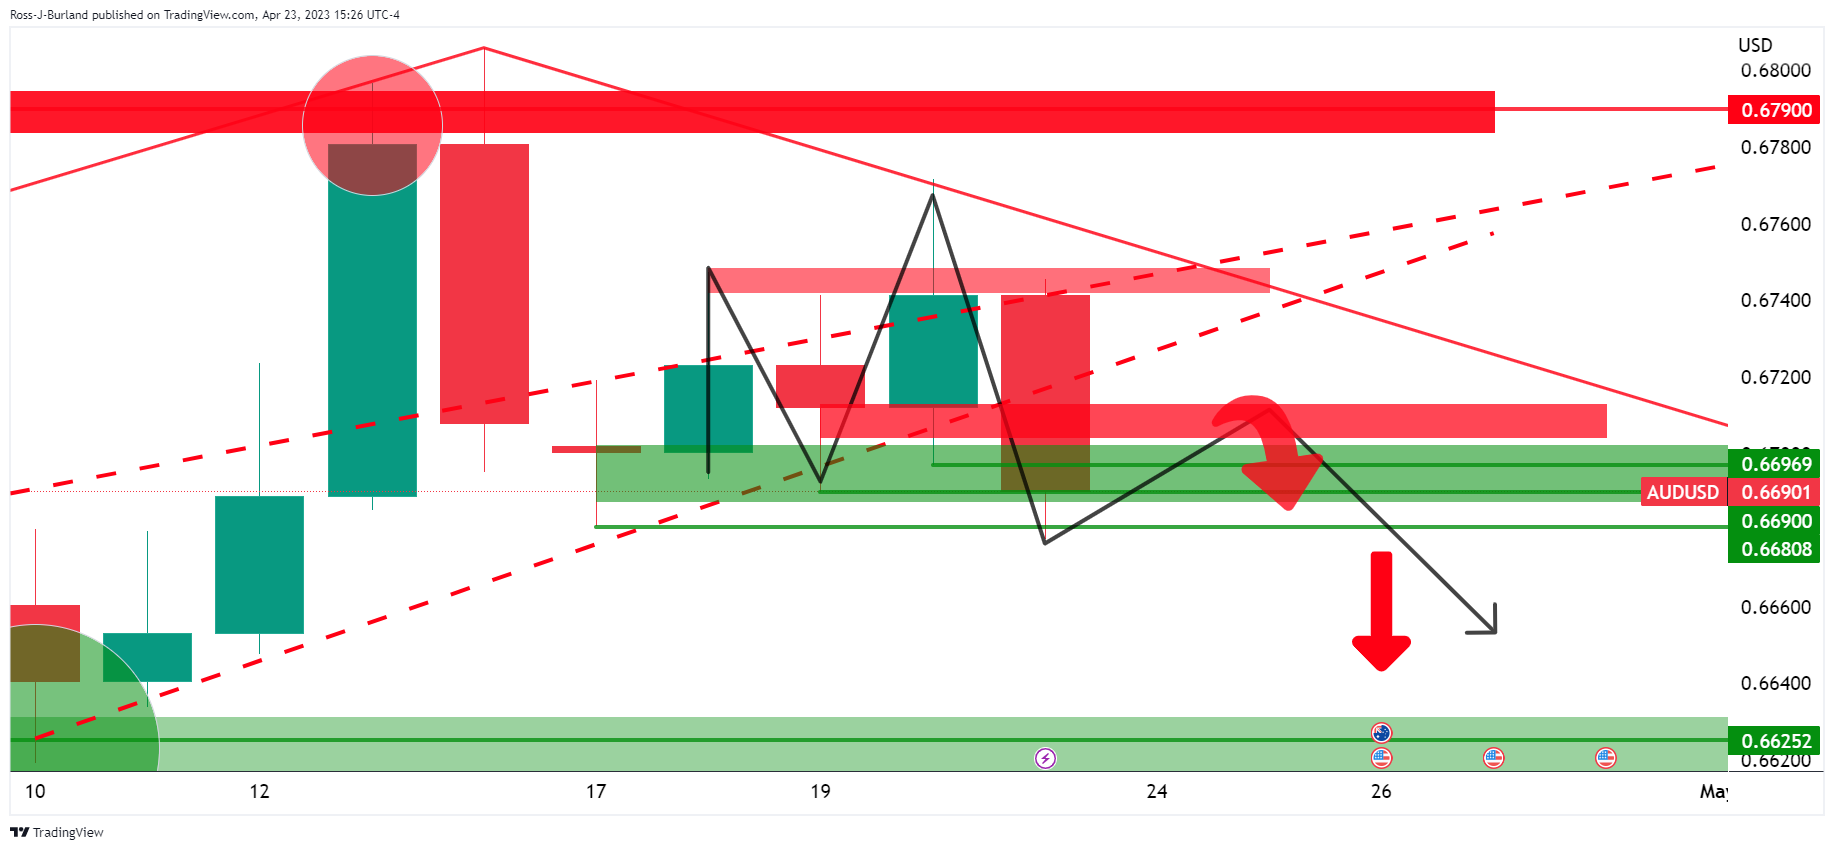
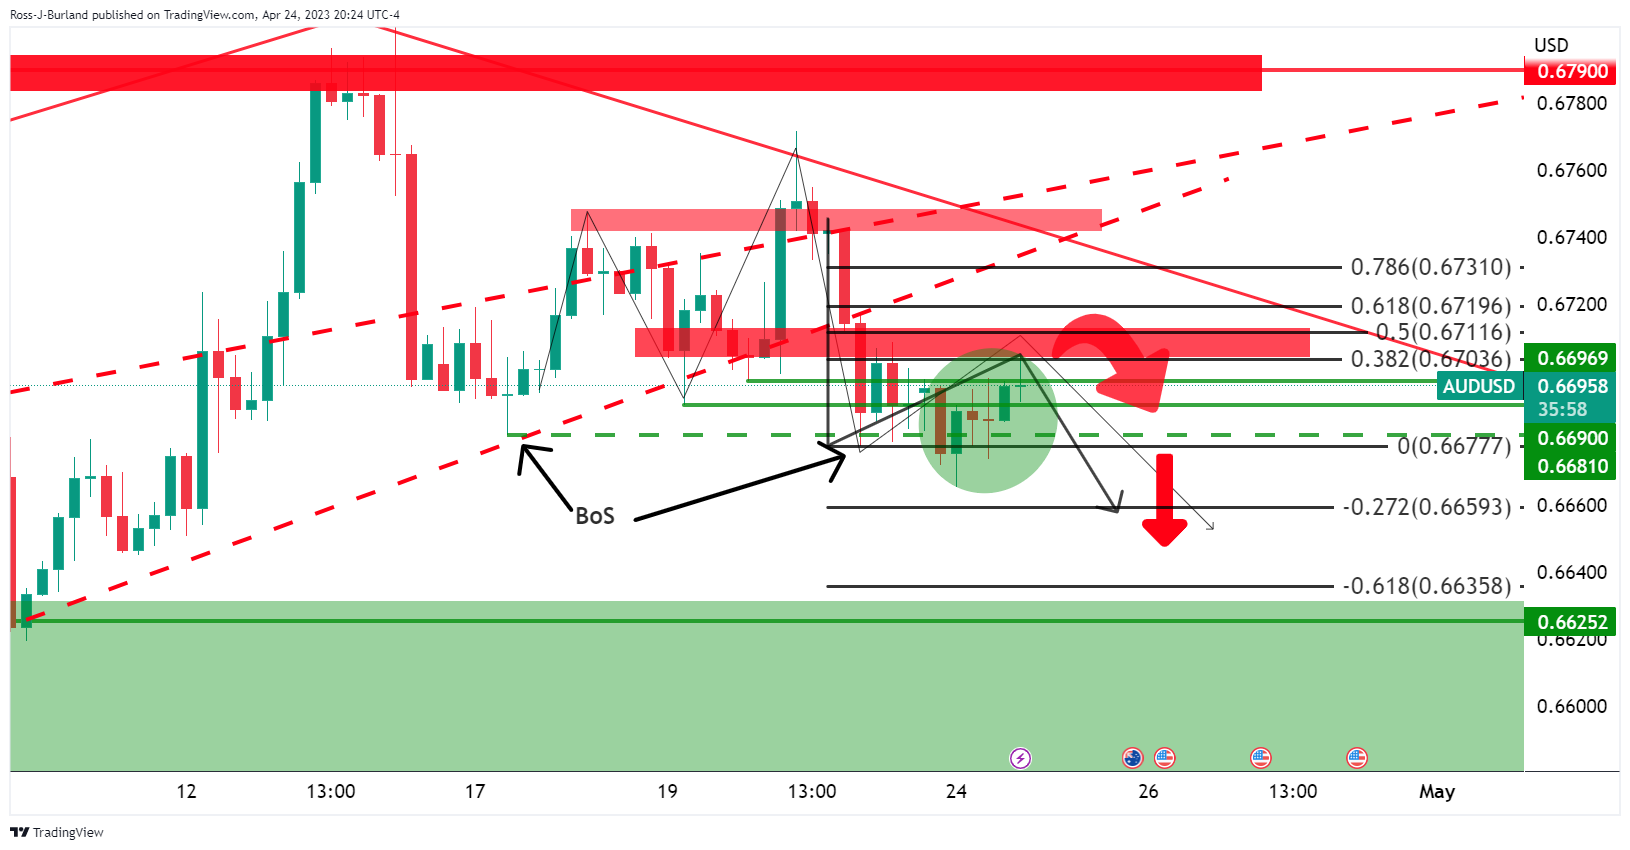
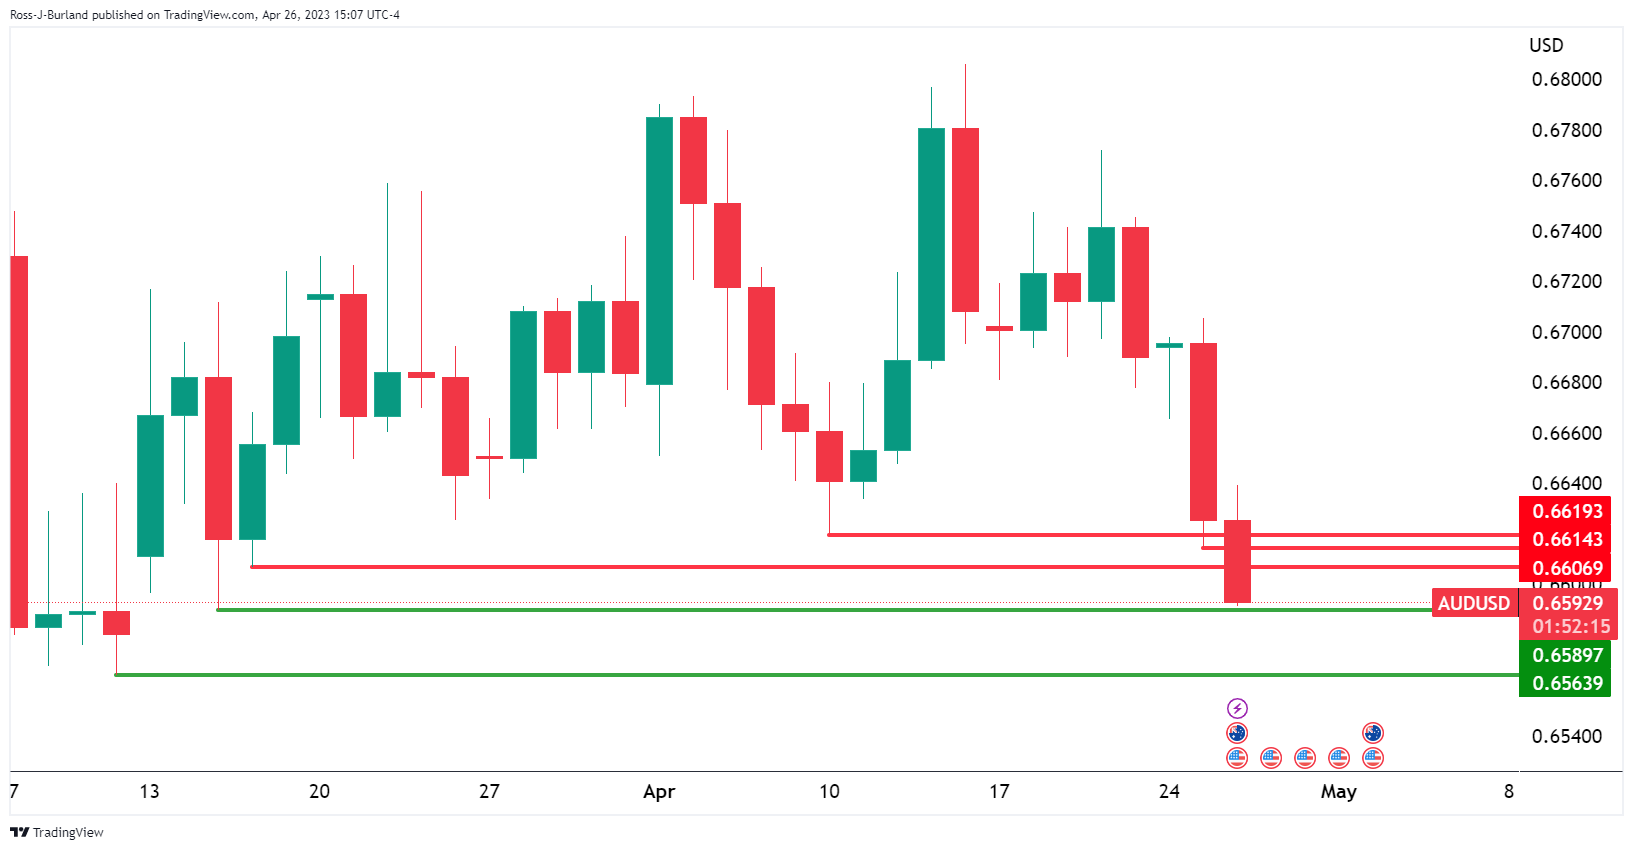
AUD/USD update
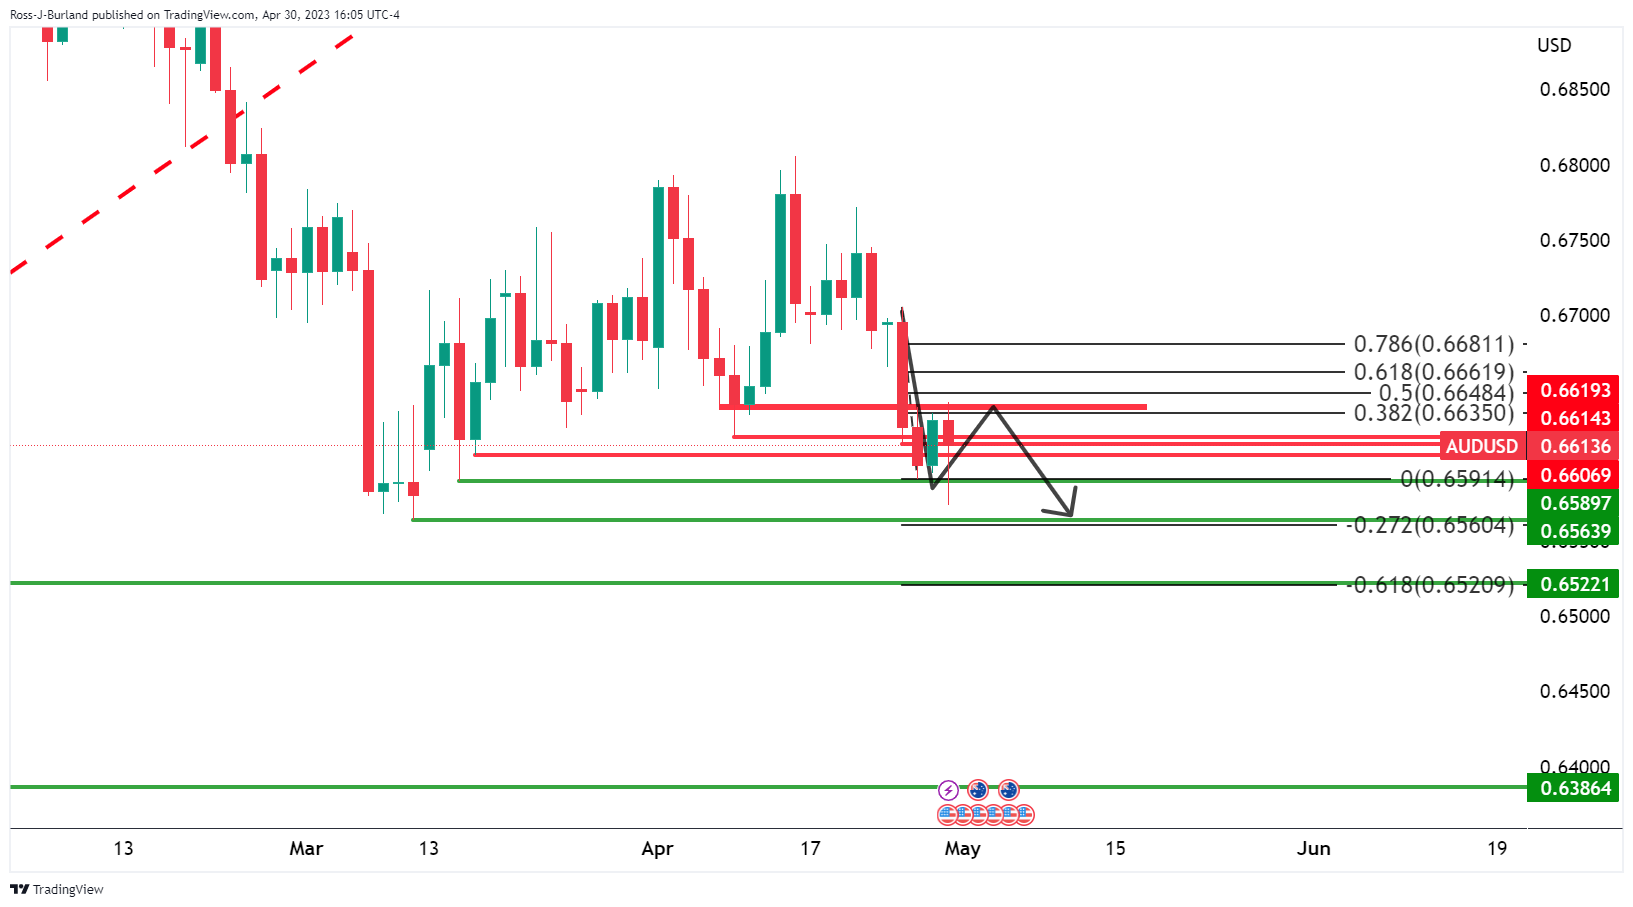
The price has run into the 38.2% Fibonacci so bears can be monitoring for bearish structure to lean against for the a position that will ride the possible downside extension for the days ahead.
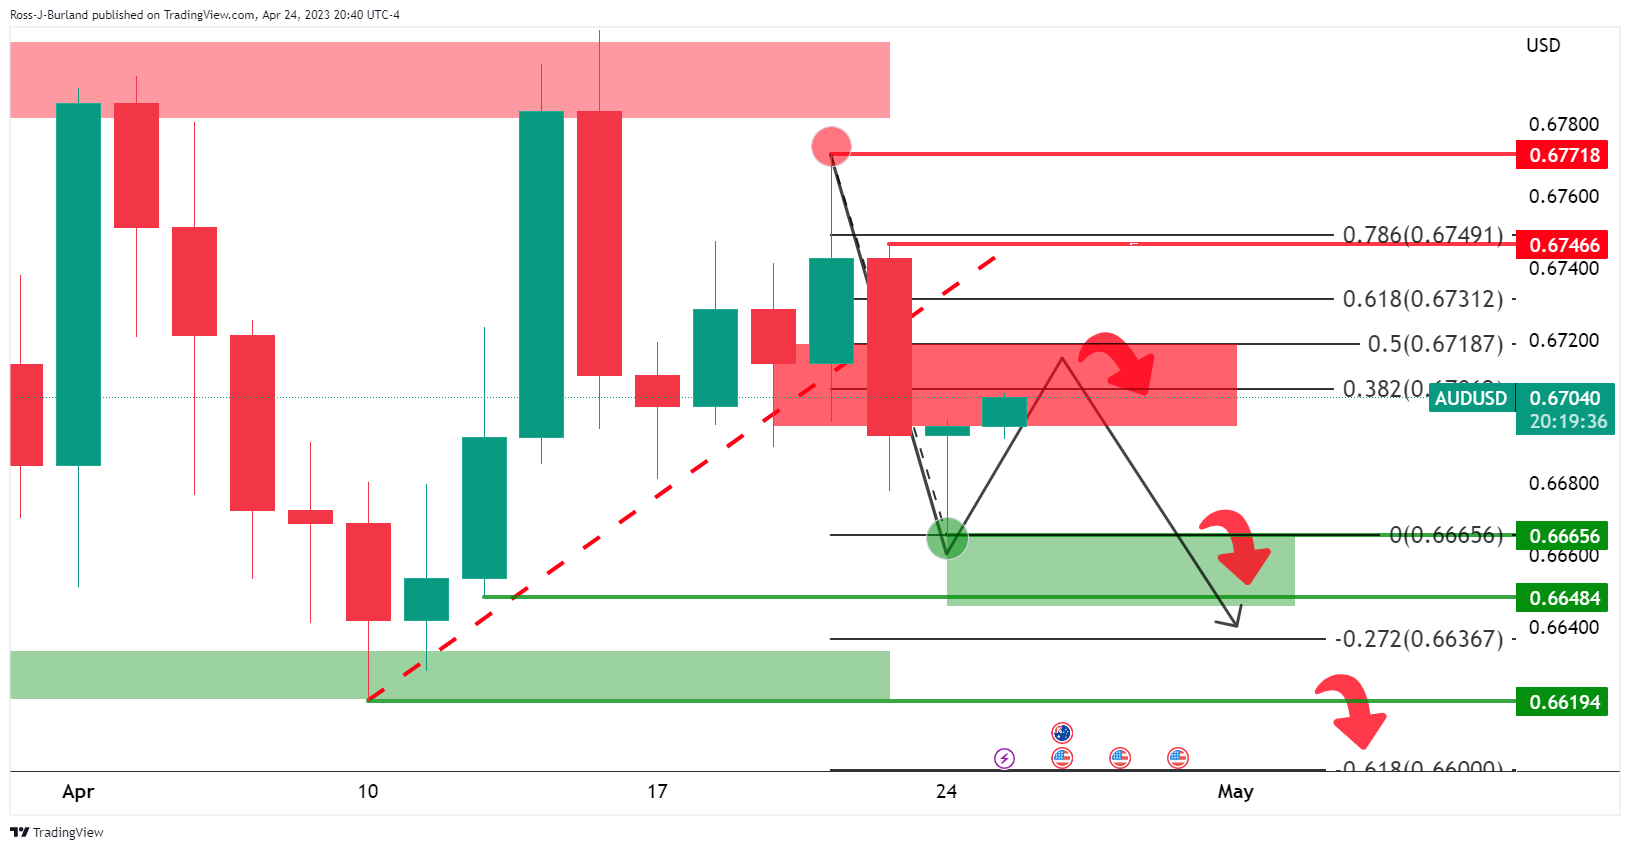
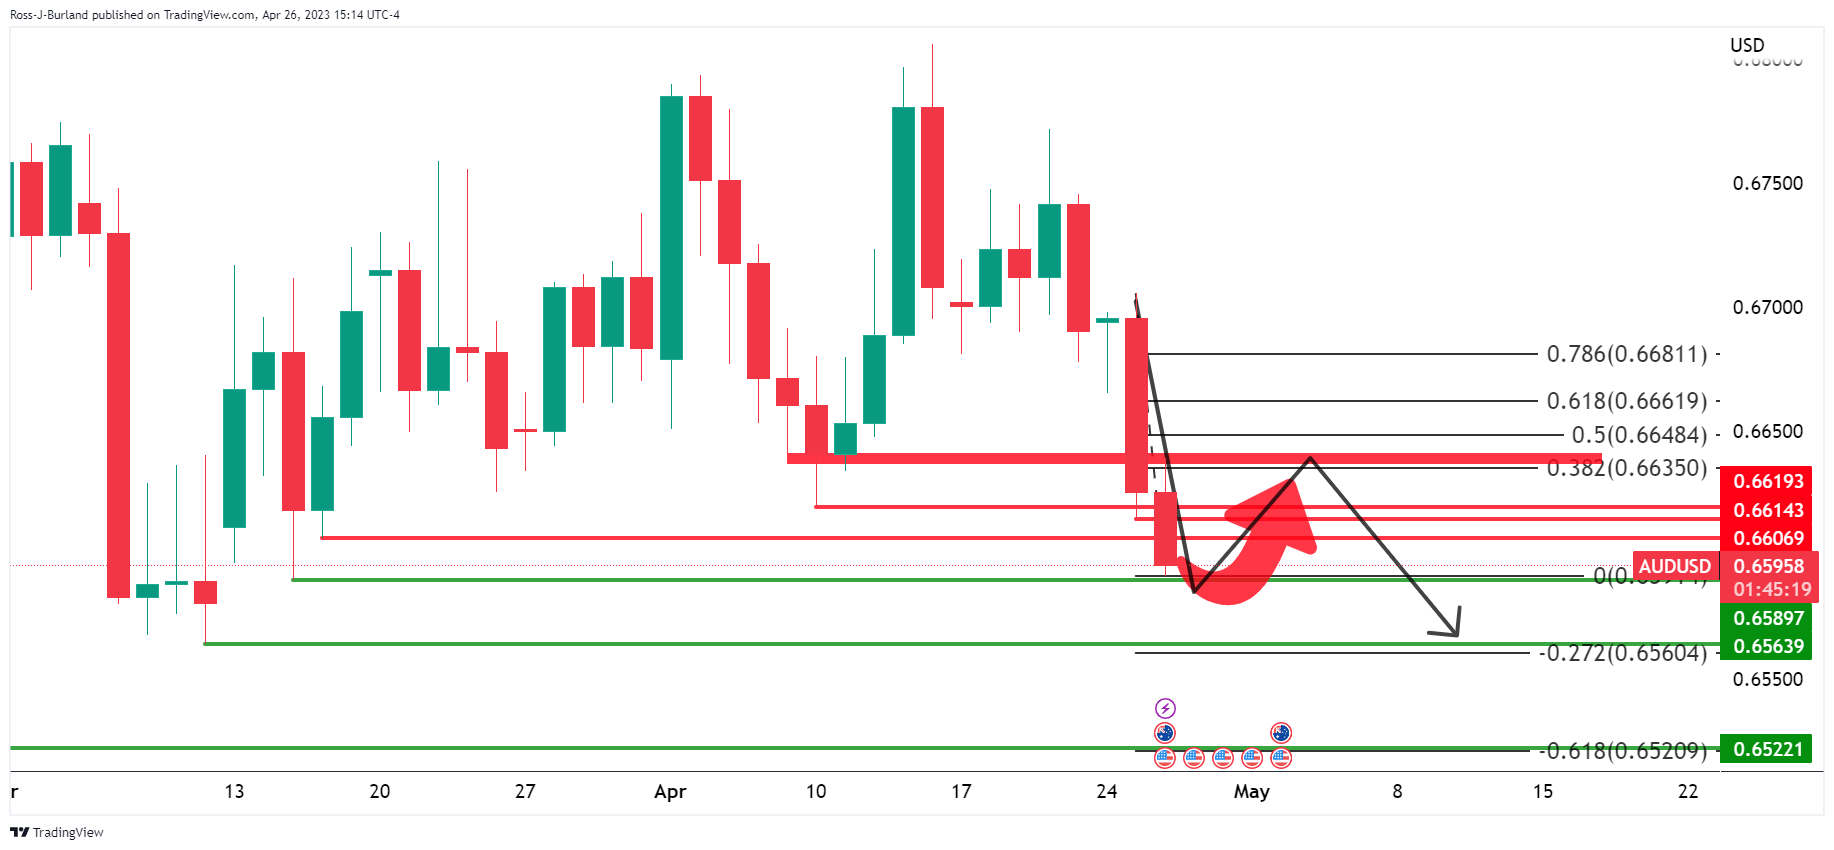
AUD/USD H1 charts
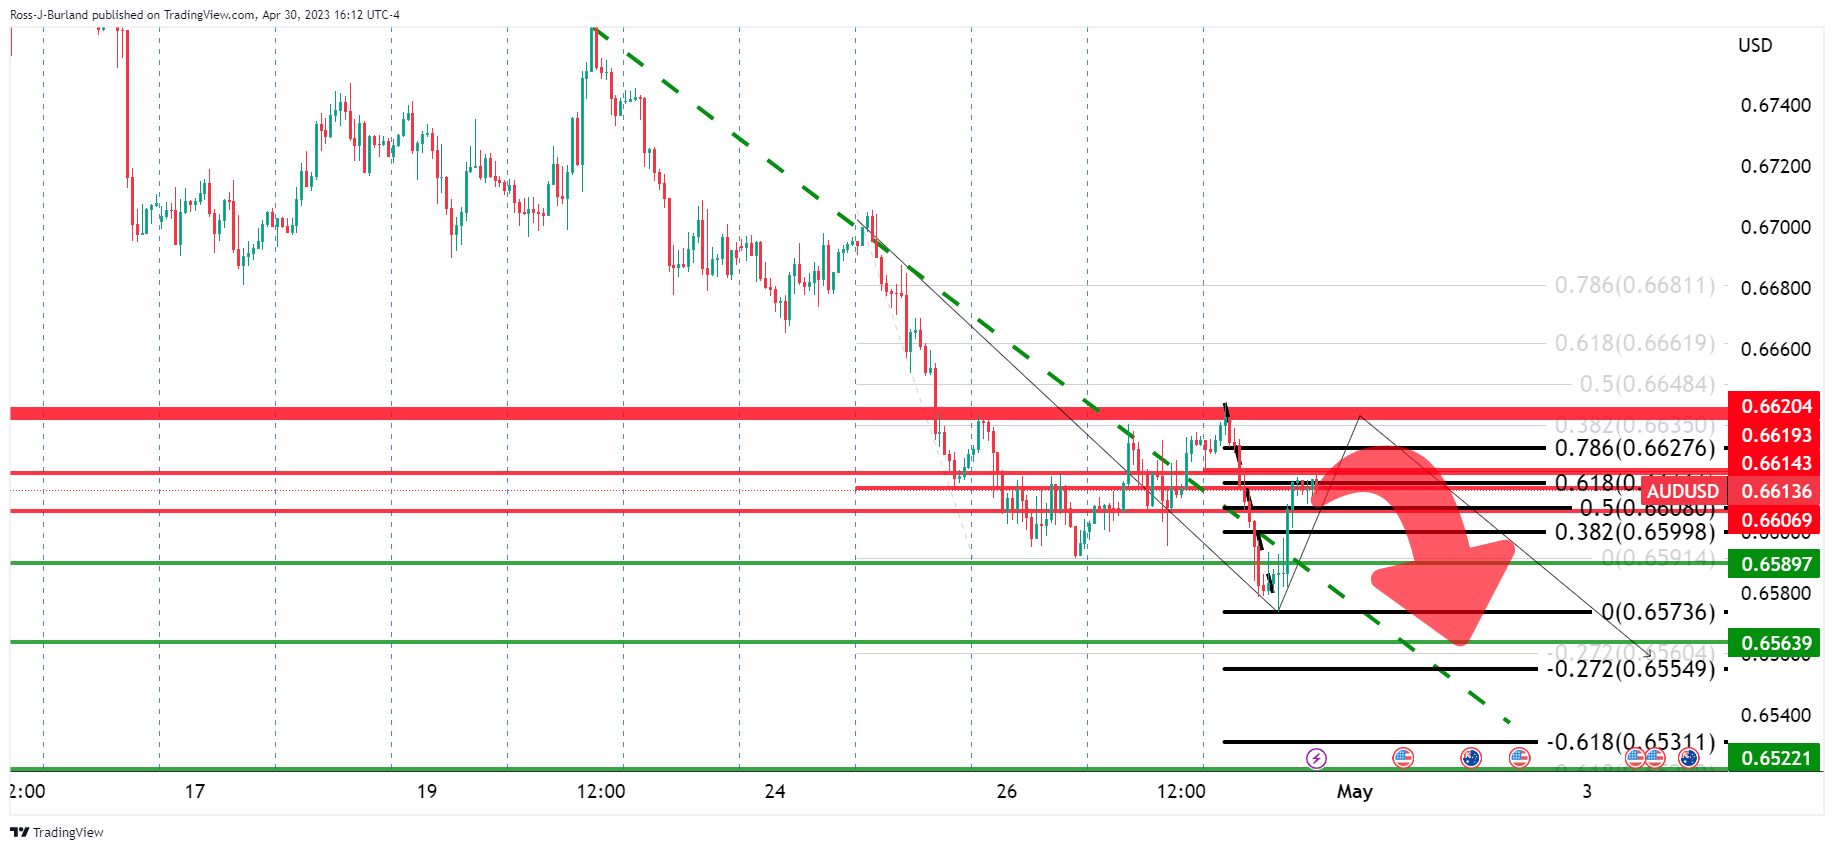
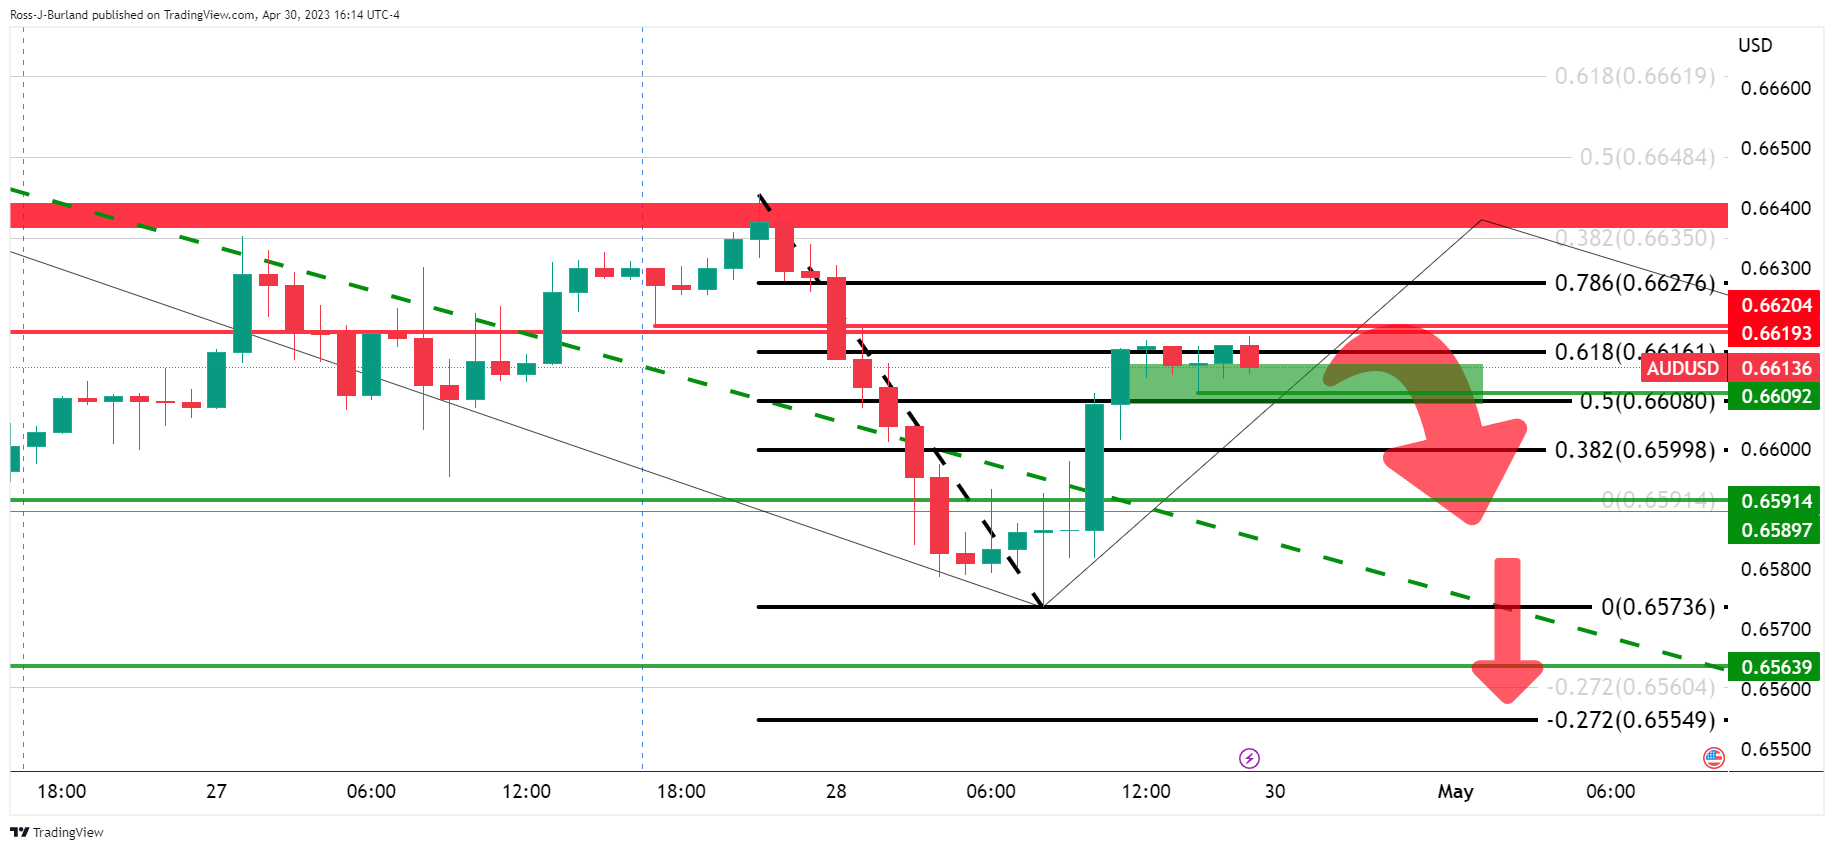
Zooming in on the hourly chart, presuming that the correction has run its course, a break of the 0.6609 structure opens risk to the 0.6550s for the day ahead.
-
03:31
China NBS Manufacturing PMI came in at 49.2 below forecasts (51.4) in April
-
03:30
China Non-Manufacturing PMI came in at 56.4, above forecasts (50.4) in April
-