Noticias del mercado
-
23:53
Fed's Logan: Cooling labor market could be evidence its time to cut rates
Federal Reserve (Fed) Bank of Dallas President Lorie Logan hit newswires late on Thursday, noting that inflation progress has been significant, the US labor market remains far too firm to push the Fed into rate cuts any time soon. Fed policymaker Logan went on to admit that even if inflation hits 2%, it may not be enough independently to squeeze a rate trim out of the Fed.
Key highlights
Potential inflation increase would be a sign for further monetary policy action.
Cooling labor market or demand could be evidence it's time to cut rates.
Choices in 2025 between resuming rate cuts or holding rates steady for a prolonged period.
Fed should guide rate path to maintain anchored inflation expectations.
There is uncertainty due to trade policy and volatile financial conditions.
Trade policy changes could significantly affect economy.
2% inflation does not imply rate cuts.
Strong labor market as a sign of nearing neutrality.
With inflation near 2% and labor market holding steady, Fed may not cut rates soon.
-
23:00
USD/CHF Price Analysis: Reclaims 0.9000 ahead of US NFP data
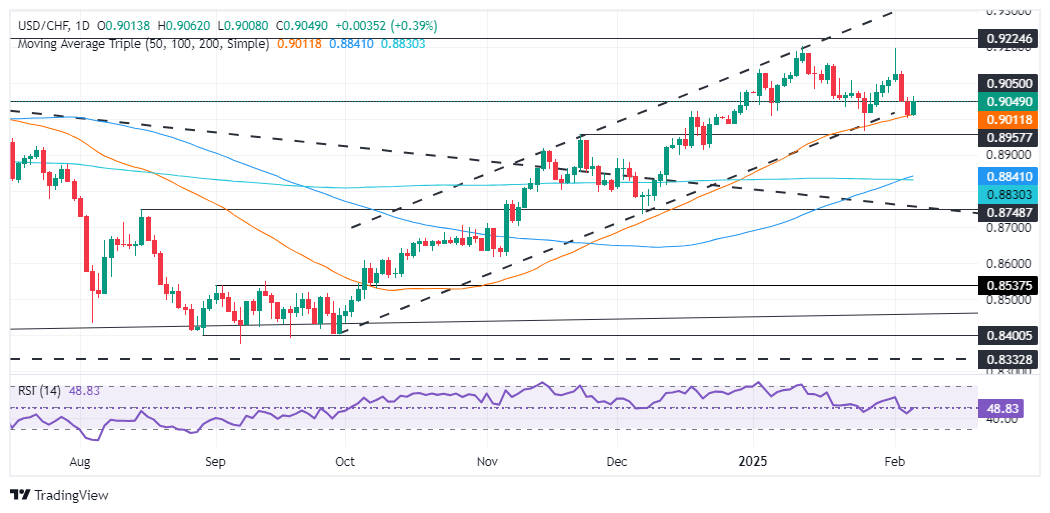
- USD/CHF rebounds to 0.9048, gaining momentum after forming a "tweezers bottom" pattern at critical support levels.
- Upcoming Nonfarm Payroll figures heighten market focus, following unexpected rise in unemployment claims.
- Technical outlook suggests potential range trading, with a critical resistance at 0.9100 and support near 0.8998.
The USD/CHF reversed course and trimmed some of its weekly losses, posting gains of over 0.36%. At the time of writing, it was exchanged at 0.9048.
US jobs data showed that more people than expected applied for unemployment benefits, which could be linked to the Los Angeles wildfires and the weather. In the meantime, traders braced for the release of US Nonfarm Payroll figures on Friday.
USD/CHF Price Analysis: Technical outlook
The USD/CHF reversed its course, forming a “tweezers bottom” chart pattern. The pair found strong support at 0.8998 at the 50-day Simple Moving Average (SMA). If buyers achieve a daily close above 0.9000, look for some range-bound trading within the 0.9040 – 0.9100 area. A breach of the top of the range will expose the February 3 high at 0.9195.
Conversely, if the USD/CHF price closes below the 50-day SMA daily, further downside is seen, as the next support would be the November 22 daily high at 0.8957, followed by 0.8900.
USD/CHF Price Chart – Daily
Swiss Franc FAQs
The Swiss Franc (CHF) is Switzerland’s official currency. It is among the top ten most traded currencies globally, reaching volumes that well exceed the size of the Swiss economy. Its value is determined by the broad market sentiment, the country’s economic health or action taken by the Swiss National Bank (SNB), among other factors. Between 2011 and 2015, the Swiss Franc was pegged to the Euro (EUR). The peg was abruptly removed, resulting in a more than 20% increase in the Franc’s value, causing a turmoil in markets. Even though the peg isn’t in force anymore, CHF fortunes tend to be highly correlated with the Euro ones due to the high dependency of the Swiss economy on the neighboring Eurozone.
The Swiss Franc (CHF) is considered a safe-haven asset, or a currency that investors tend to buy in times of market stress. This is due to the perceived status of Switzerland in the world: a stable economy, a strong export sector, big central bank reserves or a longstanding political stance towards neutrality in global conflicts make the country’s currency a good choice for investors fleeing from risks. Turbulent times are likely to strengthen CHF value against other currencies that are seen as more risky to invest in.
The Swiss National Bank (SNB) meets four times a year – once every quarter, less than other major central banks – to decide on monetary policy. The bank aims for an annual inflation rate of less than 2%. When inflation is above target or forecasted to be above target in the foreseeable future, the bank will attempt to tame price growth by raising its policy rate. Higher interest rates are generally positive for the Swiss Franc (CHF) as they lead to higher yields, making the country a more attractive place for investors. On the contrary, lower interest rates tend to weaken CHF.
Macroeconomic data releases in Switzerland are key to assessing the state of the economy and can impact the Swiss Franc’s (CHF) valuation. The Swiss economy is broadly stable, but any sudden change in economic growth, inflation, current account or the central bank’s currency reserves have the potential to trigger moves in CHF. Generally, high economic growth, low unemployment and high confidence are good for CHF. Conversely, if economic data points to weakening momentum, CHF is likely to depreciate.
As a small and open economy, Switzerland is heavily dependent on the health of the neighboring Eurozone economies. The broader European Union is Switzerland’s main economic partner and a key political ally, so macroeconomic and monetary policy stability in the Eurozone is essential for Switzerland and, thus, for the Swiss Franc (CHF). With such dependency, some models suggest that the correlation between the fortunes of the Euro (EUR) and the CHF is more than 90%, or close to perfect.
-
22:41
NZD/USD Price Analysis: Pair eases but holds firm above 20-day SMA
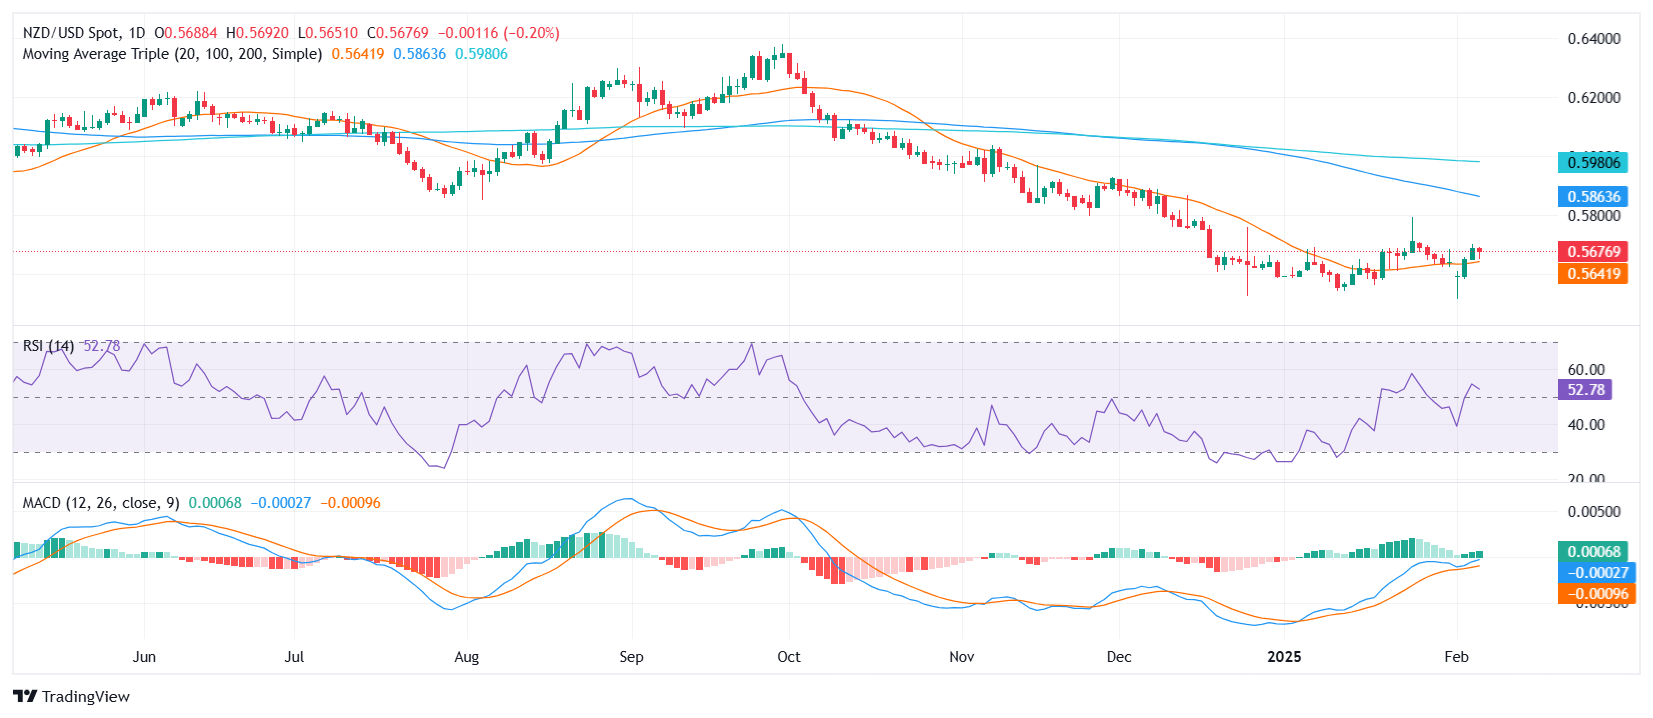
- NZD/USD dips on Thursday, settling at 0.5675 after testing key support.
- Sellers attempted to push the pair below the 20-day SMA near 0.5640 but failed.
The NZD/USD pair softened on Thursday, edging 0.21% lower to 0.5675, but managed to hold above its 20-day Simple Moving Average (SMA). Bears attempted to break below the key support around 0.5640 but faced rejection, suggesting that buying interest remains resilient despite the slight pullback.
Technical indicators reflect a mixed outlook. The Relative Strength Index (RSI) declined sharply to 54, signaling a loss of momentum but still staying in positive territory. Meanwhile, the Moving Average Convergence Divergence (MACD) histogram remains flat with green bars, indicating a temporary pause in bullish momentum rather than a confirmed shift toward sellers.
Looking ahead, as long as NZD/USD holds above the 20-day SMA, currently near 0.5640, the broader bullish bias remains intact. A sustained break above 0.5700 could trigger further upside toward 0.5735, while a close below the SMA could expose the pair to a deeper retracement toward 0.5600.
NZD/USD daily chart
-
22:00
Gold price retreats as US yields rebound ahead of jobs data
- Gold drops amid rising US Treasury yields and a stronger US Dollar.
- US equity downturn and job market worries heighten market jitters ahead of Nonfarm Payrolls.
- Fed's Goolsbee suggests cautious monetary policy, impacting gold amidst global trade tensions.
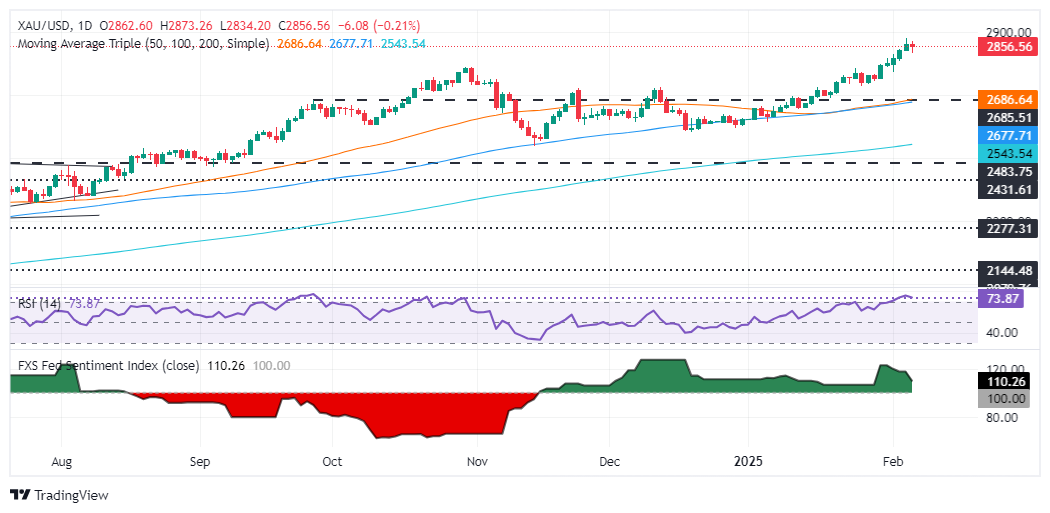
Gold price advance stalled on Thursday as United States (US) Treasury bond yields recovered, and the Greenback holds minimal gains. Traders seem to be booking profits ahead of the release of the latest US Nonfarm Payrolls report, which could spark volatility in the financial markets. XAU/USD traded at $2,852, down 0.38%.
With no clear catalyst, the market mood shifted negatively as US equity indices turned lower. Despite this, the non-yielding metal continued to trim some of its weekly gains amid increased tensions due to the trade war between China and the US.
In addition, US jobs data showed that the number of people applying for unemployment benefits rose in the week ending February 1, revealed the US Department of Labor. A Bloomberg report said the report was mainly ignored due to distortions spurred by wildfires in Los Angeles and worse weather conditions in other parts of the US.
Bullion failed to gain traction amid dovish comments by Chicago Fed President Austan Goolsbee. He said the Fed is in good shape for eventual cuts, though he added that uncertainty around Washington policies warrants a “slower approach.”
Daily digest market movers: Gold price weighed by US yields recovery
- The US Dollar Index (DXY), which tracks the buck’s performance versus a basket of six currencies, holds minimal gains of 0.06% and is at 107.68.
- The US 10-year Treasury bond yield climbs one and a half basis points, up at 4.44%.
- US real yields, which correlate inversely to Bullion prices, climb one and a half basis points from 2.01% to 2.0026%, a tailwind for XAU/USD.
- For the week ending February 1, US Initial Jobless Claims increased to 219K, up from 208K the previous week and surpassing forecasts of 213K. This rise indicates more Americans filed for unemployment benefits than expected.
- US Nonfarm Payrolls in January are expected to dip from 256K to 170K. The Unemployment Rate is projected to remain unchanged at 4.1%.
- Money market fed funds rate futures are pricing in 47.5 basis points (bps) of easing by the Federal Reserve in 2025.
XAU/USD technical outlook: Gold price falls below $2,860
Despite dipping, the XAU/USD pair is poised to extend its rally and challenge the year-to-date (YTD) high of $2,882 ahead of $2,890. Once those two levels are cleared, the next resistance would be $2,900.
The Relative Strength Index (RSI) remains at overbought territory. Still, as previously mentioned, “it hasn’t reached the most extreme level above 80, which could pave the way for a mean-reversion trade.”
Therefore, XAU/USD fell to a daily low of $2,834, but buyers lifted Gold prices above $2,850, opening the door for further upside.
Conversely, if Bullion plunges below $2,800, immediate support would be the January 27 swing low of $2,730, followed by $2,700.
Gold FAQs
Gold has played a key role in human’s history as it has been widely used as a store of value and medium of exchange. Currently, apart from its shine and usage for jewelry, the precious metal is widely seen as a safe-haven asset, meaning that it is considered a good investment during turbulent times. Gold is also widely seen as a hedge against inflation and against depreciating currencies as it doesn’t rely on any specific issuer or government.
Central banks are the biggest Gold holders. In their aim to support their currencies in turbulent times, central banks tend to diversify their reserves and buy Gold to improve the perceived strength of the economy and the currency. High Gold reserves can be a source of trust for a country’s solvency. Central banks added 1,136 tonnes of Gold worth around $70 billion to their reserves in 2022, according to data from the World Gold Council. This is the highest yearly purchase since records began. Central banks from emerging economies such as China, India and Turkey are quickly increasing their Gold reserves.
Gold has an inverse correlation with the US Dollar and US Treasuries, which are both major reserve and safe-haven assets. When the Dollar depreciates, Gold tends to rise, enabling investors and central banks to diversify their assets in turbulent times. Gold is also inversely correlated with risk assets. A rally in the stock market tends to weaken Gold price, while sell-offs in riskier markets tend to favor the precious metal.
The price can move due to a wide range of factors. Geopolitical instability or fears of a deep recession can quickly make Gold price escalate due to its safe-haven status. As a yield-less asset, Gold tends to rise with lower interest rates, while higher cost of money usually weighs down on the yellow metal. Still, most moves depend on how the US Dollar (USD) behaves as the asset is priced in dollars (XAU/USD). A strong Dollar tends to keep the price of Gold controlled, whereas a weaker Dollar is likely to push Gold prices up.
-
21:47
Australian Dollar softens as RBA cut bets and trade tensions weigh, US NFP looms
- Aussie dips near 0.6280 amid trade gloom.
- RBA likely to cut rates to 4.1%, capping Aussie gains.
- Markets await US labor data for fresh momentum.
- Soft Trade Balance data from Australia also affected the Aussie.
The Australian Dollar (AUD) softens to around 0.6280 in Thursday’s American session, tallying nearly 0.30% losses. Expectations of a Reserve Bank of Australia (RBA) rate cut and revived United States (US)-China tariff anxieties hamper the pair’s upside. Meanwhile, attention shifts to the United States labor market report on Friday, with the Aussie bracing for further volatility.
Daily digest market movers: Aussie edges lower as US Dollar recovers
- On the local front, Australia’s trade surplus shrank to 5,085M in December from 6,792M, below expectations of 7,000M, as exports rose just 1.1% while imports surged 5.9%.
- Markets now price a 95% chance of an RBA rate cut from 4.35% to 4.10%, undermining the Aussie’s resilience.
- US President Donald Trump floats the idea of higher tariffs on the Eurozone and China, pressuring the China-linked Australian Dollar.
- The US Dollar finds support from hawkish Federal Reserve expectations, although weaker labor data could curb USD demand.
- Investors are now focusing on Friday's Nonfarm Payrolls report, projected to show 170,000 new jobs in January, down from December's 256,000.
- Jobless Claims raised concerns as Initial claims rose to 219,000, surpassing expectations of 213,000 and up from last week's 208,000, signaling potential labor market softening.
- Continuing jobless claims increase to 1.886 million, above the forecast of 1.87 million.
AUD/USD technical outlook: Mild retracement stalls near 20-day SMA
The pair declined to 0.6280 on Thursday, after surging past the 20-day Simple Moving Average at approximately 0.6230. The Relative Strength Index (RSI) stands at 55, still in positive territory but declining. Meanwhile, the Moving Average Convergence Divergence (MACD) histogram shows decreasing green bars, hinting at waning bullish momentum.
Although the Aussie’s near-term support may hold above 0.6200, dovish RBA expectations and renewed tariff worries could keep any further advances below the 0.6300 resistance in check. A hold of the 20-day SMA would reject any bearish threats, at least for the short term.
Australian Dollar FAQs
One of the most significant factors for the Australian Dollar (AUD) is the level of interest rates set by the Reserve Bank of Australia (RBA). Because Australia is a resource-rich country another key driver is the price of its biggest export, Iron Ore. The health of the Chinese economy, its largest trading partner, is a factor, as well as inflation in Australia, its growth rate and Trade Balance. Market sentiment – whether investors are taking on more risky assets (risk-on) or seeking safe-havens (risk-off) – is also a factor, with risk-on positive for AUD.
The Reserve Bank of Australia (RBA) influences the Australian Dollar (AUD) by setting the level of interest rates that Australian banks can lend to each other. This influences the level of interest rates in the economy as a whole. The main goal of the RBA is to maintain a stable inflation rate of 2-3% by adjusting interest rates up or down. Relatively high interest rates compared to other major central banks support the AUD, and the opposite for relatively low. The RBA can also use quantitative easing and tightening to influence credit conditions, with the former AUD-negative and the latter AUD-positive.
China is Australia’s largest trading partner so the health of the Chinese economy is a major influence on the value of the Australian Dollar (AUD). When the Chinese economy is doing well it purchases more raw materials, goods and services from Australia, lifting demand for the AUD, and pushing up its value. The opposite is the case when the Chinese economy is not growing as fast as expected. Positive or negative surprises in Chinese growth data, therefore, often have a direct impact on the Australian Dollar and its pairs.
Iron Ore is Australia’s largest export, accounting for $118 billion a year according to data from 2021, with China as its primary destination. The price of Iron Ore, therefore, can be a driver of the Australian Dollar. Generally, if the price of Iron Ore rises, AUD also goes up, as aggregate demand for the currency increases. The opposite is the case if the price of Iron Ore falls. Higher Iron Ore prices also tend to result in a greater likelihood of a positive Trade Balance for Australia, which is also positive of the AUD.
The Trade Balance, which is the difference between what a country earns from its exports versus what it pays for its imports, is another factor that can influence the value of the Australian Dollar. If Australia produces highly sought after exports, then its currency will gain in value purely from the surplus demand created from foreign buyers seeking to purchase its exports versus what it spends to purchase imports. Therefore, a positive net Trade Balance strengthens the AUD, with the opposite effect if the Trade Balance is negative.
-
20:33
Forex Today: Tariffs and NFP should keep markets cautious
The US Dollar regain some composure and partially reversed the weekly correction ahead of the release of the key US labour market report and amid persistent uncertainty surrounding Trump’s trade policies.
Here is what you need to know on Friday, February 7:
The US Dollar Index (DXY) managed to reclaim some ground lost helped by a mild bounce in US yields and a hiccup in the risk-linked universe. The January Nonfarm Payrolls will be the salient event at the end of the week, seconded by the preliminary Michigan Consumer Sentiment, and Wholesale Inventories.
EUR/USD saw its upside momentum somewhat curtailed, retreating to the mid-1.0300s on the back of the better tone in the US Dollar. Germany’s Balance of Trade results will be released along with the speech by the ECB’s De Guindos.
GBP/USD tumbled to three-day lows and revisited the 1.2360 region on the back of the BoE’s rate cut and USD buying. The BBA’s Mortgage Rate, the Halifax House Price Index and the speech by the BoE’s Pill are all due across the Channel.
USD/JPY kept its decline well in place, retesting two-month lows in the 151.80 region on the back of intense buying interest around the Japanese yen. Household Spending figures, and the advanced Coincident Index and Leading Economic Index will be published.
AUD/USD’s weekly recovery came short of the 0.6300 hurdle, sparking a corrective decline on Thursday on the back of the widespread gains in the US Dollar.
Further weakness saw prices of the American WTI approach the key contention zone around $70.00 per barrel, or fresh five-week lows.
Gold prices halted their five-day bullish move on Thursday, coming under fresh selling pressure a day after hitting an all-time peak past the $2,880 mark per ounce troy. Silver prices followed suit, dropping markedly to the sub-$32.00 mark per ounce.
-
20:20
Banxico cuts rates by 50 bps to 9.50% as expected
- Banxico's 50-bps rate cut reflects a cautiously optimistic inflation forecast, with a possible additional cut discussed.
- Deputy Governor Jonathan Heath favored a more conservative 25-bps cut, highlighting internal differences.
- The Central Bank notes significant MXN volatility in response to US-Mexico tariff negotiations.
The Banco de Mexico (Banxico) lowered interest rates by 50 basis points (bps) as expected by analysts, though the decision was not unanimous as Deputy Governor Jonathan Heath voted for a 25-bps rate cut.
Banxico cuts on a split decision
Banxico’s monetary policy statement revealed that the central bank could continue calibrating monetary policy and consider an additional 50 bps cut in subsequent meetings. According to the board, the inflationary environment would allow the bank to continue easing policy, albeit maintaining a restrictive stance.
The Mexican Institution Governing Council added that headline inflation is projected to converge to Banxico’s 3% goal in Q3 2026. According to recent statements, the board sees inflation risks remaining skewed to the upside.
Regarding tariffs, the board acknowledged that the Mexican Peso depreciated significantly and reverted once the US and Mexico agreed to pause tariffs.
Forecasts for Inflation
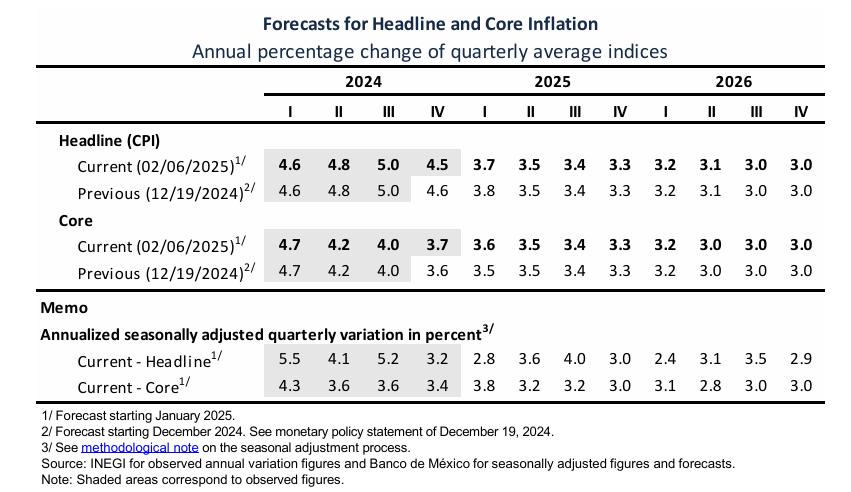
Source: Banxico
USD/MXN Reaction to Banxico’s Decision
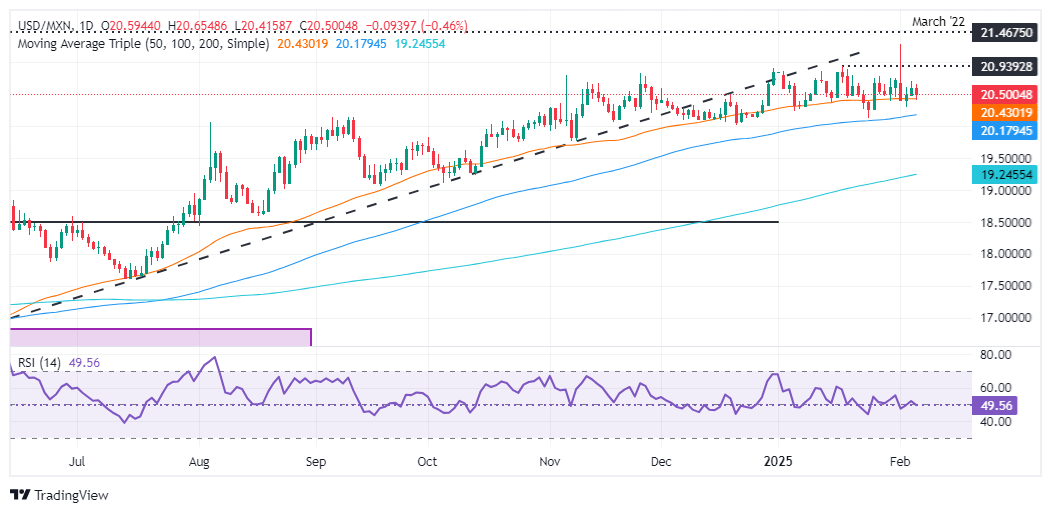
The USD/MXN has recovered some ground after reaching a daily low of 20.41 ahead of the decision, with the exchange range meandering within the 20.45 – 20.55 range. The first key resistance level eyed by traders would be the February 5 high of 20.71, which once cleared could pave the way to test the January 17 high of 20.90. On the downside, if sellers push the exchange rate below the 50-day SMA at 20.41, they could drive it towards the 100-day SMA at 20.22.
Banxico FAQs
The Bank of Mexico, also known as Banxico, is the country’s central bank. Its mission is to preserve the value of Mexico’s currency, the Mexican Peso (MXN), and to set the monetary policy. To this end, its main objective is to maintain low and stable inflation within target levels – at or close to its target of 3%, the midpoint in a tolerance band of between 2% and 4%.
The main tool of the Banxico to guide monetary policy is by setting interest rates. When inflation is above target, the bank will attempt to tame it by raising rates, making it more expensive for households and businesses to borrow money and thus cooling the economy. Higher interest rates are generally positive for the Mexican Peso (MXN) as they lead to higher yields, making the country a more attractive place for investors. On the contrary, lower interest rates tend to weaken MXN. The rate differential with the USD, or how the Banxico is expected to set interest rates compared with the US Federal Reserve (Fed), is a key factor.
Banxico meets eight times a year, and its monetary policy is greatly influenced by decisions of the US Federal Reserve (Fed). Therefore, the central bank’s decision-making committee usually gathers a week after the Fed. In doing so, Banxico reacts and sometimes anticipates monetary policy measures set by the Federal Reserve. For example, after the Covid-19 pandemic, before the Fed raised rates, Banxico did it first in an attempt to diminish the chances of a substantial depreciation of the Mexican Peso (MXN) and to prevent capital outflows that could destabilize the country.
-
20:05
Fed's Goolsbee: Uncertainty means Fed will hit a slower pace of cuts
Federal Reserve (Fed) Bank of Chicago President Austan Goolsbee noted on Thursday that while the Fed is on pace to achieve its inflation and employment targets, there is still some room to move on inflation before victory can be claimed. Inconsistent messaging from the US White House about trade tariffs is complicating the Fed's view of the future, and despite overall progress on achieving the Fed's mandate, Fed policymaker Goolsbee noted that uncertainty about trade will force the Fed into a wait-and-see stance for far longer than it otherwise would have.
Key highlights
It seems the job market is settling in at full employment.
My view of the economy is full employment, ongoing growth, and inflation likely to fall to 2%.
First-order effect of tariffs on prices may be less important than possible impact on expectations.
Effect of tariffs on inflation may be hard to discern.
I would be most concerned if long-term rates were rising in lockstep with inflation expectations; so far that is not what is happening.
Long-term rates are set by complex market forces, not the Federal Reserve.
I would put special emphasis on things like PPI and industry contacts in monitoring how tariffs might influence prices and inflation.
Tariff impacts will make it more complicated to determine what is overheating, and what is a one-time price change.
The Fed needs to be mindful of overheating and deterioration, but things are largely going well.
The appearance that inflation has stalled is largely due to base effects.
Added uncertainty makes the environment for the Fed foggier, a reason to slow the pace of cuts.
I feel the neutral rate is well below the current fed policy, but it is appropriate to slow the pace of cuts to find a stopping point.
We have to take administration policies as a given.
-
20:00
US Treasury Secretary Bessent: We aren't focused on whether the Fed will cut
US Treasury Secretary Scott Bessent hit newswires on Thursday, touching on a variety of topics that suggest the President Donald Trump's administration will achieve both US Dollar (USD) strength and a general decline in Treasury yields at the same time. Treasury Secretary Bessent also noted that hew had met with Federal Reserve (Fed) Chair Jerome Powell, but also stated that the US administration was not particularly concerned about the Fed's trajectory on interest rates.
Key highlights
There's a lot of misinformation about DOGE and the Treasury.
There are 2 Treasury officials, no tinkering.
DOGE has absolutely not had the power to change the system.
I won't allow DOGE to change the Treasury system.
No engagement at the IRS as yet on the part of DOGE.
Strong dollar policy completely intact under Trump.
China most unbalanced economy in the history of the world.
I am happy to see the trajectory of borrowing is dropping.
I don't see changes in issuance in the foreseeable future.
We aren't focused on whether fed going to cut or not.
With Trump's policies, 10-year yields are to naturally come down.
Tariffs could have a small one-time price adjustment.
I see China eating some tariffs no matter the level.
The best for predictability is to make tax cuts permanent.
I have met with Powell and had a very constructive discussion.
-
20:00
Mexico Central Bank Interest Rate in line with expectations (9.5%)
-
19:35
US Dollar with some gains after mixed economic data ahead of key employment report
- The US Dollar Index holds below 108.00 as mixed economic indicators raise concerns ahead of Friday's employment report.
- ADP reports a stronger-than-expected increase in private sector employment for January, while Initial Jobless Claims also rise.
- Investors anticipate the upcoming Nonfarm Payrolls data to gauge the Federal Reserve's future monetary policy decisions.
The US Dollar Index (DXY), which measures the value of the US Dollar (USD) against a basket of currencies, struggles to hold its recent gains, trading below 108.00 on Thursday. Mixed United States (US) economic data fuels uncertainty ahead of the January employment report due on Friday. Investors remain cautious as labor market signals provide conflicting outlooks, with ADP data showing strength while jobless claims rise.
Daily digest market movers: US Dollar index remains soft after mixed data
- ADP reports a stronger-than-expected private sector job increase of 183,000 in January, exceeding the 150,000 consensus.
- On Thursday, Initial jobless claims rise to 219,000, surpassing expectations of 213,000 and up from last week's 208,000, signaling potential labor market softening.
- Continuing jobless claims increase to 1.886 million, above the forecast of 1.87 million and last week's 1.858 million.
- Investors now focus on Friday's Nonfarm Payrolls report, projected to show 170,000 new jobs in January, down from December's 256,000.
- The CME FedWatch tool shows a nearly 90% probability of the Fed keeping rates steady in March, reinforcing expectations of a prolonged hold. NFP data will dictate the pace of the markets bets.
DXY technical outlook: Indicators show growing bearish momentum
The US Dollar Index struggles to maintain recent gains, slipping below the 20-day Simple Moving Average (SMA) at 108.50. The Relative Strength Index (RSI) remains below 50, signaling increasing bearish traction. The DXY now looks poised to test the psychological support level at 107.00, with downside risks growing as mixed economic data clouds the Fed’s hawkish policy outlook.
Nonfarm Payrolls FAQs
Nonfarm Payrolls (NFP) are part of the US Bureau of Labor Statistics monthly jobs report. The Nonfarm Payrolls component specifically measures the change in the number of people employed in the US during the previous month, excluding the farming industry.
The Nonfarm Payrolls figure can influence the decisions of the Federal Reserve by providing a measure of how successfully the Fed is meeting its mandate of fostering full employment and 2% inflation. A relatively high NFP figure means more people are in employment, earning more money and therefore probably spending more. A relatively low Nonfarm Payrolls’ result, on the either hand, could mean people are struggling to find work. The Fed will typically raise interest rates to combat high inflation triggered by low unemployment, and lower them to stimulate a stagnant labor market.
Nonfarm Payrolls generally have a positive correlation with the US Dollar. This means when payrolls’ figures come out higher-than-expected the USD tends to rally and vice versa when they are lower. NFPs influence the US Dollar by virtue of their impact on inflation, monetary policy expectations and interest rates. A higher NFP usually means the Federal Reserve will be more tight in its monetary policy, supporting the USD.
Nonfarm Payrolls are generally negatively-correlated with the price of Gold. This means a higher-than-expected payrolls’ figure will have a depressing effect on the Gold price and vice versa. Higher NFP generally has a positive effect on the value of the USD, and like most major commodities Gold is priced in US Dollars. If the USD gains in value, therefore, it requires less Dollars to buy an ounce of Gold. Also, higher interest rates (typically helped higher NFPs) also lessen the attractiveness of Gold as an investment compared to staying in cash, where the money will at least earn interest.
Nonfarm Payrolls is only one component within a bigger jobs report and it can be overshadowed by the other components. At times, when NFP come out higher-than-forecast, but the Average Weekly Earnings is lower than expected, the market has ignored the potentially inflationary effect of the headline result and interpreted the fall in earnings as deflationary. The Participation Rate and the Average Weekly Hours components can also influence the market reaction, but only in seldom events like the “Great Resignation” or the Global Financial Crisis.
-
19:00
Mexican Peso climbs ahead of Banxico’s decision
- Mexican Peso shrugs off two straight days of losses as economists expect “large size” Banxico rate cut.
- Banxico's potential 50 bps rate cut reflects Mexico’s cooling inflation and economic contraction.
- Narrowing interest rate differential with the Fed and gloomy consumer confidence in Mexico could influence future currency trends.
The Mexican Peso (MXN) appreciated during the North American session as traders braced for Banco de Mexico's (Banxico) first monetary policy decision of 2025. At the time of writing, USD/MXN trades at 20.51, down 0.19%.
Banxico is expected to cut rates by 50 basis points, from 10% to 9.50%, according to economists polled by Reuters. Mexico’s latest inflation figures for the first fifteen days of January reached the Central Bank’s target of 3% plus or minus 1%, indicating that prices are coming down.
In addition, the economy contracted in the last quarter of 2024 for the first time in more than three years. Banxico’s Governor Victoria Rodriguez Ceja said the bank would consider cuts larger than 25 basis points during the year's first meetings.
The interest rate differential between Banxico and the Federal Reserve (Fed) would narrow from 5.50% to just 5%. Additionally, private economists estimate that the Mexican Central Bank would lower interest rates to 8.50%, while the Fed is projected to stay on hold as officials assess US President Donald Trump's trade policies.
Data-wise, Mexico’s Consumer Confidence deteriorated for the third consecutive month as consumers became pessimistic about the economic outlook for one year. Across the north of the border, the number of Americans filing unemployment claims increased above estimates and the previous week’s numbers.
USD/MXN traders will eye Banxico’s decision at 19:00 GMT. Alongside that, Fed officials would cross the wires.
Daily digest market movers: Mexican Peso awaiting Banxico's move for direction
- Banxico’s reasons to cut rates are driven by January’s mid-month inflation, which came in at 3.69% YoY, its lowest level since 2021, after hitting a two-decade high above 8% in 2022. Furthermore, the Gross Domestic Product (GDP) for Q4 2024 contracted -0.6% QoQ, the first quarterly contraction in more than three years.
- INEGI revealed that Mexico’s Consumer Confidence in January fell from 47 to 46.7. The poll showed that Mexicans are more pessimistic about the current economic situation and its prospects for the next 12 months.
- US Initial Jobless Claims missed the mark for the week ending February 1. The number of Americans filing for unemployment benefits rose by 219K, up from 208K the previous week and exceeded forecasts of 213K.
- Trade disputes between the US and Mexico remain in the boiler room. Although countries found common ground, USD/MXN traders should know that there is a 30-day pause and that tensions could arise throughout the end of February.
- Money market fed funds rate futures are pricing in 47.5 basis points (bps) of easing by the Federal Reserve in 2025.
USD/MXN technical outlook: Mexican Peso strengthens as USD/MXN tumbles below 20.50
The USD/MXN’s pair uptrend remains in place despite the ongoing pullback. Buyers seem to be leaning into the 50-day Simple Moving Average (SMA) at 20.41, which found support, keeping the pair from testing key support levels.
In the short term, momentum turned bearish, as depicted by the Relative Strength Index (RSI). If USD/MXN tumbles below the 50-day SMA, sellers could challenge the 100-day SMA at 20.22. Once cleared, further downside is seen, and the pair could challenge 20.00.
Conversely, and the most likely scenario, if USD/MXN rises above 20.50, look for a test of the January 17 daily peak at 20.90 before testing 21.00 and the year-to-date (YTD) high at 21.29.

Mexican Peso FAQs
The Mexican Peso (MXN) is the most traded currency among its Latin American peers. Its value is broadly determined by the performance of the Mexican economy, the country’s central bank’s policy, the amount of foreign investment in the country and even the levels of remittances sent by Mexicans who live abroad, particularly in the United States. Geopolitical trends can also move MXN: for example, the process of nearshoring – or the decision by some firms to relocate manufacturing capacity and supply chains closer to their home countries – is also seen as a catalyst for the Mexican currency as the country is considered a key manufacturing hub in the American continent. Another catalyst for MXN is Oil prices as Mexico is a key exporter of the commodity.
The main objective of Mexico’s central bank, also known as Banxico, is to maintain inflation at low and stable levels (at or close to its target of 3%, the midpoint in a tolerance band of between 2% and 4%). To this end, the bank sets an appropriate level of interest rates. When inflation is too high, Banxico will attempt to tame it by raising interest rates, making it more expensive for households and businesses to borrow money, thus cooling demand and the overall economy. Higher interest rates are generally positive for the Mexican Peso (MXN) as they lead to higher yields, making the country a more attractive place for investors. On the contrary, lower interest rates tend to weaken MXN.
Macroeconomic data releases are key to assess the state of the economy and can have an impact on the Mexican Peso (MXN) valuation. A strong Mexican economy, based on high economic growth, low unemployment and high confidence is good for MXN. Not only does it attract more foreign investment but it may encourage the Bank of Mexico (Banxico) to increase interest rates, particularly if this strength comes together with elevated inflation. However, if economic data is weak, MXN is likely to depreciate.
As an emerging-market currency, the Mexican Peso (MXN) tends to strive during risk-on periods, or when investors perceive that broader market risks are low and thus are eager to engage with investments that carry a higher risk. Conversely, MXN tends to weaken at times of market turbulence or economic uncertainty as investors tend to sell higher-risk assets and flee to the more-stable safe havens.
-
18:25
Dow Jones Industrial Average splits from the pack and sheds 150 points
- The Dow Jones backslid around 150 points on Thursday.
- US equities are overall higher, but losses in key tech stocks are punishing the Dow.
- Earnings brought more downside misses in overvalued silicon companies.
The Dow Jones Industrial Average (DJIA) slid on Thursday, falling around 150 points to retest the 44,750 level. Earnings reports dominated US equities on Thursday, with the tech sector suffering a string of missed revenue and growth expectations.
US economic data was strictly mid-tier, though week-on-week Initial Jobless Claims rose to 219K through the week ended January 31. Median market forecasts expected a print of 213K, and the previous week’s figure was revised slightly to 208K.
Another Nonfarm Payrolls (NFP) jobs data dump looms on Friday. Net job additions are expected to ease to 170K in January, down from December’s print of 256K. Revisions to older data will be closely watched this week. Post-print revisions drifted toward the stronger side during 2024, frustrating market participants hoping for cracks in the US employment landscape to help push the Federal Reserve (Fed) toward more rate cuts.
Dow Jones news
In aggregate terms, the Dow Jones is roughly on-balance on Thursday, with about half of the equity board’s listed securities testing the high side. Nvidia (NVDA) topped the pile, gaining 2.2% and clawing back to $127 per share, followed closely by Caterpillar inc, which rose 2% to $366 per share.
Honeywell (HON) tumbled 5.2%, falling to $210 per share after issuing annual forward guidance that fell short of analyst expectations. Salesforce (CRM) also backslid, declining 4.2% to $210 per share as the AI rally sputters out.
Dow Jones price forecast
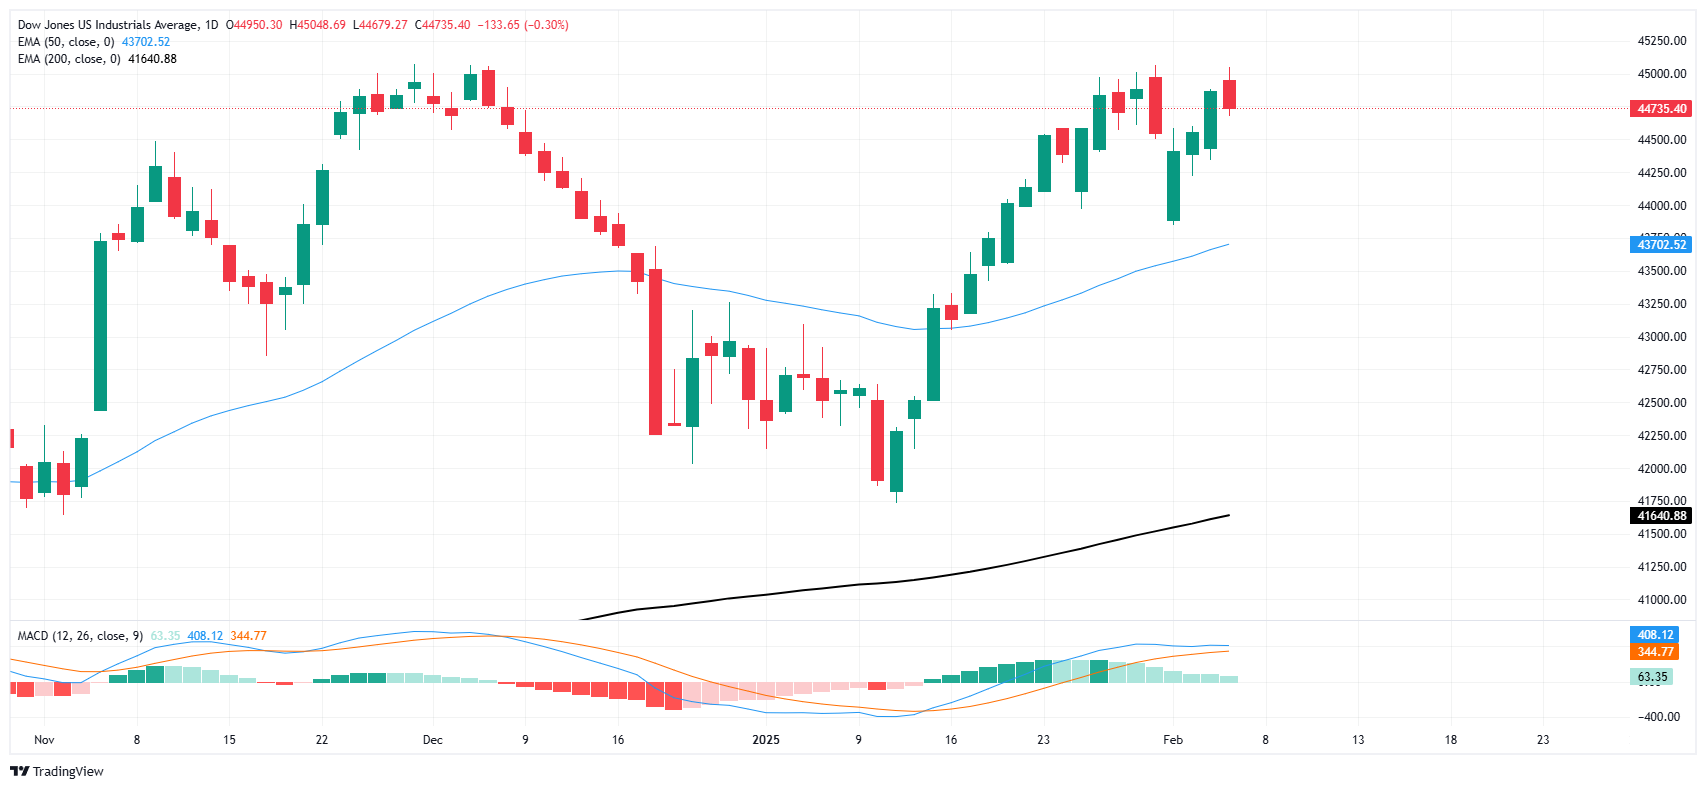
The Dow Jones is set to snap a three-day winning streak as the 45,000 handle proves to be too slick of a surface for bulls to get a foothold on. Despite a softer stance on Thursday, the Dow is holding stubbornly in bull country, in the green by 5.2% so far in 2025.
A technical floor is priced in at the 50-day Exponential Moving Average (EMA) near 43,700. On the high side, the immediate target for bidders will be record highs set in December just above 45,065.
Dow Jones daily chart
Dow Jones FAQs
The Dow Jones Industrial Average, one of the oldest stock market indices in the world, is compiled of the 30 most traded stocks in the US. The index is price-weighted rather than weighted by capitalization. It is calculated by summing the prices of the constituent stocks and dividing them by a factor, currently 0.152. The index was founded by Charles Dow, who also founded the Wall Street Journal. In later years it has been criticized for not being broadly representative enough because it only tracks 30 conglomerates, unlike broader indices such as the S&P 500.
Many different factors drive the Dow Jones Industrial Average (DJIA). The aggregate performance of the component companies revealed in quarterly company earnings reports is the main one. US and global macroeconomic data also contributes as it impacts on investor sentiment. The level of interest rates, set by the Federal Reserve (Fed), also influences the DJIA as it affects the cost of credit, on which many corporations are heavily reliant. Therefore, inflation can be a major driver as well as other metrics which impact the Fed decisions.
Dow Theory is a method for identifying the primary trend of the stock market developed by Charles Dow. A key step is to compare the direction of the Dow Jones Industrial Average (DJIA) and the Dow Jones Transportation Average (DJTA) and only follow trends where both are moving in the same direction. Volume is a confirmatory criteria. The theory uses elements of peak and trough analysis. Dow’s theory posits three trend phases: accumulation, when smart money starts buying or selling; public participation, when the wider public joins in; and distribution, when the smart money exits.
There are a number of ways to trade the DJIA. One is to use ETFs which allow investors to trade the DJIA as a single security, rather than having to buy shares in all 30 constituent companies. A leading example is the SPDR Dow Jones Industrial Average ETF (DIA). DJIA futures contracts enable traders to speculate on the future value of the index and Options provide the right, but not the obligation, to buy or sell the index at a predetermined price in the future. Mutual funds enable investors to buy a share of a diversified portfolio of DJIA stocks thus providing exposure to the overall index.
-
17:45
Canadian Dollar flattens ahead of key labor prints
- The Canadian Dollar churned on Thursday, holding flat against the Greenback.
- PMI figures from Canada contracted sharply in January, limiting Loonie gains.
- Key US NFP and Canadian employment figures are due on Friday.
The Canadian Dollar (CAD) spun in a tight circle on Thursday, churning chart paper near 1.4300 against the US Dollar (USD) as markets gear up for another Nonfarm Payrolls (NFP) Friday. Markets are treading water near familiar levels as investors shrug off the early week’s trade war fears and resume focusing on hopes for future Federal Reserve (Fed) rate cuts.
Canadian Purchasing Managers Index (PMI) figures for January sharply missed the mark on Thursday. Canadian Net Change in Employment and Average Hourly Wages numbers are due on Friday but will be overshadowed by the much larger US NFP jobs data package.
Daily digest market movers: Canadian Dollar flattens ahead of NFP
- The Canadian Dollar has fought back from 21-year lows this week, but remains trapped in familiar consolidation territory against the Greenback.
- Canada’s Ivey PMI for January contracted sharply on a seasonally adjusted basis, falling to a four-year low of 47.1.
- US tariffs on Mexico and Canada have been kicked down the road by another 30 days, and market tensions are loosening for the time being.
- US tariffs on China are still in place, as are reciprocal tariffs on the US from China, but these tit-for-tat import fees are largely symbolic and markets are expected to circumvent them quickly.
- Canada is expected to add far fewer jobs in January compared to December, down to 25K from 90.9K, and the Canadian Unemployment rate is forecast to tick up to 6.8% from 6.7%.
- Friday’s US NFP is likewise expected to shift lower to 170K net new jobs additions from 256K, but bumper labor prints from earlier in the week could signal an upside surprise.
Canadian Dollar price forecast
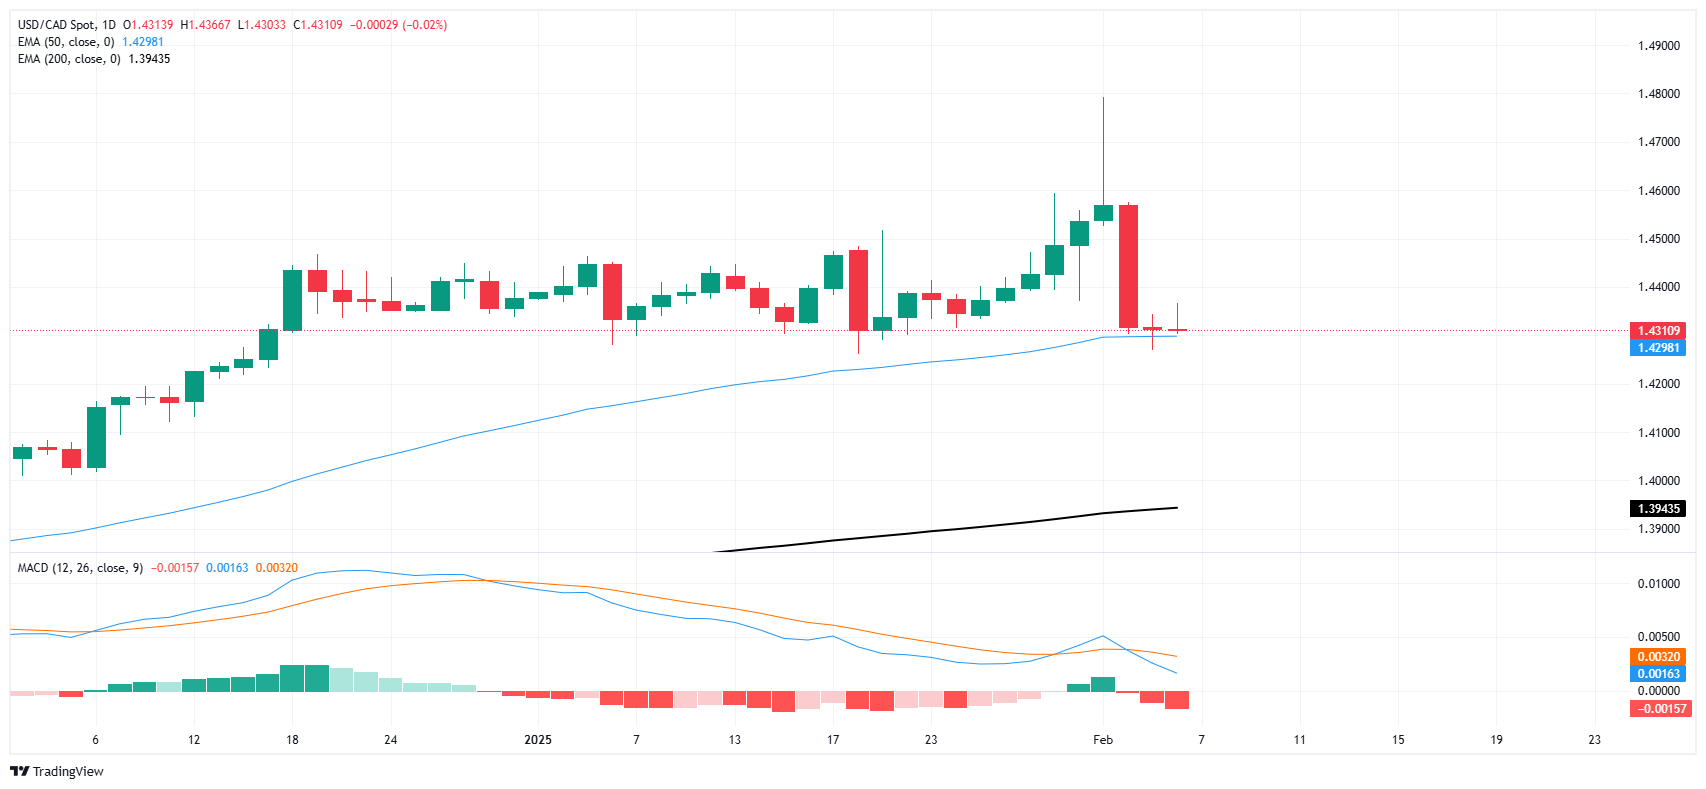
With key data due to wrap up the trading week, the Canadian Dollar is stuck back in familiar consolidation territory against the US Dollar. USD/CAD remains hung up on the 1.4300 handle, at the bottom end of a choppy sideways grind that has kept the pair traveling horizontally since mid-December.
The Loonie tumbled early this week to a 21-year low against the Greenback, sending USD/CAD to a two-decade high near 1.4800, but the move was unsustainable and the pair is now back to its middling ways. Price action is drawing into the midrange at the 50-day Exponential Moving Average (EMA), and it will take a material shift in markets to punch in new technical levels.
USD/CAD daily chart
Canadian Dollar FAQs
The key factors driving the Canadian Dollar (CAD) are the level of interest rates set by the Bank of Canada (BoC), the price of Oil, Canada’s largest export, the health of its economy, inflation and the Trade Balance, which is the difference between the value of Canada’s exports versus its imports. Other factors include market sentiment – whether investors are taking on more risky assets (risk-on) or seeking safe-havens (risk-off) – with risk-on being CAD-positive. As its largest trading partner, the health of the US economy is also a key factor influencing the Canadian Dollar.
The Bank of Canada (BoC) has a significant influence on the Canadian Dollar by setting the level of interest rates that banks can lend to one another. This influences the level of interest rates for everyone. The main goal of the BoC is to maintain inflation at 1-3% by adjusting interest rates up or down. Relatively higher interest rates tend to be positive for the CAD. The Bank of Canada can also use quantitative easing and tightening to influence credit conditions, with the former CAD-negative and the latter CAD-positive.
The price of Oil is a key factor impacting the value of the Canadian Dollar. Petroleum is Canada’s biggest export, so Oil price tends to have an immediate impact on the CAD value. Generally, if Oil price rises CAD also goes up, as aggregate demand for the currency increases. The opposite is the case if the price of Oil falls. Higher Oil prices also tend to result in a greater likelihood of a positive Trade Balance, which is also supportive of the CAD.
While inflation had always traditionally been thought of as a negative factor for a currency since it lowers the value of money, the opposite has actually been the case in modern times with the relaxation of cross-border capital controls. Higher inflation tends to lead central banks to put up interest rates which attracts more capital inflows from global investors seeking a lucrative place to keep their money. This increases demand for the local currency, which in Canada’s case is the Canadian Dollar.
Macroeconomic data releases gauge the health of the economy and can have an impact on the Canadian Dollar. Indicators such as GDP, Manufacturing and Services PMIs, employment, and consumer sentiment surveys can all influence the direction of the CAD. A strong economy is good for the Canadian Dollar. Not only does it attract more foreign investment but it may encourage the Bank of Canada to put up interest rates, leading to a stronger currency. If economic data is weak, however, the CAD is likely to fall.
-
17:32
United States 4-Week Bill Auction unchanged at 4.25%
-
17:08
EUR/USD Price Analysis: Bulls pause as pair retreats toward 20-day SMA
- EUR/USD drops on Thursday, slipping to 1.0355 after recent gains.
- After rising above the 20-day SMA earlier in the week, the pair faces renewed selling pressure and sellers might test its strength.
- A loss would push the pair towards 1.0300.
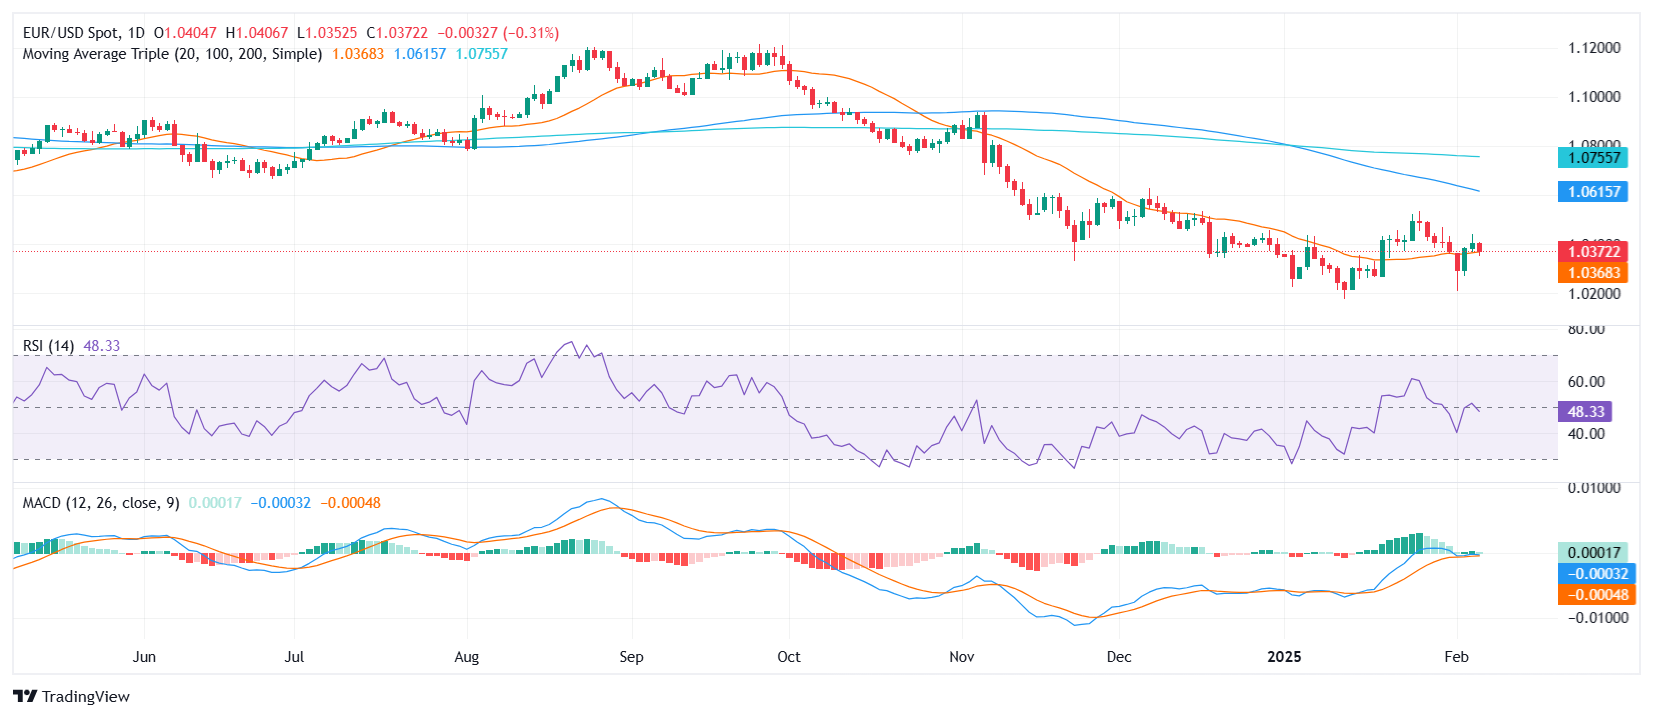
The EUR/USD pair pulled back on Thursday, declining by 0.45% to 1.0370 as bullish momentum faded. After climbing above the 20-day Simple Moving Average (SMA) at the start of the week, the pair now faces renewed bearish pressure, with sellers attempting to push it back toward this key support level. However, the overall outlook remains bearish with the pair well below the 100 and 200-day SMA which stand around 1.0600 and 1.0700.
Technical indicators suggest a weakening in bullish traction. The Relative Strength Index (RSI) has sharply declined to 49, moving into negative territory, signaling that upside momentum is losing steam. Meanwhile, the Moving Average Convergence Divergence (MACD) histogram remains flat with green bars, indicating indecisiveness in market sentiment.
If selling pressure persists, EUR/USD could test the 20-day SMA, currently near 1.0360. A break below this level would open the door for further declines toward 1.0300. On the other hand, if buyers regain control, resistance lies at 1.0400, followed by the key 1.0450 zone. For now, the short-term outlook hinges on whether the pair can hold above its 20-day SMA.
EUR/USD daily chart
-
16:30
United States EIA Natural Gas Storage Change below expectations (-167B) in January 31: Actual (-174B)
-
16:07
GBP/USD plummets as BoE cut rates unanimously
- GBP/USD falls 0.93%, hitting a session low of 1.2359 after BoE's unexpected rate decision.
- BoE's dovish stance intensifies with forecasts of significant easing by end of 2025, stirring market reactions.
- Contrast in Fed and BoE policies likely to favor USD strength.
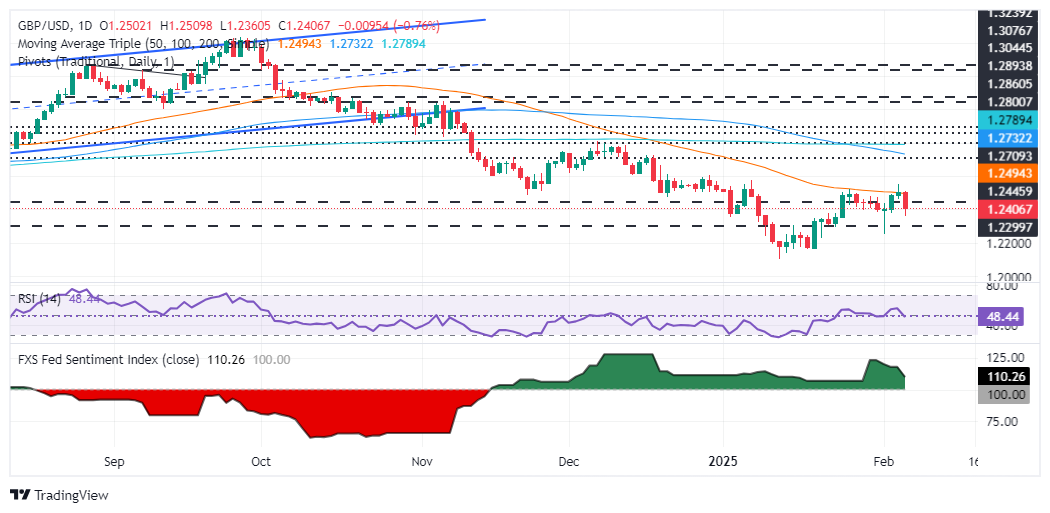
The Pound Sterling fell during Thursday’s North American session, down 0.79% after the Bank of England (BoE) reduced the Bank Rate by 25 basis points. Therefore, the GBP/USD tumbled below 1.2400 and hit a daily low of 1.2359. At the time of writing, the pair trades at 1.2405.
GBP/USD nosedives below 1.2400 following a surprising 25 basis point cut by the Bank of England
As expected, the BoE lowered rates to 4.50%, though surprisingly. Two members voted for a “larger size” rate cut, with Catherine Mann, one of the hawkish members, being one of them. Following the UK’s Central Bank decision, investors rushed to price 65 basis points (bps) of easing towards the end of 2025.
Additionally, the BoE updated their forecasts. The British economy is expected to grow by 0.75% and inflation to rise from 2.5% to 3.7%. BoE’s Governor Andrew Bailey said he hopes to be able to cut rates further, yet they would take their decisions “meeting by meeting.” He added that although headline inflation edged higher, he sees “continued gradual easing of underlying inflationary pressures.”
Across the pond, US Initial Jobless Claims missed the mark for the week ending February 1. The number of Americans filing for unemployment benefits rose by 219K, up from 208K the previous week and exceeded forecasts of 213K.
Given the backdrop, further GBP/USD downside is seen. The Federal Reserve is expected to keep rates on hold while the BoE continues to ease policy. Therefore, the divergence amongst Central Banks might benefit the Greenback.
The UK economic docket will comprise BoE officials crossing the wires this week. In the US, nonfarm payroll figures for January and Fed speakers could dictate the direction of GBP/USD.
GBP/USD Price Forecast: Technical outlook
After the BoE’s decision, the GBP/USD hit a three-day low of 1.2359 before recovering some ground. Nevertheless, failure to clear the 50-day Simple Moving Average (SMA) of 1.2497 has opened the door for further downside. A daily close below 1.2400 would shift the trend downwards and pave the way for challenging the February 3 low of 1.2248.
On the other hand, if GBP/USD stays above 1.2400, buyers must clear the 50-day SMA to test the 1.2500 mark in the near term.
British Pound PRICE Today
The table below shows the percentage change of British Pound (GBP) against listed major currencies today. British Pound was the strongest against the New Zealand Dollar.
USD EUR GBP JPY CAD AUD NZD CHF USD 0.34% 0.77% -0.46% 0.18% 0.33% 0.52% 0.46% EUR -0.34% 0.43% -0.80% -0.16% -0.01% 0.18% 0.10% GBP -0.77% -0.43% -1.24% -0.59% -0.44% -0.24% -0.31% JPY 0.46% 0.80% 1.24% 0.65% 0.81% 0.96% 0.93% CAD -0.18% 0.16% 0.59% -0.65% 0.16% 0.34% 0.29% AUD -0.33% 0.01% 0.44% -0.81% -0.16% 0.19% 0.11% NZD -0.52% -0.18% 0.24% -0.96% -0.34% -0.19% -0.06% CHF -0.46% -0.10% 0.31% -0.93% -0.29% -0.11% 0.06% The heat map shows percentage changes of major currencies against each other. The base currency is picked from the left column, while the quote currency is picked from the top row. For example, if you pick the British Pound from the left column and move along the horizontal line to the US Dollar, the percentage change displayed in the box will represent GBP (base)/USD (quote).
-
16:00
Canada Ivey Purchasing Managers Index s.a below expectations (53) in January: Actual (47.1)
-
15:06
EUR/GBP rallies to near 0.8380 after BoE’s dovish interest rate decision
- EUR/GBP refreshes weekly high near 0.8380 after the BoE reduced its interest rates by 25 bps to 4.5%, as expected.
- Surprisingly, BoE policymaker Catherine Mann supported a larger-than-usual interest rate reduction of 50 bps.
- The BoE sees a temporary uptick in price pressures due to higher energy prices.
The EUR/GBP pair surges and posts a fresh weekly high to near 0.8380 in Thursday’s North American session. The cross strengthens as investors have dumped the Pound Sterling (GBP) after the Bank of England’s (BoE) monetary policy decision in which the central bank reduced its key borrowing rates by 25 basis points (bps) to 4.5%.
Traders had already priced in a 25-bps interest rate decision but with an 8-1 vote split. However, all Monetary Policy Committee (MPC) members supported an interest rate cut and two out of them (Swati Dhingra and Catherine Mann) favored a larger reduction by 50 bps. Investors were shocked after seeing Catherine Mann’s support for a larger-than-usual rate cut as she has been an outspoken hawk.
Apart from an ultra-dovish tone from the MPC, downwardly revised Gross Domestic Product (GDP) forecasts have also weighed on the British currency. BoE’s monetary policy report shows that the central bank has projected a decline in the United Kingdom's (UK) growth rate by 0.1% in the last quarter of 2024 against the 0.3% economic expansion projected in November. The central bank has also revised GDP growth for the current quarter lower to 0.1% from 0.4%.
It appears that the conversion of Catherine Mann’s restrictive stance to ultra-dovish is driven by a weak economic outlook.
Meanwhile, the BoE expects a temporary acceleration in the headline Consumer Price Index (CPI) to 3.7% before returning to the 2% path due to a rise in energy prices.
On the Euro (EUR) front, the outlook of the shared currency has weakened as ECB policymaker and Governor of Bank of Portugal Mario Centeno said in an interview with Reuters on Wednesday that interest rates could move below the neutral rate “sooner rather than later”. ECB Centeno’s dovish remarks were based on the assumption that the Eurozone economy is unable to hold inflation near the central bank's target of 2%.
-
14:54
US: Initial Jobless Claims rose to 219K last week
- Initial Jobless Claims rose above consensus to 219K.
- Continuing Jobless Claims climbed to 1.886M in the week ending January 25.
US citizens filing new applications for unemployment insurance rose to 219K for the week ending February 1, as reported by the US Department of Labor (DoL) on Thursday. This print missed initial estimates and was higher than the previous week's revised tally of 208K (from 207K).
The report also highlighted a seasonally adjusted insured unemployment rate of 1.2%, while the four-week moving average rose to 216.75K, marking an increase of 4K from the prior week’s revised average.
Moreover, Continuing Jobless Claims went up by 36K to reach 1.886M for the week ending January 25.
Market reaction
The Greenback maintains its bullish bias above 108.00 when tracked by the US Dollar Index (DXY), reversing a three-day negative streak.
-
14:45
GBP/USD slides further after expected BoE rate cut – Scotiabank
The Pound Sterling (GBP) slid in the wake of the BoE rate decision, Scotiabank's Chief FX Strategist Shaun Osborne notes.
GBP/USD underperforms on the day
"The policy rate was cut 25bps to 4.50% as expected but two MPC members voted for a 50bps cut—one being Mann, who is typically more hawkish. UK yields have slipped and swaps are pricing in a little more easing risk. BoE Governor Bailey said the Bank would follow a 'gradual and careful approach to reducing rates, however."
"The GBP was trading defensively ahead of the BoE policy decision after the January Construction PMI showed a sharp and unexpected drop back to 48.1. A small improvement on December’s 53.3 reading was forecast."
"GBP has traded softly on the session, easing back under the 40-day MA support (1.2441) to near the 1.24 level. Short-term price action suggests a minor peak at least formed yesterday at 1.2550. Corrective losses are testing support in the mid-1.23s at writing."
-
14:41
EUR/USD: Ignores stronger German Factory Orders data – Scotiabank
German Factory Orders data for December rose a solid 6.9% in the month, versus expectations for a 2.0% gain, Scotiabank's Chief FX Strategist Shaun Osborne notes.
EUR slips lower on the day
"This data series has been choppy in the past few months and orders for Q4 overall were flat. Still, the late year jump, along with survey data, suggest that the industrial sector may be stabilizing, albeit at a relatively soft level. Tariff risks, energy costs and uncertainties around next month’s election may keep activity trends relatively subdued in the early part of this year."
"Spot peaked just under 1.0450 yesterday. Losses in the EUR since then appear corrective and may extend a little more after the squeeze higher seen earlier this week. Support is 1.0290/00."
-
14:38
CAD: Spreads remain a big impediment to a stronger rebound – Scotiabank
The softer CAD reflects the general trend in the majors against the broadly higher USD on the session. More range trading is likely in the short run; a lot of uncertainty remains and it is hard seeing the CAD improve materially at the moment, Scotiabank's Chief FX Strategist Shaun Osborne notes.
CAD edges lower on the day
"Over the past 15 years, the rare occasions that USDCAD has pushed above the 1.45 area have been great levels to sell USDs. The previous two occasions that the USD reached the 1.47 area after a short, sharp sell-off in the CAD, the USD was significantly lower just three months later (USD down 7.5% in 2020 and more than 10% in 2016)."
"In both cases US/ Canada spreads were meaningfully narrower than they are now (heading towards, or already at, par). The CAD might still pick up if tariff risks are priced fully out of the outlook in the next few weeks. Positioning remains heavily short CAD, suggesting scope for a decent squeeze if the trade news does turn suddenly better. But the CAD’s yield deficit remains a big impediment to a major rebound at the moment."
"The USD’s sharp drop back from Monday’s peak may be stabilizing. Short-term price signals suggest a minor low/reversal was struck as USDCAD losses steadied in the upper 1.42 zone yesterday. Intraday resistance should develop around 1.4375/80 (40-day MA) but spot may do a little more corrective back and filling of the sharp fall seen earlier this week. If the USD regains a 1.44 handle, that correction would risk extending to 1.4450/75. Support is 1.4260/70."
-
14:30
United States Continuing Jobless Claims above expectations (1.87M) in January 24: Actual (1.886M)
-
14:30
United States Initial Jobless Claims came in at 219K, above forecasts (213K) in January 31
-
14:30
United States Unit Labor Costs came in at 3%, below expectations (3.8%) in 4Q
-
14:30
United States Initial Jobless Claims 4-week average: 216.75K (January 31) vs 212.5K
-
14:26
USD strengthens modestly – Scotiabank
The US Dollar (USD) is trading a little higher overall this morning, partially reversing three days of losses following the tariff turmoil at the start of the week, Scotiabank's Chief FX Strategist Shaun Osborne notes.
USD trades mostly firmer in quiet trade
"Markets appear in constructive mood generally, with global stocks are trading in the green for the most part. The FTSE outperformed in anticipation of lower rates at today’s BoE policy decision—which also helps explain the GBP’s overall underperformance on the session. The JPY is resisting the USD’s advance to trade more or less flat on the day."
"BoJ Governor Tamura suggested that the policy rate would need to rise to at least 1% by early 2026— which largely reflects market pricing. USD gains reflect moderately higher yields relative it its major peers on the session so far. Treasury Sec. Bessent said the Trump administration was focused on taming long-term rates, however, suggesting that the president will not be trying to jawbone the Fed into cutting the policy rate."
"There is a little more data to work through this morning and markets may be slowly re-acquainting themselves with macro developments ahead of tomorrow’s NFP data as headline risks subside. The Banxico policy decision at 14ET is expected to result in a 50bps cut, taking the policy rate to 9.50% and the premium over the Fed funds target rate down to 500bps. Markets may be sensitive to guidance as the rate cushion for the MXN is thinning."
-
14:08
GBP/JPY dives to near 188.40 as all BoE members support 25-bps interest rate reduction
- GBP/JPY falls swiftly to near 188.40 as two BoE MPC members favored large interest rate cuts.
- The BoE sees a temporary uptick in inflation before returning to the 2% path due to higher energy prices.
- BoJ Tamura sees interest rates to rise to at least 1% by the second half of the fiscal year beginning in April.
The GBP/JPY pair faces an intense sell-off and dives vertically to near 188.40 in Thursday’s North American session, the lowest level seen in two months. The cross plummets after the Bank of England’s (BoE) monetary policy meeting in which the central bank reduced its key borrowing rates by 25 basis points (bps) to 4.5%.
British Pound PRICE Today
The table below shows the percentage change of the British Pound (GBP) against listed major currencies today. The British Pound was the strongest against the New Zealand Dollar.
USD EUR GBP JPY CAD AUD NZD CHF USD 0.45% 1.05% -0.14% 0.25% 0.42% 0.59% 0.51% EUR -0.45% 0.61% -0.60% -0.19% -0.02% 0.15% 0.04% GBP -1.05% -0.61% -1.21% -0.80% -0.63% -0.46% -0.55% JPY 0.14% 0.60% 1.21% 0.38% 0.57% 0.71% 0.65% CAD -0.25% 0.19% 0.80% -0.38% 0.18% 0.34% 0.26% AUD -0.42% 0.02% 0.63% -0.57% -0.18% 0.17% 0.06% NZD -0.59% -0.15% 0.46% -0.71% -0.34% -0.17% -0.08% CHF -0.51% -0.04% 0.55% -0.65% -0.26% -0.06% 0.08% The heat map shows percentage changes of major currencies against each other. The base currency is picked from the left column, while the quote currency is picked from the top row. For example, if you pick the British Pound from the left column and move along the horizontal line to the US Dollar, the percentage change displayed in the box will represent GBP (base)/USD (quote).
The BoE was already expected to cut interest rates but with an 8-1 vote split. However, the outcome of the policy meeting showed that all Monetary Policy Committee (MPC) members favored an interest rate cut decision. Above that, two members supported a larger-than-usual reduction of 50 bps.
Market participants have considered BoE members’ support for large interest rate cuts a dovish message for the monetary policy outlook. However, BoE Governor Andrew Bailey has guided a cautious and gradual rate cut approach amid expectations that the United Kingdom (UK) headline Consumer Price Index (CPI) could temporarily accelerate to 3.7% before resuming its downside journey towards the central bank’s target of 2%.
Andrew Bailey has refrained from committing to a preset rate-cut path. However, market participants have raised dovish expectations that the BoE will cut three times more this year. Before the BoE meeting, traders fully priced in two rate cuts for the entire year after Thursday’s monetary policy meeting.
Meanwhile, the Japanese Yen (JPY) performs strongly across the board amid growing expectations that the Bank of Japan (BoJ) will raise interest rates further this year. BoJ hawkish bets accelerate after board member Naoki Tamura must raise interest rates to at least 1% by the second half of the fiscal year beginning in April, Reuters reported. Tamura’s hawkish guidance was based on the assumption that there would be broad-based pay increases, which would lift price pressures.
-
14:00
Russia Central Bank Reserves $ increased to $620.8B from previous $619.7B
-
13:52
Bailey speech: Government commitment to long-term structural reforms will help confidence
Bank of England (BoE) Governor Andrew Bailey speaks on the policy outlook and responds to questions from the press following the decision to lower the policy rate by 25 basis points (bps) at the February meeting.
Key quotes
"There was quite a debate about the word "careful"."
"We continue to use "gradual" because we still need to see disinflation take place."
"You can conclude productivity has got much worse."
"It would be unusual for poor productivity situation to remain."
"Government growth agenda will not come through quickly but we are supportive."
"Government being committed to long-term structural reforms will help confidence."
-
13:43
Bailey speech: Consumers are more price conscious and holding back on spending
Bank of England (BoE) Governor Andrew Bailey speaks on the policy outlook and responds to questions from the press following the decision to lower the policy rate by 25 basis points (bps) at the February meeting.
Key quotes
"Monetary policy cannot prevent short-term influences on headline inflation, nor should monetary policy respond to factors that will fade by the time policy takes effect."
"Short-term pick-up in inflation introduces some further uncertainty into near-term inflation outlook."
"Reasonably confident that pick-up in inflation will be temporary."
"Labour market is cooling."
"Context is of weakening economic activity."
"Evidence suggests firms are reluctant to pass on costs to consumer prices."
"Considerable uncertainty over extent to which weak economy is due to demand or supply."
"Consumers are more price conscious and holding back on spending."
"Unclear what form global trade policies will take."
"We must judge in future meetings whether underlying inflation pressures are easing enough to allow further cuts."
"Bank rate is not on a pre-set path."
"We must proceed carefully."
Pound Sterling FAQs
The Pound Sterling (GBP) is the oldest currency in the world (886 AD) and the official currency of the United Kingdom. It is the fourth most traded unit for foreign exchange (FX) in the world, accounting for 12% of all transactions, averaging $630 billion a day, according to 2022 data. Its key trading pairs are GBP/USD, also known as ‘Cable’, which accounts for 11% of FX, GBP/JPY, or the ‘Dragon’ as it is known by traders (3%), and EUR/GBP (2%). The Pound Sterling is issued by the Bank of England (BoE).
The single most important factor influencing the value of the Pound Sterling is monetary policy decided by the Bank of England. The BoE bases its decisions on whether it has achieved its primary goal of “price stability” – a steady inflation rate of around 2%. Its primary tool for achieving this is the adjustment of interest rates. When inflation is too high, the BoE will try to rein it in by raising interest rates, making it more expensive for people and businesses to access credit. This is generally positive for GBP, as higher interest rates make the UK a more attractive place for global investors to park their money. When inflation falls too low it is a sign economic growth is slowing. In this scenario, the BoE will consider lowering interest rates to cheapen credit so businesses will borrow more to invest in growth-generating projects.
Data releases gauge the health of the economy and can impact the value of the Pound Sterling. Indicators such as GDP, Manufacturing and Services PMIs, and employment can all influence the direction of the GBP. A strong economy is good for Sterling. Not only does it attract more foreign investment but it may encourage the BoE to put up interest rates, which will directly strengthen GBP. Otherwise, if economic data is weak, the Pound Sterling is likely to fall.
Another significant data release for the Pound Sterling is the Trade Balance. This indicator measures the difference between what a country earns from its exports and what it spends on imports over a given period. If a country produces highly sought-after exports, its currency will benefit purely from the extra demand created from foreign buyers seeking to purchase these goods. Therefore, a positive net Trade Balance strengthens a currency and vice versa for a negative balance.
-
13:36
Bailey speech: We expect to be able to cut bank rate further
Bank of England (BoE) Governor Andrew Bailey speaks on the policy outlook and responds to questions from the press following the decision to lower the policy rate by 25 basis points (bps) at the February meeting.
Key quotes
"We expect to be able to cut bank rate further but we will have to judge meeting by meeting how far and how fast."
"Road ahead will have bumps."
"Behind uptick in headline inflation stands a continued, gradual easing of underlying inflationary pressures."
"This is the backdrop to our withdrawal of restrictiveness, and to our decision today."
"Coming rise in inflation almost entirely due to factors not directly linked to pressures in the UK economy."
"We expect these factors to be temporary."
BoE FAQs
The Bank of England (BoE) decides monetary policy for the United Kingdom. Its primary goal is to achieve ‘price stability’, or a steady inflation rate of 2%. Its tool for achieving this is via the adjustment of base lending rates. The BoE sets the rate at which it lends to commercial banks and banks lend to each other, determining the level of interest rates in the economy overall. This also impacts the value of the Pound Sterling (GBP).
When inflation is above the Bank of England’s target it responds by raising interest rates, making it more expensive for people and businesses to access credit. This is positive for the Pound Sterling because higher interest rates make the UK a more attractive place for global investors to park their money. When inflation falls below target, it is a sign economic growth is slowing, and the BoE will consider lowering interest rates to cheapen credit in the hope businesses will borrow to invest in growth-generating projects – a negative for the Pound Sterling.
In extreme situations, the Bank of England can enact a policy called Quantitative Easing (QE). QE is the process by which the BoE substantially increases the flow of credit in a stuck financial system. QE is a last resort policy when lowering interest rates will not achieve the necessary result. The process of QE involves the BoE printing money to buy assets – usually government or AAA-rated corporate bonds – from banks and other financial institutions. QE usually results in a weaker Pound Sterling.
Quantitative tightening (QT) is the reverse of QE, enacted when the economy is strengthening and inflation starts rising. Whilst in QE the Bank of England (BoE) purchases government and corporate bonds from financial institutions to encourage them to lend; in QT, the BoE stops buying more bonds, and stops reinvesting the principal maturing on the bonds it already holds. It is usually positive for the Pound Sterling.
-
13:30
United States Challenger Job Cuts: 49.795K (January) vs 38.792K
-
13:06
US Dollar bounces off support after softening stance from President Trump
- The US Dollar is starting to recover against most major peers in the G10 space.
- US President Trump released some easing comments and remarks, softening the risk-off tone in markets.
- The US Dollar Index (DXY) is trying to pop back above 108.00.
The US Dollar Index (DXY), which tracks the performance of the US Dollar against six major currencies, ticks up in the European trading session on Thursday, trading slightly below 108.00 at the time of writing. The move comes after comments from US President Donald Trump revealing his intentions to take over Gaza and reach a nuclear deal with Iran. Besides that, a plan to end the war in Ukraine will probably be put on the table either this or next week by the Trump administration as well.
On the economic data front, comments from US Treasury Secretary Scott Bessent sparked some support in US yields. Bessent said that the Trump administration wants to bring down 10-year Treasury yields, not the Federal Reserve's (Fed) benchmark short-term interest rate, Bloomberg reports. For this Thursday, the weekly US Jobless Claims are due, ahead of Friday’s Nonfarm Payrolls print.
Daily digest market movers: BoE draws attention
- The Bank of England (BoE) has released its monetary policy decision. As expected a 25 basis point (bps) rate cut was applied to 4.50% from 4.75%. The vote split was 7 in favor for a 25 basis point rate cut against 2 votes for a 50 basis points rate cut.
- At 12:30 GMT, the US Challenger Job Cuts for January are due. No forecast is available, with the previous number at 38,792.
- Fast forward to 13:30 GMT, the US Jobless Claims are due for the week ending January 31.
- Initial Claims are expected to head to 213,000 from 207,000 last week.
- Continuing Claims are set to jump to 1.87 million from 1.858 million.
- At 19:30 GMT, Federal Reserve Governor Christopher Waller participates in a discussion on the future payments at the GeoEconomics Center, hosted by the Atlantic Council in Washington D.C.
- San Francisco Fed President Mary Daly is set to speak as well at 20:30 GMT.
- At 22:10 GMT, Dallas Fed President Lorie Logan speaks on a panel discussion titled "Future Challenges for Monetary Policy in the Americas" at an event in Mexico City.
- Equities are catching a breather on the back of the soothing comments from US President Donald Trump. Across the board, from China over Europe to US Futures, are in the green.
- The CME FedWatch tool projects an 85.5% chance of the Fed keeping interest rates unchanged in the next meeting on March 19.
- The US 10-year yield is trading around 4.45%, recovering from its fresh yearly low at 4.40% printed on Wednesday.
US Dollar Index Technical Analysis: Room for a breather
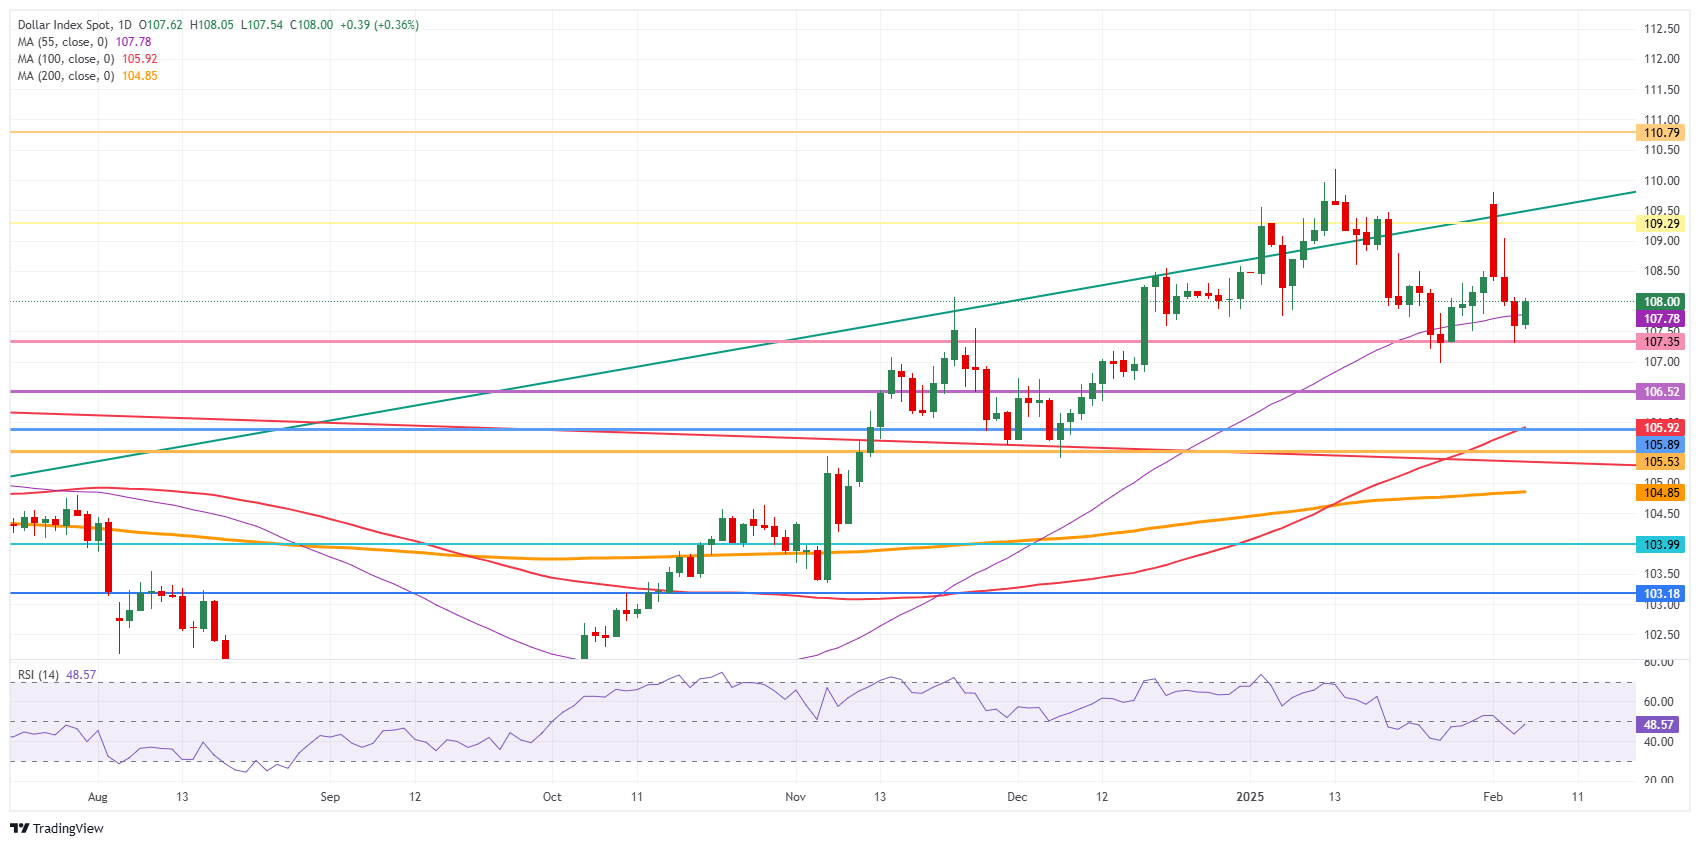
The US Dollar Index (DXY) is finally breathing a sigh of relief, bouncing off from some technical levels in several major crosses against the US Dollar. Comments from US President Donald Trump and US Treasury Secretary Scott Bessent at least helped to trigger a slight turnaround in the DXY after its past three-day decline. Meanwhile, pressure will build up in the runup to the Nonfarm Payrolls report for January, which will be released on Friday.
On the upside, the first barrier at 109.30 (July 14, 2022, high and rising trendline) was briefly surpassed but did not hold on Monday. Once that level is reclaimed, the next level to hit before advancing further remains at 110.79 (September 7, 2022, high).
On the downside, the October 3, 2023, high at 107.35 has withstood the recent selling pressure. For now, that level still looks to be holding, though watch out for the Relative Strength Index (RSI), which still has some room for the downside. Hence, look for 106.52 (April 16, 2024, high) or even 105.90 (resistance in June 2024 and 100-day Simple Moving Average) as better support levels.
US Dollar Index: Daily Chart
US Dollar FAQs
The US Dollar (USD) is the official currency of the United States of America, and the ‘de facto’ currency of a significant number of other countries where it is found in circulation alongside local notes. It is the most heavily traded currency in the world, accounting for over 88% of all global foreign exchange turnover, or an average of $6.6 trillion in transactions per day, according to data from 2022. Following the second world war, the USD took over from the British Pound as the world’s reserve currency. For most of its history, the US Dollar was backed by Gold, until the Bretton Woods Agreement in 1971 when the Gold Standard went away.
The most important single factor impacting on the value of the US Dollar is monetary policy, which is shaped by the Federal Reserve (Fed). The Fed has two mandates: to achieve price stability (control inflation) and foster full employment. Its primary tool to achieve these two goals is by adjusting interest rates. When prices are rising too quickly and inflation is above the Fed’s 2% target, the Fed will raise rates, which helps the USD value. When inflation falls below 2% or the Unemployment Rate is too high, the Fed may lower interest rates, which weighs on the Greenback.
In extreme situations, the Federal Reserve can also print more Dollars and enact quantitative easing (QE). QE is the process by which the Fed substantially increases the flow of credit in a stuck financial system. It is a non-standard policy measure used when credit has dried up because banks will not lend to each other (out of the fear of counterparty default). It is a last resort when simply lowering interest rates is unlikely to achieve the necessary result. It was the Fed’s weapon of choice to combat the credit crunch that occurred during the Great Financial Crisis in 2008. It involves the Fed printing more Dollars and using them to buy US government bonds predominantly from financial institutions. QE usually leads to a weaker US Dollar.
Quantitative tightening (QT) is the reverse process whereby the Federal Reserve stops buying bonds from financial institutions and does not reinvest the principal from the bonds it holds maturing in new purchases. It is usually positive for the US Dollar.
-
13:03
Mexico Consumer Confidence: 47.1 (January) vs previous 47.3
-
13:02
Mexico Consumer Confidence s.a dipped from previous 47.1 to 46.7 in January
-
13:01
United Kingdom BoE MPC Vote Rate Hike in line with forecasts (0)
-
13:00
United Kingdom BoE Interest Rate Decision meets forecasts (4.5%)
-
13:00
United Kingdom BoE MPC Vote Rate Unchanged came in at 0, below expectations (1)
-
12:41
USD/MXN: Short-term price action to remain between 20.12/20.00 and 21.00 – Societe Generale
USD/MXN carved out an interim high near 21.28 earlier this week and re-integrated within its multi-month range; this denotes lack of steady upward momentum, Societe Generale’s FX analysts note.
MACD experiences crisscross moves around its trigger line
“This is also highlighted by the daily MACD, which has turned flattish and has experienced crisscross moves around its trigger line. Short-term price action could remain within a range defined by limits at 20.12/20.00 and 21.00; a break beyond one of these bands is essential to confirm a directional move.”
-
12:36
CHF: SNB interest rates can turn negative again later this year – Rabobank
The next SNB policy meeting is not scheduled until March 20, Rabobank’s FX analyst Jane Foley notes.
EUR/USD to trade at 0.92 around the middle of the year
“A lot can happen in six weeks, but at this point it seems fairly likely that the central bank will announce another cut in rates. This would follow the jumbo 50 bps move at the last meeting in December. The SNB only meets once a quarter. This alone increases the chances of a move next month.”
“Arguably, it also raises the chances that policymakers could decide on another jumbo move since the next policy meeting will not be until June. That said, the SNB’s policy rate is already at 0.50%. Given the benign inflation backdrop in Switzerland and the lacklustre pace of growth there is the possibility that SNB interest rates turn negative again later this year.”
“Despite the risk of more SNB rate cuts this year, we expect safe-haven demand to continue to function as a prop for the CHF and see scope for further flurries down to the EUR/USD 0.92 level around the middle of the year.”
-
12:32
Markets price-in a BOJ policy rate of 0.75% by year-end – BBH
JPY is outperforming. Bank of Japan (BOJ) policy board member Naoki Tamura argued for a faster normalization cycle, BBH FX analysts note.
BOJ expects inflation to stabilize around its 2% target in 2026
“Tamura said ‘raising short-term interest rates to at least around 1% in the latter half of fiscal 2025 is necessary to reduce upside risk to prices and achieve the price stability target in a sustainable and stable manner.’”
“Tamura is the most hawkish board member as he was the only one to vote in favor of a rate hike in December 2024. Markets continue to price-in a BOJ policy rate of 0.75% by year-end and a terminal rate of 1.00% over the next two years.”
“This seems about right as the BOJ expects inflation to stabilize around its 2% target in 2026. The limited room for a further upward adjustment to BOJ rate expectations curtails JPY upside.”
-
12:29
USD/CNH: To trade in a range between 7.2650 and 7.3050 – UOB Group
US Dollar (USD) is expected to trade in a range between 7.2650 and 7.3050. In the longer run, outlook is mixed; USD could trade in a 7.2430/7.3580 range for now, UOB Group’s FX analysts Quek Ser Leang and Peter Chia note.
Outlook for USD/CNH is mixed
24-HOUR VIEW: “After USD fell to a low of 7.2755 two days ago and then rebounded, we indicated yesterday that ‘despite the decline, there is no clear increase in momentum. We added, ‘instead of continuing to weaken, USD is more likely to trade in a lower range of 7.2680/7.3200.’ Our view of range trading was not wrong, even though USD traded in a narrower range than expected between 7.2669/7.2939 before closing largely unchanged at 7.2829 (-0.06%). The price action provides no fresh clues. Today, we expect USD to trade in a range between 7.2650 and 7.3050.”
1-3 WEEKS VIEW: “We continue to hold the same view as yesterday (05 Feb, spot at 7.2915). As indicated, ‘the outlook for USD is mixed after the volatile price movements over the past couple of days.’ For now, it could trade in a broad range of 7.2430/7.3580.”
-
12:15
Gold hits another fresh record – ING
Gold rallied to a new all-time high amid trade war concerns that risk higher inflation and slower economic growth, spurring demand for safe-haven assets, ING’s commodity analysts Warren Patterson and Ewa Manthey notes.
Cntral banks’ buying last year exceeds 1,000 tonnes
“Gold is already up by more than 9% so far this year and has hit a series of consecutive record highs along the way. While the uncertainty over trade and tariffs continues to boost Gold prices, Trump’s latest comments that the US take over the Gaza Strip and assume responsibility for reconstructing the territory have added to Gold’s bullish momentum.”
“Meanwhile, central banks’ buying last year exceeded 1,000 tonnes for the third year in a row, accelerating sharply in the fourth quarter to 333 tonnes and bringing the net annual total to 1,045 tonnes, according to the latest data from the World Gold Council.”
“The National Bank of Poland led the charge, adding 90 tonnes to its Gold reserves last year, but demand was seen from a broad range of emerging market banks.”
-
11:45
GBP: Sterling could hand back recent gains – ING
The Bank Of England's (BoE) trade-weighted sterling index has rallied 1.7% since the middle of January. The recovery from the gilt-triggered January sell-off has undoubtedly been helped by the rally in US Treasuries. Additionally, the recent focus on tariffs has been a EUR/GBP negative, with the UK less exposed and the UK perhaps even being granted a tariff exemption from the Trump administration – if this week's comments are to be believed, ING’s FX analysts Chris Turner notes.
GBP/USD to top out this quarter in the 1.25/26 area
“However, the external environment may sour if US Treasury yields rise again, which is the house view. And the brief reprieve in the tariff noise should allow investors to refocus on the UK's fiscal and monetary mix. Fiscal will be a story for March, but today the monetary angle reappears with the Bank of England meeting.”
“We expect an 8-1 vote to cut rates and a downward revision to growth forecasts to be a mild sterling negative. Much more negative would be a 9-0 vote, should arch-hawk Catherine Mann vote for a rate cut. We continue to favour GBP/USD topping out this quarter in the 1.25/26 area and see a strong case for it to be trading close to 1.19/20 later this year.”
-
11:43
NZD/USD: Has a chance to edge above 0.5705 before levelling off – UOB Group
New Zealand Dollar (NZD) could edge above 0.5705 before levelling off; the next resistance at 0.5725 is unlikely to come under threat. In the longer run, there has been a tentative buildup in momentum; NZD could rise gradually to 0.5725, UOB Group’s FX analysts Quek Ser Leang and Peter Chia note.
Next resistance at 0.5725 is unlikely to come under threat
24-HOUR VIEW“Although we noted ‘a slight increase in upward momentum’ yesterday, we were of the view that NZD ‘is likely to trade in a higher range of 0.5605/0.5680.’ Instead of trading in a range, NZD rose, reaching a high of 0.5703. Upward momentum has increased further, albeit not much. Today, NZD could edge above 0.5705 before levelling off. The next resistance at 0.5725 is unlikely to come under threat. Support is at 0.5665; a breach of 0.5645 would mean that the current mild upward momentum has eased.”
1-3 WEEKS VIEW: “We highlighted two days ago (04 Feb, spot at 0.5625) that ‘the current price movements appear to be part of a range trading phase, likely between 0.5510 and 0.5705.’ Yesterday, NZD rose to within a couple of pips of 0.5705 (high of 0.5703). There has been a tentative buildup in momentum. From here, NZD could rise gradually to 0.5725. Currently, it is too soon to determine if NZD can break clearly above this resistance level. The upward pressure will remain intact as long as NZD remains above the ‘strong support’ level, currently at 0.5615.”
-
11:42
AUD/USD: Can edge higher and test 0.6310 – UOB Group
While conditions remain overbought, AUD could edge higher and test 0.6310. A sustained rise above this level is unlikely. In the longer run, If AUD closes above 0.6310, it could trigger an advance to 0.6355, UOB Group’s FX analysts Quek Ser Leang and Peter Chia note.
Above 0.6310, AUD can trigger an advance to 0.6355
24-HOUR VIEW: “We noted yesterday that ‘there has been an increase in momentum, and today, a break above 0.6265 will not be surprising.’ However, we indicated that ‘overbought conditions suggest any further advance is unlikely to reach the major resistance at 0.6310.’ Our view was not wrong, as AUD rose to 0.6296, closing at 0.6285 (+0.45%). While conditions remain overbought, AUD could edge higher and test 0.6310 today. A sustained rise above this level seems unlikely. On the downside, support levels are at 0.6265 and 0.6245.”
1-3 WEEKS VIEW: “In our update from Tuesday (04 Feb, spot at 0.6215), we highlighted that the recent ‘buildup in downward momentum has largely faded.’ We expected AUD to ‘trade in a range, probably between 0.6080 and 0.6310.’ AUD edged higher to a high of 0.6296 yesterday (Wednesday). Upward momentum is beginning to build, and if AUD closes above 0.6310, it could trigger an advance to 0.6355. The chance of AUD closing above 0.6310 will increase in the coming days as long as 0.6200 (‘strong support’ level) is not breached.”
-
11:41
EUR/USD declines as US Dollar gains ground ahead of US NFP
- EUR/USD slumps to near 1.0360 as the US Dollar rebounds, with investors turning cautious ahead of Friday’s US NFP data release for January.
- Chicago Fed President Goolsbee said it is difficult to predict whether inflation will accelerate from overheating or due to US President Trump’s tariffs.
- ECB policymaker Centeno anticipates that interest rates could go below the neutral rate.
EUR/USD corrects to near 1.0360 in Thursday’s European session. The major currency pair drops as the US Dollar (USD) gains ground after a sharp downside move in the last three trading days. The US Dollar Index (DXY), which tracks the Greenback’s value against six major currencies, rebounds to near 108.00 from the weekly low of 107.30.
The recovery in the US Dollar appears to be the result of investors' caution ahead of the January nonfarm Payrolls (NFP) data, which will be released on Friday. The upbeat ADP Employment Change data for January has set a positive tone for the official employment data. ADP reported on Wednesday that the private sector added 183K workers last month, significantly higher than estimates of 150K and the prior release of 176 K.
Investors will pay close attention to Friday’s US employment data as it will influence market speculation for how long the Federal Reserve (Fed) will keep interest rates steady in the current range of 4.25%-4.50%. Last week, Fed Chair Jerome Powell said that the central bank would make monetary policy adjustments only after seeing “real progress in inflation or at least some weakness in the labor market”.
Meanwhile, Fed officials are uncertain about the monetary policy outlook as they struggle to predict the impact of US President Donald Trump’s economic agenda. On Wednesday, Chicago Fed Bank President Austan Goolsbee said, "If we see inflation rising or progress stalling in 2025, the Fed will be in the difficult position of trying to figure out if the inflation is coming from overheating or if it's coming from tariffs.”
Daily digest market movers: EUR/USD weakens as ECB Centeno delivers dovish policy guidance
- The recovery move in the EUR/USD pair is also driven by some weakness in the Euro (EUR) amid firm expectations that the European Central Bank (ECB) will continue gradually reducing interest rates. Last week, the ECB cut its Deposit Facility rate by 25 basis points (bps) to 2.75%, and officials see more coming this year.
- On Wednesday, ECB policymaker and Governor of the Bank of Portugal Mario Centeno said in an interview with Reuters that it was pretty clear that we have to keep the “trajectory of interest rates going down”. Centeno didn’t provide a specific policy-easing path but highlighted that we need to go to a neutral rate “sooner rather than later”. Centeno cautioned that the ECB could go “below the neutral rate” as the Eurozone economy is not “strong enough to support inflation at 2%”.
- When asked about the impact of a global trade war on the Eurozone due to US President Donald Trump’s tariff agenda, Mario Centeno said that a 10% levy on China would have some deflationary effect in the trading bloc. He added that Trump’s tariffs on Europe can be “quite impactful," but scrutinization of the impact of global tariffs would be predictable after March.
- Market participants anticipate that US President Trump will turn to the Eurozone after dealing with China. Over the weekend, Trump said that tariffs will definitely happen with the European Union and “I can tell you that because they've really taken advantage of us".
- On the economic front, Eurozone Retail Sales data for December has come in weaker than expected. Month-on-month Retail Sales declined at a faster pace of 0.2% than estimates of 0.1%. In November, Retail Sales remained flat.
Technical Analysis: EUR/USD fails to hold above 1.0400
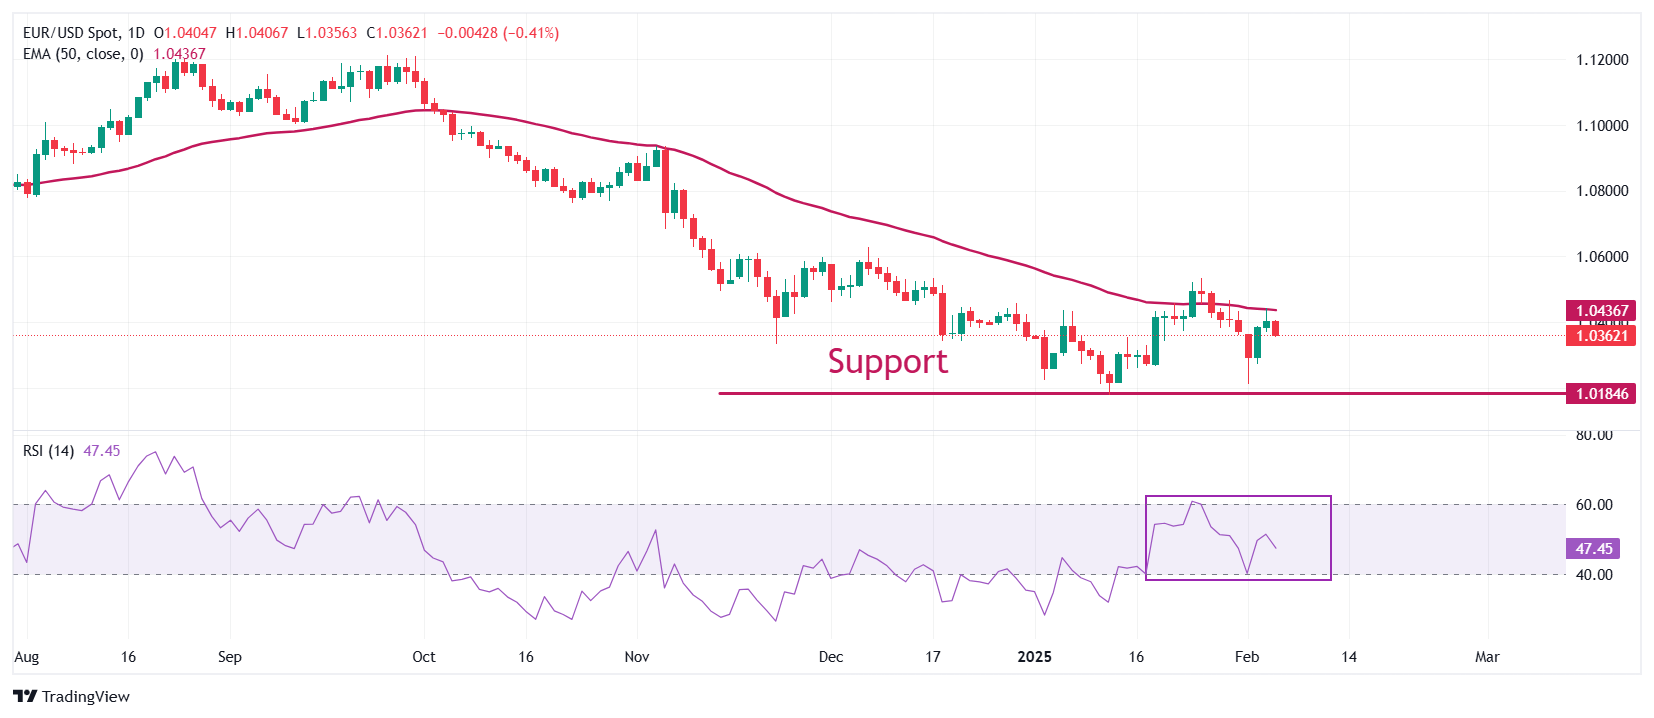
EUR/USD drops to near 1.0360 in European trading hours on Thursday after failing to sustain above the key level of 1.0400 the prior day. The major currency pair faces pressure near the 50-day Exponential Moving Average (EMA) around 1.0437, suggesting that the overall trend is still bearish.
The 14-day Relative Strength Index (RSI) oscillates in the 40.00-60.00 range, indicating a sideways trend.
Looking down, the January 13 low of 1.0177 and the round-level support of 1.0100 will act as major support zones for the pair. Conversely, the psychological resistance of 1.0500 will be the key barrier for the Euro bulls.
Euro FAQs
The Euro is the currency for the 19 European Union countries that belong to the Eurozone. It is the second most heavily traded currency in the world behind the US Dollar. In 2022, it accounted for 31% of all foreign exchange transactions, with an average daily turnover of over $2.2 trillion a day. EUR/USD is the most heavily traded currency pair in the world, accounting for an estimated 30% off all transactions, followed by EUR/JPY (4%), EUR/GBP (3%) and EUR/AUD (2%).
The European Central Bank (ECB) in Frankfurt, Germany, is the reserve bank for the Eurozone. The ECB sets interest rates and manages monetary policy. The ECB’s primary mandate is to maintain price stability, which means either controlling inflation or stimulating growth. Its primary tool is the raising or lowering of interest rates. Relatively high interest rates – or the expectation of higher rates – will usually benefit the Euro and vice versa. The ECB Governing Council makes monetary policy decisions at meetings held eight times a year. Decisions are made by heads of the Eurozone national banks and six permanent members, including the President of the ECB, Christine Lagarde.
Eurozone inflation data, measured by the Harmonized Index of Consumer Prices (HICP), is an important econometric for the Euro. If inflation rises more than expected, especially if above the ECB’s 2% target, it obliges the ECB to raise interest rates to bring it back under control. Relatively high interest rates compared to its counterparts will usually benefit the Euro, as it makes the region more attractive as a place for global investors to park their money.
Data releases gauge the health of the economy and can impact on the Euro. Indicators such as GDP, Manufacturing and Services PMIs, employment, and consumer sentiment surveys can all influence the direction of the single currency. A strong economy is good for the Euro. Not only does it attract more foreign investment but it may encourage the ECB to put up interest rates, which will directly strengthen the Euro. Otherwise, if economic data is weak, the Euro is likely to fall. Economic data for the four largest economies in the euro area (Germany, France, Italy and Spain) are especially significant, as they account for 75% of the Eurozone’s economy.
Another significant data release for the Euro is the Trade Balance. This indicator measures the difference between what a country earns from its exports and what it spends on imports over a given period. If a country produces highly sought after exports then its currency will gain in value purely from the extra demand created from foreign buyers seeking to purchase these goods. Therefore, a positive net Trade Balance strengthens a currency and vice versa for a negative balance.
-
11:40
USD: Dollar bull trend situation report – ING
The DXY dollar index is roughly 2% off its recent highs and the question for investors is whether a further 1-2% is required. Driving this correction have been several factors, the largest of which has probably been this week's tariff news, where it looks like the Trump administration has been using tariffs for transactional not ideological purposes (this may change in the second quarter), ING’s FX analyst, ING’s FX analysts Chris Turner notes.
DXY probably trades in a tightish 107.50-108.00 range
“Important as well has been the drop in 10-year US Treasury yields below 4.50%. A well-received Quarterly Refunding announcement yesterday certainly helped. Our rate strategy colleagues discuss that move here. The move lower in USD/JPY has caught the attention as data and Bank of Japan commentary have built up confidence in this year's BoJ tightening cycle.”
“Determining whether DXY corrects another 1-2% will probably be tomorrow's jobs data. We saw earlier this week from the US JOLTS job opening data that soft figures can hit the dollar. Yet we doubt the dollar correction will last too long. We look for more structural and broader tariffs to come back into play in the second quarter. Our rates team also doubts US Treasury yields will drop much further from here.”
“So while a soft NFP number tomorrow could drag DXY back towards the 106.35/50 area – we would see that area as the bottom of the trading range this first quarter. Today the US calendar is pretty light. Unless jobless claims rise dramatically, DXY probably trades in a tightish 107.50-108.00 range.”
-
11:36
USD/JPY: Might not be able to break the significant support at 151.80 – UOB Group
US Dollar (USD) could drop further; given the oversold conditions, it might not be able to break the significant support at 151.80. In the longer run, outlook for USD is negative but note the significant support level at 151.80, UOB Group’s FX analysts Quek Ser Leang and Peter Chia note.
USD is negative but might not reach 151.80
24-HOUR VIEW: “We noted in early Asian trade yesterday that USD ‘is under mild downward pressure and could edge lower.’ However, we were of the view that ‘any decline is unlikely to break below 153.70.’ We did not expect the steep selloff that sent USD plunging by 1.12% (152.60). Despite the deeply oversold conditions, the weakness has not stabilised. Today, USD could drop further, but given the oversold conditions, it might not be able to break the significant support at 151.80. Note that yesterday’s low of 152.10 is expected to provide support as well. On the upside, any recovery is likely to remain below 153.50 (minor resistance is at 153.00).”
1-3 WEEKS VIEW: “Two days ago (04 Feb, spot at 155.20), we indicated, USD ‘is likely to trade in a 153.70/156.70 range for the time being.’ Yesterday, we highlighted that ‘looking ahead, if USD were to break and remain below 153.70, it could trigger a sustained drop.’ However, we did not expect the sudden sharp plunge that reached a low of 152.10. While we are revising our outlook for USD to negative, note that there is a significant support level at 151.80. We will maintain our view provided that USD remains below 154.30.”
-
11:29
EUR/GBP Price Forecast: Gains ahead of BoE’s policy decision
- EUR/GBP moves higher to near 0.8333 ahead of the BoE’s monetary policy decision at 12:00 GMT.
- The BoE is expected to reduce interest rates by 25 bps to 4.5%.
- ECB Centano sees interest rates falling below the neutral rate.
The EUR/GBP pair rises to near 0.8333 in Thursday’s European session. The cross gains as the Pound Sterling (GBP) weakens across the board ahead of the Bank of England’s (BoE) monetary policy decision, which will be announced at 12:00 GMT.
Traders have fully priced in a 25-basis points (bps) interest rate reduction that will push borrowing rates lower to 4.5%, with an 8-1 vote split. Therefore, the next move in the British currency will be influenced by the monetary policy guidance from BoE Governor Andrew Bailey at the press conference after the interest rate decision.
Andrew Bailey is unlikely to deliver dovish guidance as analysts at Citi expect an uptick in inflation ahead due to expectations of a reversal in energy prices and strong wage growth.
Meanwhile, investors have underpinned the Euro (EUR) against the Pound Sterling but is underperforming its major peers too as European Central Bank (ECB) policymaker and Governor of Bank of Portugal Mario Centano has guided a dovish interest rate outlook. Centano expects the Deposit Facility rate could go below the neutral rate as the economic needs stimulus to hold inflation at 2% target.
On the economic front, Eurozone Retail Sales data for December has come in weaker than expected. Month-on-month Retail Sales declined at a faster pace of 0.2% than estimates of 0.1%. In November, Retail Sales remained flat.
EUR/GBP bounces back after retracing a little over 61.8% from the January 20 high of 0.8474 to near 0.8290. The outlook of the cross is still bearish as it stays below the 50-day Exponential Moving Average (EMA), which trades around 0.8350.
The 14-day Relative Strength Index (RSI) rebounds from 40.00, which suggests a sideways trend ahead until it stays in the 40.00-60.00 range.
A fresh upside move in the pair would appear if it breaks the February 3 high of 0.8361. This scenario would drive the cross towards 38.2% Fibonacci retracement at 0.8380, followed by the round-level resistance of 0.8400.
On the flip side, a downside move by the pair below the February 3 low of 0.8290 will expose it towards the January 2 low of 0.8267 and the December 19 low of 0.8222.
EUR/GBP daily chart
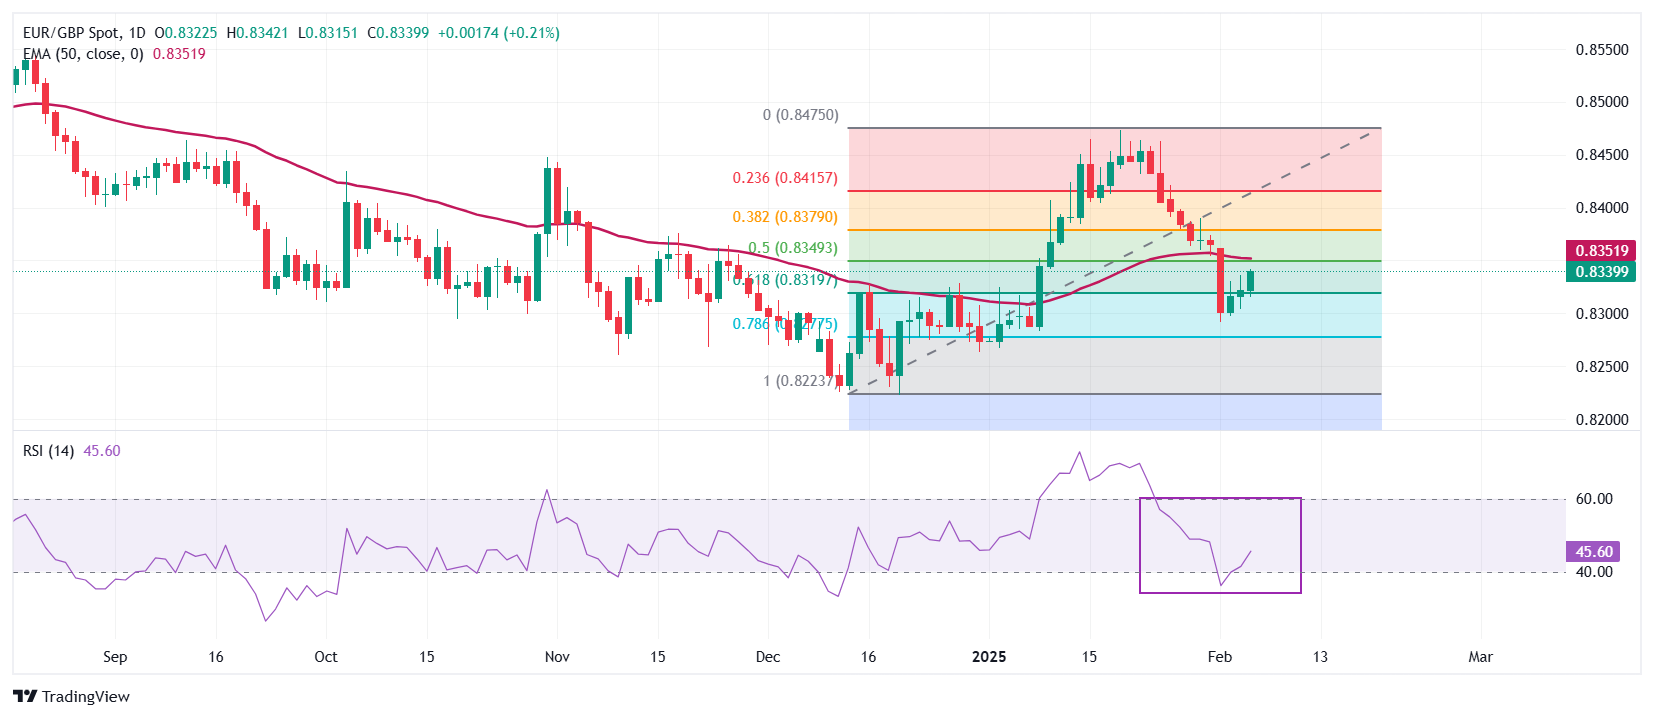
-
11:24
Saudis boost official selling prices – ING
The oil market sold off yesterday despite US President Trump’s directive to increase economic pressure on Iran, which would include targeting oil exports from the country. Instead, the market focused on the tariff story, a theme likely to dictate sentiment for much of this year. In addition, the EIA’s weekly inventory report was fairly bearish with a large increase in crude oil stocks over the last week, ING’s commodity analysts Warren Patterson and Ewa Manthey notes.
Cold weather boosts distillate demand
“EIA data showed that commercial US crude oil inventories increased by 8.66m barrels over the last week, the largest build since February 2024. The increase was driven by strong imports, which grew by 467k b/d WoW with stronger flows from Canada, which increased 347k b/d. In addition, oil output recovered last week, following the impact of winter storms.”
“Crude oil output in the Lower 48 is estimated to have grown by 232k b/d. Refiners also increased their utilisation rates by 2.4pp over the week, which saw gasoline inventories rising by 2.23m barrels. However, distillate stocks fell by 5.47m barrels over the week. Cold weather boosted distillate demand, with implied demand hitting its highest level since early 2022.”
“So far today, oil prices are holding up better as Saudi Arabia has increased its official selling prices for all grades and to all regions for March loadings. This ties in with the strength that we have seen in the Middle East physical market since the start of the year. Aramco’s flagship Arab Light into Asia was increased by US$2.40/bbl to US$3.90/bbl over the benchmark – the highest level since December 2023. It is also the largest monthly increase since August 2022.”
-
11:05
Spain 10-y Obligaciones Auction dipped from previous 2.743% to 2.23%
-
11:05
Spain 3-y Bond Auction dipped from previous 2.586% to 2.388%
-
11:05
Eurozone Retail Sales rise 1.9% YoY in December, as expected
- Eurozone annual Retail Sales rose 1.9% in December.
- Retail Sales in the old continent arrived at -0.2% MoM in December.
Eurozone’s Retail Sales rose 1.9% in the year through December after increasing by a revised 1.6% in November, the official data released by Eurostat showed on Thursday. The data aligned with the market expectations.
On a monthly basis, Retail Sales in the old continent declined by 0.2% in the same period versus November’s 0% revision while coming in below the estimated -0.1% drop.
FX implications
The Eurozone data fails to lift the Euro. At the time of writing, the EUR/USD pair is trading 0.40% lower on the day at 1.0361.
-
11:03
France 10-y Bond Auction: 3.15% vs previous 3.4%
-
11:00
Gold rally stalls as US Treasury Secretary Bessent says Trump’s focus is on lowering 10-year yields, not Fed
- Gold’s all-time high currently stands at $2,882.35 printed on Wednesday.
- Bullion caught by surprise after comments from US Treasury Secretary Bessent revealing Trump wants to bring down 10-year yields, not Fed rate cuts.
- Gold snaps winning streak and faces selling pressure this Thursday in Asia.
Gold’s price (XAU/USD) sees its rally stall this Thursday and trades around $2,857 at the time of writing. The slide is mainly triggered by comments from US Treasury Secretary Scott Bessent, who said that the Trump administration's focus is on bringing down 10-year Treasury yields, not the Federal Reserve's (Fed) benchmark short-term interest rate, Bloomberg reports.
On the economic data front, all eyes will be on the Bank of England monetary policy decision, where a 25 basis point (bps) interest rate cut is expected, to 4.50% after cutting it by 50 bps throughout 2024. Besides that, Federal Reserve (Fed) Governor Christopher Waller, San Francisco Fed President Mary Daly and Dallas Fed President Lorie Logan will speak later this Thursday, ahead of Friday’s Nonfarm Payrolls data release.
Daily digest market movers: Gold cracks under profit-taking pressure
- Comments from US President Donald Trump on Gaza and a new nuclear deal with Iran are soothing the tail risk element in the markets, which makes investors pare back some positions in Gold, Bloomberg reports. Trump is also expected to present a plan next week to end the war in Ukraine, which will help to ease the risk premium further.
- Commodity markets are poised to break out of a two-year slump as a rally in precious metal and agriculture prices takes place. The Bloomberg Commodity Total Return Index, which trades a basket of 24 energy, metals, and agricultural futures, has already jumped 5.9 percent this year to its highest level since the end of 2022 – which was a golden year for raw materials as economies returned from COVID-19 hibernation and the war in Ukraine wreaked havoc on supply chains, Bloomberg reports.
- Gold in the Bank of England vault is trading at a discount to the wider market, as fears over potential Trump’s tariffs spark a scramble for bullion that’s resulting in weeks-long queues to withdraw metal, Reuters reports.
- The Bank of England is set to release its monetary policy decision at 12:00 GMT. The expectation is for a 25 basis point interest rate cut from 4.75% to 4.50%.
Technical Analysis: Markets are having it hard to follow
Markets need to change their stance quite quickly, which means that Gold is not in the sweet spot this Thursday. ‘Peaceful’ comments from US President Donald Trump are taking markets by surprise and supporting a more risky stance, which means safe havens are out of favour. With Gold being clearly one of those, selling pressure on Thursday could persist until a contradictory headline or comment comes out.
The S1 support level on Thursday is the first nearby support at $2,8343. From there, S2 support should come in at $2,820. In case of a correction, the bigger $2,790 level (the previous high of October 31, 2024) should be able to catch any falling knives.
On the upside, R1 resistance comes in at $2,886, just slightly above the current all-time high. In case the rally can pick up where it left off, the upside level to beat in terms of daily pivotal levels is R2 resistance near $2,905 after breaking above $2,900.
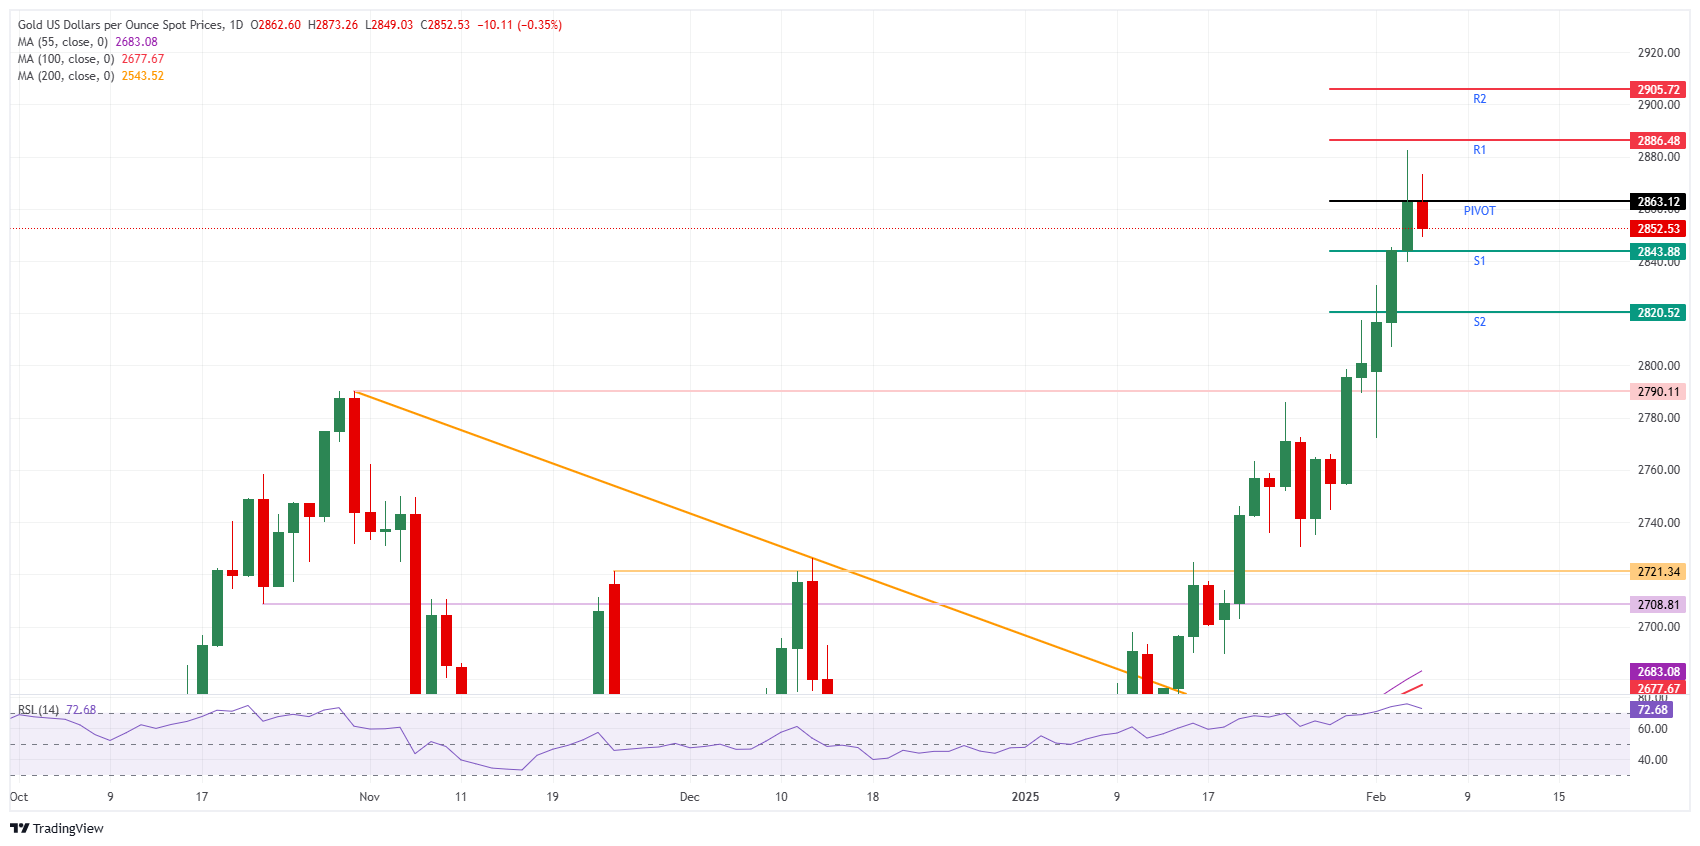
XAU/USD: Daily Chart
Gold FAQs
Gold has played a key role in human’s history as it has been widely used as a store of value and medium of exchange. Currently, apart from its shine and usage for jewelry, the precious metal is widely seen as a safe-haven asset, meaning that it is considered a good investment during turbulent times. Gold is also widely seen as a hedge against inflation and against depreciating currencies as it doesn’t rely on any specific issuer or government.
Central banks are the biggest Gold holders. In their aim to support their currencies in turbulent times, central banks tend to diversify their reserves and buy Gold to improve the perceived strength of the economy and the currency. High Gold reserves can be a source of trust for a country’s solvency. Central banks added 1,136 tonnes of Gold worth around $70 billion to their reserves in 2022, according to data from the World Gold Council. This is the highest yearly purchase since records began. Central banks from emerging economies such as China, India and Turkey are quickly increasing their Gold reserves.
Gold has an inverse correlation with the US Dollar and US Treasuries, which are both major reserve and safe-haven assets. When the Dollar depreciates, Gold tends to rise, enabling investors and central banks to diversify their assets in turbulent times. Gold is also inversely correlated with risk assets. A rally in the stock market tends to weaken Gold price, while sell-offs in riskier markets tend to favor the precious metal.
The price can move due to a wide range of factors. Geopolitical instability or fears of a deep recession can quickly make Gold price escalate due to its safe-haven status. As a yield-less asset, Gold tends to rise with lower interest rates, while higher cost of money usually weighs down on the yellow metal. Still, most moves depend on how the US Dollar (USD) behaves as the asset is priced in dollars (XAU/USD). A strong Dollar tends to keep the price of Gold controlled, whereas a weaker Dollar is likely to push Gold prices up.
-
11:00
Eurozone Retail Sales (MoM) came in at -0.2% below forecasts (-0.1%) in December
-
11:00
Eurozone Retail Sales (YoY) meets forecasts (1.9%) in December
-
10:45
Spain 30-y Bond Auction: 3.691% vs previous 3.877%
-
10:33
GBP/USD: Above 1.2550 a sustained can be expected – UOB Group
The Pound Sterling (GBP) is expected to consolidate in a 1.2460/1.2540 range. In the longer run, GBP has to break and remain above 1.2550 before a sustained advance can be expected, UOB Group’s FX analysts Quek Ser Leang and Peter Chia note.
While above 1.2370, GBP can still test 1.2550
24-HOUR VIEW: “When GBP was at 1.2480 yesterday, we indicated that it ‘could rise further, but given the overbought conditions, a sustained break above 1.2530 appears unlikely.’ We also pointed out that ‘support levels are at 1.2450 and 1.2420.” GBP subsequently dipped to 1.2465, rose to 1.2550, closing at 1.2506 (+0.20%). The price action did not result in any further increase in momentum. This, combined with overbought conditions, is likely to lead to consolidation. Expected range for today: 1.2460/1.2540.”
1-3 WEEKS VIEW: “Our latest narrative was from two days ago (04 Feb, spot at 1.2430), wherein ‘for the time being, we expect GBP to trade in a range of 1.2245/1.2530.’ Yesterday, GBP rose above 1.2530, reaching a high of 1.2550. Upward momentum is increasing, but not enough to suggest a sustained advance. For a sustained advance, GBP has to break and remain above 1.2550. The probability of GBP breaking clearly above 1.2550 will remain intact as long as 1.2370 (‘strong support’ level) is not breached.”
-
10:30
Silver price today: Silver falls, according to FXStreet data
Silver prices (XAG/USD) fell on Thursday, according to FXStreet data. Silver trades at $32.08 per troy ounce, down 0.53% from the $32.25 it cost on Wednesday.
Silver prices have increased by 11.03% since the beginning of the year.
Unit measure Silver Price Today in USD Troy Ounce 32.08 1 Gram 1.03
The Gold/Silver ratio, which shows the number of ounces of Silver needed to equal the value of one ounce of Gold, stood at 89.05 on Thursday, up from 88.76 on Wednesday.
Silver FAQs
Silver is a precious metal highly traded among investors. It has been historically used as a store of value and a medium of exchange. Although less popular than Gold, traders may turn to Silver to diversify their investment portfolio, for its intrinsic value or as a potential hedge during high-inflation periods. Investors can buy physical Silver, in coins or in bars, or trade it through vehicles such as Exchange Traded Funds, which track its price on international markets.
Silver prices can move due to a wide range of factors. Geopolitical instability or fears of a deep recession can make Silver price escalate due to its safe-haven status, although to a lesser extent than Gold's. As a yieldless asset, Silver tends to rise with lower interest rates. Its moves also depend on how the US Dollar (USD) behaves as the asset is priced in dollars (XAG/USD). A strong Dollar tends to keep the price of Silver at bay, whereas a weaker Dollar is likely to propel prices up. Other factors such as investment demand, mining supply – Silver is much more abundant than Gold – and recycling rates can also affect prices.
Silver is widely used in industry, particularly in sectors such as electronics or solar energy, as it has one of the highest electric conductivity of all metals – more than Copper and Gold. A surge in demand can increase prices, while a decline tends to lower them. Dynamics in the US, Chinese and Indian economies can also contribute to price swings: for the US and particularly China, their big industrial sectors use Silver in various processes; in India, consumers’ demand for the precious metal for jewellery also plays a key role in setting prices.
Silver prices tend to follow Gold's moves. When Gold prices rise, Silver typically follows suit, as their status as safe-haven assets is similar. The Gold/Silver ratio, which shows the number of ounces of Silver needed to equal the value of one ounce of Gold, may help to determine the relative valuation between both metals. Some investors may consider a high ratio as an indicator that Silver is undervalued, or Gold is overvalued. On the contrary, a low ratio might suggest that Gold is undervalued relative to Silver.
(An automation tool was used in creating this post.)
-
10:30
United Kingdom S&P Global/CIPS Construction PMI below expectations (53.4) in January: Actual (48.1)
-
10:16
WTI price remains above $71.00 as Saudi Aramco raises march oil prices for Asia
- WTI price received support as Saudi Aramco raised prices for Asian buyers amid rising demand, along with supply disruptions.
- EIA Crude Oil Stocks Change showed an 8.664 million-barrel increase for the previous week, against an expected 2.6 million-barrel increase.
- China’s tariffs on American crude oil have raised concerns over weakened global demand.
West Texas Intermediate (WTI) Oil price holds modest gains after three consecutive days of losses, trading around $71.10 per barrel during European trading hours on Thursday. This rebound in crude Oil prices comes after Saudi Arabia’s state Oil giant, Aramco, raised prices for Asian buyers.
Aramco’s price hike was driven by rising demand from China and India, along with disruptions to Russian supply due to US sanctions. Further supply risks persist as US President Donald Trump’s renewed push to eliminate Iran’s Oil exports could remove up to 1.5 million barrels per day from the market.
On Wednesday, Oil prices dropped more than 2% as a sharp increase in US crude and gasoline stockpiles signaled weaker demand. US crude inventories surged by 8.664 million barrels for the week ending January 31, 2025, the largest build in nearly a year, far exceeding market expectations of a 2.6 million-barrel increase. Meanwhile, distillate stockpiles, which include diesel and heating Oil, declined by 5.471 million barrels, compared to an expected draw of 1.5 million barrels.
Adding to market pressure, ongoing US-China trade tensions intensified as China imposed tariffs on American coal, LNG, and crude Oil, fueling concerns over weakened global demand. Additionally, these retaliatory measures could lead to a decline in US Oil exports in 2025 for the first time since the COVID-19 pandemic, following a plateau in growth last year.
WTI Oil FAQs
WTI Oil is a type of Crude Oil sold on international markets. The WTI stands for West Texas Intermediate, one of three major types including Brent and Dubai Crude. WTI is also referred to as “light” and “sweet” because of its relatively low gravity and sulfur content respectively. It is considered a high quality Oil that is easily refined. It is sourced in the United States and distributed via the Cushing hub, which is considered “The Pipeline Crossroads of the World”. It is a benchmark for the Oil market and WTI price is frequently quoted in the media.
Like all assets, supply and demand are the key drivers of WTI Oil price. As such, global growth can be a driver of increased demand and vice versa for weak global growth. Political instability, wars, and sanctions can disrupt supply and impact prices. The decisions of OPEC, a group of major Oil-producing countries, is another key driver of price. The value of the US Dollar influences the price of WTI Crude Oil, since Oil is predominantly traded in US Dollars, thus a weaker US Dollar can make Oil more affordable and vice versa.
The weekly Oil inventory reports published by the American Petroleum Institute (API) and the Energy Information Agency (EIA) impact the price of WTI Oil. Changes in inventories reflect fluctuating supply and demand. If the data shows a drop in inventories it can indicate increased demand, pushing up Oil price. Higher inventories can reflect increased supply, pushing down prices. API’s report is published every Tuesday and EIA’s the day after. Their results are usually similar, falling within 1% of each other 75% of the time. The EIA data is considered more reliable, since it is a government agency.
OPEC (Organization of the Petroleum Exporting Countries) is a group of 12 Oil-producing nations who collectively decide production quotas for member countries at twice-yearly meetings. Their decisions often impact WTI Oil prices. When OPEC decides to lower quotas, it can tighten supply, pushing up Oil prices. When OPEC increases production, it has the opposite effect. OPEC+ refers to an expanded group that includes ten extra non-OPEC members, the most notable of which is Russia.
-
10:04
Silver Price Forecast: XAG/USD remains depressed near $32.00; bullish bias remains
- Silver retreats from a three-month high, though the downside seems limited.
- The technical setup supports prospects for the emergence of some dip-buying.
- A convincing break below the $31.00 mark would negate the positive outlook.
Silver (XAG/USD) attracts some sellers following an intraday uptick on Thursday and snaps a three-day winning streak to a three-month top, around the $32.55 region touched the previous day. The white metal sticks to its intraday losses and currently trades near the lower end of its daily range, around the $32.00 mark, down 0.75% for the day.
From a technical perspective, the recent breakout through the $31.00 confluence – comprising the 38.2% Fibonacci retracement level of the October-December fall and the 100-day Simple Moving Average (SMA) – was seen as a key trigger for bulls. A subsequent strength beyond the 50% retracement level, around the $31.70-$31.75 region, and positive oscillators on the daily chart validate the constructive setup.
Hence, any further slide below the $31.75-$31.70 area, or the daily swing low, could be seen as a buying opportunity. This, in turn, should help limit the downside for the XAG/USD near the $31.00 resistance breakpoint, now turned support. A convincing break below the latter, however, could make the XAG/USD vulnerable to accelerate the fall toward the $30.25 support zone en route to the $30.00 psychological mark.
On the flip side, the $32.55 area, or a multi-month peak touched on Wednesday, now seems to act as an immediate hurdle. Some follow-through buying should allow the XAG/USD to climb further towards reclaiming the $33.00 mark for the first time since early November. The said handle also represents the 61.8% Fibo. level, which if cleared decisively will set the stage for an extension of over a one-month-old uptrend.
Silver daily chart
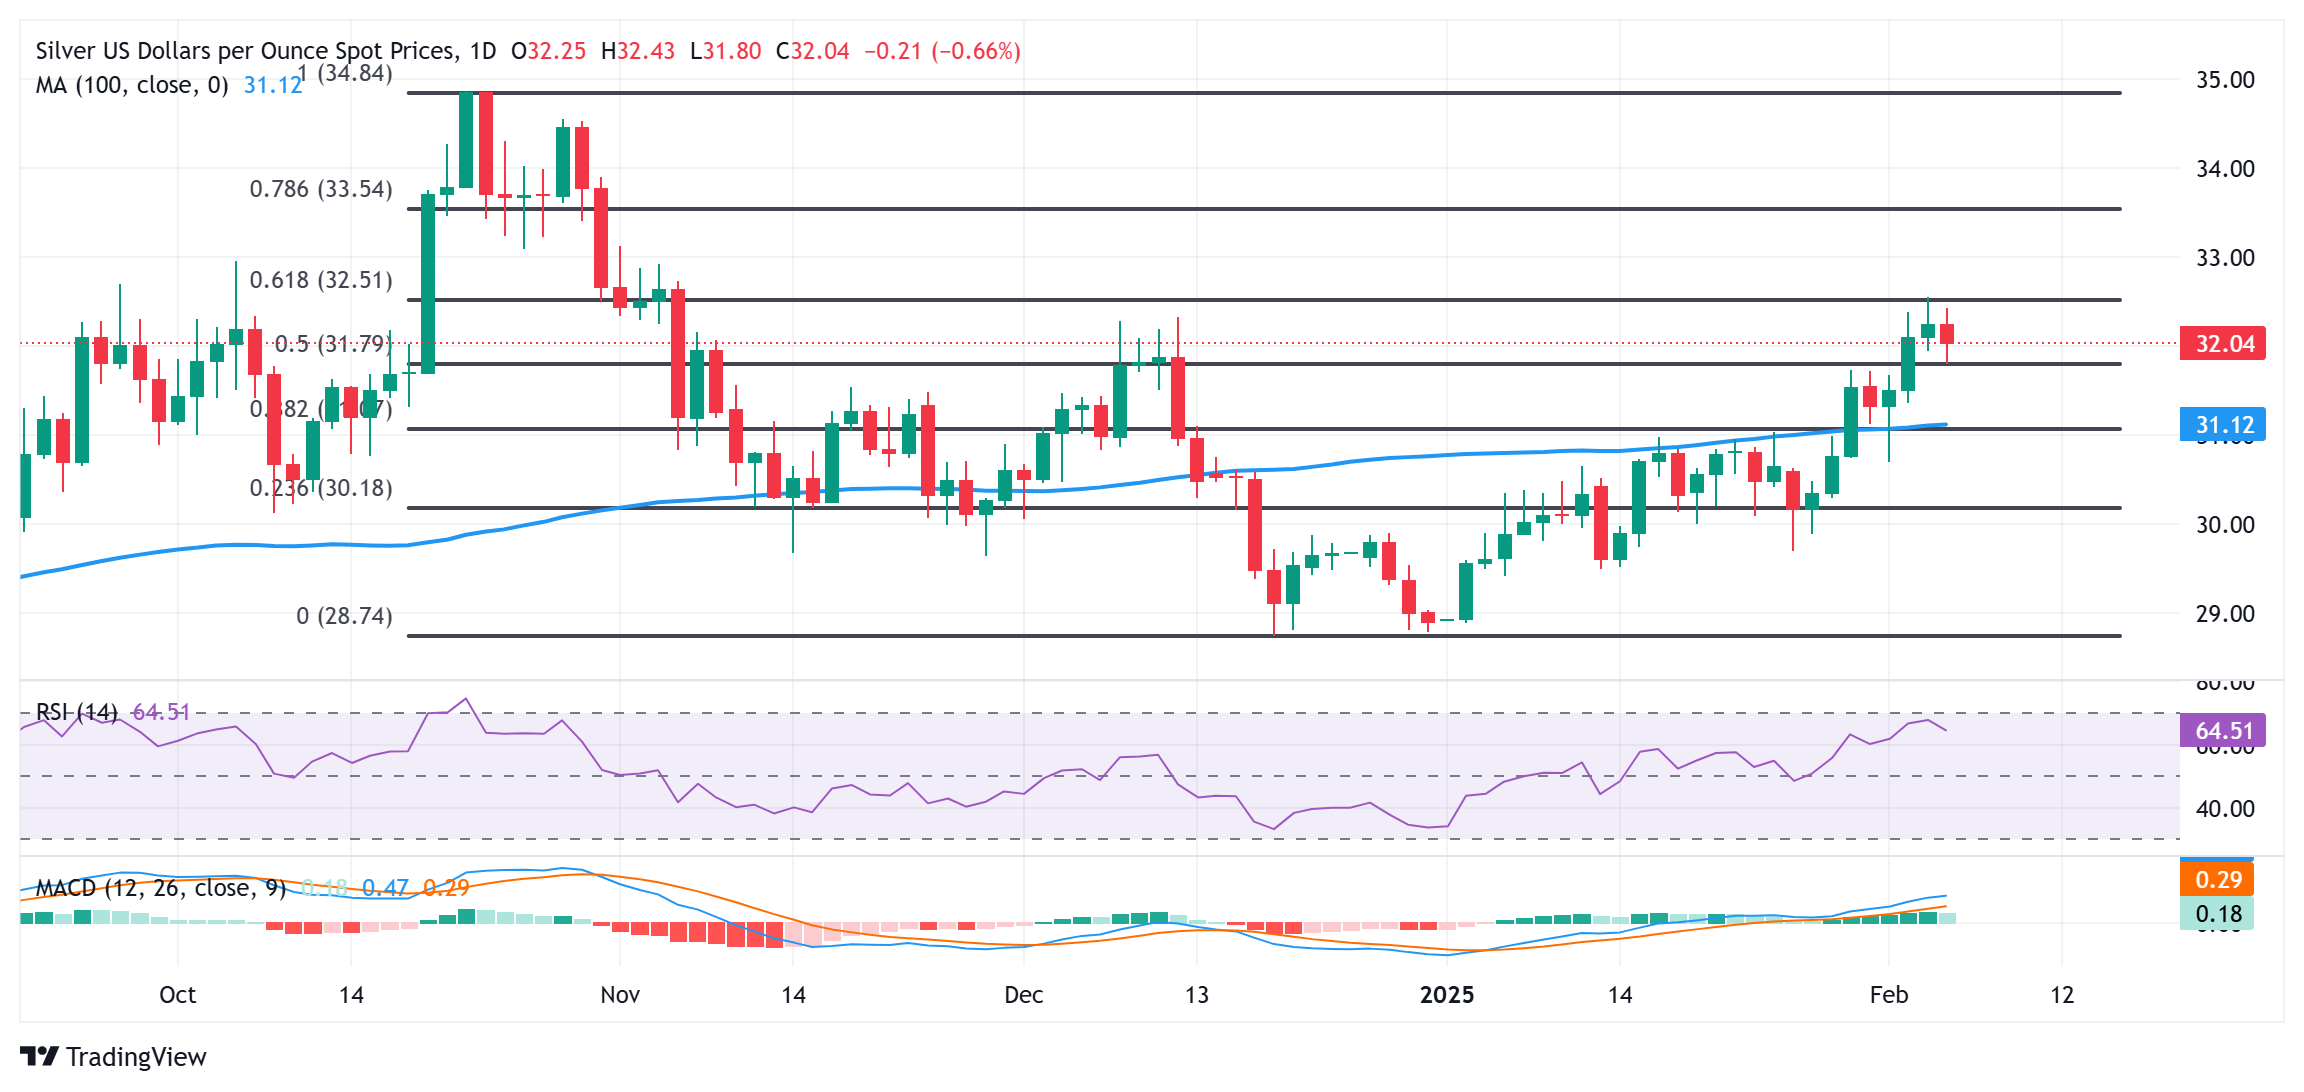
Silver FAQs
Silver is a precious metal highly traded among investors. It has been historically used as a store of value and a medium of exchange. Although less popular than Gold, traders may turn to Silver to diversify their investment portfolio, for its intrinsic value or as a potential hedge during high-inflation periods. Investors can buy physical Silver, in coins or in bars, or trade it through vehicles such as Exchange Traded Funds, which track its price on international markets.
Silver prices can move due to a wide range of factors. Geopolitical instability or fears of a deep recession can make Silver price escalate due to its safe-haven status, although to a lesser extent than Gold's. As a yieldless asset, Silver tends to rise with lower interest rates. Its moves also depend on how the US Dollar (USD) behaves as the asset is priced in dollars (XAG/USD). A strong Dollar tends to keep the price of Silver at bay, whereas a weaker Dollar is likely to propel prices up. Other factors such as investment demand, mining supply – Silver is much more abundant than Gold – and recycling rates can also affect prices.
Silver is widely used in industry, particularly in sectors such as electronics or solar energy, as it has one of the highest electric conductivity of all metals – more than Copper and Gold. A surge in demand can increase prices, while a decline tends to lower them. Dynamics in the US, Chinese and Indian economies can also contribute to price swings: for the US and particularly China, their big industrial sectors use Silver in various processes; in India, consumers’ demand for the precious metal for jewellery also plays a key role in setting prices.
Silver prices tend to follow Gold's moves. When Gold prices rise, Silver typically follows suit, as their status as safe-haven assets is similar. The Gold/Silver ratio, which shows the number of ounces of Silver needed to equal the value of one ounce of Gold, may help to determine the relative valuation between both metals. Some investors may consider a high ratio as an indicator that Silver is undervalued, or Gold is overvalued. On the contrary, a low ratio might suggest that Gold is undervalued relative to Silver.
-
09:55
EU gas prices strengthen – ING
European natural gas prices saw renewed strength yesterday with TTF settling almost 2.7% higher on the day. Forecasts for colder weather have raised concerns that we will see steeper draws in gas storage in the coming days, ING’s commodity analysts Warren Patterson and Ewa Manthey notes.
A pullback in gas prices is due
“Speculators also appear to remain supportive towards the market current gas prices leave us deep in with the latest positioning data showing that investment funds increased their net long by 5TWh over the last reporting week to 283TWh. However, with the investment fund long making up more than 31% of total open interest, the position is starting to look a bit stretched.”
“In addition, current gas prices leave us deep in the gas-to-coal switching range for the power generation sector, while LNG cargoes should continue to be diverted towards Europe, with European prices trading at a premium to Asia through until the end of the summer. This all suggests we could be due a pullback in the absence of any surprises.”
“The latest positioning data also shows that speculators increased their net long yet again in EU allowances (EUAs). Investment funds increased their net long by 2.5k contracts over the week to 55.57k contracts – the largest net long held since September 2021. EUA prices have moved significantly higher this year, breaking above EUR80/t, supported by the strength seen in European gas prices. However, demand may provide resistance further ahead, particularly if we see an escalation in trade tensions.”
-
09:54
EUR: Some renewed attention on Ukraine – ING
One wild card for EUR/USD this year is what happens in Ukraine. Yesterday the FX market took note of the further rise in Ukraine's hard currency bonds. Ukraine’s international bonds rallied some two points in price terms (3-4% price returns on the day) amid optimism that negotiations could bring a potential peace deal closer, ING’s FX analysts Chris Turner notes.
EUR/USD to trade in the 1.0370-10450 range today
“Reports that the US will unveil a peace plan at next week's Munich security conference, in addition to signs that both countries’ leaders are softening their stance towards potential talks, are positive triggers. Last year’s restructured bonds reached their highest price since issue, while the nation’s GDP warrants reached their highest price since January 2022, after steady gains since mid-2024. Developments here will be watched next week and could offer a little support to EUR/USD.”
“The question is whether tomorrow's US jobs numbers need to drive the EUR/USD correction briefly back up to the 1.0530/70 area. We cannot rule that out, but doubt that any gains above 1.05 hold for long. We're still happy to look for a move back to 1.02 later this quarter, with 1.00 the likely trajectory in the second quarter when broader US tariffs are brought in. 1.0370-10450 should be the extent of the EUR/USD range today.”
-
09:46
AUD/USD remains weak as US-China trade tensions escalate with new tariffs
- AUD/USD softens to around 0.6260 in Thursday’s early European session, down 0.44% on the day.
- The RBA is expected to deliver a rate cut to 4.1%
- The US January labor market report on Friday will be closely watched.
The AUD/USD pair weakens to near 0.6260 on Thursday during the European trading hours, pressured by rising fears over US-China trade war tensions and lower-than-expected Australian Trade Balance data. On Friday, all eyes will be on the US January labor market report, including the Nonfarm Payrolls (NFP), Unemployment Rate and Average Hourly Earnings.
Data released by the Australian Bureau of Statistics on Thursday showed that Australia’s trade surplus decreased to 5,085M MoM in December from 6,792M (revised from 7,079) in November. This reading came in lower than the 7,000M expected. Meanwhile, Exports rose by 1.1% MoM in December versus 4.2% (revised from 4.8%) prior. Imports climbed by 5.9% MoM in December, compared to 1.4% (revised from 1.7%) recorded in November.
Furthermore, the rising expectation that the Reserve Bank of Australia (RBA) will cut its interest rates for the first time since November 2020 contributes to the AUD’s downside. Money markets are now pricing in nearly a 95% chance of a rate cut from the current 4.35% to 4.10%.
Additionally, US President Donald Trump opens the door to significantly higher tariffs on other trade partners, such as the Eurozone and China. This, in turn, exerts some selling pressure on the China-proxy Australian Dollar (AUD) as China is a major trading partner to Australia.
The strength of the US Dollar is likely to persist over the coming quarters due to the hawkish stance of the US Federal Reserve (Fed). However, the US economic data released on Friday will be the highlight. Any signs of weaker labor marker conditions could drag the USD lower and help limit the pair’s losses.Australian Dollar FAQs
One of the most significant factors for the Australian Dollar (AUD) is the level of interest rates set by the Reserve Bank of Australia (RBA). Because Australia is a resource-rich country another key driver is the price of its biggest export, Iron Ore. The health of the Chinese economy, its largest trading partner, is a factor, as well as inflation in Australia, its growth rate and Trade Balance. Market sentiment – whether investors are taking on more risky assets (risk-on) or seeking safe-havens (risk-off) – is also a factor, with risk-on positive for AUD.
The Reserve Bank of Australia (RBA) influences the Australian Dollar (AUD) by setting the level of interest rates that Australian banks can lend to each other. This influences the level of interest rates in the economy as a whole. The main goal of the RBA is to maintain a stable inflation rate of 2-3% by adjusting interest rates up or down. Relatively high interest rates compared to other major central banks support the AUD, and the opposite for relatively low. The RBA can also use quantitative easing and tightening to influence credit conditions, with the former AUD-negative and the latter AUD-positive.
China is Australia’s largest trading partner so the health of the Chinese economy is a major influence on the value of the Australian Dollar (AUD). When the Chinese economy is doing well it purchases more raw materials, goods and services from Australia, lifting demand for the AUD, and pushing up its value. The opposite is the case when the Chinese economy is not growing as fast as expected. Positive or negative surprises in Chinese growth data, therefore, often have a direct impact on the Australian Dollar and its pairs.
Iron Ore is Australia’s largest export, accounting for $118 billion a year according to data from 2021, with China as its primary destination. The price of Iron Ore, therefore, can be a driver of the Australian Dollar. Generally, if the price of Iron Ore rises, AUD also goes up, as aggregate demand for the currency increases. The opposite is the case if the price of Iron Ore falls. Higher Iron Ore prices also tend to result in a greater likelihood of a positive Trade Balance for Australia, which is also positive of the AUD.
The Trade Balance, which is the difference between what a country earns from its exports versus what it pays for its imports, is another factor that can influence the value of the Australian Dollar. If Australia produces highly sought after exports, then its currency will gain in value purely from the surplus demand created from foreign buyers seeking to purchase its exports versus what it spends to purchase imports. Therefore, a positive net Trade Balance strengthens the AUD, with the opposite effect if the Trade Balance is negative.
-
09:32
EUR/USD: Likely to trade between 1.0360 and 1.0430 – UOB Group
Instead of continuing to rise, Euro (EUR) is likely to trade between 1.0360 and 1.0430. In the longer run, outlook is unclear; EUR could trade in a broad range of 1.0250/1.0490 for the time being, UOB Group’s FX analysts Quek Ser Leang and Peter Chia note.
Outlook for Euro is unclear for now
24-HOUR VIEW: “We indicated yesterday that EUR ‘could continue to rise, but any advance is unlikely to break clearly above 1.0425.’ We added, ‘the major resistance at 1.0490 is unlikely to come into view.’ The anticipated advance exceeded our expectations as EUR rose briefly to 1.0442 before pulling back to close at 1.0402 (+0.24%). The pullback in overbought conditions and slowing momentum suggest that instead of continuing to rise, EUR is likely to trade between 1.0360 and 1.0430 today.”
1-3 WEEKS VIEW: “We continue to hold the same view as yesterday (05 Feb, spot at 1.0375). As pointed out, “the outlook is unclear for now, and EUR could trade in a broad range of 1.0250/1.0490 for the time being.”
-
09:20
NZD/USD Price Forecast: Tests nine-day EMA near 0.5650; moves within a rectangular pattern
- NZD/USD tests the nine-day EMA at 0.5654, followed by the psychological level of 0.5650.
- The 14-day RSI is positioned at the 50 level, confirming an ongoing neutral bias.
- The key resistance zone appears at its eight-week high of 0.5794, followed by the psychological level of 0.5800.
The NZD/USD pair breaks its four-day winning streak, trading around 0.5660 during the European hours on Thursday. The technical analysis of the daily chart indicates that buyers and sellers are unsure of the long-term direction of the asset as the pair consolidates within a rectangular pattern.
Additionally, the 14-day Relative Strength Index (RSI) is positioned at the 50 level, confirming an ongoing neutral bias. However, the NZD/USD pair remains slightly above the nine-day Exponential Moving Average (EMA), reflecting that short-term price momentum still has some spark.
On the upside, the NZD/USD pair could navigate the area around its eight-week high of 0.5794, reached on January 24. The further barrier appears at the psychological level of 0.5800, aligned with the upper boundary of the rectangle at 0.5820.
Regarding its support, the NZD/USD pair tests immediate nine-day EMA at 0.5654, aligned with the psychological level of 0.5650. A break below this level could lead the pair to navigate the region around its support area at 0.5526—its lowest point since October 2022, reached on December 25. Further support appears near the lower edge of its descending channel at the 0.5500 level.
NZD/USD: Daily Chart
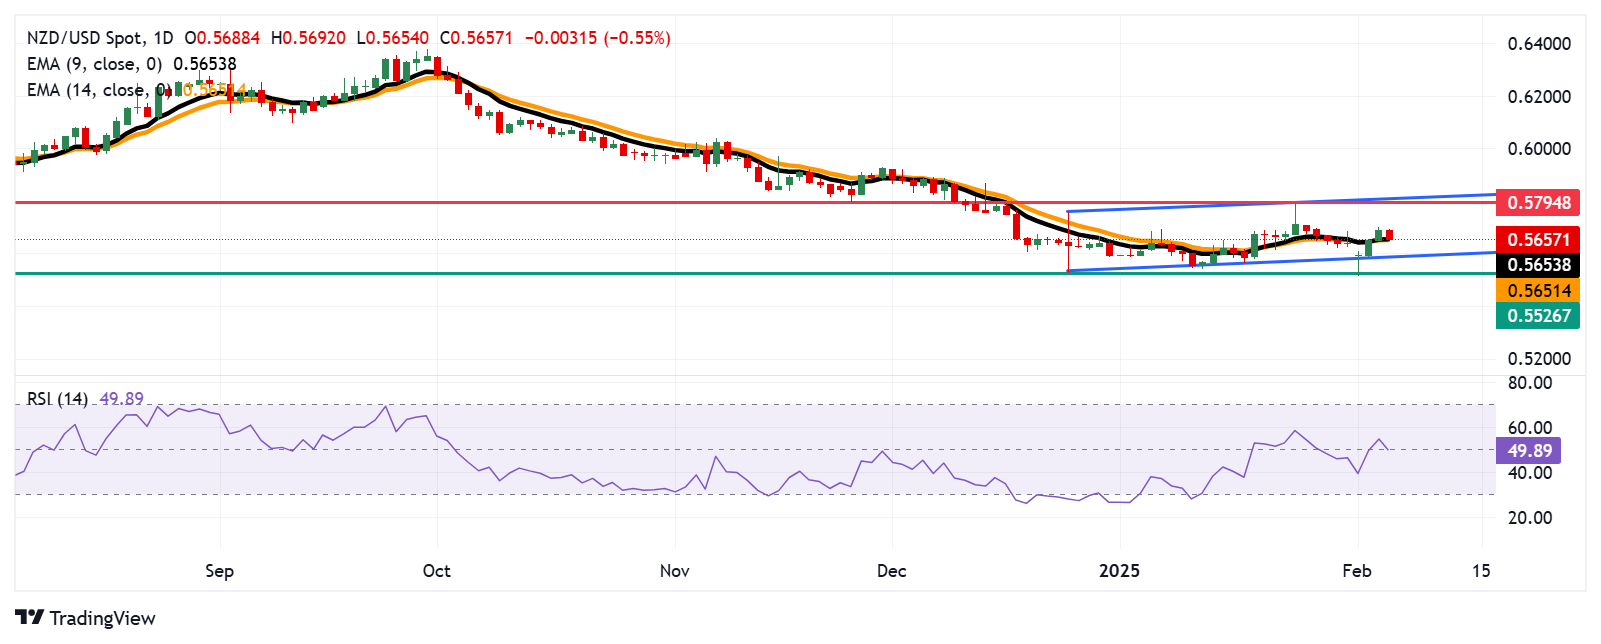
New Zealand Dollar PRICE Today
The table below shows the percentage change of New Zealand Dollar (NZD) against listed major currencies today. New Zealand Dollar was the weakest against the Japanese Yen.
USD EUR GBP JPY CAD AUD NZD CHF USD 0.33% 0.33% -0.09% 0.32% 0.45% 0.56% 0.28% EUR -0.33% -0.01% -0.41% -0.01% 0.12% 0.24% -0.07% GBP -0.33% 0.00% -0.42% 0.00% 0.12% 0.24% -0.04% JPY 0.09% 0.41% 0.42% 0.42% 0.54% 0.62% 0.37% CAD -0.32% 0.00% -0.00% -0.42% 0.13% 0.24% -0.04% AUD -0.45% -0.12% -0.12% -0.54% -0.13% 0.12% -0.19% NZD -0.56% -0.24% -0.24% -0.62% -0.24% -0.12% -0.29% CHF -0.28% 0.07% 0.04% -0.37% 0.04% 0.19% 0.29% The heat map shows percentage changes of major currencies against each other. The base currency is picked from the left column, while the quote currency is picked from the top row. For example, if you pick the New Zealand Dollar from the left column and move along the horizontal line to the US Dollar, the percentage change displayed in the box will represent NZD (base)/USD (quote).
-
08:51
Forex Today: BoE policy announcements, US data to drive markets
Here is what you need to know on Thursday, February 6:
Major currency pairs stay relatively quiet early Thursday as investors gear up for the upcoming key events. The Bank of England (BoE) will announce monetary policy decisions. Governor Andrew Bailey will speak on the policy outlook and respond to questions in a press conference afterward. Later in the day, the US economic calendar will feature weekly Initial Jobless Claims and Unit Labor Costs data for the fourth quarter.
US Dollar PRICE This week
The table below shows the percentage change of US Dollar (USD) against listed major currencies this week. US Dollar was the weakest against the Canadian Dollar.
USD EUR GBP JPY CAD AUD NZD CHF USD -0.19% -0.64% -1.59% -2.31% -0.82% -1.16% -1.37% EUR 0.19% -0.06% -0.11% -0.86% -0.18% 0.32% 0.10% GBP 0.64% 0.06% -1.14% -0.80% -0.11% 0.38% 0.16% JPY 1.59% 0.11% 1.14% -0.75% 0.92% 1.34% 0.85% CAD 2.31% 0.86% 0.80% 0.75% 0.43% 1.18% 0.97% AUD 0.82% 0.18% 0.11% -0.92% -0.43% 0.50% 0.28% NZD 1.16% -0.32% -0.38% -1.34% -1.18% -0.50% -0.22% CHF 1.37% -0.10% -0.16% -0.85% -0.97% -0.28% 0.22% The heat map shows percentage changes of major currencies against each other. The base currency is picked from the left column, while the quote currency is picked from the top row. For example, if you pick the US Dollar from the left column and move along the horizontal line to the Japanese Yen, the percentage change displayed in the box will represent USD (base)/JPY (quote).
The US Dollar (USD) struggled to find demand on Wednesday following the disappointing ISM Services PMI data. Additionally, improving risk mood put additional weight on the currency's shoulders, as Wall Street's main indexes registered gains for the second consecutive day. After falling 0.4% on Tuesday, the USD Index lost more than 0.3% on Wednesday.
US Treasury Secretary Scott Bessent said late Wednesday that US President Donald Trump is not calling for the Fed to lower interest rates. "Interest rates will take care of themselves if we get energy costs down and deregulate the economy," he added and said that their focus is on bringing down the 10-year US Treasury yields. After falling nearly 2% on Wednesday, the 10-year yield fluctuates in a tight range above 4.4%.
The BoE is forecast to lower the policy rate by 25 basis points to 4.5% after the February policy meeting. GBP/USD touched its highest level in nearly a month at 1.2550 on Wednesday but erased a portion of its daily gains in the late American session. The pair corrects lower early Thursday and trades below 1.2500.
EUR/USD closed marginally higher on Wednesday but failed to stabilize above 1.0400. The pair was last seen losing 0.2% on the day near 1.0380.
USD/JPY declined sharply and lost more than 1% on Wednesday. After extending its slide to its weakest level since early December below 152.00 in the Asian session on Thursday, the pair regained its traction and turned flat on the day, above 152.50.
Gold preserved its bullish momentum on Wednesday and set a new record-high of $2,882 during the American trading hours. XAU/USD stays on the back foot early Thursday and declines toward $2,850.
Pound Sterling FAQs
The Pound Sterling (GBP) is the oldest currency in the world (886 AD) and the official currency of the United Kingdom. It is the fourth most traded unit for foreign exchange (FX) in the world, accounting for 12% of all transactions, averaging $630 billion a day, according to 2022 data. Its key trading pairs are GBP/USD, also known as ‘Cable’, which accounts for 11% of FX, GBP/JPY, or the ‘Dragon’ as it is known by traders (3%), and EUR/GBP (2%). The Pound Sterling is issued by the Bank of England (BoE).
The single most important factor influencing the value of the Pound Sterling is monetary policy decided by the Bank of England. The BoE bases its decisions on whether it has achieved its primary goal of “price stability” – a steady inflation rate of around 2%. Its primary tool for achieving this is the adjustment of interest rates. When inflation is too high, the BoE will try to rein it in by raising interest rates, making it more expensive for people and businesses to access credit. This is generally positive for GBP, as higher interest rates make the UK a more attractive place for global investors to park their money. When inflation falls too low it is a sign economic growth is slowing. In this scenario, the BoE will consider lowering interest rates to cheapen credit so businesses will borrow more to invest in growth-generating projects.
Data releases gauge the health of the economy and can impact the value of the Pound Sterling. Indicators such as GDP, Manufacturing and Services PMIs, and employment can all influence the direction of the GBP. A strong economy is good for Sterling. Not only does it attract more foreign investment but it may encourage the BoE to put up interest rates, which will directly strengthen GBP. Otherwise, if economic data is weak, the Pound Sterling is likely to fall.
Another significant data release for the Pound Sterling is the Trade Balance. This indicator measures the difference between what a country earns from its exports and what it spends on imports over a given period. If a country produces highly sought-after exports, its currency will benefit purely from the extra demand created from foreign buyers seeking to purchase these goods. Therefore, a positive net Trade Balance strengthens a currency and vice versa for a negative balance.
-
08:51
EUR/JPY Price Forecast: Path of least resistance level is to the downside below 158.50
- EUR/JPY edges lower to 158.45 in Thursday’s early European session, losing 0.27% on the day.
- The negative view of the cross remains intact below the 100-period EMA with a bearish RSI indicator.
- The first downside target to watch is 158.00; the key upside barrier emerges at 160.00.
The EUR/JPY cross extends its decline to around 158.45 during the early European session on Thursday. Recent hawkish remarks from some Bank of Japan (BoJ) officials bolstered the odds of a Japanese interest rate hike in March, supporting the Japanese Yen (JPY). BoJ Board Member, Tamura Naoki, said on Thursday that the central bank must raise interest rates to at least 1% by the second half of the fiscal year beginning in April.
According to the 4-hour chart, EUR/JPY remains capped under the key 100-period Exponential Moving Averages (EMA), suggesting that the path of least resistance is to the downside. The downward momentum is reinforced by the Relative Strength Index (RSI), which stands below the midline near 38.00, supporting the sellers in the near term.
The lower limit of the Bollinger Band and round mark at 158.00 act as an initial support level for the cross. A breach of this level could see a drop to 156.18, the low of December 3, 2024. Further south, the next contention level to watch is 155.15, the low of September 16, 2024.
On the other hand, the crucial resistance level emerges at the 160.00 psychological level. The additional upside filter to watch is 160.80, the upper boundary of the Bollinger Band, en route to 161.00, the 100-period EMA.EUR/JPY 4-hour chart
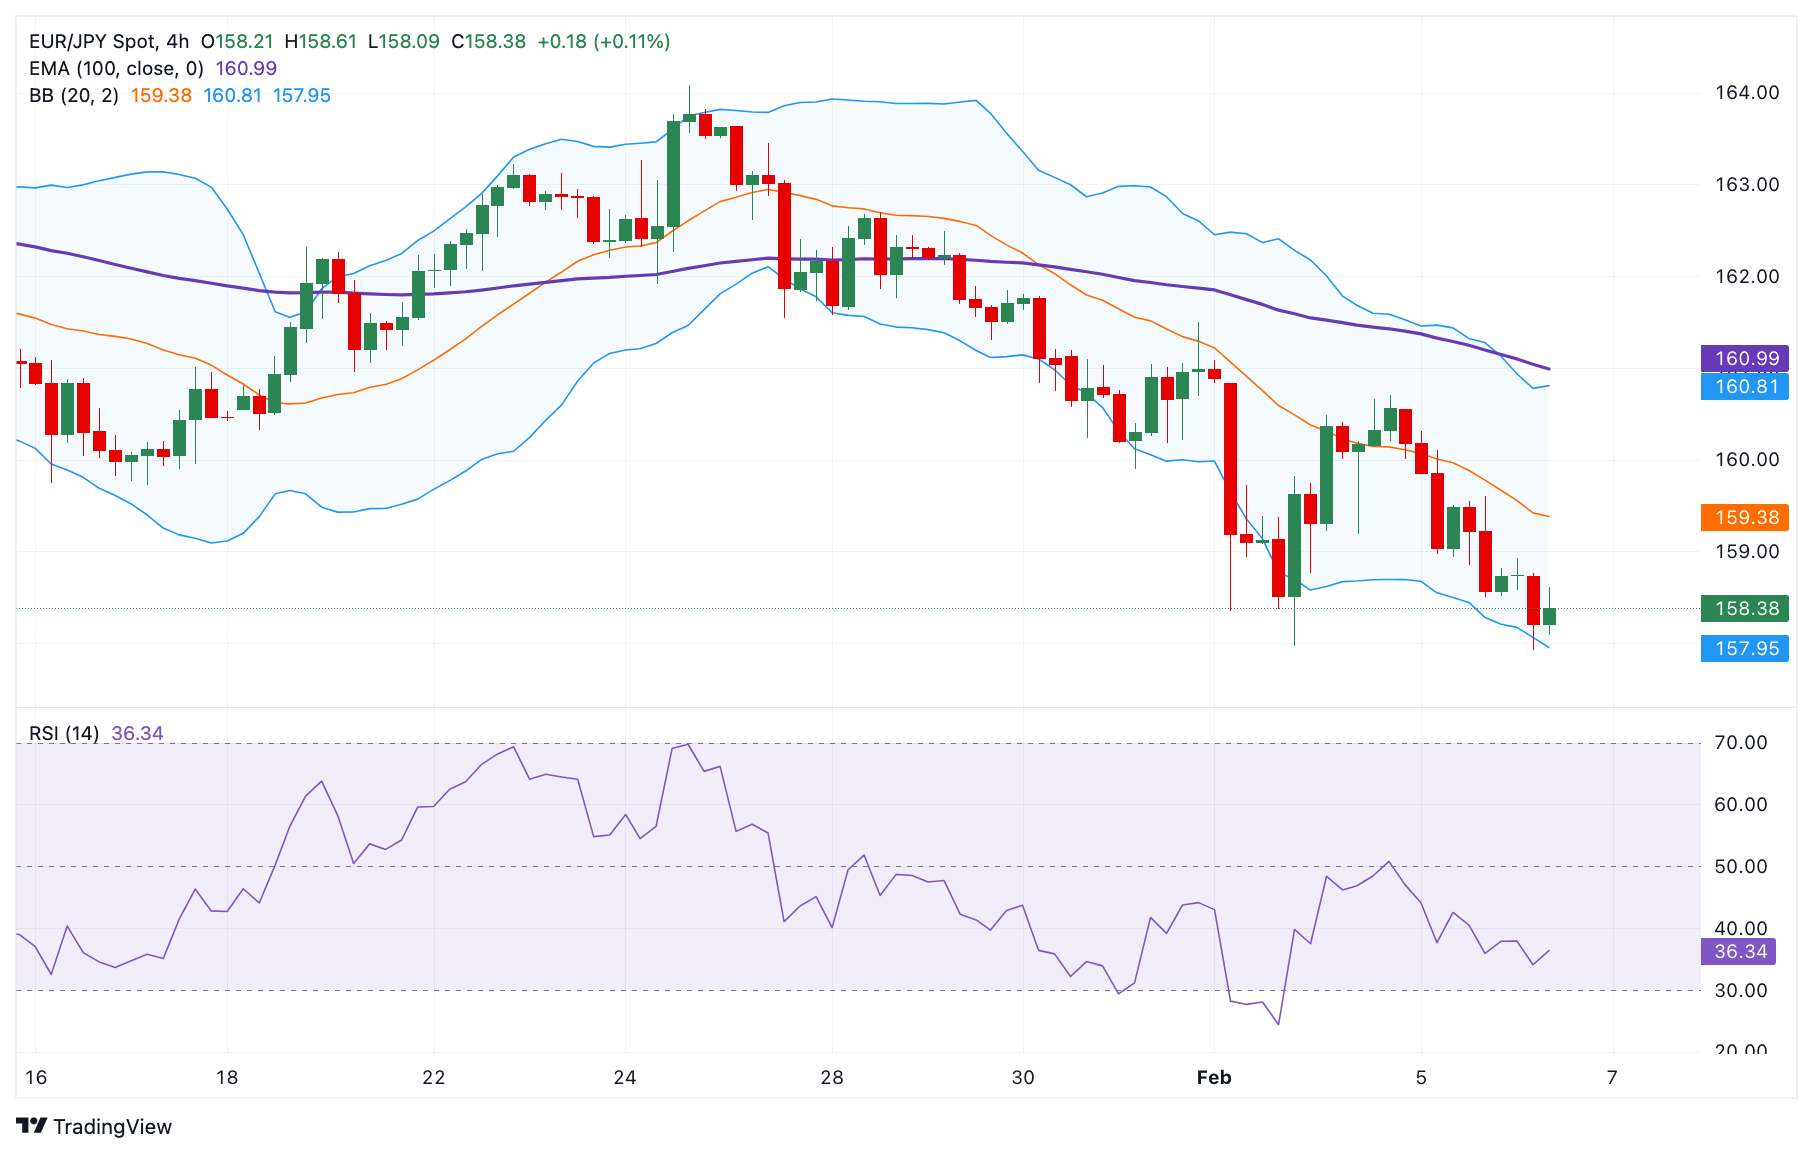
Japanese Yen FAQs
The Japanese Yen (JPY) is one of the world’s most traded currencies. Its value is broadly determined by the performance of the Japanese economy, but more specifically by the Bank of Japan’s policy, the differential between Japanese and US bond yields, or risk sentiment among traders, among other factors.
One of the Bank of Japan’s mandates is currency control, so its moves are key for the Yen. The BoJ has directly intervened in currency markets sometimes, generally to lower the value of the Yen, although it refrains from doing it often due to political concerns of its main trading partners. The BoJ ultra-loose monetary policy between 2013 and 2024 caused the Yen to depreciate against its main currency peers due to an increasing policy divergence between the Bank of Japan and other main central banks. More recently, the gradually unwinding of this ultra-loose policy has given some support to the Yen.
Over the last decade, the BoJ’s stance of sticking to ultra-loose monetary policy has led to a widening policy divergence with other central banks, particularly with the US Federal Reserve. This supported a widening of the differential between the 10-year US and Japanese bonds, which favored the US Dollar against the Japanese Yen. The BoJ decision in 2024 to gradually abandon the ultra-loose policy, coupled with interest-rate cuts in other major central banks, is narrowing this differential.
The Japanese Yen is often seen as a safe-haven investment. This means that in times of market stress, investors are more likely to put their money in the Japanese currency due to its supposed reliability and stability. Turbulent times are likely to strengthen the Yen’s value against other currencies seen as more risky to invest in.
-
08:46
Pound Sterling stabilizes ahead of BoE’s policy decision
- The Pound Sterling stabilizes against its major peers, except safe-haven assets, ahead of the BoE’s monetary policy on Thursday.
- The BoE is widely anticipated to cut interest rates by 25 bps to 4.5%.
- Investors await the US NFP data, which will influence expectations for the Fed’s monetary policy outlook.
The Pound Sterling (GBP) stabilizes against its major peers, except safe-haven currencies, on Thursday ahead of the Bank of England’s (BoE) monetary policy decision, which will be announced at 12:00 GMT. The BoE is almost certain to cut interest rates by 25 basis points (bps) to 4.5%, with an 8-1 vote split. Monetary Policy Committee (MPC) member Catherine Mann, who has been an outspoken hawk, is expected to support keeping interest rates unchanged at 4.75%.
The BoE is expected to announce an interest rate cut decision in an attempt to revive labor demand amid stagnating economic growth. This would be the third interest rate cut by the BoE in its current policy-easing cycle, which started at the August 2024 policy meeting.
United Kingdom (UK) employers have tempered the pace of hiring after Chancellor of the Exchequer Rachel Reeves announced an increase in employers’ contributions to National Insurance (NI). The last three employment readings suggest the labor force rose at a declining pace.
The UK Gross Domestic Product (GDP) growth remained flat in the third quarter and in the October-November period.
Investors will pay close attention to BoE Governor Andrew Bailey’s press conference after the policy decision to get cues about the inflation outlook and the monetary policy guidance.
Inflationary pressures in the UK decelerated at a faster-than-expected pace in December. Still, analysts at Citi expect an uptick in inflation ahead due to a sharp increase in wage growth and a reversal in energy prices.
Meanwhile, traders are pricing in a 56 bps interest rate reduction for the entire year after a quarter-to-percent cut on Thursday.
Daily digest market movers: Pound Sterling falls against USD as latter gauges temporary support
- The Pound Sterling ticks lower to near 1.2480 against the US Dollar (USD) in Thursday’s European session. The GBP/USD pair edges lower as the US Dollar strives to gain ground ahead of the United States (US) Nonfarm Payrolls (NFP) data for January, which will be released on Friday.
- The US Dollar Index (DXY), which tracks the Greenback’s value against six major currencies, finds a temporary support near 107.30 after a three-day sell-off from the two-week high near 110.00.
- The official United States (US) employment data is expected to drive market speculation about how long the Federal Reserve (Fed) will hold interest rates at their current levels. Last week, Fed Chair Jerome Powell said that they would make monetary policy adjustments only after seeing “real progress in inflation or at least some weakness in the labor market” after the central bank left interest rates unchanged in the range of 4.25%-4.50%.
- According to the CME FedWatch tool, the Fed is expected to announce its next interest rate cut in June’s policy meeting.
- The US Dollar witnessed a sharp sell-off in the first three trading days of the week as fears of a global trade war receded. Investors expect the trade war to remain between the US and China as the latter retaliated to US President Donald Trump’s imposition of 10% tariffs with 15% levies on Coal and Liquified Natural Gas (LNG) and 10% on Crude Oil, farm equipment and some autos. Meanwhile, President Trump suspended 25% tariff orders on Canada and Mexico for 30 days.
Technical Analysis: Pound Sterling struggles below 1.2500
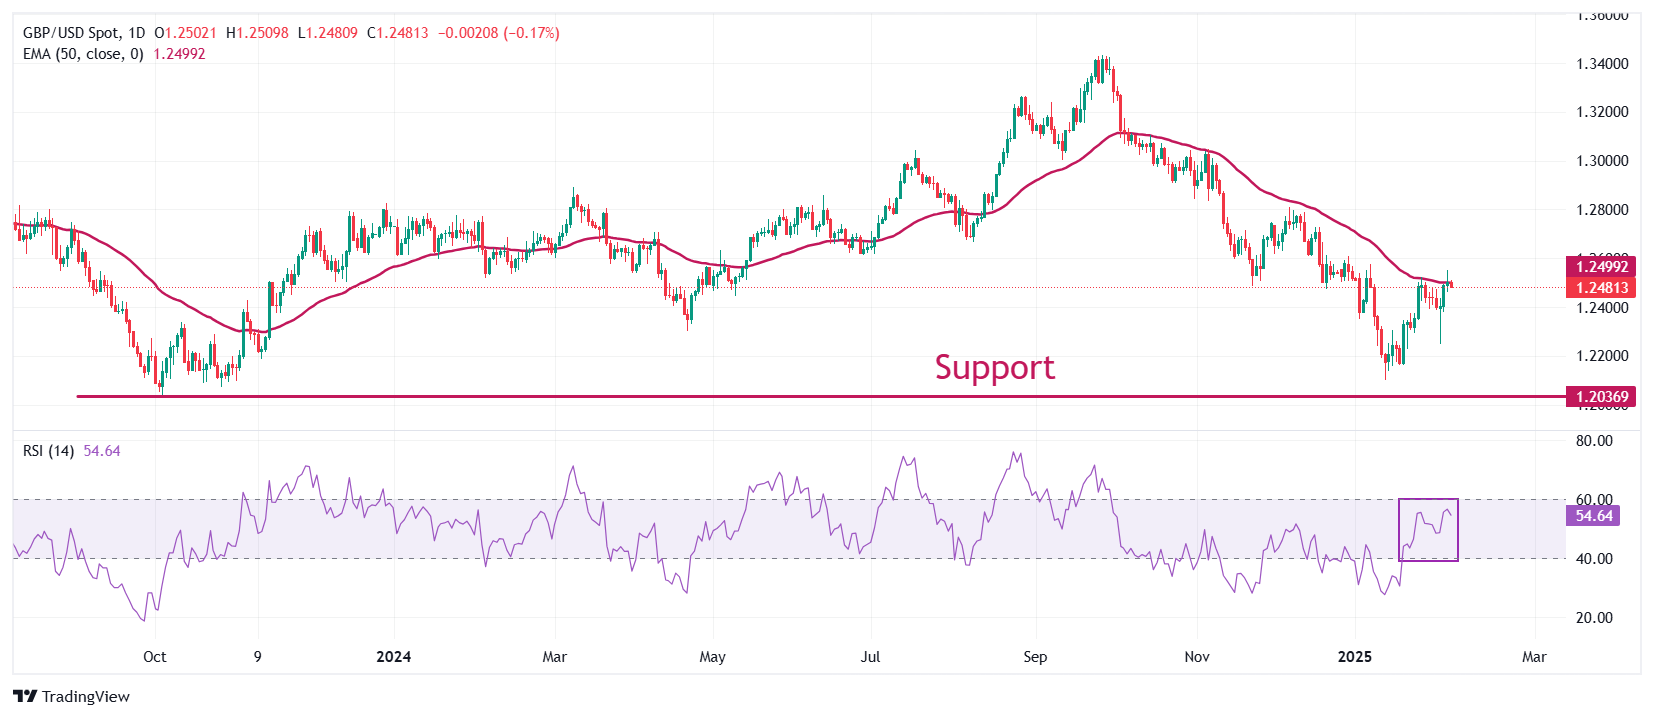
The upside move in the Pound Sterling against the US Dollar has paused after rising above the psychological figure of 1.2500, which also coincided with the zone where the 50-day Exponential Moving Average (EMA) wobbles.
The 14-day Relative Strength Index (RSI) oscillates inside the 40.00-60.00 range, suggesting a sideways trend.
Looking down, the January 13 low of 1.2100 and the October 2023 low of 1.2050 will act as key support zones for the pair. On the upside, the December 30 high of 1.2607 will act as key resistance.
Pound Sterling FAQs
The Pound Sterling (GBP) is the oldest currency in the world (886 AD) and the official currency of the United Kingdom. It is the fourth most traded unit for foreign exchange (FX) in the world, accounting for 12% of all transactions, averaging $630 billion a day, according to 2022 data. Its key trading pairs are GBP/USD, also known as ‘Cable’, which accounts for 11% of FX, GBP/JPY, or the ‘Dragon’ as it is known by traders (3%), and EUR/GBP (2%). The Pound Sterling is issued by the Bank of England (BoE).
The single most important factor influencing the value of the Pound Sterling is monetary policy decided by the Bank of England. The BoE bases its decisions on whether it has achieved its primary goal of “price stability” – a steady inflation rate of around 2%. Its primary tool for achieving this is the adjustment of interest rates. When inflation is too high, the BoE will try to rein it in by raising interest rates, making it more expensive for people and businesses to access credit. This is generally positive for GBP, as higher interest rates make the UK a more attractive place for global investors to park their money. When inflation falls too low it is a sign economic growth is slowing. In this scenario, the BoE will consider lowering interest rates to cheapen credit so businesses will borrow more to invest in growth-generating projects.
Data releases gauge the health of the economy and can impact the value of the Pound Sterling. Indicators such as GDP, Manufacturing and Services PMIs, and employment can all influence the direction of the GBP. A strong economy is good for Sterling. Not only does it attract more foreign investment but it may encourage the BoE to put up interest rates, which will directly strengthen GBP. Otherwise, if economic data is weak, the Pound Sterling is likely to fall.
Another significant data release for the Pound Sterling is the Trade Balance. This indicator measures the difference between what a country earns from its exports and what it spends on imports over a given period. If a country produces highly sought-after exports, its currency will benefit purely from the extra demand created from foreign buyers seeking to purchase these goods. Therefore, a positive net Trade Balance strengthens a currency and vice versa for a negative balance.
-
08:32
GBP/JPY falls below 190.50 as traders expect BoE to deliver an interest rate cut
- GBP/JPY extends its losses due to rising expectations of the BoE delivering a 25 basis points rate cut on Thursday.
- The BoE’s MPC is expected to vote 8-1 in favor of a quarter-point rate cut, bringing the rate down to 4.5%.
- The robust wage and services data in Japan has bolstered hawkish sentiment surrounding the BoJ’s rate hikes.
GBP/JPY continues to lose ground for the second consecutive day, trading around 190.40 during the early European hours on Thursday. The GBP/JPY cross struggles as the Pound Sterling (GBP) faces downward pressure amid expectations that the Bank of England (BoE) will resume its policy-easing cycle, likely lowering interest rates by 25 basis points (bps) to 4.5% at its policy meeting later in the day.
The BoE’s Monetary Policy Committee (MPC) is anticipated to vote 8-1 in favor of a quarter-point rate cut to 4.5%, with MPC member Catherine Mann, who has been an outspoken hawk, is expected to support keeping interest rates steady at 4.75%.
The inflationary pressures in the United Kingdom (UK) decelerated at a faster-than-expected pace in December. Inflation in the services sector – which is closely tracked by BoE officials – grew at a moderate pace of 4.4%, compared to 5% growth in November.
The Japanese Yen (JPY) strengthens against its peers as robust wage and services data fuel expectations of a more hawkish Bank of Japan (BoJ). Data showed that real wages in Japan increased for the second straight month in December, while nominal wage growth reached its highest level in nearly three decades.
Japan's Finance Minister, Katsunobu Kato, told parliament on Thursday that deflation has not yet ended. Kato also noted ongoing inflationary conditions as prices continue to rise.
Société Générale's FX analysts noted that the Japanese Yen is outperforming, while 10-year JGB yields have risen to nearly 1.30%, the highest level since April 2011. However, with the BoJ policy rate expected to peak around 1.00% over the next two years, the upside for both JPY and JGB yields remains limited.
BoE FAQs
The Bank of England (BoE) decides monetary policy for the United Kingdom. Its primary goal is to achieve ‘price stability’, or a steady inflation rate of 2%. Its tool for achieving this is via the adjustment of base lending rates. The BoE sets the rate at which it lends to commercial banks and banks lend to each other, determining the level of interest rates in the economy overall. This also impacts the value of the Pound Sterling (GBP).
When inflation is above the Bank of England’s target it responds by raising interest rates, making it more expensive for people and businesses to access credit. This is positive for the Pound Sterling because higher interest rates make the UK a more attractive place for global investors to park their money. When inflation falls below target, it is a sign economic growth is slowing, and the BoE will consider lowering interest rates to cheapen credit in the hope businesses will borrow to invest in growth-generating projects – a negative for the Pound Sterling.
In extreme situations, the Bank of England can enact a policy called Quantitative Easing (QE). QE is the process by which the BoE substantially increases the flow of credit in a stuck financial system. QE is a last resort policy when lowering interest rates will not achieve the necessary result. The process of QE involves the BoE printing money to buy assets – usually government or AAA-rated corporate bonds – from banks and other financial institutions. QE usually results in a weaker Pound Sterling.
Quantitative tightening (QT) is the reverse of QE, enacted when the economy is strengthening and inflation starts rising. Whilst in QE the Bank of England (BoE) purchases government and corporate bonds from financial institutions to encourage them to lend; in QT, the BoE stops buying more bonds, and stops reinvesting the principal maturing on the bonds it already holds. It is usually positive for the Pound Sterling.
-
08:30
China’s Commerce Ministry: Won't proactively provoke trade disputes, willing to resolve issues
Speaking on US tariffs, Chinese Commerce Ministry said on Thursday, “China won't proactively provoke trade disputes, willing to resolve issues through dialogue and consultation.”
Additional comments
China willing to work with relevant countries to jointly respond to challenges of unilateralism and trade protectionism.
China will definitely take necessary measures against unilateral bullying measures and resolutely defend rights.
Market reaction
AUD/USD holds lower ground near 0.6270, losing 0.24% on the day.
Australian Dollar FAQs
One of the most significant factors for the Australian Dollar (AUD) is the level of interest rates set by the Reserve Bank of Australia (RBA). Because Australia is a resource-rich country another key driver is the price of its biggest export, Iron Ore. The health of the Chinese economy, its largest trading partner, is a factor, as well as inflation in Australia, its growth rate and Trade Balance. Market sentiment – whether investors are taking on more risky assets (risk-on) or seeking safe-havens (risk-off) – is also a factor, with risk-on positive for AUD.
The Reserve Bank of Australia (RBA) influences the Australian Dollar (AUD) by setting the level of interest rates that Australian banks can lend to each other. This influences the level of interest rates in the economy as a whole. The main goal of the RBA is to maintain a stable inflation rate of 2-3% by adjusting interest rates up or down. Relatively high interest rates compared to other major central banks support the AUD, and the opposite for relatively low. The RBA can also use quantitative easing and tightening to influence credit conditions, with the former AUD-negative and the latter AUD-positive.
China is Australia’s largest trading partner so the health of the Chinese economy is a major influence on the value of the Australian Dollar (AUD). When the Chinese economy is doing well it purchases more raw materials, goods and services from Australia, lifting demand for the AUD, and pushing up its value. The opposite is the case when the Chinese economy is not growing as fast as expected. Positive or negative surprises in Chinese growth data, therefore, often have a direct impact on the Australian Dollar and its pairs.
Iron Ore is Australia’s largest export, accounting for $118 billion a year according to data from 2021, with China as its primary destination. The price of Iron Ore, therefore, can be a driver of the Australian Dollar. Generally, if the price of Iron Ore rises, AUD also goes up, as aggregate demand for the currency increases. The opposite is the case if the price of Iron Ore falls. Higher Iron Ore prices also tend to result in a greater likelihood of a positive Trade Balance for Australia, which is also positive of the AUD.
The Trade Balance, which is the difference between what a country earns from its exports versus what it pays for its imports, is another factor that can influence the value of the Australian Dollar. If Australia produces highly sought after exports, then its currency will gain in value purely from the surplus demand created from foreign buyers seeking to purchase its exports versus what it spends to purchase imports. Therefore, a positive net Trade Balance strengthens the AUD, with the opposite effect if the Trade Balance is negative.
-
08:05
German Factory Orders jump 6.9% MoM in December vs. 2% expected
The official data published by the Federal Statistics Office showed Thursday that Germany's Factory Orders rebounded firmly in December, suggesting that the country’s manufacturing sector is seeing a sharp turnaround.
Over the month, contracts for goods ‘Made in Germany’ jumped by 6.9% in December after tumbling by 5.2% in November. Data beat the estimates of a 2% print.
Germany’s Industrial Orders slumped 6.3% year-on-year (YoY) in December, compared with the previous decline of 1.4%.
FX implications
The Euro remains under mild selling pressure after the German data, with EUR/USD down 0.14% on the day at 1.0387, as of writing.
Euro PRICE Today
The table below shows the percentage change of Euro (EUR) against listed major currencies today. Euro was the weakest against the Japanese Yen.
USD EUR GBP JPY CAD AUD NZD CHF USD 0.17% 0.17% -0.03% 0.24% 0.34% 0.45% 0.21% EUR -0.17% -0.01% -0.19% 0.08% 0.17% 0.28% 0.02% GBP -0.17% 0.00% -0.23% 0.08% 0.17% 0.29% 0.04% JPY 0.03% 0.19% 0.23% 0.27% 0.37% 0.45% 0.23% CAD -0.24% -0.08% -0.08% -0.27% 0.10% 0.20% -0.04% AUD -0.34% -0.17% -0.17% -0.37% -0.10% 0.11% -0.14% NZD -0.45% -0.28% -0.29% -0.45% -0.20% -0.11% -0.24% CHF -0.21% -0.02% -0.04% -0.23% 0.04% 0.14% 0.24% The heat map shows percentage changes of major currencies against each other. The base currency is picked from the left column, while the quote currency is picked from the top row. For example, if you pick the Euro from the left column and move along the horizontal line to the US Dollar, the percentage change displayed in the box will represent EUR (base)/USD (quote).
-
08:01
Germany Factory Orders n.s.a. (YoY) fell from previous -1.7% to -6.3% in December
-
08:00
Germany Factory Orders s.a. (MoM) came in at 6.9%, above expectations (2%) in December
-
08:00
BoE expected to trim interest rate amid steady inflation and weak economic growth
- The Bank of England is expected to trim the benchmark rate by 25 basis points.
- Softer UK inflation figures are overshadowed by concerns about slowing growth.
- GBP/USD could resume its bearish trend if policymakers deliver dovish clues.
The Bank of England (BoE) will announce its decision on monetary policy on Thursday after completing the first meeting of 2025. Market participants anticipate policymakers will trim the benchmark rate by 25 basis points (bps) to 4.5% after cutting it by 50 bps throughout 2024.
But it is not just about interest rates. It’s a BoE Super Thursday, so the central bank will also release the meeting Minutes alongside the Quarterly Inflation Report. Finally, Governor Andrew Bailey will hold a press conference in which he will explain the reasoning behind the policymakers’ decision.
With a 25 bps interest rate priced in, the focus will then be on the BoE's guidance and economic projections.
UK: Softer inflation and weaker growth
The BoE surprised market players in December with a hawkish hold, as six out of nine members of the Monetary Policy Committee (MPC) voted to keep rates on hold, while the other three opted for a rate cut.
Meanwhile, the Office for National Statistics (ONS) reported that the United Kingdom (UK) annual headline inflation edged lower to 2.5% in December from 2.6% in November. Additionally, the annual core inflation rate decreased to 3.2% in December from 3.5% prior, marking the lowest reading since September. More importantly, services inflation hit 4.4% year-on-year (YoY), below the BoE’s projection.
Growth, on the other hand, has been tepid, to say the least. The UK Gross Domestic Product (GDP) registered no growth in the third quarter of 2024, revised down from the first estimate increase of 0.1%, according to the latest ONS report. Q2 was downwardly revised to 0.5% following an initial estimate of 0.6%. The BoE expects zero GDP growth in the last quarter of 2024, downgrading the 0.3% estimate predicted in November.
With the 25 bps interest rate cut fully priced in, the focus will be on the MPC report and Governor Bailey’s speech. UK policymakers will offer an updated assessment of the economy’s potential growth rate, with the latest estimate standing at 1.3%. A downward revision seems likely, which should boost the odds for additional rate cuts in the upcoming meetings, albeit a faster pace of trims seems out of the picture at the moment.
Additionally, it is worth remembering the recent surge in UK government bonds, so-called Gilts, yields. UK Gilts yields have risen to multi-year highs at the beginning of the year, spurring concerns about government spending and tax decisions. Many analysts link the advance to that of United States (US) Treasury yields following President Donald Trump’s arrival at the White House.
Nevertheless, yields retreated in the last couple of weeks amid mounting concerns that the economic slowdown would deepen under Trump’s tariff plans. These concerns also fueled speculation the BoE will have no choice but to trim interest rates.
How will the BoE interest rate decision impact GBP/USD?
As previously mentioned, a BoE 25 bps interest rate cut is fully priced in. With that in mind, the British Pound (GBP) will likely show no reaction to the headline but react to policymakers’ fresh economic projections and how MPC votes. Ahead of the announcement, financial markets anticipate eight of the nine members will opt for a rate trim. Investors will also pay close attention to Governor Andrew Bailey’s words.
Generally speaking, the more dovish the outcome, the more the GBP could fall. The opposite scenario is also valid, with hawkish surprises from UK policymakers boosting demand for the British Pound.
Ahead of the announcement, the GBP/USD pair trades above the 1.2500 mark, recovering from a weekly low of 1.2248. The US Dollar (USD) soared at the beginning of the week as US President Donald Trump announced tariffs on imports from Mexico, Canada and China over the weekend. The subsequent USD decline came after Trump postponed the implementation of such levies, at least on Mexican and Canadian imports.
Valeria Bednarik, Chief Analyst at FXStreet, says: “Central Bank’s decisions and macroeconomic data in general is being overshadowed by US President Trump's decision to unleash a trade war. The UK is not out of Trump’s radar, but it is definitely not among his top rivals. Still, the risk of the UK economic slowdown accelerating amid fresh US tariffs pends on policymakers ahead of the announcement. As for GBP/USD, the pair may resume its slump with a dovish tilt, albeit the reaction could be limited as investors anticipate it. If policymakers sound hawkish, the GBP/USD will likely gain extra upward traction.”
Bednarik adds: “The GBP/USD pair has an immediate resistance level at the 1.2600 threshold, with gains beyond the area exposing 1.266, the December 19 daily high. Beyond the latter, the rally could continue towards the 1.2700-1.2720 area en route to the 1.2800 figure. The 1.2470 price zone provides support ahead of the 1.2400 figure. A break below the latter could see the pair resuming its bearish trend and retesting the aforementioned weekly low at 1.2248.”
Central banks FAQs
Central Banks have a key mandate which is making sure that there is price stability in a country or region. Economies are constantly facing inflation or deflation when prices for certain goods and services are fluctuating. Constant rising prices for the same goods means inflation, constant lowered prices for the same goods means deflation. It is the task of the central bank to keep the demand in line by tweaking its policy rate. For the biggest central banks like the US Federal Reserve (Fed), the European Central Bank (ECB) or the Bank of England (BoE), the mandate is to keep inflation close to 2%.
A central bank has one important tool at its disposal to get inflation higher or lower, and that is by tweaking its benchmark policy rate, commonly known as interest rate. On pre-communicated moments, the central bank will issue a statement with its policy rate and provide additional reasoning on why it is either remaining or changing (cutting or hiking) it. Local banks will adjust their savings and lending rates accordingly, which in turn will make it either harder or easier for people to earn on their savings or for companies to take out loans and make investments in their businesses. When the central bank hikes interest rates substantially, this is called monetary tightening. When it is cutting its benchmark rate, it is called monetary easing.
A central bank is often politically independent. Members of the central bank policy board are passing through a series of panels and hearings before being appointed to a policy board seat. Each member in that board often has a certain conviction on how the central bank should control inflation and the subsequent monetary policy. Members that want a very loose monetary policy, with low rates and cheap lending, to boost the economy substantially while being content to see inflation slightly above 2%, are called ‘doves’. Members that rather want to see higher rates to reward savings and want to keep a lit on inflation at all time are called ‘hawks’ and will not rest until inflation is at or just below 2%.
Normally, there is a chairman or president who leads each meeting, needs to create a consensus between the hawks or doves and has his or her final say when it would come down to a vote split to avoid a 50-50 tie on whether the current policy should be adjusted. The chairman will deliver speeches which often can be followed live, where the current monetary stance and outlook is being communicated. A central bank will try to push forward its monetary policy without triggering violent swings in rates, equities, or its currency. All members of the central bank will channel their stance toward the markets in advance of a policy meeting event. A few days before a policy meeting takes place until the new policy has been communicated, members are forbidden to talk publicly. This is called the blackout period.
Economic Indicator
BoE Interest Rate Decision
The Bank of England (BoE) announces its interest rate decision at the end of its eight scheduled meetings per year. If the BoE is hawkish about the inflationary outlook of the economy and raises interest rates it is usually bullish for the Pound Sterling (GBP). Likewise, if the BoE adopts a dovish view on the UK economy and keeps interest rates unchanged, or cuts them, it is seen as bearish for GBP.
Read more.Next release: Thu Feb 06, 2025 12:00
Frequency: Irregular
Consensus: 4.5%
Previous: 4.75%
Source: Bank of England
-
07:46
Switzerland Unemployment Rate s.a (MoM) up to 2.7% in January from previous 2.6%
-
07:35
EUR/GBP softens below 0.8350 as traders brace for BoE rate decision
- EUR/GBP weakens to around 0.8320 in Thursday’s early European session.
- Concerns about Trump’s trade tariffs undermine the shared currency.
- The BoE is widely expected to cut its key interest rate on Thursday.
The EUR/GBP cross remains on the defensive around 0.8320 during the early European session on Thursday. The concerns that US President Donald Trump would slap tariffs on goods from the European Union weigh on the Euro (EUR) against the Pound Sterling (GBP). All eyes will be on the Bank of England (BoE) interest rate decision on Thursday.
Following his announcement of import tariffs on Canada, Mexico, and China on Monday, Donald Trump promised to impose the EU next. The EU intends to retaliate against the US if Trump follows through on his threats to slap tariffs on the bloc. This, in turn, exerts some selling pressure on the shared currency.
On the GBP front, investors expect the BoE to reduce borrowing costs by a quarter point to 4.50% at its February meeting on Thursday. "The BoE is likely to justify the move, even though inflation remains above (bank) target due to a sluggish economy and a softening in the labor market in recent months," noted Kathleen Brooks, research director at XTB trading group.
Market players will closely monitor how the UK central bank assesses any potential inflationary impact from the fiscal reforms announced by the government in October 2024, which include a significant hike in the tax businesses face on payrolls. Sticky inflation might limit BoE Governor Andrew Bailey’s ability to cut rates much further, supporting the GBP.BoE FAQs
The Bank of England (BoE) decides monetary policy for the United Kingdom. Its primary goal is to achieve ‘price stability’, or a steady inflation rate of 2%. Its tool for achieving this is via the adjustment of base lending rates. The BoE sets the rate at which it lends to commercial banks and banks lend to each other, determining the level of interest rates in the economy overall. This also impacts the value of the Pound Sterling (GBP).
When inflation is above the Bank of England’s target it responds by raising interest rates, making it more expensive for people and businesses to access credit. This is positive for the Pound Sterling because higher interest rates make the UK a more attractive place for global investors to park their money. When inflation falls below target, it is a sign economic growth is slowing, and the BoE will consider lowering interest rates to cheapen credit in the hope businesses will borrow to invest in growth-generating projects – a negative for the Pound Sterling.
In extreme situations, the Bank of England can enact a policy called Quantitative Easing (QE). QE is the process by which the BoE substantially increases the flow of credit in a stuck financial system. QE is a last resort policy when lowering interest rates will not achieve the necessary result. The process of QE involves the BoE printing money to buy assets – usually government or AAA-rated corporate bonds – from banks and other financial institutions. QE usually results in a weaker Pound Sterling.
Quantitative tightening (QT) is the reverse of QE, enacted when the economy is strengthening and inflation starts rising. Whilst in QE the Bank of England (BoE) purchases government and corporate bonds from financial institutions to encourage them to lend; in QT, the BoE stops buying more bonds, and stops reinvesting the principal maturing on the bonds it already holds. It is usually positive for the Pound Sterling.
-
07:15
ECB’s Cipollone: Rate cuts are coherent with declining inflation picture
European Central Bank (ECB) executive board member Piero Cipollone said on Thursday, “rate cuts are coherent with declining inflation picture.”
Additional quotes
Inflation is almost reaching the target.
Economic fundamentals not significantly different from December projections.
No recession seen, soft landing is still the main scenario.
US tariffs on China could force Beijing to dump goods on Europe.
That could weigh on growth, inflation.
Market reaction
EUR/USD was last seen trading at 1.0386, down 0.15% on the day.
-
07:02
FX option expiries for Feb 6 NY cut
FX option expiries for Feb 6 NY cut at 10:00 Eastern Time via DTCC can be found below.
EUR/USD: EUR amounts
- 1.0200 2.5b
- 1.0250 2.2b
- 1.0300 2.5b
- 1.0320 1.7b
- 1.0325 1.8b
- 1.0350 1.2b
- 1.0380 1.1b
- 1.0400 2.1b
- 1.0410 1.3b
- 1.0440 1.9b
- 1.0480 915m
- 1.0500 2.6b
GBP/USD: GBP amounts
- 1.2300 1b
- 1.2455 1.4b
- 1.2550 1.2b
USD/JPY: USD amounts
- 152.50 1.3b
- 153.90 1.6b
- 154.50 1.3b
- 155.60 666m
USD/CHF: USD amounts
- 0.9000 957m
AUD/USD: AUD amounts
- 0.6165 626m
- 0.6275 570m
USD/CAD: USD amounts
- 1.4160 690m
- 1.4200 1.8b
- 1.4400 1b
- 1.4700 583m
NZD/USD: NZD amounts
- 0.5525 680m
EUR/GBP: EUR amounts
- 0.8400 1.4b
- 0.8465 1.1b
-
06:50
USD/CHF rebounds from 0.9000 mark, over one-week low amid modest USD strength
- USD/CHF edges higher and snaps a three-day losing streak to over a one-week low.
- A modest USD strength offers some support to the major amid a positive risk tone.
- Fed rate cut bets might cap the USD and warrant caution for aggressive bullish traders.
The USD/CHF pair defends the 0.9000 psychological mark and attracts some dip-buyers during the Asian session on Thursday, snapping a three-day losing streak to over a one-week low touched the previous day. Spot prices currently trade around the 0.9030 area, up over 0.15% for the day, though the fundamental backdrop warrants caution before confirming that this week's sharp pullback from the 0.9200 neighborhood has run its course.
The US Dollar (USD) stages a modest recovery following the recent slump to its lowest level in over a week. Apart from this, a generally positive tone around the equity markets is seen undermining the safe-haven Swiss Franc (CHF) and turns out to be another factor lending some support to the USD/CHF pair. Any meaningful USD appreciation, however, seems elusive in the wake of bets for further policy easing by the Federal Reserve (Fed).
In fact, the markets are pricing in the possibility that the US central bank will lower borrowing costs twice by the end of this year. The bets were reaffirmed by the disappointing release of the US ISM Services PMI, which declined to 52.8 in January. This, to a larger extent, overshadowed the ADP report showing that private-sector employment increased by 183K in January compared to the previous month's upwardly revised reading of 176 K.
Apart from this, concerns about the escalating US-China trade war and the potential economic fallout from US President Donald Trump's trade tariffs could keep a lid on the market optimism. This, in turn, might hold back traders from placing aggressive bearish bets around the safe-haven CHF and cap the USD/CHF pair. Hence, it will be prudent to wait for strong follow-through buying before positioning for any further gains.
Swiss Franc FAQs
The Swiss Franc (CHF) is Switzerland’s official currency. It is among the top ten most traded currencies globally, reaching volumes that well exceed the size of the Swiss economy. Its value is determined by the broad market sentiment, the country’s economic health or action taken by the Swiss National Bank (SNB), among other factors. Between 2011 and 2015, the Swiss Franc was pegged to the Euro (EUR). The peg was abruptly removed, resulting in a more than 20% increase in the Franc’s value, causing a turmoil in markets. Even though the peg isn’t in force anymore, CHF fortunes tend to be highly correlated with the Euro ones due to the high dependency of the Swiss economy on the neighboring Eurozone.
The Swiss Franc (CHF) is considered a safe-haven asset, or a currency that investors tend to buy in times of market stress. This is due to the perceived status of Switzerland in the world: a stable economy, a strong export sector, big central bank reserves or a longstanding political stance towards neutrality in global conflicts make the country’s currency a good choice for investors fleeing from risks. Turbulent times are likely to strengthen CHF value against other currencies that are seen as more risky to invest in.
The Swiss National Bank (SNB) meets four times a year – once every quarter, less than other major central banks – to decide on monetary policy. The bank aims for an annual inflation rate of less than 2%. When inflation is above target or forecasted to be above target in the foreseeable future, the bank will attempt to tame price growth by raising its policy rate. Higher interest rates are generally positive for the Swiss Franc (CHF) as they lead to higher yields, making the country a more attractive place for investors. On the contrary, lower interest rates tend to weaken CHF.
Macroeconomic data releases in Switzerland are key to assessing the state of the economy and can impact the Swiss Franc’s (CHF) valuation. The Swiss economy is broadly stable, but any sudden change in economic growth, inflation, current account or the central bank’s currency reserves have the potential to trigger moves in CHF. Generally, high economic growth, low unemployment and high confidence are good for CHF. Conversely, if economic data points to weakening momentum, CHF is likely to depreciate.
As a small and open economy, Switzerland is heavily dependent on the health of the neighboring Eurozone economies. The broader European Union is Switzerland’s main economic partner and a key political ally, so macroeconomic and monetary policy stability in the Eurozone is essential for Switzerland and, thus, for the Swiss Franc (CHF). With such dependency, some models suggest that the correlation between the fortunes of the Euro (EUR) and the CHF is more than 90%, or close to perfect.
-
06:19
GBP/JPY Price Forecast: Bearish outlook remains intact below 190.50
- GBP/JPY attracts some sellers to around 190.25 in Thursday’s early European session, down 0.35% on the day.
- The cross keeps the negative outlook below the 100-period EMA with a bearish RSI indicator.
- The initial support emerges at 190.00; first upside barrier is located at 192.40.
The GBP/JPY cross trades in a negative territory around 190.25 during the early European trading hours on Thursday. The growing speculation that the Bank of Japan (BoJ) would keep raising interest rates provides some support to the Japanese Yen (JPY) and creates a headwind for the cross.
Technically, the bearish outlook of GBP/JPY remains in play as the major pair remains capped below the key 100-period Exponential Moving Average (EMA) on the 4-hour chart. Furthermore, the downward momentum is supported by the Relative Strength Index (RSI), which is located below the midline around 37.00, suggesting that the path of least resistance is to the downside.
The first downside target for the cross emerges at the 190.00 psychological mark. Extended losses could see a drop to the lower limit of the Bollinger Band at 189.70. A decisive break below the mentioned level could pave the way to 189.34, the low of January 17.
On the bright side, the 100-period EMA at 192.40 acts as an immediate resistance level for the cross. Sustained trading above this level could attract some buyers to 193.54, the upper boundary of the Bollinger Band. Further north, the next hurdle is seen at 194.71, the high of January 27.GBP/JPY 4-hour chart
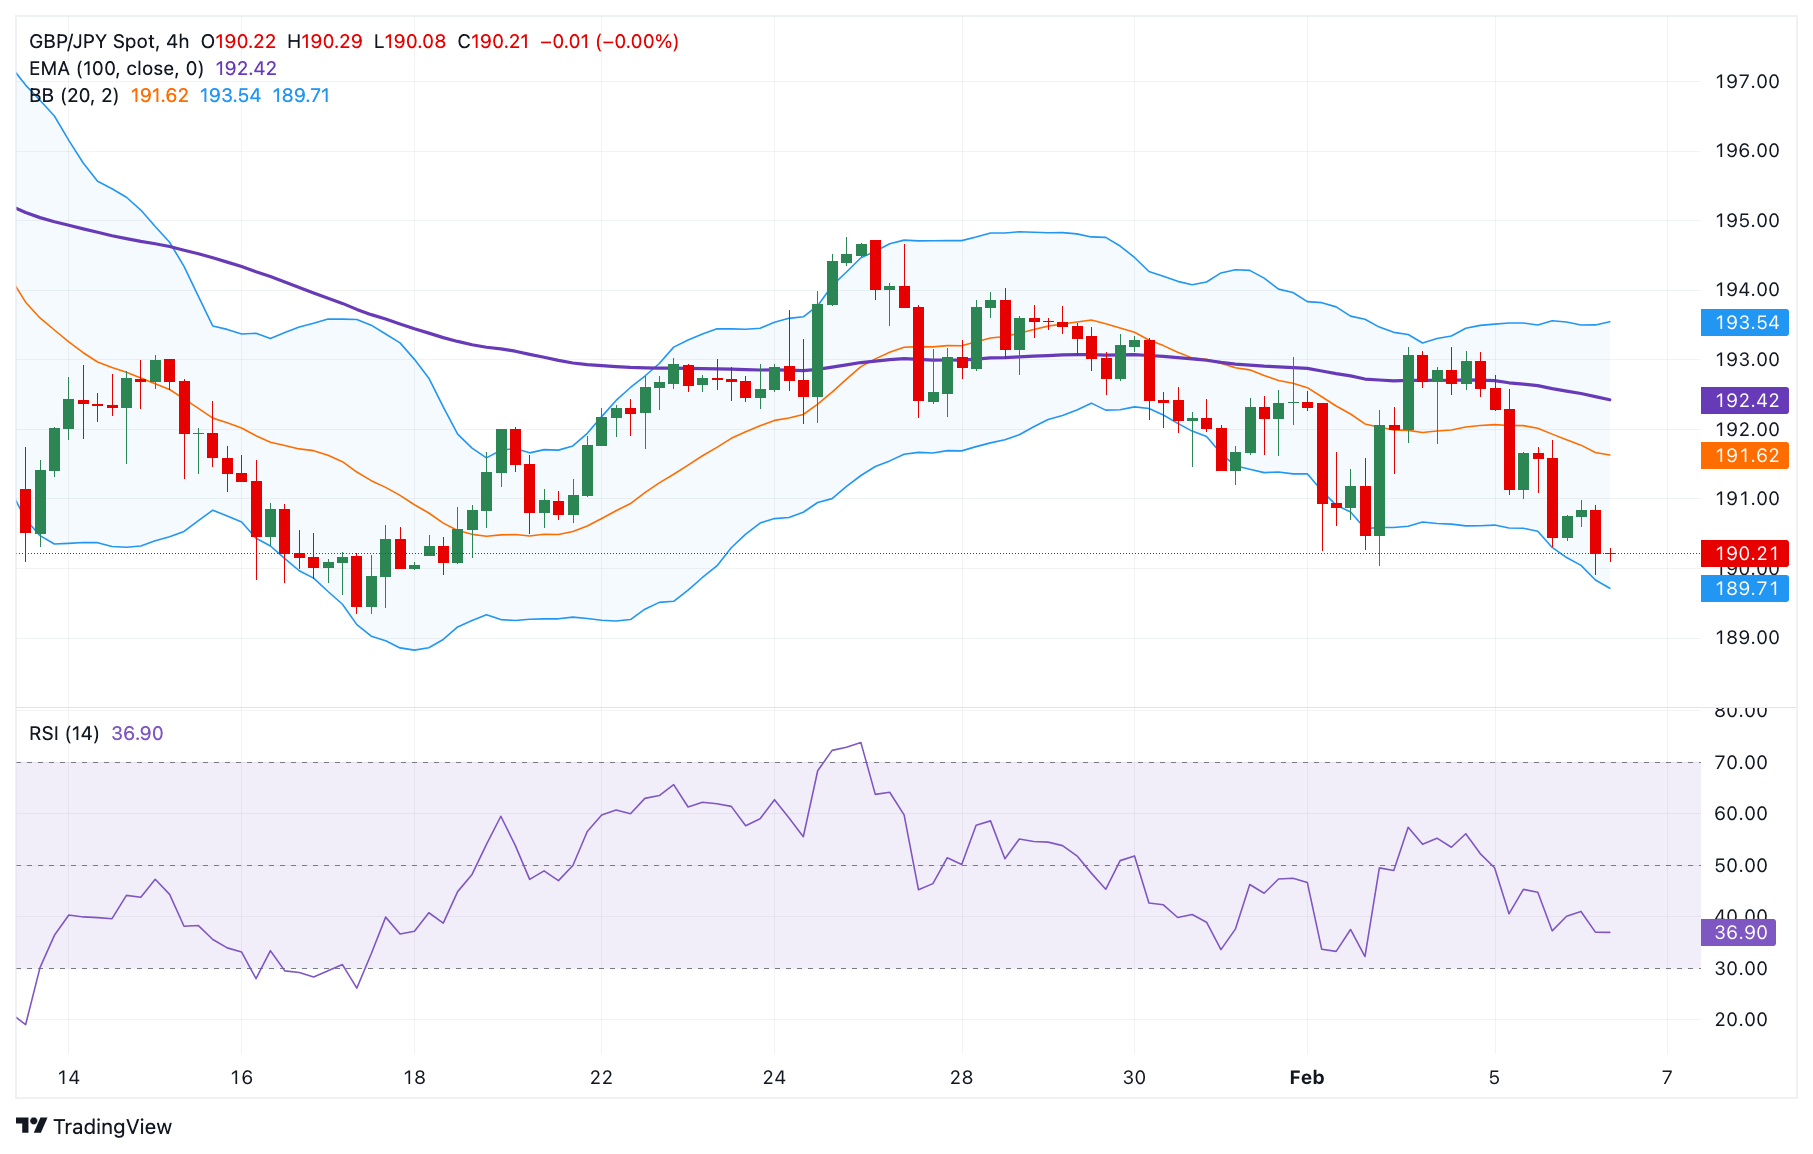
Japanese Yen FAQs
The Japanese Yen (JPY) is one of the world’s most traded currencies. Its value is broadly determined by the performance of the Japanese economy, but more specifically by the Bank of Japan’s policy, the differential between Japanese and US bond yields, or risk sentiment among traders, among other factors.
One of the Bank of Japan’s mandates is currency control, so its moves are key for the Yen. The BoJ has directly intervened in currency markets sometimes, generally to lower the value of the Yen, although it refrains from doing it often due to political concerns of its main trading partners. The BoJ ultra-loose monetary policy between 2013 and 2024 caused the Yen to depreciate against its main currency peers due to an increasing policy divergence between the Bank of Japan and other main central banks. More recently, the gradually unwinding of this ultra-loose policy has given some support to the Yen.
Over the last decade, the BoJ’s stance of sticking to ultra-loose monetary policy has led to a widening policy divergence with other central banks, particularly with the US Federal Reserve. This supported a widening of the differential between the 10-year US and Japanese bonds, which favored the US Dollar against the Japanese Yen. The BoJ decision in 2024 to gradually abandon the ultra-loose policy, coupled with interest-rate cuts in other major central banks, is narrowing this differential.
The Japanese Yen is often seen as a safe-haven investment. This means that in times of market stress, investors are more likely to put their money in the Japanese currency due to its supposed reliability and stability. Turbulent times are likely to strengthen the Yen’s value against other currencies seen as more risky to invest in.
-
06:19
BoJ’s Tamura: Not saying that the neutral rate should be 1%
Bank of Japan (BoJ) board member Naoki Tamura is back on the wires, via Reuters, clarifying his earlier remarks on the central bank’s interest rate.
Key quotes
Not saying that neutral rate should be 1%.
Difficult to specify terminal rate at this point.
Will try to find where neutral rate should be while examining how economy prices respond to rate hikes.
Upward risks for prices is gradually increasing.
Would be good if terminal rate stands around neutral rate in the latter half of next fiscal year.
No preset idea about the pace of interest rate hikes.
While keeping neutral interest rate of 1% in mind, will raise interest rates in stages in line with the likelihood of achieving inflation target.
Pace of interest rate hikes may not necessarily be once half a year.
Not placing focus on the fact that the policy rate of 0.75% has not been experienced in the past 30 years.
Not necessarily moving forward when inflation target would be achieved, but the range has been narrowed.
Tamura said earlier this Thursday that the central bank must raise rates to approximately 1% by the latter half of fiscal 2025.
Market reaction
USD/JPY is recovering further ground on these above comments. At press time, the pair is losing 0.14% on the day to trade near 152.35.
-
06:06
EUR/USD holds losses below 1.0400 ahead of Eurozone Retail Sales data
- EUR/USD remains subdued as traders adopt caution ahead of Eurozone Retail Sales due on Thursday.
- ECB officials are confident about inflation sustainably returning to the central bank’s target of 2% this year.
- Fed’s Jefferson expressed his satisfaction with keeping the Fed Funds rate at its current level.
EUR/USD depreciates after two days of gains, trading around 1.0390 during the Asian session on Thursday. Traders await Eurozone Retail Sales data scheduled to be released later in the day.
Market forecasts anticipate Pan-European Retail Sales to grow 1.9% year-over-year in December, up from a 1.2% rise in the previous month. However, the MoM figure for December is expected to decline by 0.1%, against the previous 0.1% increase.
The Euro remains subdued amid ongoing expectations that the European Central Bank (ECB) will continue with its policy-easing spree, given that officials are confident about inflation sustainably returning to the central bank’s target of 2% this year.
The EUR/USD pair could have received downward pressure as the US Dollar Index (DXY), which measures the US Dollar’s (USD) value against six major currencies, holds ground following its three-day losing streak. The DXY trades around 107.70 at the time of writing.
On Thursday, Federal Reserve Vice Chair Philip Jefferson expressed satisfaction with maintaining the current Fed Funds rate, stating that he plans to assess the overall impact of Trump’s policies before making further decisions. He also highlighted that, despite a 100-basis-point decrease, the Fed’s rate remains restrictive for the economy.
On Wednesday, the weaker US Services Purchasing Manager Index (PMI) weighed on the Greenback. The US ISM Services PMI eased to 52.8 in January from 54.0 (revised from 54.1) in December. This reading came in below the market consensus of 54.3. Traders brace for Friday’s US Nonfarm Payrolls (NFP) data, which is expected to shape the Federal Reserve’s (Fed) monetary policy direction.
Economic Indicator
Retail Sales (YoY)
The Retail Sales data, released by Eurostat on a monthly basis, measures the volume of retail sales in the Eurozone. It shows the performance of the retail sector in the short term, which accounts for around 5% of the total value added of the Eurozone economies. Retail Sales data is widely followed as an indicator of consumer spending. Percent changes reflect the rate of changes in such sales, with the YoY reading comparing sales volumes in the reference month with the same month a year earlier. Generally, a high reading is seen as bullish for the Euro (EUR), while a low reading is seen as bearish.
Read more.Next release: Thu Feb 06, 2025 10:00
Frequency: Monthly
Consensus: 1.9%
Previous: 1.2%
Source: Eurostat
-
05:43
USD/CAD Price Forecast: Climbs closer to mid-1.4300s; lacks bullish conviction
- USD/CAD attracts some buyers on Thursday amid a modest USD uptick.
- Spot prices, however, lack traction, warranting caution for bullish traders.
- Bears need to wait for a break below 1.4260 before placing fresh bets.
The USD/CAD pair ticks higher during the Asian session on Thursday and moves away from over a two-week low, around the 1.4270 region touched the previous day. Spot prices currently trade around the 1.4345 area, up over 0.20% for the day, though the uptick lacks bullish conviction.
The US Dollar (USD) attracts some buyers and for now, seems to have snapped a three-day losing streak to its lowest level in over a week. Furthermore, the recent fall in Crude Oil prices is seen undermining the commodity-linked Loonie against the backdrop of the Bank of Canada's (BoC) dovish outlook and acting as a tailwind for the USD/CAD pair. However, the USD bulls seem reluctant amid prospects for further policy easing by the Federal Reserve (Fed), which, in turn, caps the upside for the currency pair.
From a technical perspective, the USD/CAD pair found some support ahead of the year-to-date (YTD) low, around the 1.4260 area touched in January, and the subsequent move up warrants caution for bearish traders. That said, oscillators on the daily chart have just started gaining negative traction and suggest that the path of least resistance for spot prices is to the downside. Some follow-through selling below the 1.4270-1.4260 area will reaffirm the outlook and pave the way for a slide toward the 1.4200 round figure.
A convincing break below the latter will set the stage for an extension of this week's sharp retracement slide from the vicinity of the 1.4800 mark, or the highest level since April 2003. The USD/CAD pair might then weaken further below the 1.4170 support and accelerate the decline further towards the 1.4125 region en route to the 1.4100 round-figure mark.
On the flip side, any further move up beyond the 1.4355-1.4360 area is likely to face resistance ahead of the 1.4400 mark. The said handle could act as a pivotal point for intraday traders, which if cleared could lift the USD/CAD pair further towards the 1.4450 horizontal barrier en route to the 1.4500 psychological mark. Some follow-through buying beyond the 1.4535 hurdle will shift the bias back in favor of bulls and allow spot prices to reclaim the 1.4600 round figure and climb further towards the 1.4665-1.4670 region.
USD/CAD daily chart
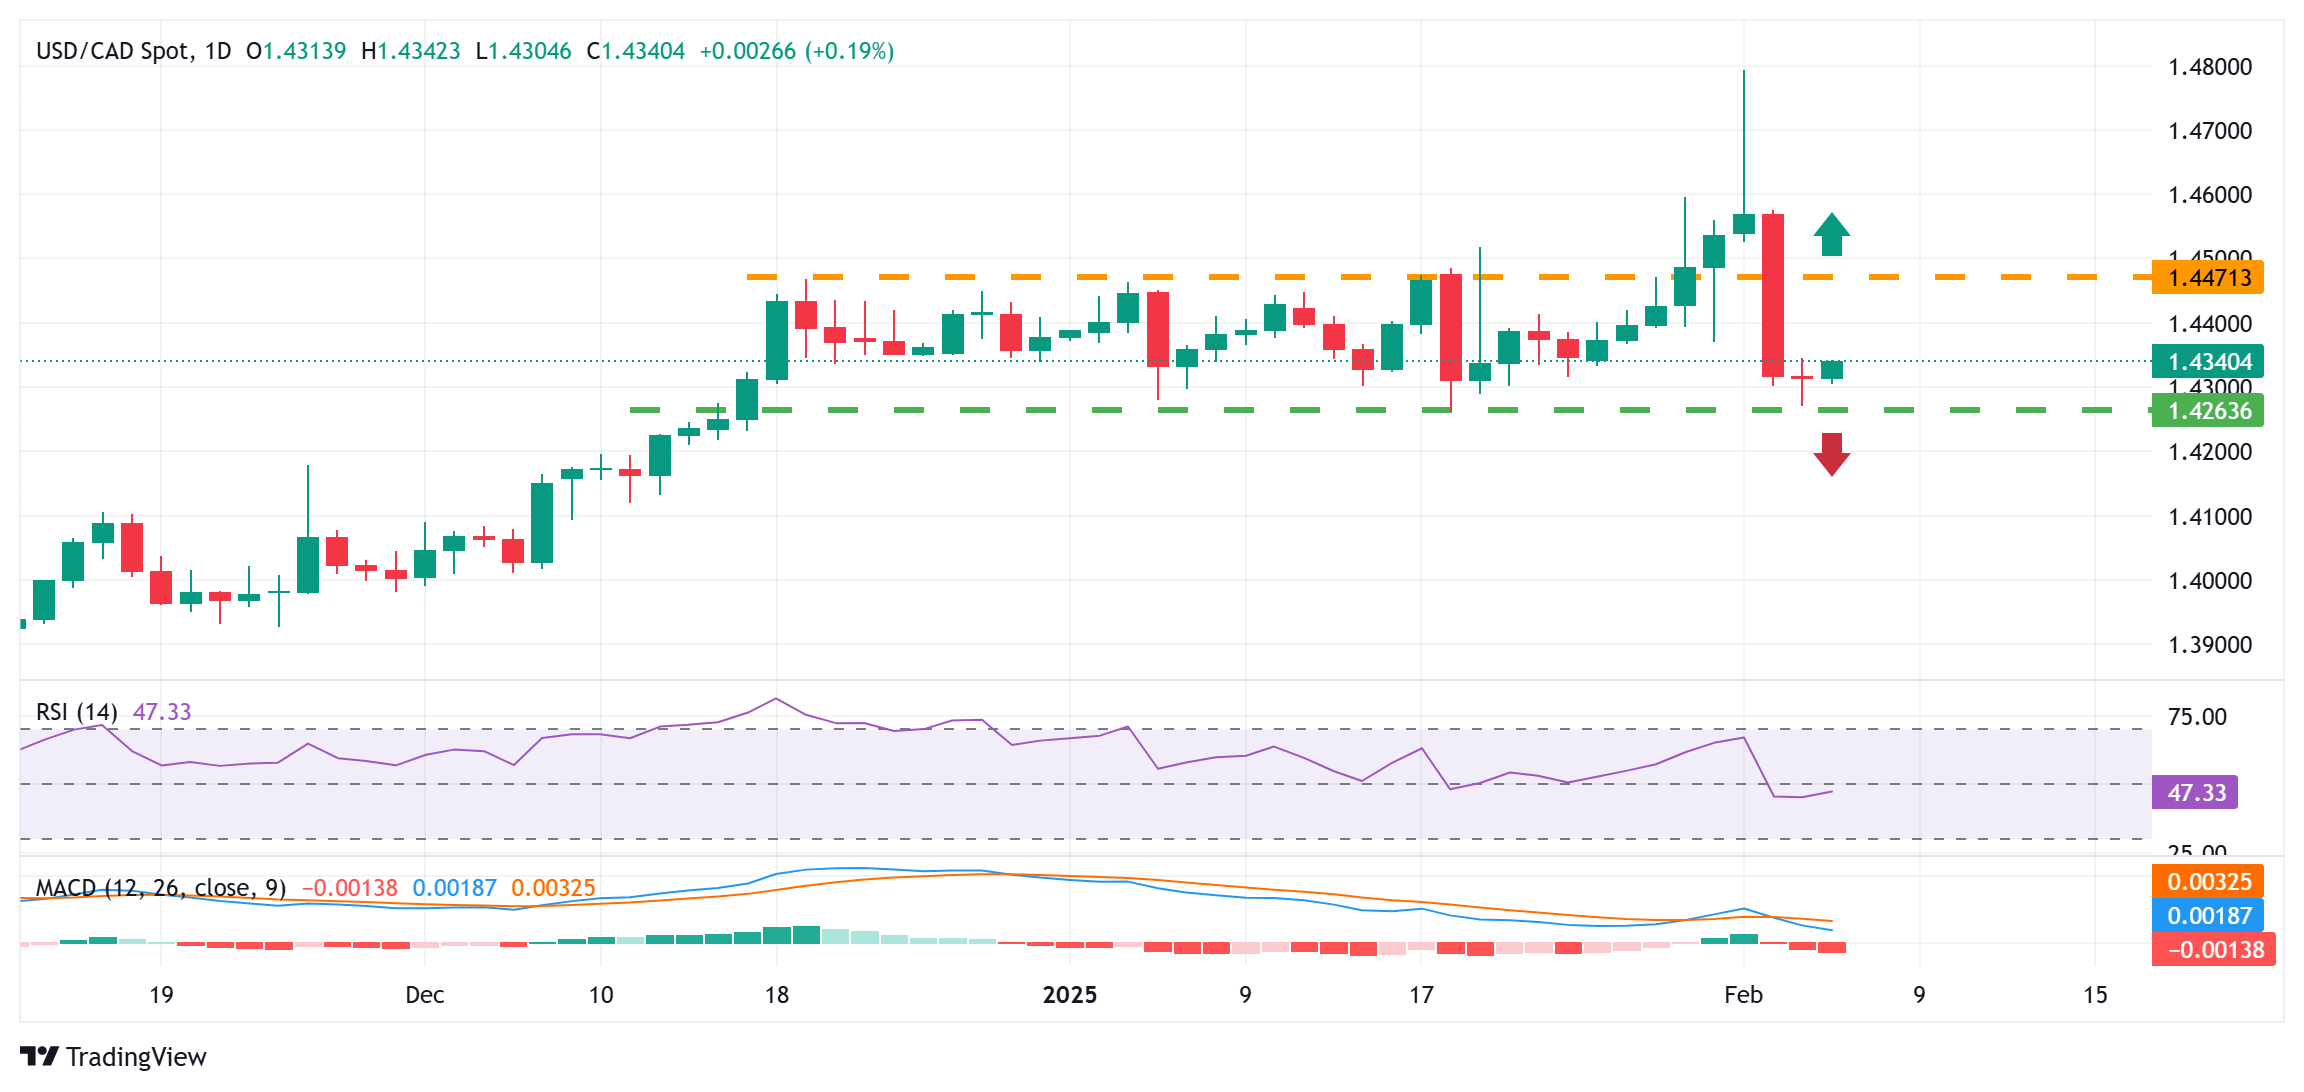
Canadian Dollar FAQs
The key factors driving the Canadian Dollar (CAD) are the level of interest rates set by the Bank of Canada (BoC), the price of Oil, Canada’s largest export, the health of its economy, inflation and the Trade Balance, which is the difference between the value of Canada’s exports versus its imports. Other factors include market sentiment – whether investors are taking on more risky assets (risk-on) or seeking safe-havens (risk-off) – with risk-on being CAD-positive. As its largest trading partner, the health of the US economy is also a key factor influencing the Canadian Dollar.
The Bank of Canada (BoC) has a significant influence on the Canadian Dollar by setting the level of interest rates that banks can lend to one another. This influences the level of interest rates for everyone. The main goal of the BoC is to maintain inflation at 1-3% by adjusting interest rates up or down. Relatively higher interest rates tend to be positive for the CAD. The Bank of Canada can also use quantitative easing and tightening to influence credit conditions, with the former CAD-negative and the latter CAD-positive.
The price of Oil is a key factor impacting the value of the Canadian Dollar. Petroleum is Canada’s biggest export, so Oil price tends to have an immediate impact on the CAD value. Generally, if Oil price rises CAD also goes up, as aggregate demand for the currency increases. The opposite is the case if the price of Oil falls. Higher Oil prices also tend to result in a greater likelihood of a positive Trade Balance, which is also supportive of the CAD.
While inflation had always traditionally been thought of as a negative factor for a currency since it lowers the value of money, the opposite has actually been the case in modern times with the relaxation of cross-border capital controls. Higher inflation tends to lead central banks to put up interest rates which attracts more capital inflows from global investors seeking a lucrative place to keep their money. This increases demand for the local currency, which in Canada’s case is the Canadian Dollar.
Macroeconomic data releases gauge the health of the economy and can have an impact on the Canadian Dollar. Indicators such as GDP, Manufacturing and Services PMIs, employment, and consumer sentiment surveys can all influence the direction of the CAD. A strong economy is good for the Canadian Dollar. Not only does it attract more foreign investment but it may encourage the Bank of Canada to put up interest rates, leading to a stronger currency. If economic data is weak, however, the CAD is likely to fall.
-
05:35
India Gold price today: Gold rises, according to FXStreet data
Gold prices rose in India on Thursday, according to data compiled by FXStreet.
The price for Gold stood at 8,074.29 Indian Rupees (INR) per gram, up compared with the INR 8,053.87 it cost on Wednesday.
The price for Gold increased to INR 94,176.97 per tola from INR 93,938.73 per tola a day earlier.
Unit measure Gold Price in INR 1 Gram 8,074.29 10 Grams 80,742.93 Tola 94,176.97 Troy Ounce 251,138.80 FXStreet calculates Gold prices in India by adapting international prices (USD/INR) to the local currency and measurement units. Prices are updated daily based on the market rates taken at the time of publication. Prices are just for reference and local rates could diverge slightly.
Gold FAQs
Gold has played a key role in human’s history as it has been widely used as a store of value and medium of exchange. Currently, apart from its shine and usage for jewelry, the precious metal is widely seen as a safe-haven asset, meaning that it is considered a good investment during turbulent times. Gold is also widely seen as a hedge against inflation and against depreciating currencies as it doesn’t rely on any specific issuer or government.
Central banks are the biggest Gold holders. In their aim to support their currencies in turbulent times, central banks tend to diversify their reserves and buy Gold to improve the perceived strength of the economy and the currency. High Gold reserves can be a source of trust for a country’s solvency. Central banks added 1,136 tonnes of Gold worth around $70 billion to their reserves in 2022, according to data from the World Gold Council. This is the highest yearly purchase since records began. Central banks from emerging economies such as China, India and Turkey are quickly increasing their Gold reserves.
Gold has an inverse correlation with the US Dollar and US Treasuries, which are both major reserve and safe-haven assets. When the Dollar depreciates, Gold tends to rise, enabling investors and central banks to diversify their assets in turbulent times. Gold is also inversely correlated with risk assets. A rally in the stock market tends to weaken Gold price, while sell-offs in riskier markets tend to favor the precious metal.
The price can move due to a wide range of factors. Geopolitical instability or fears of a deep recession can quickly make Gold price escalate due to its safe-haven status. As a yield-less asset, Gold tends to rise with lower interest rates, while higher cost of money usually weighs down on the yellow metal. Still, most moves depend on how the US Dollar (USD) behaves as the asset is priced in dollars (XAU/USD). A strong Dollar tends to keep the price of Gold controlled, whereas a weaker Dollar is likely to push Gold prices up.
(An automation tool was used in creating this post.)
-
05:20
GBP/USD steadies around 1.2500, downside risks appear due to dovish mood surrounding BoE
- GBP/USD moves little as traders adopt caution ahead of the BoE’s interest rate decision on Thursday.
- The BoE is widely anticipated to deliver a 25 basis point rate cut in February.
- The US ISM Services PMI eased to 52.8 in January from 54.0 in December.
GBP/USD halts its three-day winning streak, trading around 1.2490 during the Asian hours on Thursday. The Pound Sterling (GBP) could face downward pressure amid expectations that the Bank of England (BoE) will resume its policy-easing cycle, likely lowering interest rates by 25 basis points (bps) to 4.5% later in the day.
The BoE’s Monetary Policy Committee (MPC) is anticipated to vote 8-1 in favor of a quarter-point rate cut to 4.5%, with one member possibly suggesting that rates should be left unchanged for another meeting.
The GBP/USD pair inches lower as the US Dollar Index (DXY), which measures the US Dollar’s (USD) value against six major currencies, holds ground following its three-day losing streak. The DXY trades around 107.60 at the time of writing.
On Thursday, Federal Reserve Vice Chair Philip Jefferson expressed his satisfaction with keeping the Fed Funds rate at its current level, stating that he would assess the overall impact of Trump's policies before making further decisions. He also emphasized that the Fed's rate remains restrictive for the economy, even with a 100-basis-point decline.
On Wednesday, the weaker US Services Purchasing Manager Index (PMI) weighed on the Greenback. The US ISM Services PMI eased to 52.8 in January from 54.0 (revised from 54.1) in December. This reading came in below the market consensus of 54.3. Traders brace for Friday’s US Nonfarm Payrolls (NFP) data, which is expected to shape the Federal Reserve’s (Fed) monetary policy direction.
Economic Indicator
BoE Interest Rate Decision
The Bank of England (BoE) announces its interest rate decision at the end of its eight scheduled meetings per year. If the BoE is hawkish about the inflationary outlook of the economy and raises interest rates it is usually bullish for the Pound Sterling (GBP). Likewise, if the BoE adopts a dovish view on the UK economy and keeps interest rates unchanged, or cuts them, it is seen as bearish for GBP.
Read more.Next release: Thu Feb 06, 2025 12:00
Frequency: Irregular
Consensus: 4.5%
Previous: 4.75%
Source: Bank of England
-
05:17
Gold price sits near all-time peak; overbought conditions warrant caution for bulls
- Gold price holds steady just below the record high touched on Wednesday.
- US-China trade war anxiety boosts demand for the safe-haven XAU/USD pair.
- Fed rate cut bets and falling US bond yields also underpin the precious metal.
Gold price (XAU/USD) trades with a mild positive bias during the Asian session on Thursday and remains close to the all-time peak touched the previous day. Investors continue to seek refuge in the traditional safe-haven bullion amid escalating concerns about a US-China trade war and the potential economic fallout from US President Donald Trump's trade tariffs. Furthermore, expectations that the Federal Reserve (Fed) will keep cutting interest rates in 2025 and the recent fall in the US Treasury bond yields further underpin the non-yielding yellow metal.
Bulls, however, take a brief pause for a breather amid slightly overbought conditions and the prevalent risk-on mood, which tends to dent demand for the Gold price. Apart from this, a modest US Dollar (USD) bounce from over a one-week low touched on Wednesday contributes to capping the upside for the commodity. That said, the fundamental backdrop supports prospects for an extension of a well-established uptrend from the December monthly swing low. Traders now look forward to the release of the US Weekly Jobless Claims for short-term impetus.
Gold price continues to attract safe-haven flows amid worries about Trump’s trade tariffs
- US President Donald Trump's new 10% tariffs on Chinese imports came into effect on Tuesday. Furthermore, China announced retaliatory tariffs on some US goods, fueling worries about an escalating trade war and lifting the safe-haven Gold price to a fresh record high on Wednesday.
- The Automatic Data Processing (ADP) reported that private-sector added 183K in January compared to the previous month's upwardly revised reading of 176K. This, however, was offset by the disappointing release of the US ISM Services PMI, which declined to 52.8 in January.
- The US Treasury yields dropped to their lowest level since mid-December in reaction to the softer data. Moreover, expectations the Federal Reserve will lower borrowing costs twice this year drag the US Dollar to over a one-week low and further benefit the non-yielding yellow metal.
- US Treasury Secretary Scott Bessent said late Wednesday, the focus is on bringing down 10-year Treasury yields, rather than the Fed’s benchmark short-term interest rate. Bessent added that interest rates will take care of themselves if we get energy costs down and deregulate the economy.
- The USD bulls failed to gain respite from Fed Vice Chair Philip Jefferson's hawkish remarks on Thursday, saying that he is happy to keep the Fed Funds on hold at the current level. He will wait to see the net effect of US President Donald Trump's policies, Jefferson noted further.
- Investors are looking to the US monthly employment details – popularly known as the Nonfarm Payrolls report – on Friday for further clues on the outlook for rates. In the meantime, traders on Thursday will take cues from the release of the usual US Weekly Initial Jobless Claims data.
Gold price needs to consolidate the recent strong gains before the next leg up
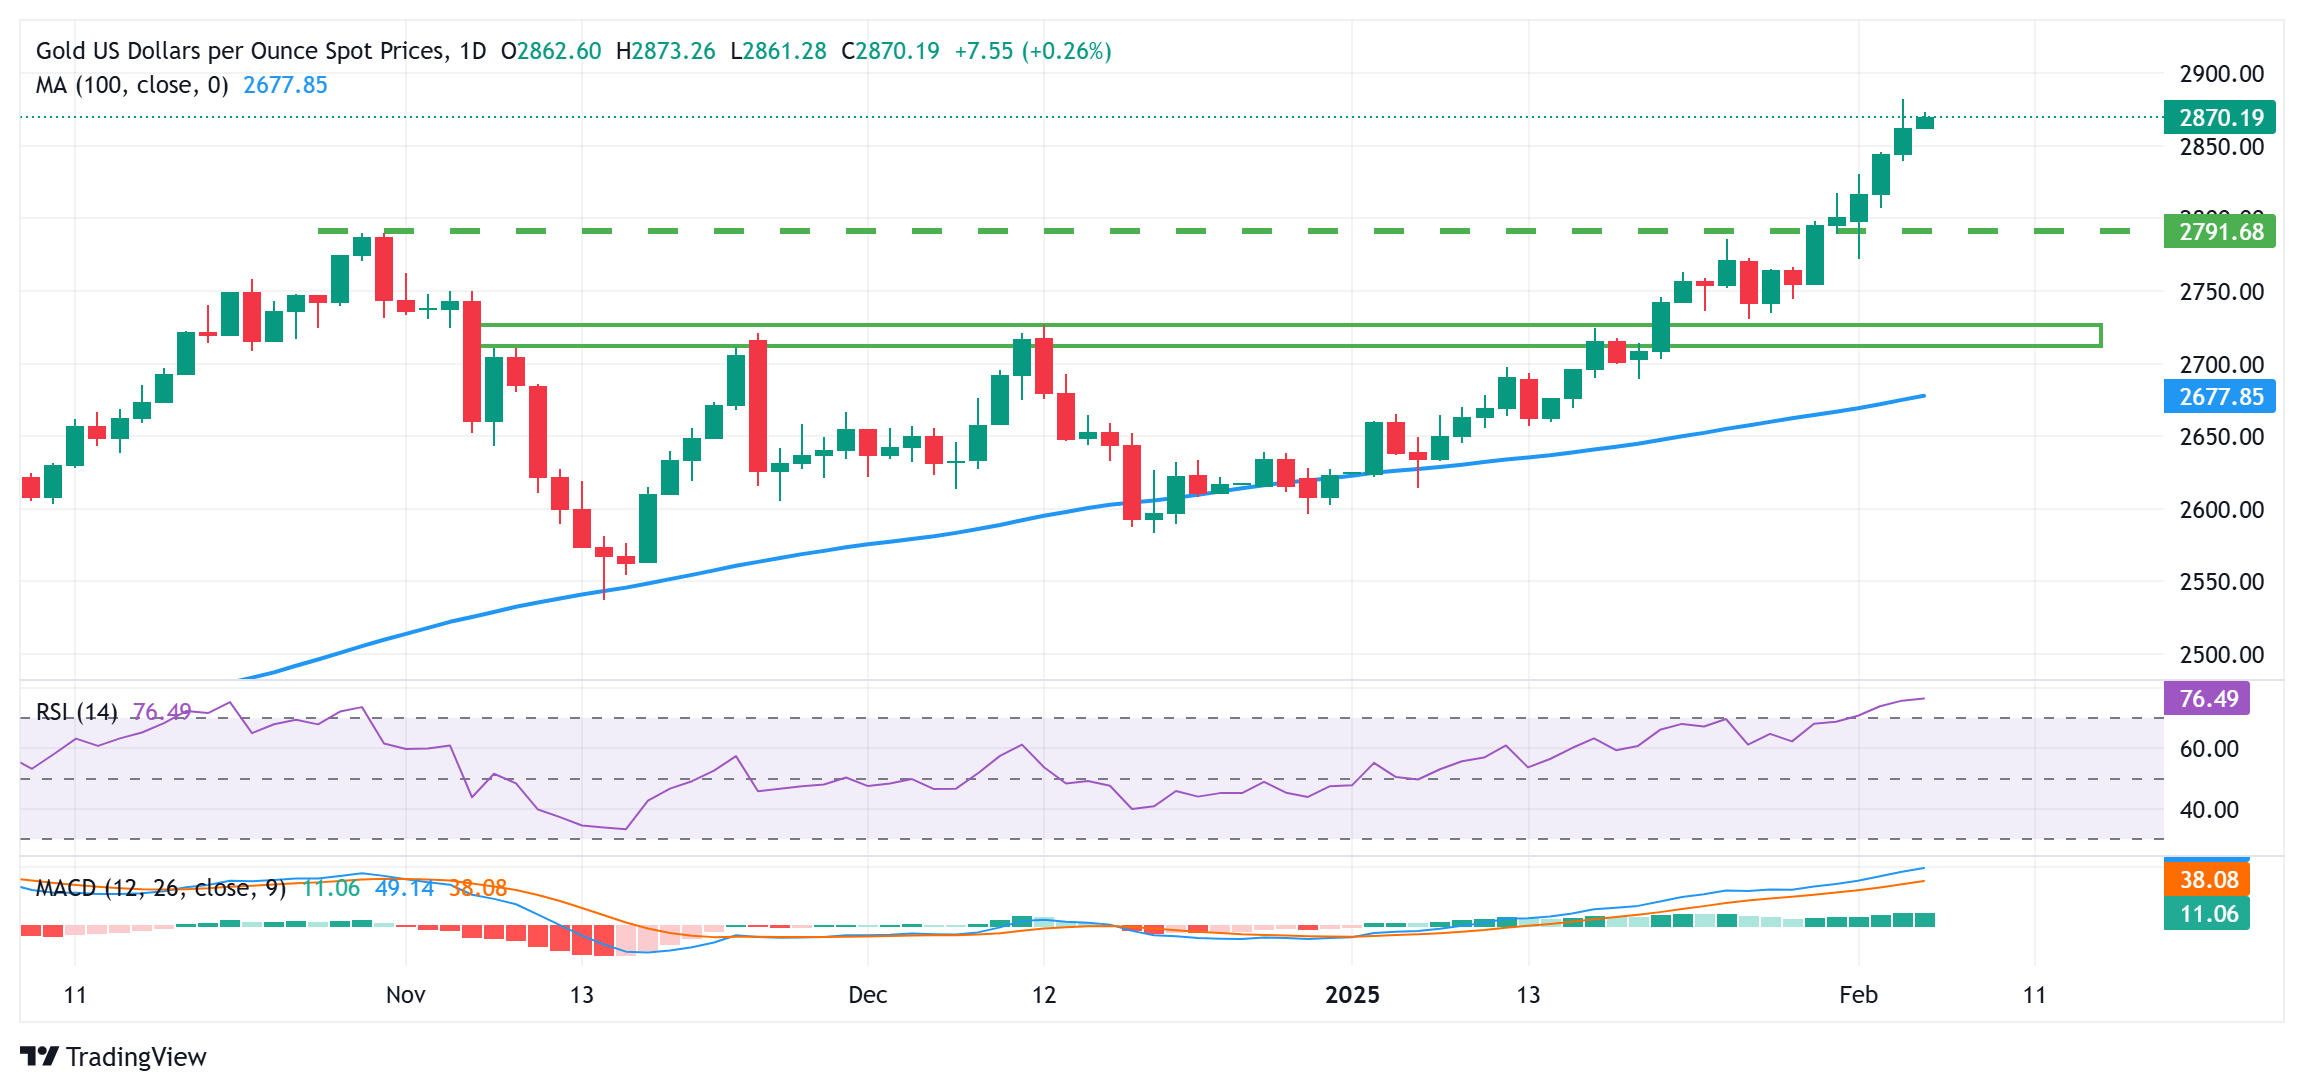
From a technical perspective, the Relative Strength Index (RSI) has moved above the 70 mark and warrants some caution for bullish traders. Hence, it will be prudent to wait for some near-term consolidation or a modest pullback before positioning for any further appreciating move. Nevertheless, the recent breakout through key barriers suggests that the path of least resistance for the Gold price remains to the upside.
In the meantime, any corrective slide is likely to find some support near the $2,855-2,850 area, below which the Gold price could slide further toward the $2,810-2,800 region. This is followed by the $2,773-2,772 horizontal resistance breakpoint, now turned support, which if broken might prompt some technical selling and pave the way for deeper losses.
Gold FAQs
Gold has played a key role in human’s history as it has been widely used as a store of value and medium of exchange. Currently, apart from its shine and usage for jewelry, the precious metal is widely seen as a safe-haven asset, meaning that it is considered a good investment during turbulent times. Gold is also widely seen as a hedge against inflation and against depreciating currencies as it doesn’t rely on any specific issuer or government.
Central banks are the biggest Gold holders. In their aim to support their currencies in turbulent times, central banks tend to diversify their reserves and buy Gold to improve the perceived strength of the economy and the currency. High Gold reserves can be a source of trust for a country’s solvency. Central banks added 1,136 tonnes of Gold worth around $70 billion to their reserves in 2022, according to data from the World Gold Council. This is the highest yearly purchase since records began. Central banks from emerging economies such as China, India and Turkey are quickly increasing their Gold reserves.
Gold has an inverse correlation with the US Dollar and US Treasuries, which are both major reserve and safe-haven assets. When the Dollar depreciates, Gold tends to rise, enabling investors and central banks to diversify their assets in turbulent times. Gold is also inversely correlated with risk assets. A rally in the stock market tends to weaken Gold price, while sell-offs in riskier markets tend to favor the precious metal.
The price can move due to a wide range of factors. Geopolitical instability or fears of a deep recession can quickly make Gold price escalate due to its safe-haven status. As a yield-less asset, Gold tends to rise with lower interest rates, while higher cost of money usually weighs down on the yellow metal. Still, most moves depend on how the US Dollar (USD) behaves as the asset is priced in dollars (XAU/USD). A strong Dollar tends to keep the price of Gold controlled, whereas a weaker Dollar is likely to push Gold prices up.
US-China Trade War FAQs
Generally speaking, a trade war is an economic conflict between two or more countries due to extreme protectionism on one end. It implies the creation of trade barriers, such as tariffs, which result in counter-barriers, escalating import costs, and hence the cost of living.
An economic conflict between the United States (US) and China began early in 2018, when President Donald Trump set trade barriers on China, claiming unfair commercial practices and intellectual property theft from the Asian giant. China took retaliatory action, imposing tariffs on multiple US goods, such as automobiles and soybeans. Tensions escalated until the two countries signed the US-China Phase One trade deal in January 2020. The agreement required structural reforms and other changes to China’s economic and trade regime and pretended to restore stability and trust between the two nations. However, the Coronavirus pandemic took the focus out of the conflict. Yet, it is worth mentioning that President Joe Biden, who took office after Trump, kept tariffs in place and even added some additional levies.
The return of Donald Trump to the White House as the 47th US President has sparked a fresh wave of tensions between the two countries. During the 2024 election campaign, Trump pledged to impose 60% tariffs on China once he returned to office, which he did on January 20, 2025. With Trump back, the US-China trade war is meant to resume where it was left, with tit-for-tat policies affecting the global economic landscape amid disruptions in global supply chains, resulting in a reduction in spending, particularly investment, and directly feeding into the Consumer Price Index inflation.
-
04:41
US Treasury Sec Bessent: Focus is on bringing down 10-year Treasury yields than Fed’s key short-term rate.
US Treasury Secretary Scott Bessent said late Wednesday, the “focus is on bringing down 10-year Treasury yields, rather than the Fed’s benchmark short-term interest rate.”
Additional comments
Failure to get the tax bill done will result in the "largest tax hike in history".
US President Donald Trump wants lower interest rates.
Trump not calling for the Fed to lower interest rates.
Interest rates will take care of themselves if we get energy costs down and deregulate the economy.
Tariffs are not focused on revenue right now.
Tariffs are aimed at bringing manufacturing base back to the US.
Market reaction
The US Dollar Index (USD) shows little to no reaction to these comments, trading modestly flat around 107.65, as of writing.
-
04:19
USD/INR gathers strength amid RBI rate cut expectations
- The Indian Rupee extends its decline in Thursday’s Asian session.
- Rising bets of RBI rate cuts and risk aversion continue to undermine the INR.
- The RBI interest rate decision and the US January employment report will be in the spotlight on Friday.
The Indian Rupee (INR) extends its downside on Thursday. The local currency remains under selling pressure amid the expectation that the Reserve Bank of India (RBI) might cut the interest rates on Friday. Additionally, global trade war concerns fuelled risk aversion among investors, weighing on the INR.
Nonetheless, the foreign exchange intervention by the RBI and a decline in crude oil prices might help limit the Indian Rupee’s losses. Later on Thursday, the US weekly Initial Jobless Claims, Unit Labor Costs and Nonfarm Productivity will be released. The attention will shift to the RBI interest rate decision and the US January employment data on Friday.Indian Rupee falls as India’s new RBI Governor is set to begin rate cuts
- Most of the economists surveyed by Bloomberg anticipate the Indian central bank to lower the benchmark repurchase rate by at least 25 basis points (bps) to 6.25% on Friday.
- HSBC India Composite PMI came in at 57.7 in January. This figure came in weaker than the previous reading and the estimation of 57.9.
- HSBC India Services PMI eased to a two-year low of 56.5 in January versus 56.8 prior, lower than expected.
- "India's services sector lost growth momentum in January, although the PMI remained well above the 50-break-even level. The business activity and new business PMI indices eased to their lowest levels since November 2022 and November 2023, respectively," said Pranjul Bhandari, Chief India Economist at HSBC.
- The US Services PMI eased to 52.8 in January from 54.0 (revised from 54.1) in December, according to the Institute for Supply Management (ISM) on Wednesday. This reading came in below the market consensus of 54.3.
- Fed Vice Chair Philip Jefferson said on Thursday that he is happy to keep the Fed Funds on hold at the current level, adding that he will wait to see the net effect of Trump policies.
USD/INR maintains its positive trend
The Indian Rupee trades in negative territory on the day. The bullish view of the USD/INR pair prevails, characterized by the price holding above the key 100-day Exponential Moving Average (EMA). However, further consolidation cannot be ruled out before positioning for any near-term USD/INR appreciation as the 14-day Relative Strength Index (RSI) moves beyond the 70.00 mark.
The first upside barrier for USD/INR emerges at 87.49, an all-time high. Bullish candlesticks and buying pressure above this level might attract the pair to the 88.00 psychological level.
On the other hand, the 87.05-87.00 area acts as an initial support level for the pair, representing the low of February 5 and the round mark. More bearish candles or consistent trading below the mentioned level, the bears could take control and drag USD/INR down to 86.51, the low of February 3.Indian Rupee FAQs
The Indian Rupee (INR) is one of the most sensitive currencies to external factors. The price of Crude Oil (the country is highly dependent on imported Oil), the value of the US Dollar – most trade is conducted in USD – and the level of foreign investment, are all influential. Direct intervention by the Reserve Bank of India (RBI) in FX markets to keep the exchange rate stable, as well as the level of interest rates set by the RBI, are further major influencing factors on the Rupee.
The Reserve Bank of India (RBI) actively intervenes in forex markets to maintain a stable exchange rate, to help facilitate trade. In addition, the RBI tries to maintain the inflation rate at its 4% target by adjusting interest rates. Higher interest rates usually strengthen the Rupee. This is due to the role of the ‘carry trade’ in which investors borrow in countries with lower interest rates so as to place their money in countries’ offering relatively higher interest rates and profit from the difference.
Macroeconomic factors that influence the value of the Rupee include inflation, interest rates, the economic growth rate (GDP), the balance of trade, and inflows from foreign investment. A higher growth rate can lead to more overseas investment, pushing up demand for the Rupee. A less negative balance of trade will eventually lead to a stronger Rupee. Higher interest rates, especially real rates (interest rates less inflation) are also positive for the Rupee. A risk-on environment can lead to greater inflows of Foreign Direct and Indirect Investment (FDI and FII), which also benefit the Rupee.
Higher inflation, particularly, if it is comparatively higher than India’s peers, is generally negative for the currency as it reflects devaluation through oversupply. Inflation also increases the cost of exports, leading to more Rupees being sold to purchase foreign imports, which is Rupee-negative. At the same time, higher inflation usually leads to the Reserve Bank of India (RBI) raising interest rates and this can be positive for the Rupee, due to increased demand from international investors. The opposite effect is true of lower inflation.
-
04:07
Silver Price Forecast: XAG/USD maintains position around $32.50, three-month highs
- Silver price holds ground near its three-month high of $32.56, recorded on February 5.
- A break above the 70 RSI level could indicate overbought conditions, potentially triggering a downward correction.
- The critical support zone appears at a nine-day EMA at $31.58, followed by the ascending channel’s lower boundary at $31.00.
Silver price (XAG/USD) extends its winning streak for the fourth consecutive session, trading near $32.30 per troy ounce during Asian hours on Thursday. Technical analysis on the daily chart highlights a strong bullish bias, with the price maintaining an upward trajectory within an ascending channel.
The XAG/USD pair remains above both the nine-day and 14-day Exponential Moving Averages (EMAs), indicating solid short-term momentum. Additionally, the 14-day Relative Strength Index (RSI) is approaching the 70 level, reinforcing bullish sentiment. A break above the 70 mark could signal overbought conditions, potentially leading to a downward correction.
On the upside, Silver price faces immediate resistance at its three-month high of $32.56, last reached on February 5. A decisive breakout above this level could pave the way for a test of the ascending channel’s upper boundary at $33.10.
Support levels include the nine-day EMA at $31.58, followed by the 14-day EMA at $31.28, and the lower boundary of the ascending channel at $31.00. A drop below this critical support zone could weaken the bullish outlook, exposing the XAG/USD pair to further downside toward its five-month low of $28.74, recorded on December 19.
XAG/USD: Daily Chart
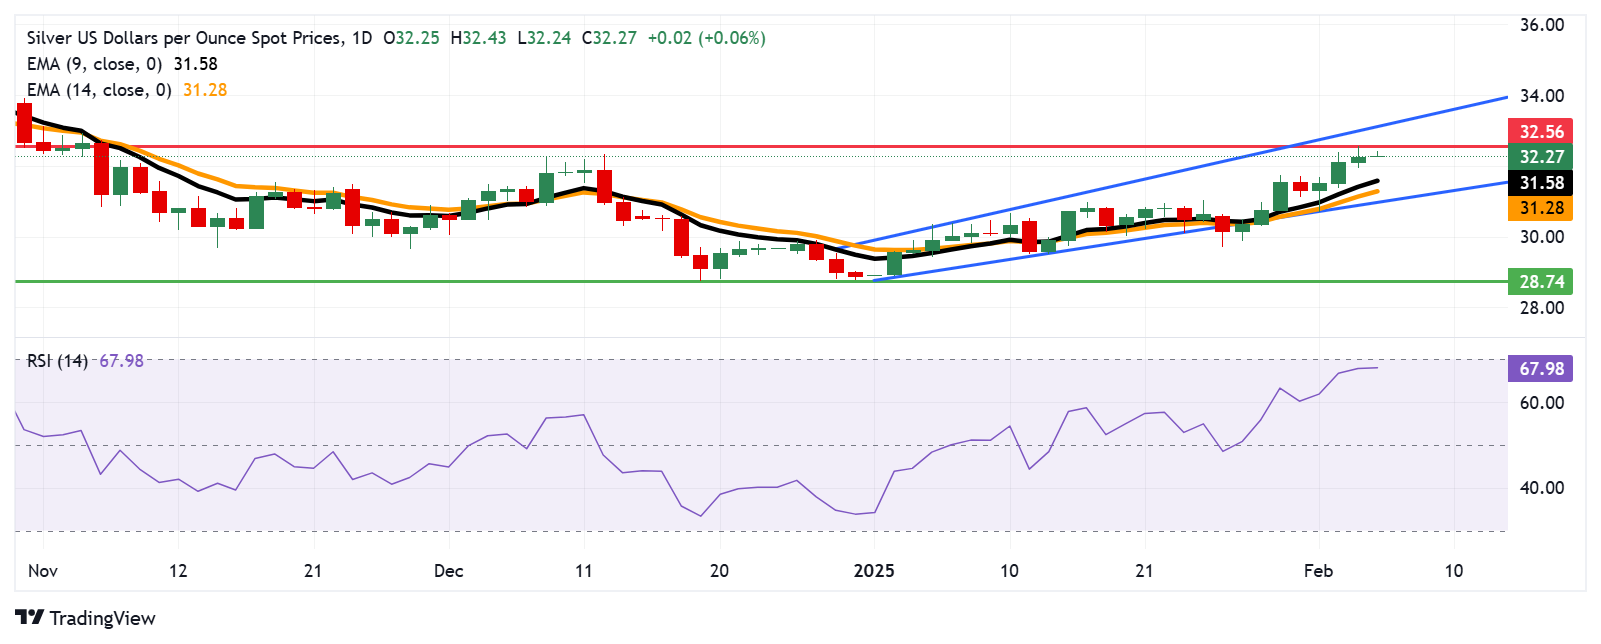
Silver FAQs
Silver is a precious metal highly traded among investors. It has been historically used as a store of value and a medium of exchange. Although less popular than Gold, traders may turn to Silver to diversify their investment portfolio, for its intrinsic value or as a potential hedge during high-inflation periods. Investors can buy physical Silver, in coins or in bars, or trade it through vehicles such as Exchange Traded Funds, which track its price on international markets.
Silver prices can move due to a wide range of factors. Geopolitical instability or fears of a deep recession can make Silver price escalate due to its safe-haven status, although to a lesser extent than Gold's. As a yieldless asset, Silver tends to rise with lower interest rates. Its moves also depend on how the US Dollar (USD) behaves as the asset is priced in dollars (XAG/USD). A strong Dollar tends to keep the price of Silver at bay, whereas a weaker Dollar is likely to propel prices up. Other factors such as investment demand, mining supply – Silver is much more abundant than Gold – and recycling rates can also affect prices.
Silver is widely used in industry, particularly in sectors such as electronics or solar energy, as it has one of the highest electric conductivity of all metals – more than Copper and Gold. A surge in demand can increase prices, while a decline tends to lower them. Dynamics in the US, Chinese and Indian economies can also contribute to price swings: for the US and particularly China, their big industrial sectors use Silver in various processes; in India, consumers’ demand for the precious metal for jewellery also plays a key role in setting prices.
Silver prices tend to follow Gold's moves. When Gold prices rise, Silver typically follows suit, as their status as safe-haven assets is similar. The Gold/Silver ratio, which shows the number of ounces of Silver needed to equal the value of one ounce of Gold, may help to determine the relative valuation between both metals. Some investors may consider a high ratio as an indicator that Silver is undervalued, or Gold is overvalued. On the contrary, a low ratio might suggest that Gold is undervalued relative to Silver.
-
03:30
Japanese Yen rallies to near two-month top against USD amid hawkish BoJ expectations
- The Japanese Yen strengthens against the USD for the third straight day on Thursday.
- The divergent BoJ-Fed policy expectations continue to underpin the lower-yielding JPY.
- A positive risk tone does little to dent bullish sentiment surrounding the safe-haven JPY.
The Japanese Yen (JPY) remains on the front foot against its American counterpart during the Asian session on Thursday amid the growing acceptance that the Bank of Japan (BoJ) would keep raising interest rates. The bets were reaffirmed by better-than-expected Japanese wage data on Wednesday. In contrast, the Federal Reserve (Fed) is expected to lower borrowing costs further by the end of this year. This would result in the narrowing of the rate differential between Japan and the US, which turns out to be another factor driving flows toward the lower-yielding JPY.
Meanwhile, the prospects for further policy easing by the Fed, along with the recent decline in the US Treasury bond yields, keep the US Dollar (USD) depressed near its lowest level in over a week. This, in turn, is seen exerting downward pressure on the USD/JPY pair for the third successive day and drags spot prices to the 151.80 area, or the lowest level since December 12. It, however, remains to be seen if the JPY bulls can retain control amid worries that Japan would also be an eventual target for US President Donald Trump's trade tariffs and the risk-on mood.
Japanese Yen continues to gain positive traction amid rising BoJ rate hike bets
- Data released on Wednesday showed a rise in Japan's real wages, which reaffirms bets that the Bank of Japan will raise interest rates again and continues to underpin the Japanese Yen.
- Japan's Finance Minister, Katsunobu Kato, said on Thursday that he sees inflationary conditions as prices continue to rise further, though the end of deflation has not yet been achieved.
- Separately, BoJ Board Member, Tamura Naoki, backed faster interest rate hikes and said that the central bank must raise rates at least to around 1% in the latter half of fiscal 2025.
- According to LSEG, market participants are currently pricing around a 94.8% chance for a quarter-point hike by the BoJ at its September monetary policy meeting.
- In contrast, the markets are pricing in the possibility that the Federal Reserve will cut interest rates twice by the end of this year amid signs of a slowdown in the US job market.
- The Job Openings and Labor Turnover Survey (JOLTS) showed on Tuesday that the number of job openings fell from 8.09 million in the previous month to 7.6 million in December.
- Moreover, the Institute of Supply Management (ISM) reported that the economic activity in the US service sector continued to expand in January, albeit at a softer pace than in December.
- The US ISM Services PMI declined from 54.0 to 52.8 in January and the Prices Paid Index dropped to 60.4 from 64.4, while the Employment Index edged higher to 52.3 from 51.3.
- The softer services activity data dragged the US Treasury bond yields lower, which undermined the US Dollar and exerted heavy downward pressure on the USD/JPY pair.
- The USD failed to gain respite from the Automatic Data Processing (ADP) report, which showed that the private sector added 183K in January compared to 176K in the previous month.
- Fed Vice Chair Philip Jefferson said on Thursday that he is happy to keep the Fed Funds on hold at the current level and that he will wait to see the net effect of Trump's policies.
- Thursday's US economic docket features the release of Challenger Job Cuts and the usual Weekly Initial Jobless Claims data, which might provide some impetus to the Greenback.
- The market focus, however, will remain glued to the closely-watched US monthly employment details – popularly known as Nonfarm Payrolls (NFP) report due on Friday.
USD/JPY seems vulnerable after the overnight breakdown below the 152.50 confluence
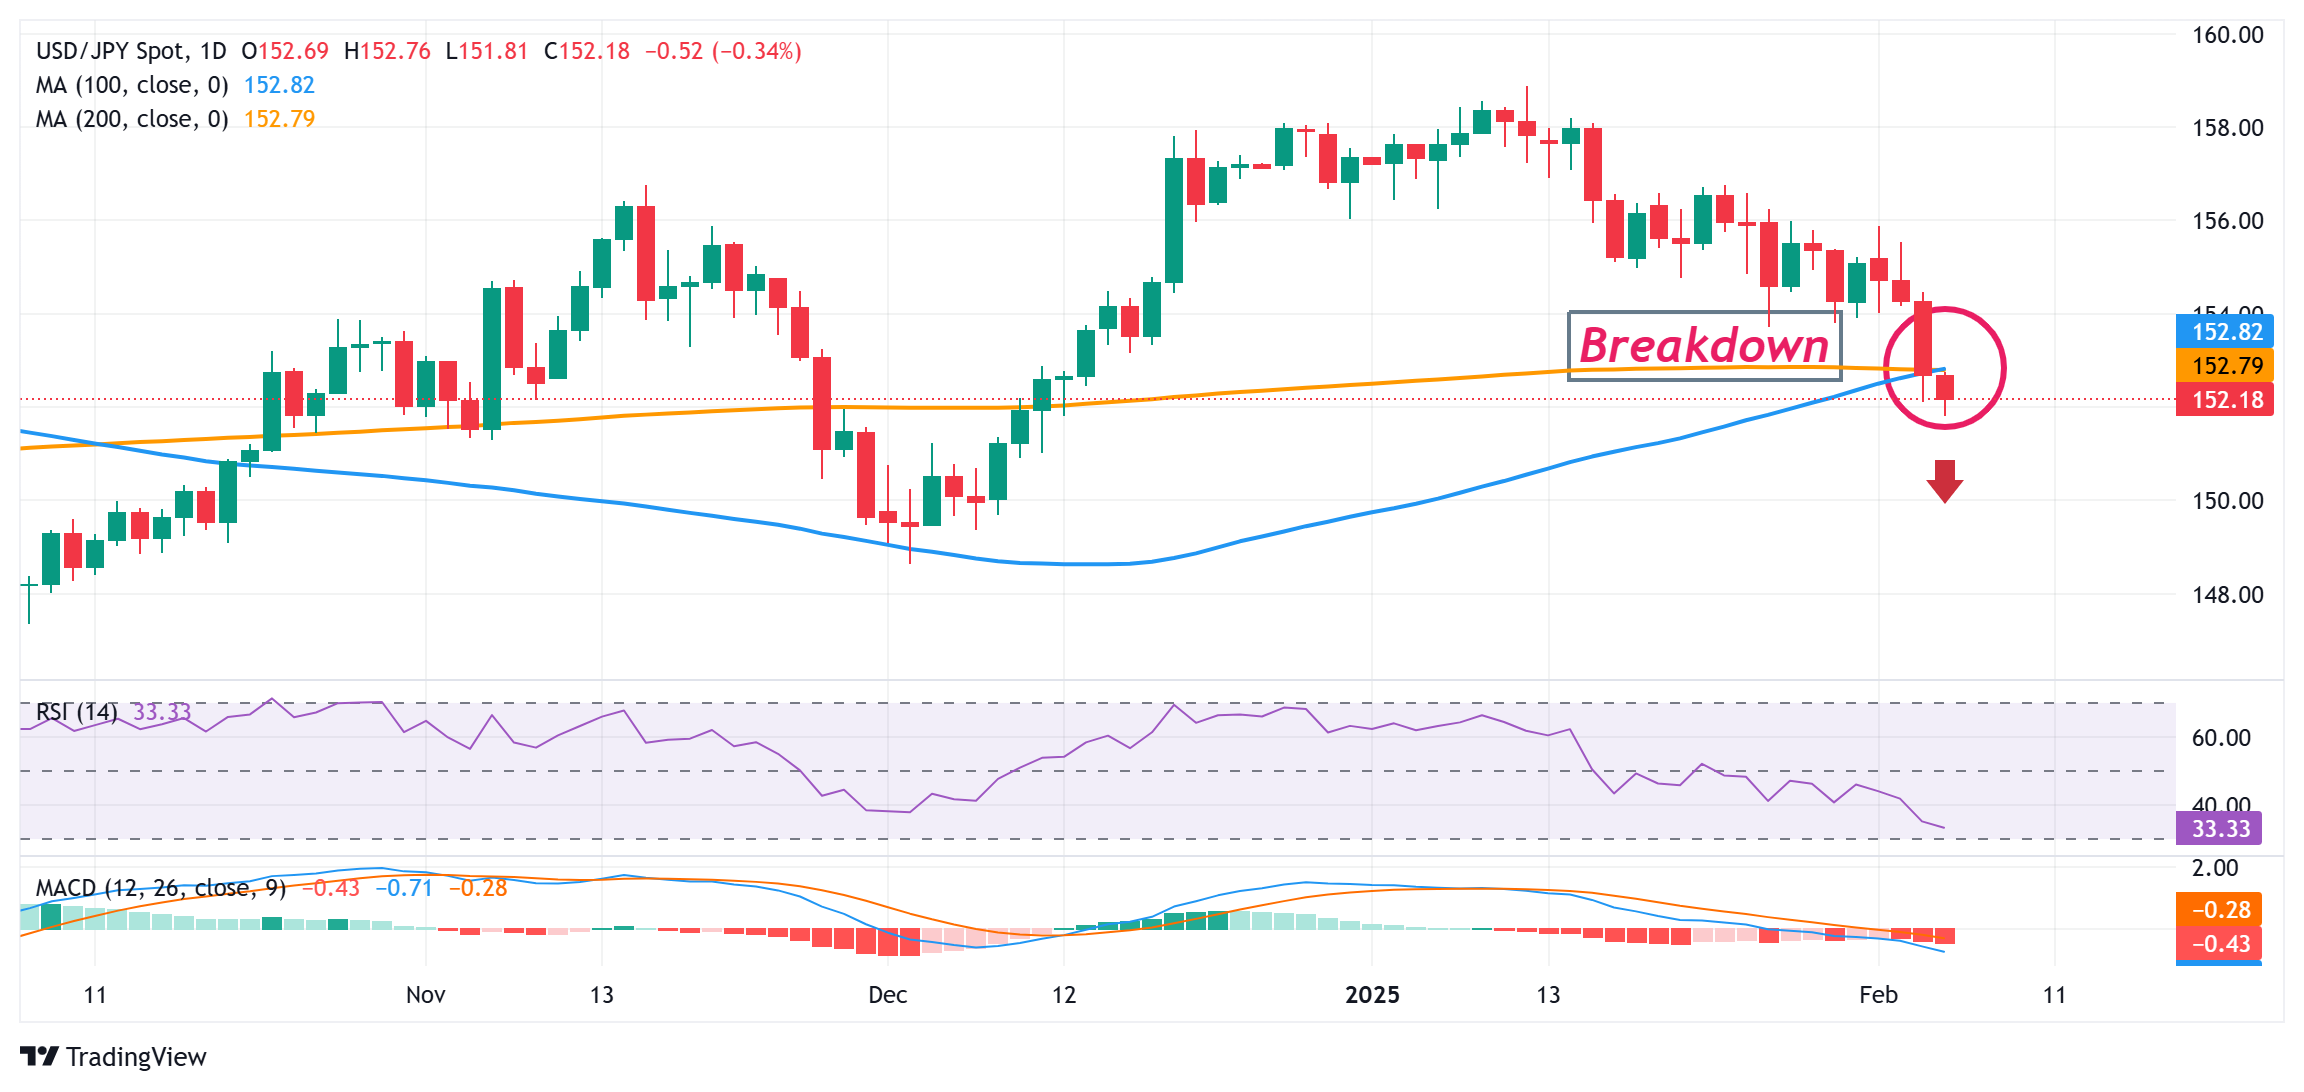
From a technical perspective, the overnight breakdown and close below the 152.50-152.45 confluence – comprising the 100- and the 200-day Simple Moving Averages (SMAs) was seen as a fresh trigger for bearish traders. A subsequent fall below the 152.00 mark validates the negative outlook and suggests that the path of least resistance for the USD/JPY pair remains to the downside. Given that oscillators on the daily chart are still away from being in the oversold zone, spot prices could slide further toward the 151.50 intermediate support en route to the 151.00 mark and the 150.60 horizontal support.
On the flip side, an attempted recovery might now confront stiff resistance and remain capped near the 152.50 confluence support breakpoint. A sustained strength beyond, however, might trigger a short-covering rally and lift the USD/JPY pair beyond the 153.00 mark, toward testing the next relevant hurdle near the 153.70-153.80 region. This is closely followed by the 154.00 round figure, which if cleared might negate the negative outlook and shift the near-term bias in favor of bullish traders.
Japanese Yen FAQs
The Japanese Yen (JPY) is one of the world’s most traded currencies. Its value is broadly determined by the performance of the Japanese economy, but more specifically by the Bank of Japan’s policy, the differential between Japanese and US bond yields, or risk sentiment among traders, among other factors.
One of the Bank of Japan’s mandates is currency control, so its moves are key for the Yen. The BoJ has directly intervened in currency markets sometimes, generally to lower the value of the Yen, although it refrains from doing it often due to political concerns of its main trading partners. The BoJ ultra-loose monetary policy between 2013 and 2024 caused the Yen to depreciate against its main currency peers due to an increasing policy divergence between the Bank of Japan and other main central banks. More recently, the gradually unwinding of this ultra-loose policy has given some support to the Yen.
Over the last decade, the BoJ’s stance of sticking to ultra-loose monetary policy has led to a widening policy divergence with other central banks, particularly with the US Federal Reserve. This supported a widening of the differential between the 10-year US and Japanese bonds, which favored the US Dollar against the Japanese Yen. The BoJ decision in 2024 to gradually abandon the ultra-loose policy, coupled with interest-rate cuts in other major central banks, is narrowing this differential.
The Japanese Yen is often seen as a safe-haven investment. This means that in times of market stress, investors are more likely to put their money in the Japanese currency due to its supposed reliability and stability. Turbulent times are likely to strengthen the Yen’s value against other currencies seen as more risky to invest in.
-
03:30
Commodities. Daily history for Wednesday, February 5, 2025
Raw materials Closed Change, % Silver 32.3 0.5 Gold 2866.23 0.88 Palladium 990.51 -0.16 -
03:06
WTI remains on the defensive near $71.00 amid a rise in US oil stockpiles, concern about US-China trade
- WTI price edges lower to around $71.00 in Thursday’s early Asian session.
- US crude oil stockpiles rose by 8.664 million barrels last week, according to the EIA.
- Oil traders worry about China-US trade.
West Texas Intermediate (WTI), the US crude oil benchmark, is trading around $71.00 during the early Asian session on Thursday. The WTI price edges lower amid a large build in US crude stockpiles and worries about renewed US-China trade tensions.
US crude inventories rose sharply last week, signaling weaker demand. The US Energy Information Administration (EIA) weekly report showed crude oil stockpiles in the United States for the week ending January 31 climbed by 8.664 million barrels, compared to a rise of 3.463 million barrels in the previous week. The market consensus estimated that stocks would increase by 3.2 million barrels.
Concerns of a potential trade war between the United States and China, the world's top energy importer, could exert some selling pressure on the WTI price. On Tuesday, China's finance ministry announced a package of tariffs on a range of US products, including crude oil, farm equipment, and some autos in an immediate response to a 10% tariff on Chinese imports announced by US President Donald Trump. Additionally, China put several companies, including Google, on notice for possible sanctions in a measured response to Trump's tariffs.
On Wednesday, Iran's President Masoud Pezeshkian called OPEC members to unite against potential US sanctions after Trump's announcement of resuming the "maximum pressure" campaign against Iran during his first term. Meanwhile, Russia's Deputy Prime Minister Alexander Novak said that the group of ministers from OPEC and allies headed by Russia (OPEC+) reviewed Trump's proposal to increase production and decided that OPEC+ would begin increasing output on April 1 in accordance with previous plans.WTI Oil FAQs
WTI Oil is a type of Crude Oil sold on international markets. The WTI stands for West Texas Intermediate, one of three major types including Brent and Dubai Crude. WTI is also referred to as “light” and “sweet” because of its relatively low gravity and sulfur content respectively. It is considered a high quality Oil that is easily refined. It is sourced in the United States and distributed via the Cushing hub, which is considered “The Pipeline Crossroads of the World”. It is a benchmark for the Oil market and WTI price is frequently quoted in the media.
Like all assets, supply and demand are the key drivers of WTI Oil price. As such, global growth can be a driver of increased demand and vice versa for weak global growth. Political instability, wars, and sanctions can disrupt supply and impact prices. The decisions of OPEC, a group of major Oil-producing countries, is another key driver of price. The value of the US Dollar influences the price of WTI Crude Oil, since Oil is predominantly traded in US Dollars, thus a weaker US Dollar can make Oil more affordable and vice versa.
The weekly Oil inventory reports published by the American Petroleum Institute (API) and the Energy Information Agency (EIA) impact the price of WTI Oil. Changes in inventories reflect fluctuating supply and demand. If the data shows a drop in inventories it can indicate increased demand, pushing up Oil price. Higher inventories can reflect increased supply, pushing down prices. API’s report is published every Tuesday and EIA’s the day after. Their results are usually similar, falling within 1% of each other 75% of the time. The EIA data is considered more reliable, since it is a government agency.
OPEC (Organization of the Petroleum Exporting Countries) is a group of 12 Oil-producing nations who collectively decide production quotas for member countries at twice-yearly meetings. Their decisions often impact WTI Oil prices. When OPEC decides to lower quotas, it can tighten supply, pushing up Oil prices. When OPEC increases production, it has the opposite effect. OPEC+ refers to an expanded group that includes ten extra non-OPEC members, the most notable of which is Russia.
-
02:51
AUD/JPY drops to near 95.50 as Australia's trade surplus shrinks to a three-month low
- AUD/JPY loses ground as Australia's trade surplus fell to 5,085M in December, the smallest balance since last September.
- The AUD faces challenges amid increased dovish sentiment surrounding the RBA’s upcoming policy decision.
- The Japanese Yen gains strength as solid wage and services data boost expectations of a more hawkish BoJ.
AUD/JPY extends its losses for the second successive day, trading around 95.60 during the Asian hours on Thursday. This decline of the cross is attributed to the subdued Australian Dollar (AUD) following the lower-than-expected Trade Balance data release.
Australia's trade surplus fell to 5,085M in December, missing the expected 7,000M and down from the previous surplus of 6,792M. This was the smallest balance since last September. Exports increased by 1.1% MoM, slowing from November's 4.2% rise, while imports surged 5.9% MoM, up from 1.4% in the prior month.
The weaker trade balance data in Australia bolsters the dovish sentiment surrounding the upcoming Reserve Bank of Australia’s (RBA) policy decision. The central bank is widely anticipated to deliver a rate cut in February. The RBA has maintained the Official Cash Rate (OCR) at 4.35% since November 2023, emphasizing that inflation must “sustainably” return to its 2%-3% target range before any policy easing.
Additionally, the AUD/JPY cross receives downward pressure from risk-off sentiment amid rising fears over US-China trade tensions. China, Australia’s key trading partner, retaliated against the new 10% US tariff that took effect on Tuesday. However, Trump stated on Monday afternoon that he would likely speak with China within the next 24 hours. He also warned, "If we can't reach a deal with China, the tariffs will be very, very substantial."
The Japanese Yen (JPY) strengthens against its peers as robust wage and services data fuel expectations of a more hawkish Bank of Japan (BoJ). Data showed that real wages in Japan increased for the second straight month in December, while nominal wage growth reached its highest level in nearly three decades.
Japan's Finance Minister, Katsunobu Kato, told parliament on Thursday that deflation has not yet ended. Kato also noted ongoing inflationary conditions as prices continue to rise.
Société Générale's FX analysts noted that the Japanese Yen is outperforming, while 10-year JGB yields have risen to nearly 1.30%, the highest level since April 2011. However, with the BoJ policy rate expected to peak around 1.00% over the next two years, the upside for both JPY and JGB yields remains limited.
Economic Indicator
Trade Balance (MoM)
The trade balance released by the Australian Bureau of Statistics is the difference in the value of its imports and exports of Australian goods. Export data can give an important reflection of Australian growth, while imports provide an indication of domestic demand. Trade Balance gives an early indication of the net export performance. If a steady demand in exchange for Australian exports is seen, that would turn into a positive growth in the trade balance, and that should be positive for the AUD.
Read more.Last release: Thu Feb 06, 2025 00:30
Frequency: Monthly
Actual: 5,085M
Consensus: 7,000M
Previous: 7,079M
Source: Australian Bureau of Statistics
-
02:48
BoJ's Tamura suggests gradual rate hike in a timely manner
The Bank of Japan (BoJ) board member Naoki Tamura on Thursday suggested a gradual rate hike in a timely manner. Tamura added that the central bank to raise rates to approximately 1% by the latter half of fiscal 2025.
Key quotes
Suggests gradual rate hike in a timely manner.
Worried about potential negative impact of high rice prices and prolonged inflation over 2% for almost three years on consumption.
A 0.75% rate would still be negative in real terms.
No preconception on impact of rate hike.
Supply constraints putting upward pressure on prices, output gap may already be positive.
Corporate and household inflation expectations increasing, reach approximately 2% levels.
Building upward price risks.
Expects interest rate to stay at 1% in second half of FY 2025.
Believes interest rates should be raised to achieve a nominal neutral level of at least 1%.
Personally don't think we can say BOJ's past massive monetary easing had a positive effect as a whole given strong side-effects.
Must scrutinise whether prolonged monetary easing could cause problems such as excessive yen falls and housing price spikes.Market reaction
At the press time, the USD/JPY pair is down 0.49% on the day to trade at 151.94.
Bank of Japan FAQs
The Bank of Japan (BoJ) is the Japanese central bank, which sets monetary policy in the country. Its mandate is to issue banknotes and carry out currency and monetary control to ensure price stability, which means an inflation target of around 2%.
The Bank of Japan embarked in an ultra-loose monetary policy in 2013 in order to stimulate the economy and fuel inflation amid a low-inflationary environment. The bank’s policy is based on Quantitative and Qualitative Easing (QQE), or printing notes to buy assets such as government or corporate bonds to provide liquidity. In 2016, the bank doubled down on its strategy and further loosened policy by first introducing negative interest rates and then directly controlling the yield of its 10-year government bonds. In March 2024, the BoJ lifted interest rates, effectively retreating from the ultra-loose monetary policy stance.
The Bank’s massive stimulus caused the Yen to depreciate against its main currency peers. This process exacerbated in 2022 and 2023 due to an increasing policy divergence between the Bank of Japan and other main central banks, which opted to increase interest rates sharply to fight decades-high levels of inflation. The BoJ’s policy led to a widening differential with other currencies, dragging down the value of the Yen. This trend partly reversed in 2024, when the BoJ decided to abandon its ultra-loose policy stance.
A weaker Yen and the spike in global energy prices led to an increase in Japanese inflation, which exceeded the BoJ’s 2% target. The prospect of rising salaries in the country – a key element fuelling inflation – also contributed to the move.
-
02:24
Fed's Jefferson: Happy to keep Fed Funds on hold at current rate
Federal Reserve Vice Chair Philip Jefferson said on Thursday that he is happy to keep the Fed Funds on hold at the current level, adding that he will wait to see the net effect of Trump policies.
Key quotes
Waits to see net effect of Trump policies.
Examining overall impact of Trump administration on policy goals needed.
Opts to maintain current interest rates for the time being.
Content with current policy level until totality of impacts better understood.
Sees Fed's ability to be patient with the economy in a good place.
Fed's rate still restrictive even with 100 bp drop.
Policy rate remains restrictive for the economy.Market reaction
The US Dollar Index (DXY) is trading unchanged on the day at 107.60, as of writing.
-
02:15
PBOC sets USD/CNY reference rate at 7.1691 vs. 7.1693 previous
The People’s Bank of China (PBOC) set the USD/CNY central rate for the trading session ahead on Thursday at 7.1691 as compared to the previous day's fix of 7.1693 and 7.2535 Reuters estimates.
PBOC FAQs
The primary monetary policy objectives of the People's Bank of China (PBoC) are to safeguard price stability, including exchange rate stability, and promote economic growth. China’s central bank also aims to implement financial reforms, such as opening and developing the financial market.
The PBoC is owned by the state of the People's Republic of China (PRC), so it is not considered an autonomous institution. The Chinese Communist Party (CCP) Committee Secretary, nominated by the Chairman of the State Council, has a key influence on the PBoC’s management and direction, not the governor. However, Mr. Pan Gongsheng currently holds both of these posts.
Unlike the Western economies, the PBoC uses a broader set of monetary policy instruments to achieve its objectives. The primary tools include a seven-day Reverse Repo Rate (RRR), Medium-term Lending Facility (MLF), foreign exchange interventions and Reserve Requirement Ratio (RRR). However, The Loan Prime Rate (LPR) is China’s benchmark interest rate. Changes to the LPR directly influence the rates that need to be paid in the market for loans and mortgages and the interest paid on savings. By changing the LPR, China’s central bank can also influence the exchange rates of the Chinese Renminbi.
Yes, China has 19 private banks – a small fraction of the financial system. The largest private banks are digital lenders WeBank and MYbank, which are backed by tech giants Tencent and Ant Group, per The Straits Times. In 2014, China allowed domestic lenders fully capitalized by private funds to operate in the state-dominated financial sector.
-
02:10
Japan's Kato sees inflation pressure continuing to rise
Japan's Finance Minister, Katsunobu Kato, said on Thursday that the end of deflation has not yet been achieved. Kato further stated that he sees inflationary conditions as prices continue to rise.
Market reaction
At the press time, the USD/JPY pair is down 0.24% on the day to trade at 152.32.
Japanese Yen FAQs
The Japanese Yen (JPY) is one of the world’s most traded currencies. Its value is broadly determined by the performance of the Japanese economy, but more specifically by the Bank of Japan’s policy, the differential between Japanese and US bond yields, or risk sentiment among traders, among other factors.
One of the Bank of Japan’s mandates is currency control, so its moves are key for the Yen. The BoJ has directly intervened in currency markets sometimes, generally to lower the value of the Yen, although it refrains from doing it often due to political concerns of its main trading partners. The BoJ ultra-loose monetary policy between 2013 and 2024 caused the Yen to depreciate against its main currency peers due to an increasing policy divergence between the Bank of Japan and other main central banks. More recently, the gradually unwinding of this ultra-loose policy has given some support to the Yen.
Over the last decade, the BoJ’s stance of sticking to ultra-loose monetary policy has led to a widening policy divergence with other central banks, particularly with the US Federal Reserve. This supported a widening of the differential between the 10-year US and Japanese bonds, which favored the US Dollar against the Japanese Yen. The BoJ decision in 2024 to gradually abandon the ultra-loose policy, coupled with interest-rate cuts in other major central banks, is narrowing this differential.
The Japanese Yen is often seen as a safe-haven investment. This means that in times of market stress, investors are more likely to put their money in the Japanese currency due to its supposed reliability and stability. Turbulent times are likely to strengthen the Yen’s value against other currencies seen as more risky to invest in.
-
02:01
Australian Dollar remains subdued following Trade Balance data
- The Australian Dollar holds losses after the release of lower-than-expected Trade Balance data.
- Australia's trade surplus dropped to 5,085M in December, below the expected 7,000M and down from the 6,792M prior.
- The US Dollar faced challenges as the ISM Services PMI eased in January.
The Australian Dollar (AUD) edges lower against the US Dollar (USD) following lower-than-expected Trade Balance data released on Thursday. Additionally, the AUD/USD pair receives downward pressure from risk-off sentiment amid rising fears over US-China trade tensions.
Australia's trade surplus fell to 5,085M in December, missing the expected 7,000M and down from the previous surplus of 6,792M. Exports increased by 1.1% MoM, slowing from November's 4.2% rise, while imports surged 5.9% MoM, up from 1.4% in the prior month.
Traders closely watch the ongoing trade war between the United States (US) and China, Australia’s key trading partner. China retaliated against the new 10% US tariff that took effect on Tuesday. However, Trump stated on Monday afternoon that he would likely speak with China within the next 24 hours. He also warned, "If we can't reach a deal with China, the tariffs will be very, very substantial."
Australian Dollar receives downward pressure from rising US-China trade tensions
- The US Dollar Index (DXY), which measures the US Dollar’s value against six major currencies, remains under subdued near 107.50 at the time of writing. The weaker US Services Purchasing Manager Index (PMI) could have weighed on the Greenback.
- The US ISM Services PMI eased to 52.8 in January from 54.0 (revised from 54.1) in December. This reading came in below the market consensus of 54.3.
- Traders brace for Friday’s US Nonfarm Payrolls (NFP) data, which is expected to shape the Federal Reserve’s (Fed) monetary policy direction.
- President Trump has agreed to a 30-day suspension of the proposed 25% tariffs on Canadian and Mexican imports. This decision comes after Canadian Prime Minister Justin Trudeau and Mexican President Claudia Sheinbaum committed to enhancing border security measures to address concerns over illegal immigration and drug trafficking.
- China’s Commerce Ministry announced that it will impose a 15% tariff on US coal and liquefied natural gas (LNG) imports, along with an additional 10% tariff on crude Oil, farm equipment, and certain automobiles. Additionally, to "safeguard national security interests," China is implementing export controls on tungsten, tellurium, ruthenium, molybdenum, and related products.
- According to the Financial Times, Chinese exporters are intensifying their efforts to offshore production in response to Trump’s tariffs. Manufacturers in China are accelerating plans to relocate production to other countries, including the Middle East, to avoid US tariffs. Other tactics being considered include passing the increased costs onto US consumers and exploring alternative markets.
- JOLTS Job Openings fell to 7.6 million in December, missing the 8 million consensus estimate. The US labor market remains stable with total separations little changed at 5.3 million in December.
- San Francisco Fed Bank President Mary Daly stated on Tuesday that the central bank remains in a wait-and-see stance, emphasizing the impact of economic uncertainty on policymaking. While the economy is performing well and maintaining momentum, uncertainty persists. As a result, the Fed has the flexibility to carefully assess data before making policy adjustments.
- Australia’s Judo Bank Composite PMI climbed to 51.1 in January from 50.2 in December, reflecting modest growth in private sector activity. Meanwhile, the Judo Bank Services PMI rose to 51.2 from 50.8, marking the twelfth consecutive month of expansion in the services sector. Although growth was moderate, it was the strongest since August.
Australian Dollar pulls back from 0.6300, support appears at nine-day EMA
The AUD/USD pair trades near 0.6280 on Thursday. Sustained price action above the nine- and 14-day Exponential Moving Averages (EMAs) on the daily chart indicates a stronger short-term bullish momentum. Additionally, the 14-day Relative Strength Index (RSI) is positioned above the 50 level, confirming a stronger bullish trend.
On the upside, the AUD/USD pair could explore the area around its seven-week high at 0.6330 level, which was recorded on January 24.
The AUD/USD pair may find immediate support at the nine-day EMA near 0.6254, followed by the 14-day EMA at 0.6249 level. A break below these EMAs could weaken the bullish bias, potentially driving the pair toward 0.6087, the lowest level since April 2020, which was recorded on February 3.
AUD/USD: Daily Chart
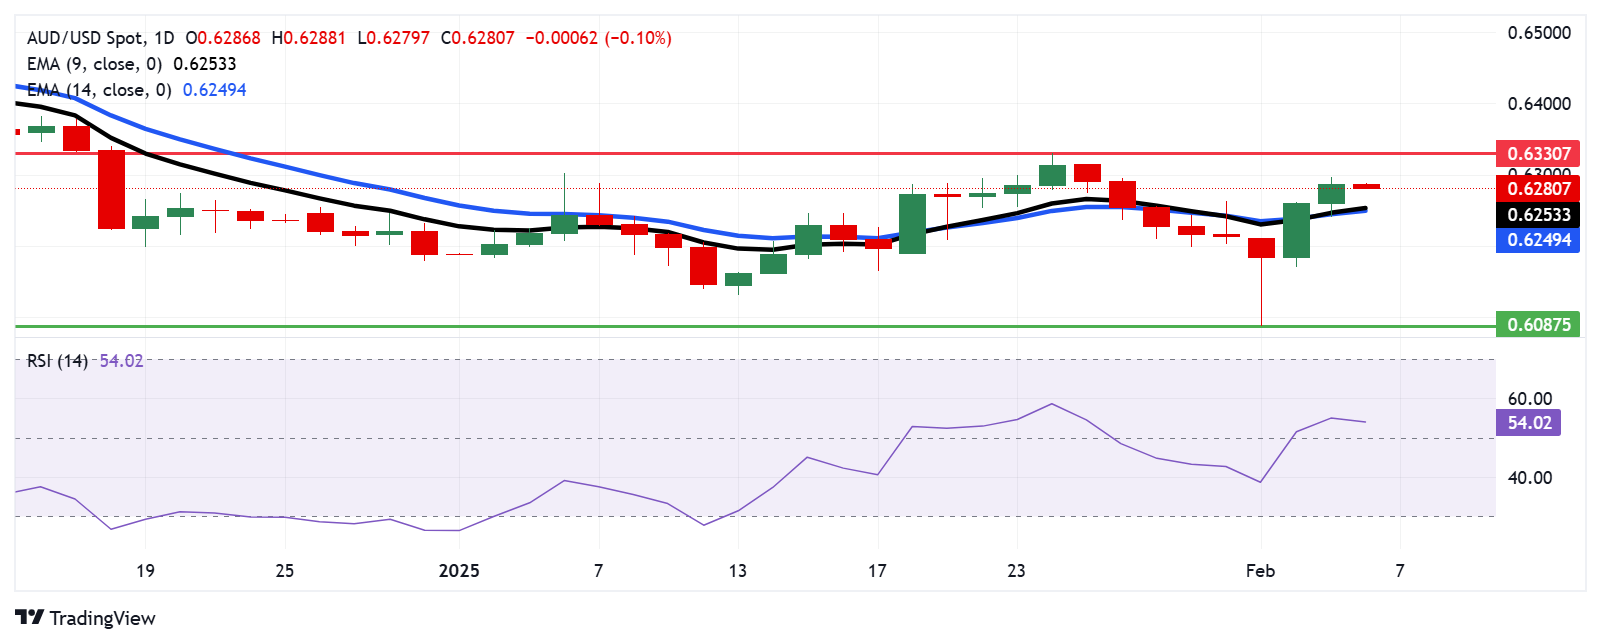
Australian Dollar PRICE Today
The table below shows the percentage change of Australian Dollar (AUD) against listed major currencies today. Australian Dollar was the weakest against the Japanese Yen.
USD EUR GBP JPY CAD AUD NZD CHF USD 0.07% -0.01% -0.23% 0.05% 0.10% 0.05% 0.03% EUR -0.07% -0.08% -0.30% -0.01% 0.03% -0.01% -0.06% GBP 0.01% 0.08% -0.25% 0.07% 0.11% 0.07% 0.04% JPY 0.23% 0.30% 0.25% 0.30% 0.34% 0.26% 0.27% CAD -0.05% 0.00% -0.07% -0.30% 0.05% -0.00% -0.02% AUD -0.10% -0.03% -0.11% -0.34% -0.05% -0.04% -0.09% NZD -0.05% 0.01% -0.07% -0.26% 0.00% 0.04% -0.02% CHF -0.03% 0.06% -0.04% -0.27% 0.02% 0.09% 0.02% The heat map shows percentage changes of major currencies against each other. The base currency is picked from the left column, while the quote currency is picked from the top row. For example, if you pick the Australian Dollar from the left column and move along the horizontal line to the US Dollar, the percentage change displayed in the box will represent AUD (base)/USD (quote).
Australian Dollar FAQs
One of the most significant factors for the Australian Dollar (AUD) is the level of interest rates set by the Reserve Bank of Australia (RBA). Because Australia is a resource-rich country another key driver is the price of its biggest export, Iron Ore. The health of the Chinese economy, its largest trading partner, is a factor, as well as inflation in Australia, its growth rate and Trade Balance. Market sentiment – whether investors are taking on more risky assets (risk-on) or seeking safe-havens (risk-off) – is also a factor, with risk-on positive for AUD.
The Reserve Bank of Australia (RBA) influences the Australian Dollar (AUD) by setting the level of interest rates that Australian banks can lend to each other. This influences the level of interest rates in the economy as a whole. The main goal of the RBA is to maintain a stable inflation rate of 2-3% by adjusting interest rates up or down. Relatively high interest rates compared to other major central banks support the AUD, and the opposite for relatively low. The RBA can also use quantitative easing and tightening to influence credit conditions, with the former AUD-negative and the latter AUD-positive.
China is Australia’s largest trading partner so the health of the Chinese economy is a major influence on the value of the Australian Dollar (AUD). When the Chinese economy is doing well it purchases more raw materials, goods and services from Australia, lifting demand for the AUD, and pushing up its value. The opposite is the case when the Chinese economy is not growing as fast as expected. Positive or negative surprises in Chinese growth data, therefore, often have a direct impact on the Australian Dollar and its pairs.
Iron Ore is Australia’s largest export, accounting for $118 billion a year according to data from 2021, with China as its primary destination. The price of Iron Ore, therefore, can be a driver of the Australian Dollar. Generally, if the price of Iron Ore rises, AUD also goes up, as aggregate demand for the currency increases. The opposite is the case if the price of Iron Ore falls. Higher Iron Ore prices also tend to result in a greater likelihood of a positive Trade Balance for Australia, which is also positive of the AUD.
The Trade Balance, which is the difference between what a country earns from its exports versus what it pays for its imports, is another factor that can influence the value of the Australian Dollar. If Australia produces highly sought after exports, then its currency will gain in value purely from the surplus demand created from foreign buyers seeking to purchase its exports versus what it spends to purchase imports. Therefore, a positive net Trade Balance strengthens the AUD, with the opposite effect if the Trade Balance is negative.
-
02:01
Ireland Purchasing Manager Index Services down to 53.4 in January from previous 57.1
-
01:59
Australia National Australia Bank's Business Confidence (QoQ) up to -4 in 4Q from previous -6
-
01:59
Australia National Australia Bank's Business Confidence (QoQ) up to -4 in 4Q from previous -6
-
01:35
Australia’s Trade Surplus decreases to 5,085M MoM in December vs. 7,000M expected
Australia’s trade surplus decreased to 5,085M MoM in December versus 7,000M expected and 6,792M (revised from 7,079M) in the previous reading, according to the latest foreign trade data published by the Australian Bureau of Statistics on Thursday.
Further details reveal that Australia's Exports rose by 1.1% MoM in December from 4.2% (revised from 4.8%) seen a month earlier. Meanwhile, Imports climbed by 5.9% MoM in December, compared to 1.4% (revised from 1.7%) seen in November.
Market reaction to Australia’s Trade Balance
At the press time, the AUD/USD pair is down 0.08% on the day to trade at 0.6281.
Australian Dollar FAQs
One of the most significant factors for the Australian Dollar (AUD) is the level of interest rates set by the Reserve Bank of Australia (RBA). Because Australia is a resource-rich country another key driver is the price of its biggest export, Iron Ore. The health of the Chinese economy, its largest trading partner, is a factor, as well as inflation in Australia, its growth rate and Trade Balance. Market sentiment – whether investors are taking on more risky assets (risk-on) or seeking safe-havens (risk-off) – is also a factor, with risk-on positive for AUD.
The Reserve Bank of Australia (RBA) influences the Australian Dollar (AUD) by setting the level of interest rates that Australian banks can lend to each other. This influences the level of interest rates in the economy as a whole. The main goal of the RBA is to maintain a stable inflation rate of 2-3% by adjusting interest rates up or down. Relatively high interest rates compared to other major central banks support the AUD, and the opposite for relatively low. The RBA can also use quantitative easing and tightening to influence credit conditions, with the former AUD-negative and the latter AUD-positive.
China is Australia’s largest trading partner so the health of the Chinese economy is a major influence on the value of the Australian Dollar (AUD). When the Chinese economy is doing well it purchases more raw materials, goods and services from Australia, lifting demand for the AUD, and pushing up its value. The opposite is the case when the Chinese economy is not growing as fast as expected. Positive or negative surprises in Chinese growth data, therefore, often have a direct impact on the Australian Dollar and its pairs.
Iron Ore is Australia’s largest export, accounting for $118 billion a year according to data from 2021, with China as its primary destination. The price of Iron Ore, therefore, can be a driver of the Australian Dollar. Generally, if the price of Iron Ore rises, AUD also goes up, as aggregate demand for the currency increases. The opposite is the case if the price of Iron Ore falls. Higher Iron Ore prices also tend to result in a greater likelihood of a positive Trade Balance for Australia, which is also positive of the AUD.
The Trade Balance, which is the difference between what a country earns from its exports versus what it pays for its imports, is another factor that can influence the value of the Australian Dollar. If Australia produces highly sought after exports, then its currency will gain in value purely from the surplus demand created from foreign buyers seeking to purchase its exports versus what it spends to purchase imports. Therefore, a positive net Trade Balance strengthens the AUD, with the opposite effect if the Trade Balance is negative.
-
01:31
Australia Exports (MoM) down to 1.1% in December from previous 4.8%
-
01:31
Australia Exports (MoM) down to 1.1% in December from previous 4.8%
-
01:31
Australia Imports (MoM) increased to 5.9% in December from previous 1.7%
-
01:31
Australia Imports (MoM) increased to 5.9% in December from previous 1.7%
-
01:30
Australia Trade Balance (MoM) below expectations (7000M) in December: Actual (5085M)
-
01:30
Australia Trade Balance (MoM) below expectations (7000M) in December: Actual (5085M)
-
01:30
Stocks. Daily history for Wednesday, February 5, 2025
Index Change, points Closed Change, % NIKKEI 225 33.11 38831.48 0.09 Hang Seng -192.87 20597.09 -0.93 KOSPI 27.58 2509.27 1.11 ASX 200 42.9 8416.9 0.51 DAX 80.23 21585.93 0.37 CAC 40 -14.72 7891.68 -0.19 Dow Jones 317.24 44873.28 0.71 S&P 500 23.6 6061.48 0.39 NASDAQ Composite 38.31 19692.33 0.19 -
01:16
NZD/USD gains ground to near 0.5700 on weaker US PMI data
- NZD/USD posts modest gains around 0.5690 in Thursday’s early Asian session.
- US ISM Services PMI came in weaker-than-expected in January, declining to 52.8 vs. 54.3 expected.
- The RBNZ dovish bets and concerns about the US-China renewed trade war could undermine the China-proxy Kiwi.
The NZD/USD pair trades with mild gains around 0.5690 during the early Asian session on Thursday. The downbeat US economic data drag the Greenback lower against the New Zealand Dollar (NZD). Investors will closely watch the developments surrounding the renewed trade war between the United States and China, the world’s two largest economies.
The weaker US Services Purchasing Manager Index (PMI) could weigh on the Greenback and create a tailwind for the pair. The US ISM Services PMI eased to 52.8 in January from 54.0 (revised from 54.1) in December. This reading came in below the market consensus of 54.3.
On the other hand, the New Zealand employment data for the fourth quarter (Q4) will keep the RBNZ on track to cut the Official Cash Rate (OCR) by 50 basis points (bps) to 3.75% this month. Data released by Statistics New Zealand on Wednesday revealed that the country’s Unemployment Rate rose to 5.1% in Q4 versus 4.8% prior. This figure registered a four-year high and was above the 25-year average of 4.8%. The rising bets that the Reserve Bank of New Zealand (RBNZ) will cut the interest rates might further weigh on the New Zealand Dollar (NZD).
"In line with RBNZ guidance, markets continue to imply another 50bps rate cut to 3.75% at the February 19 meeting and the policy rate to through around 3.00% over the next 12 months. Bottom line: NZ-US 2-year bond yield spreads can further weigh on NZD/USD,” noted Société Générale's FX analysts.
On Tuesday, China's finance ministry announced a package of tariffs on a range of US products, including crude oil, farm equipment, and some autos in an immediate response to a 10% tariff on Chinese imports announced by US President Donald Trump. Additionally, China put several companies, including Google, on notice for possible sanctions, in a measured response to Trump's tariffs. Any signs of uncertainty or escalating trade war tension could drag the China-proxy Kiwi lower as China is a major trading partner to New Zealand.New Zealand Dollar FAQs
The New Zealand Dollar (NZD), also known as the Kiwi, is a well-known traded currency among investors. Its value is broadly determined by the health of the New Zealand economy and the country’s central bank policy. Still, there are some unique particularities that also can make NZD move. The performance of the Chinese economy tends to move the Kiwi because China is New Zealand’s biggest trading partner. Bad news for the Chinese economy likely means less New Zealand exports to the country, hitting the economy and thus its currency. Another factor moving NZD is dairy prices as the dairy industry is New Zealand’s main export. High dairy prices boost export income, contributing positively to the economy and thus to the NZD.
The Reserve Bank of New Zealand (RBNZ) aims to achieve and maintain an inflation rate between 1% and 3% over the medium term, with a focus to keep it near the 2% mid-point. To this end, the bank sets an appropriate level of interest rates. When inflation is too high, the RBNZ will increase interest rates to cool the economy, but the move will also make bond yields higher, increasing investors’ appeal to invest in the country and thus boosting NZD. On the contrary, lower interest rates tend to weaken NZD. The so-called rate differential, or how rates in New Zealand are or are expected to be compared to the ones set by the US Federal Reserve, can also play a key role in moving the NZD/USD pair.
Macroeconomic data releases in New Zealand are key to assess the state of the economy and can impact the New Zealand Dollar’s (NZD) valuation. A strong economy, based on high economic growth, low unemployment and high confidence is good for NZD. High economic growth attracts foreign investment and may encourage the Reserve Bank of New Zealand to increase interest rates, if this economic strength comes together with elevated inflation. Conversely, if economic data is weak, NZD is likely to depreciate.
The New Zealand Dollar (NZD) tends to strengthen during risk-on periods, or when investors perceive that broader market risks are low and are optimistic about growth. This tends to lead to a more favorable outlook for commodities and so-called ‘commodity currencies’ such as the Kiwi. Conversely, NZD tends to weaken at times of market turbulence or economic uncertainty as investors tend to sell higher-risk assets and flee to the more-stable safe havens.
-
01:15
Currencies. Daily history for Wednesday, February 5, 2025
Pare Closed Change, % AUDUSD 0.62845 0.56 EURJPY 158.711 -0.89 EURUSD 1.03985 0.22 GBPJPY 190.798 -0.91 GBPUSD 1.25021 0.21 NZDUSD 0.56861 0.66 USDCAD 1.43169 -0.03 USDCHF 0.90174 -0.31 USDJPY 152.611 -1.11 -
00:50
Japan Foreign Investment in Japan Stocks dipped from previous ¥753B to ¥-315.2B in January 31
-
00:36
EUR/USD stuck on familiar technical levels during midweek lull
- EUR/USD remains hampered by 1.0400 key handle on Wednesday.
- Overall market sentiment is keeping the Greenback underbid.
- European Retail Sales due Thursday, US NFP coming Friday.
EUR/USD dragged its feet on Wednesday, finding some topside bidding action as a broad-market recovery in risk appetite keeps bids behind the US Dollar under pressure. The Euro is struggling to find its feet after snapping a six-day losing streak, and EUR/USD remains hobbled by the 1.0400 handle.
US ADP Employment Change figures showed stronger-than-expected results in January, with a net increase of 183K in payrolls, surpassing the anticipated drop to 150K from December’s revised figure of 176K. Although ADP job figures are an unreliable predictor of US Nonfarm Payrolls (NFP) expected at the end of the week, the increase is boosting investor confidence that the US economy remains on solid ground.
Pan-European Retail Sales figures from December are due early Thursday. Median market forecasts expect an upswing to 1.9% YoY compared to the previous period’s 1.2%. However, December’s MoM figure is expected to swing lower to -0.1% from 0.1%.
This week, the most important data release will be the US Nonfarm Payrolls (NFP) jobs report on Friday. Investors anticipate a decrease in January’s NFP figure to 170K from December’s 256K. Traders will also monitor revisions from prior months closely. Those expecting rate cuts have grown increasingly frustrated with the persistent strength of the US economy, as labor statistics often receive upward revisions afterward.
EUR/USD price forecast
EUR/USD kicked off the midweek market session with a bullish tilt, but tepid price action saw the pair flub the 1.0450 level with the 50-day Exponential Moving Average (EMA) weighing on intraday bids from 1.0445. Momentum is drying up ahead of key data prints, though Fiber has managed to recover from the early week’s plunge toward the 1.0200 handle.
EUR/USD daily chart

Euro FAQs
The Euro is the currency for the 19 European Union countries that belong to the Eurozone. It is the second most heavily traded currency in the world behind the US Dollar. In 2022, it accounted for 31% of all foreign exchange transactions, with an average daily turnover of over $2.2 trillion a day. EUR/USD is the most heavily traded currency pair in the world, accounting for an estimated 30% off all transactions, followed by EUR/JPY (4%), EUR/GBP (3%) and EUR/AUD (2%).
The European Central Bank (ECB) in Frankfurt, Germany, is the reserve bank for the Eurozone. The ECB sets interest rates and manages monetary policy. The ECB’s primary mandate is to maintain price stability, which means either controlling inflation or stimulating growth. Its primary tool is the raising or lowering of interest rates. Relatively high interest rates – or the expectation of higher rates – will usually benefit the Euro and vice versa. The ECB Governing Council makes monetary policy decisions at meetings held eight times a year. Decisions are made by heads of the Eurozone national banks and six permanent members, including the President of the ECB, Christine Lagarde.
Eurozone inflation data, measured by the Harmonized Index of Consumer Prices (HICP), is an important econometric for the Euro. If inflation rises more than expected, especially if above the ECB’s 2% target, it obliges the ECB to raise interest rates to bring it back under control. Relatively high interest rates compared to its counterparts will usually benefit the Euro, as it makes the region more attractive as a place for global investors to park their money.
Data releases gauge the health of the economy and can impact on the Euro. Indicators such as GDP, Manufacturing and Services PMIs, employment, and consumer sentiment surveys can all influence the direction of the single currency. A strong economy is good for the Euro. Not only does it attract more foreign investment but it may encourage the ECB to put up interest rates, which will directly strengthen the Euro. Otherwise, if economic data is weak, the Euro is likely to fall. Economic data for the four largest economies in the euro area (Germany, France, Italy and Spain) are especially significant, as they account for 75% of the Eurozone’s economy.
Another significant data release for the Euro is the Trade Balance. This indicator measures the difference between what a country earns from its exports and what it spends on imports over a given period. If a country produces highly sought after exports then its currency will gain in value purely from the extra demand created from foreign buyers seeking to purchase these goods. Therefore, a positive net Trade Balance strengthens a currency and vice versa for a negative balance.
-
00:17
GBP/USD cautiously bullish ahead of BoE rate call
- GBP/USD explored the high side on Wednesday but with little momentum.
- The pair remains constrained by key technical averages.
- BoE rate call due on Thursday, US NFP slated for Friday.
GBP/USD found some bidding action amid a broad-market easing in the Greenback. Market sentiment is drifting into the high end as investors recover from the early week’s trade war fears, and Cable traders are buckling down for the wait to the Bank of England’s (BoE) latest rate call.
US ADP Employment Change figures came in stronger than expected in January, showing a net increase of 183K in payrolls, beating the expected fall to 150K from December’s revised print of 176K. ADP job figures are a shaky forecast of US Nonfarm Payrolls (NFP) due at the end of the week, but the upswing is adding to investor confidence that the US economy remains on firm footing.
The BoE is widely expected to cut interest rates by 25 bps on Thursday. Median market forecasts expect the BoE’s Monetary Policy Committee (MPC) to vote eight-to-one to reduce interest rates to 4.5% from 4.75%, with the lone holdout expected to vote to keep interest rates steady for another meeting.
The key data print this week will be US NFP jobs additions on Friday. Investors expect January’s NFP print to ease to 170K from December’s print of 256K. Traders will also be keeping a close eye on revisions to previous months. Market participants hoping for rate cuts have been increasingly frustrated by the latent strength of the US economy, with labor figures routinely getting revised higher after the fact.
GBP/USD price forecast
Cable sprung higher on Wednesday, tapping a fresh three-week high of 1.2550, but price action was squeezed back to the middle. GBP/USD is getting hung up on the 50-day Exponential Moving Average (EMA) near the 1.2500 handle.
GBP/USD daily chart
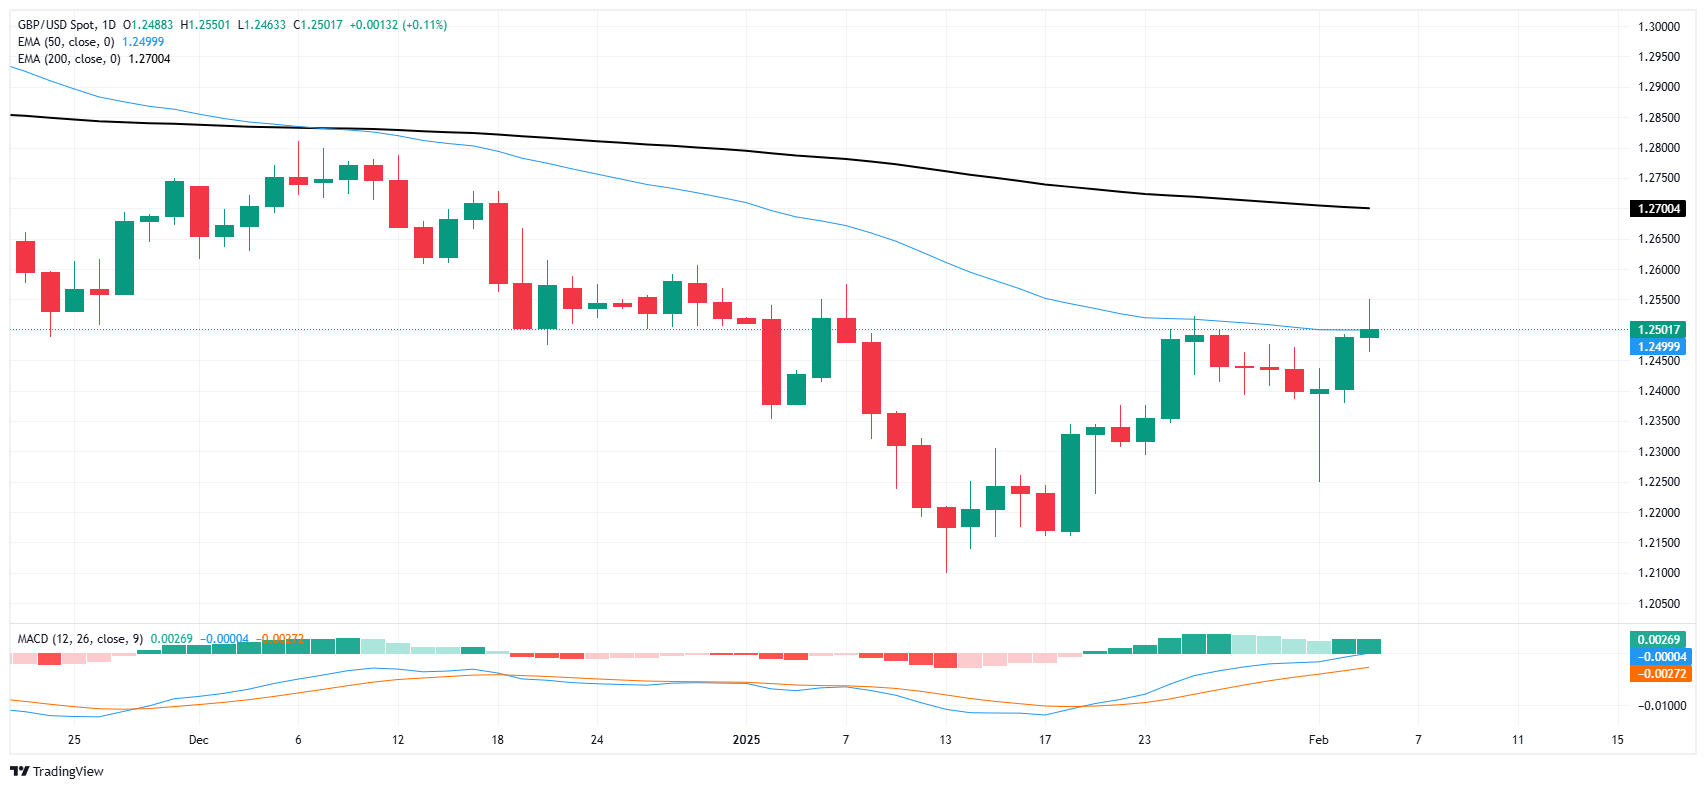
Pound Sterling FAQs
The Pound Sterling (GBP) is the oldest currency in the world (886 AD) and the official currency of the United Kingdom. It is the fourth most traded unit for foreign exchange (FX) in the world, accounting for 12% of all transactions, averaging $630 billion a day, according to 2022 data. Its key trading pairs are GBP/USD, also known as ‘Cable’, which accounts for 11% of FX, GBP/JPY, or the ‘Dragon’ as it is known by traders (3%), and EUR/GBP (2%). The Pound Sterling is issued by the Bank of England (BoE).
The single most important factor influencing the value of the Pound Sterling is monetary policy decided by the Bank of England. The BoE bases its decisions on whether it has achieved its primary goal of “price stability” – a steady inflation rate of around 2%. Its primary tool for achieving this is the adjustment of interest rates. When inflation is too high, the BoE will try to rein it in by raising interest rates, making it more expensive for people and businesses to access credit. This is generally positive for GBP, as higher interest rates make the UK a more attractive place for global investors to park their money. When inflation falls too low it is a sign economic growth is slowing. In this scenario, the BoE will consider lowering interest rates to cheapen credit so businesses will borrow more to invest in growth-generating projects.
Data releases gauge the health of the economy and can impact the value of the Pound Sterling. Indicators such as GDP, Manufacturing and Services PMIs, and employment can all influence the direction of the GBP. A strong economy is good for Sterling. Not only does it attract more foreign investment but it may encourage the BoE to put up interest rates, which will directly strengthen GBP. Otherwise, if economic data is weak, the Pound Sterling is likely to fall.
Another significant data release for the Pound Sterling is the Trade Balance. This indicator measures the difference between what a country earns from its exports and what it spends on imports over a given period. If a country produces highly sought-after exports, its currency will benefit purely from the extra demand created from foreign buyers seeking to purchase these goods. Therefore, a positive net Trade Balance strengthens a currency and vice versa for a negative balance.
-
00:16
China initiates WTO complaint regarding new US tariffs
China initiated a World Trade Organization (WTO) over the new tariffs imposed by the United States on goods from China, the WTO said on Wednesday.
"China has requested WTO dispute consultations with the United States in regard to new tariff measures applied by the United States on goods originating in China," the organization noted in a statement.
The Trump administration's new 10% tariffs on all Chinese imports took effect on Tuesday. China reacted by imposing 15% tariffs on imports of liquefied natural gas (LNG) and coal from the United States.Market reaction
At the press time, AUD/USD is down 0.05% on the day to trade at 0.6283.
US-China Trade War FAQs
Generally speaking, a trade war is an economic conflict between two or more countries due to extreme protectionism on one end. It implies the creation of trade barriers, such as tariffs, which result in counter-barriers, escalating import costs, and hence the cost of living.
An economic conflict between the United States (US) and China began early in 2018, when President Donald Trump set trade barriers on China, claiming unfair commercial practices and intellectual property theft from the Asian giant. China took retaliatory action, imposing tariffs on multiple US goods, such as automobiles and soybeans. Tensions escalated until the two countries signed the US-China Phase One trade deal in January 2020. The agreement required structural reforms and other changes to China’s economic and trade regime and pretended to restore stability and trust between the two nations. However, the Coronavirus pandemic took the focus out of the conflict. Yet, it is worth mentioning that President Joe Biden, who took office after Trump, kept tariffs in place and even added some additional levies.
The return of Donald Trump to the White House as the 47th US President has sparked a fresh wave of tensions between the two countries. During the 2024 election campaign, Trump pledged to impose 60% tariffs on China once he returned to office, which he did on January 20, 2025. With Trump back, the US-China trade war is meant to resume where it was left, with tit-for-tat policies affecting the global economic landscape amid disruptions in global supply chains, resulting in a reduction in spending, particularly investment, and directly feeding into the Consumer Price Index inflation.
-
00:00
South Korea Current Account Balance increased to 12.37B in December from previous 9.3B
-
