Noticias del mercado
-
22:56
AUD/JPY Price Analysis: Bears extend control, but downside momentum weakens
- AUD/JPY moved lower ahead of the Asian session, extending its losing streak to two days and trading near the 93.00 area.
- Selling momentum appears to be fading, with technical indicators suggesting that bulls might attempt a rebound or initiate sideways movement.
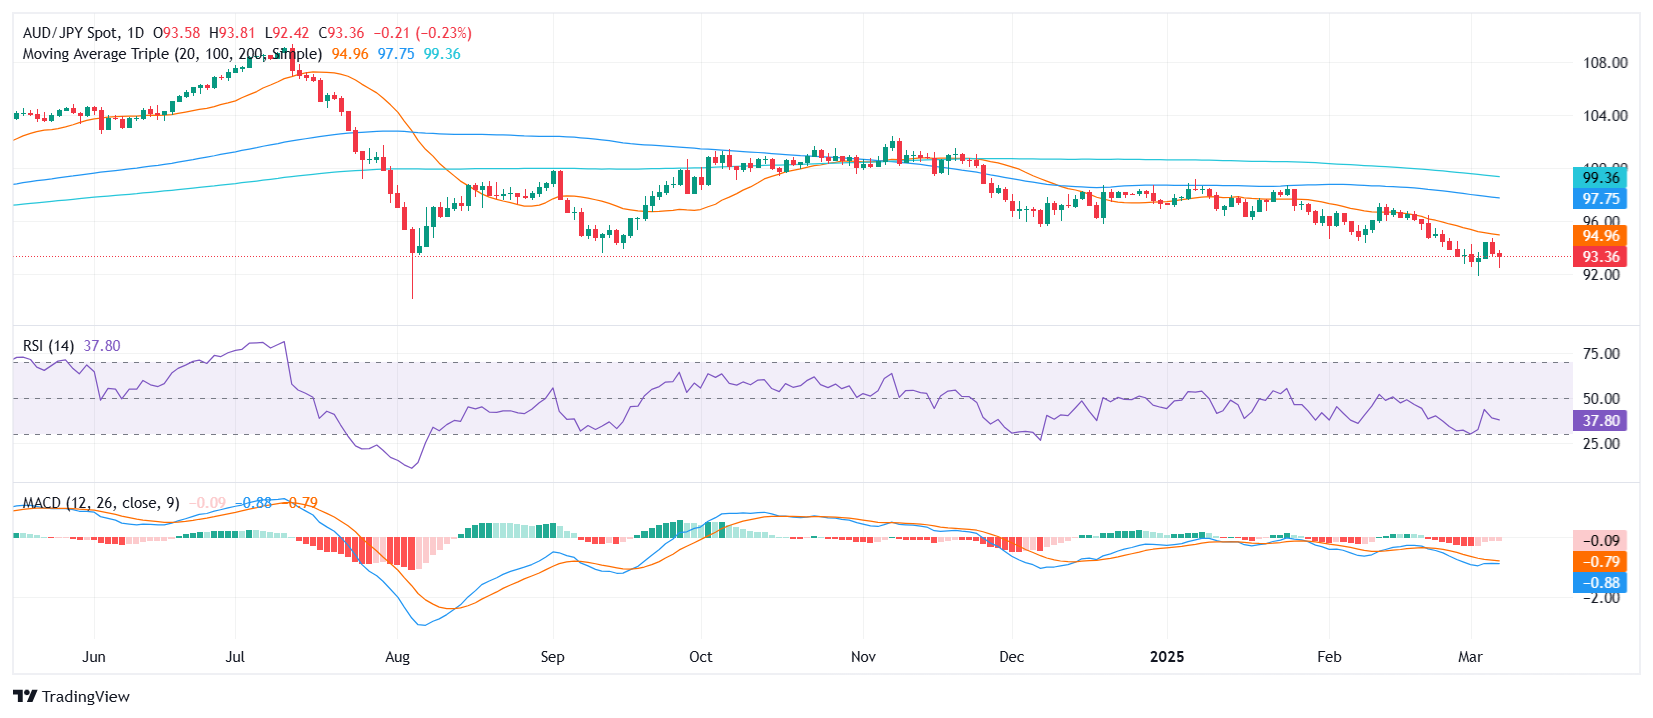
The AUD/JPY pair experienced a second consecutive day of losses on Friday landing at around 93.30, as sellers maintained control and drove prices lower. Despite the bearish pressure, the downward momentum has shown signs of easing, hinting at a possible stabilization or even a near-term bounce.
The Relative Strength Index (RSI) remains in negative territory but is only mildly declining, suggesting that selling pressure may not be as intense as previous sessions. Meanwhile, the Moving Average Convergence Divergence (MACD) continues to print decreasing red bars, indicating that downside momentum is losing steam. This technical setup could open the door for a potential recovery or at least a consolidation phase before the next directional move.
On the technical front, support is forming near the 92.80 zone, with a stronger floor at 92.50. The 20-day Simple Moving Average (SMA), located at 95.00, represents a major resistance point. A break above this level could shift the outlook in favor of buyers, while failure to regain ground may result in continued pressure toward the 92.00 handle.
AUD/JPY daily chart
AUD/JPY daily chart
-
21:42
Australian Dollar falls after weak NFP data fuels risk aversion
- Australian Dollar weakens as disappointing US labor data increases risk-off sentiment.
- US NFP report came in below forecasts, while wages slowed, raising concerns over economic resilience.
- China’s trade data revealed weaker imports, amplifying pressure on the Aussie.
- Technical indicators suggest increasing downside risk as AUD/USD approaches key support levels.
The Australian Dollar extended losses on Friday against the USD after the release of the US Nonfarm Payrolls (NFP) report. The AUD/USD pair struggled to recover as risk sentiment deteriorated with traders reacting to weaker-than-expected job growth and softer wage gains. Meanwhile, China’s trade balance data showed an unexpected drop in imports, raising concerns over slowing demand, which weighed further on the Australian Dollar.
Daily digest market movers: Australian Dollar under pressure after NFP miss
- The US Nonfarm Payrolls report showed job creation slowed in February with 151,000 new jobs added, falling short of the 160,000 estimate. While still an improvement from January’s 125,000 figure, the weaker hiring pace raised concerns about labor market resilience.
- Average Hourly Earnings growth eased to 0.3% MoM, down from 0.4% in January, reinforcing expectations that wage pressure may be cooling. Meanwhile, the US Unemployment Rate edged up to 4.1%, signaling potential softening in labor conditions.
- China’s trade surplus widened to $170.52 billion in February, exceeding forecasts. However, a sharp 8.4% decline in imports raised concerns over weakening domestic demand, which could negatively impact Australia’s export-driven economy.
- The Reserve Bank of Australia (RBA) maintains a cautious outlook, expecting economic growth to moderate toward 2% by 2025. While this stance has supported AUD in the past, investors are becoming wary of possible policy shifts in response to inflation and labor market conditions.
- Risk sentiment soured as investors reassessed global trade developments. Canada delayed its planned second round of retaliatory tariffs against the US until April 2, following exemptions granted to Mexican and Canadian goods under the USMCA agreement. This development provided only temporary relief with broader concerns about global trade tensions persisting.
AUD/USD Technical Analysis: Selling pressure mounts as key support nears
The Australian Dollar extended its decline on Friday, dropping toward the 0.6290 region during the American session as selling pressure intensified. The pair failed to maintain its previous levels after the weaker-than-expected US NFP report increased market caution, prompting further downside movement.
The Moving Average Convergence Divergence (MACD) indicator continues to print decreasing red histogram bars, signaling weakening bullish momentum. Meanwhile, the Relative Strength Index (RSI) has fallen to 53, declining sharply but still above neutral levels. If the RSI continues to slide, it could confirm further downside risks.
A confirmed drop below the 0.6300 support zone could open the door for further losses with the next key level around 0.6270. On the upside, resistance remains at 0.6365 with a break above this level required to shift sentiment back toward the bulls.
Australian Dollar FAQs
One of the most significant factors for the Australian Dollar (AUD) is the level of interest rates set by the Reserve Bank of Australia (RBA). Because Australia is a resource-rich country another key driver is the price of its biggest export, Iron Ore. The health of the Chinese economy, its largest trading partner, is a factor, as well as inflation in Australia, its growth rate and Trade Balance. Market sentiment – whether investors are taking on more risky assets (risk-on) or seeking safe-havens (risk-off) – is also a factor, with risk-on positive for AUD.
The Reserve Bank of Australia (RBA) influences the Australian Dollar (AUD) by setting the level of interest rates that Australian banks can lend to each other. This influences the level of interest rates in the economy as a whole. The main goal of the RBA is to maintain a stable inflation rate of 2-3% by adjusting interest rates up or down. Relatively high interest rates compared to other major central banks support the AUD, and the opposite for relatively low. The RBA can also use quantitative easing and tightening to influence credit conditions, with the former AUD-negative and the latter AUD-positive.
China is Australia’s largest trading partner so the health of the Chinese economy is a major influence on the value of the Australian Dollar (AUD). When the Chinese economy is doing well it purchases more raw materials, goods and services from Australia, lifting demand for the AUD, and pushing up its value. The opposite is the case when the Chinese economy is not growing as fast as expected. Positive or negative surprises in Chinese growth data, therefore, often have a direct impact on the Australian Dollar and its pairs.
Iron Ore is Australia’s largest export, accounting for $118 billion a year according to data from 2021, with China as its primary destination. The price of Iron Ore, therefore, can be a driver of the Australian Dollar. Generally, if the price of Iron Ore rises, AUD also goes up, as aggregate demand for the currency increases. The opposite is the case if the price of Iron Ore falls. Higher Iron Ore prices also tend to result in a greater likelihood of a positive Trade Balance for Australia, which is also positive of the AUD.
The Trade Balance, which is the difference between what a country earns from its exports versus what it pays for its imports, is another factor that can influence the value of the Australian Dollar. If Australia produces highly sought after exports, then its currency will gain in value purely from the surplus demand created from foreign buyers seeking to purchase its exports versus what it spends to purchase imports. Therefore, a positive net Trade Balance strengthens the AUD, with the opposite effect if the Trade Balance is negative.
-
21:13
Gold price slips beneath $2,910 as US yields rebound
- US Nonfarm Payrolls show steady job growth, but Fed remains in no rush to cut rates.
- Powell reiterates that inflation path will be "bumpy," keeping policy steady for now.
- PBoC adds 10 tonnes of Gold in early 2025, while Poland’s NBP purchases 29 tonnes.
Gold prices fell on Friday as the Greenback trims some of its losses and US Treasury bond yields recover following the release of a US jobs market report. At the time of writing, the XAU/USD trades at $2,907, down 0.11%.
The US Bureau of Labor Statistics (BLS) released the February Nonfarm Payrolls (NFP) report, which showed that the economy added more people to the workforce than in January despite missing the mark. The same data showed that the Unemployment Rate remained within familiar levels with Federal Reserve (Fed) Governor Adriana Kugler saying that hiring remains above the breakeven level.
Kugler added that uncertainty is difficult for all parts of the economy. Earlier, she stated that monetary policy would remain steady for some time and added that wages are not a source of inflationary pressure.
Recently, Fed Chair Jerome Powell reiterated that the central bank is not in a hurry to lower rates. Powell added that getting inflation to 2% would be bumpy and that the central bank doesn’t need to overreact to one or two readings. Powell said the Fed is well-positioned regarding monetary policy.
When asked about tariffs, Powell said it remains to be seen if they would be inflation-prone.
Easing geopolitical tensions capped Bullion’s advance as there’s some progress in a possible ceasefire agreement between Ukraine and Russia. In the Middle East, US President Trump continued to exert pressure on Hamas to release hostages.
Central banks buy Gold
In the meantime, the People’s Bank of China (PBoC) continues to purchase Gold, according to the World Gold Council (WGC). The PBoC increased its holdings by 10 tonnes in the first two months of 2025. However, the largest buyer was the National Bank of Poland (NBP), which increased its reserve by 29 tonnes, its largest purchase since June 2019, when it bought 95 tonnes.
Daily digest market movers: Gold advance halts as US real yields climb
- The US 10-year Treasury bond yield rises three basis points to 4.318%.
- US real yields, as measured by the US 10-year Treasury Inflation-Protected Securities (TIPS) yield that correlates inversely to Gold prices, edge up three-and-a-half basis points to 1.981%, a headwind for XAU/USD prices.
- US NFP for February came in at 151K, an improvement from January’s 125K but falling short of the 160K forecast.
- The Unemployment Rate edged up to 4.1%, slightly above the expected 4.0%, indicating some softening in the labor market.
- The Atlanta Fed GDPNow Model projects the GDP for Q1 2025 at -2.4%, up from the -2.8% contraction estimated on Wednesday.
- Money market traders had priced in 69 basis points of easing in 2025, down from 80 bps on Thursday, via data from the Prime Market Terminal.
- Source: Prime Market Terminal
XAU/USD technical outlook: Gold price drops, sellers eye $2,900
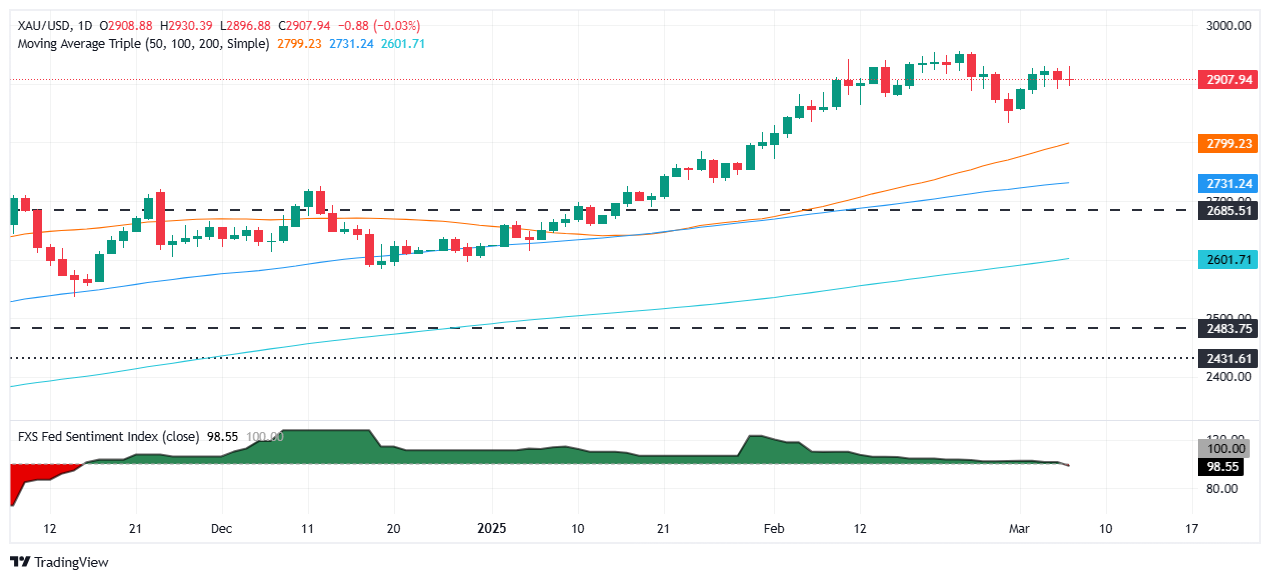
Gold prices remain trading sideways, unable to clear $2,930 following a stellar advance of over 1.72% in the month. The Relative Strength Index (RSI) hints that further upside is seen as the RSI remains bullish.
Therefore, XAU/USD's next resistance would be $2,950, followed by the record high at $2,954. A breach of the latter would expose the $3,000 mark. Conversely, a drop below $2,900 would expose the February 28 low of $2,832, followed by the $2,800 figure.
Gold FAQs
Gold has played a key role in human’s history as it has been widely used as a store of value and medium of exchange. Currently, apart from its shine and usage for jewelry, the precious metal is widely seen as a safe-haven asset, meaning that it is considered a good investment during turbulent times. Gold is also widely seen as a hedge against inflation and against depreciating currencies as it doesn’t rely on any specific issuer or government.
Central banks are the biggest Gold holders. In their aim to support their currencies in turbulent times, central banks tend to diversify their reserves and buy Gold to improve the perceived strength of the economy and the currency. High Gold reserves can be a source of trust for a country’s solvency. Central banks added 1,136 tonnes of Gold worth around $70 billion to their reserves in 2022, according to data from the World Gold Council. This is the highest yearly purchase since records began. Central banks from emerging economies such as China, India and Turkey are quickly increasing their Gold reserves.
Gold has an inverse correlation with the US Dollar and US Treasuries, which are both major reserve and safe-haven assets. When the Dollar depreciates, Gold tends to rise, enabling investors and central banks to diversify their assets in turbulent times. Gold is also inversely correlated with risk assets. A rally in the stock market tends to weaken Gold price, while sell-offs in riskier markets tend to favor the precious metal.
The price can move due to a wide range of factors. Geopolitical instability or fears of a deep recession can quickly make Gold price escalate due to its safe-haven status. As a yield-less asset, Gold tends to rise with lower interest rates, while higher cost of money usually weighs down on the yellow metal. Still, most moves depend on how the US Dollar (USD) behaves as the asset is priced in dollars (XAU/USD). A strong Dollar tends to keep the price of Gold controlled, whereas a weaker Dollar is likely to push Gold prices up.
-
21:00
United States Consumer Credit Change above expectations ($14.5B) in January: Actual ($18.08B)
-
20:25
Dow Jones Industrial Average roils on uneasy data after NFP misses forecasts
- The Dow Jones dipped to fresh lows before rebounding after NFP data print.
- The US added less jobs than expected in February while unemployment ticked higher.
- Previous wages, unemployment, and NFP net job gains were all revised lower.
The Dow Jones Industrial Average (DJIA) struggled on Friday, falling to a fresh seven-week low below 42,200 before staging a mild recovery to the 42, 800 region. The Dow Jones is still sharply lower on the week, falling 2.6% from Monday’s opening bids as trade war concerns weigh on investor sentiment, as well as middling data prints that hint at cracks developing in the US economic landscape.
US Nonfarm Payrolls (NFP) showed a net increase of 151K net new jobs in February’s preliminary print. The figure rose from January’s revised print of 125K, but still came in below the median market forecast of 160K. The US Unemployment Rate also rose slightly, ticking up to 4.1% from the previous 4.0%, and investors were hoping for a steady hold at the previous figure.
US Average Hourly Earnings drew a complicated picture: headline annualized wages grew to 4.0% YoY, but only after January’s yearly earnings were revised down to 3.9% from 4.1%. Markets were expecting earnings to come in at 4.1% in February.
US President Donald Trump continues to twist the screws on his quantum-state tariffs that both exist and do not exist. The Trump administration caved on tariffs that went into effect at the beginning of the week, pivoting to extensions for the automotive industry, and then a wider cut of goods covered under the USMCA. Less then 24 hours after granting tariff concessions, Donald Trump again hit the wires, musing about possibly giving the go-ahead on his “reciprocal” tariffs on Canada, as soon as Friday, but perhaps Monday or even Tuesday.
Dow Jones news
Despite Friday’s early dump, the Dow Jones is recovering, with two-thirds of the equity index posting gains for the day. Boeing (BA) is still in the red for the day, down 3.0% and falling below $154 per share as tariff threats are enough to damage suppliers exposed to cross-border transaction costs.
Strong earnings and positive insider activity is continuing support International Business Machines (IBM), which rose 4.35% to $260 per share on Friday. The tech giant beat the street on its recent earnings reports, bolstering the hardware and software producer. According to reporting, IBM board member David Farr has been adding to his personal stockpile of IBM shares, prompting some investors to follow suit.
Dow Jones price forecast
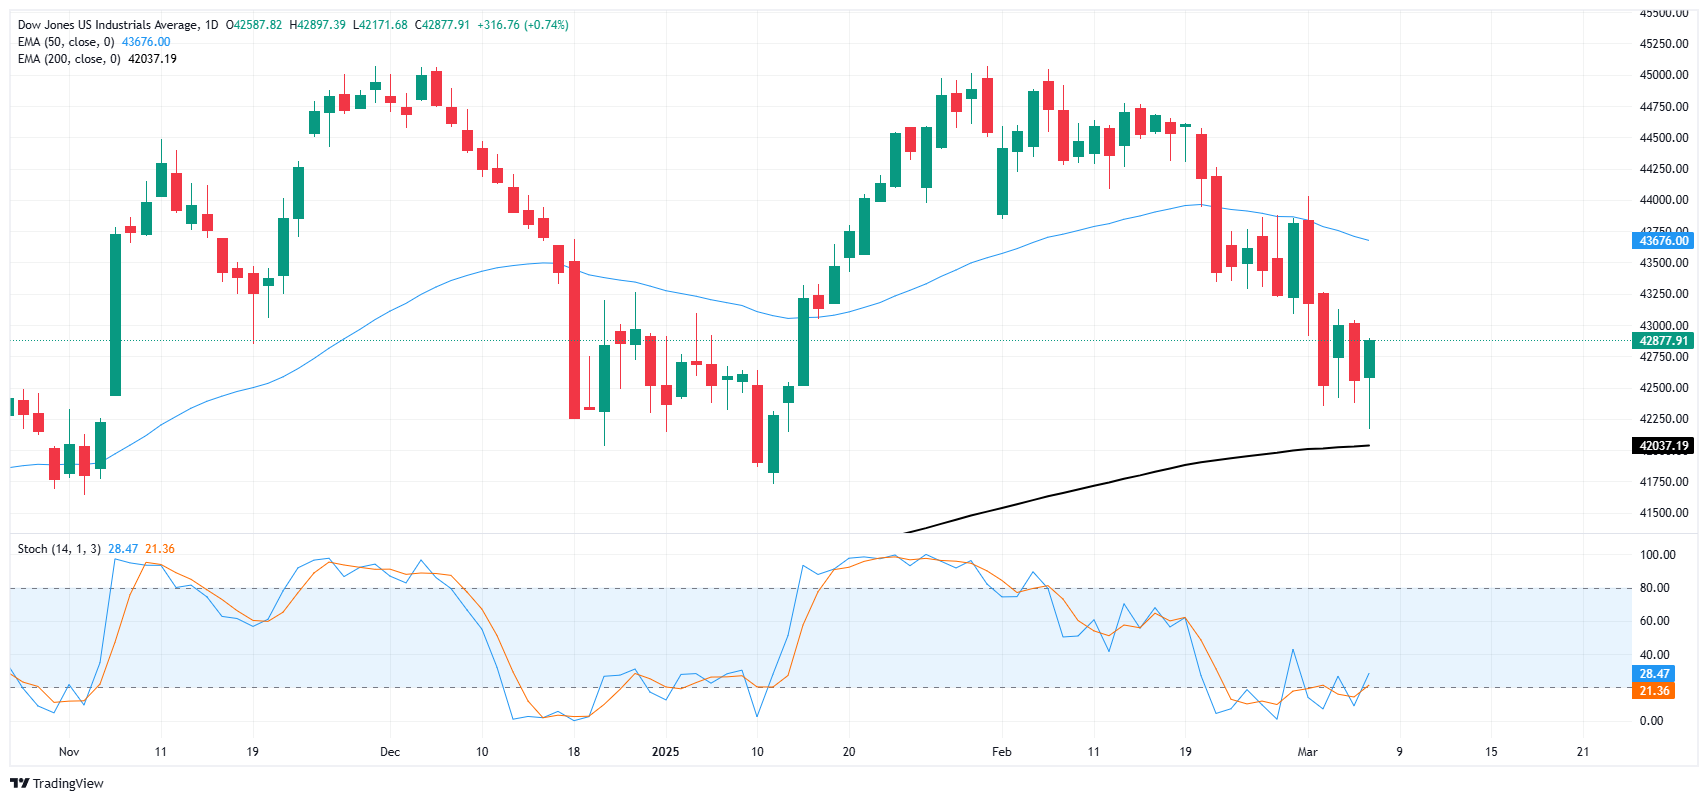
The Dow Jones caught some selling pressure early Friday before recovering its stance, wrestling with the 42,800 handle. The major equity index is still down for the week after falling from the 44,000 handle, but the downside remains limited and bearish pressure is facing stiff resistance.
Price action is getting dangerously close to the 200-day Exponential Moving Average (EMA) just below the 42,000 major price level. One more push into the low side will end the Dow Jones’ 16-month trend of outpacing its own major moving average.
Dow Jones daily chart
Dow Jones FAQs
The Dow Jones Industrial Average, one of the oldest stock market indices in the world, is compiled of the 30 most traded stocks in the US. The index is price-weighted rather than weighted by capitalization. It is calculated by summing the prices of the constituent stocks and dividing them by a factor, currently 0.152. The index was founded by Charles Dow, who also founded the Wall Street Journal. In later years it has been criticized for not being broadly representative enough because it only tracks 30 conglomerates, unlike broader indices such as the S&P 500.
Many different factors drive the Dow Jones Industrial Average (DJIA). The aggregate performance of the component companies revealed in quarterly company earnings reports is the main one. US and global macroeconomic data also contributes as it impacts on investor sentiment. The level of interest rates, set by the Federal Reserve (Fed), also influences the DJIA as it affects the cost of credit, on which many corporations are heavily reliant. Therefore, inflation can be a major driver as well as other metrics which impact the Fed decisions.
Dow Theory is a method for identifying the primary trend of the stock market developed by Charles Dow. A key step is to compare the direction of the Dow Jones Industrial Average (DJIA) and the Dow Jones Transportation Average (DJTA) and only follow trends where both are moving in the same direction. Volume is a confirmatory criteria. The theory uses elements of peak and trough analysis. Dow’s theory posits three trend phases: accumulation, when smart money starts buying or selling; public participation, when the wider public joins in; and distribution, when the smart money exits.
There are a number of ways to trade the DJIA. One is to use ETFs which allow investors to trade the DJIA as a single security, rather than having to buy shares in all 30 constituent companies. A leading example is the SPDR Dow Jones Industrial Average ETF (DIA). DJIA futures contracts enable traders to speculate on the future value of the index and Options provide the right, but not the obligation, to buy or sell the index at a predetermined price in the future. Mutual funds enable investors to buy a share of a diversified portfolio of DJIA stocks thus providing exposure to the overall index.
-
20:00
Argentina Industrial Output n.s.a (YoY): 7.1% (January) vs previous 8.4%
-
20:00
Fed's Kugler: It is possible that we'll see more persistent inflation due to policies.
Federal Reserve (Fed) Board of Governors member Adriana Kugler hit newswires with cautionary comments on Friday that whiplash trade policies could do a lot of damage, including pinning inflation at a persistently higher level.
Key highlights
It is possible that we'll see more persistent inflation due to policies.
I am paying a lot of attention to inflation expectations.
I don't expect government job cuts to show up suddenly.
I am watching very closely for any sudden job market changes.
Wage gain moderation has helped lower inflation.
I am not that worried about small uptick in unemployment rate.
The February jobs number was a solid number.
There is a high level of uncertainty around tariffs.
There reason to believe that, potentially, there could be more persistent inflation.
Uncertainty is difficult for all parts of the economy.
-
19:34
US Dollar faces worst weekly performance in over a year
- DXY plunges further, losing over 3.5% this week.
- February's Nonfarm Payrolls miss expectations and the unemployment rate rises.
- Fed officials signal multiple rate cuts in 2025, fueling more USD weakness.
- Tariff uncertainty continues as President Trump hints at new Canada levies.
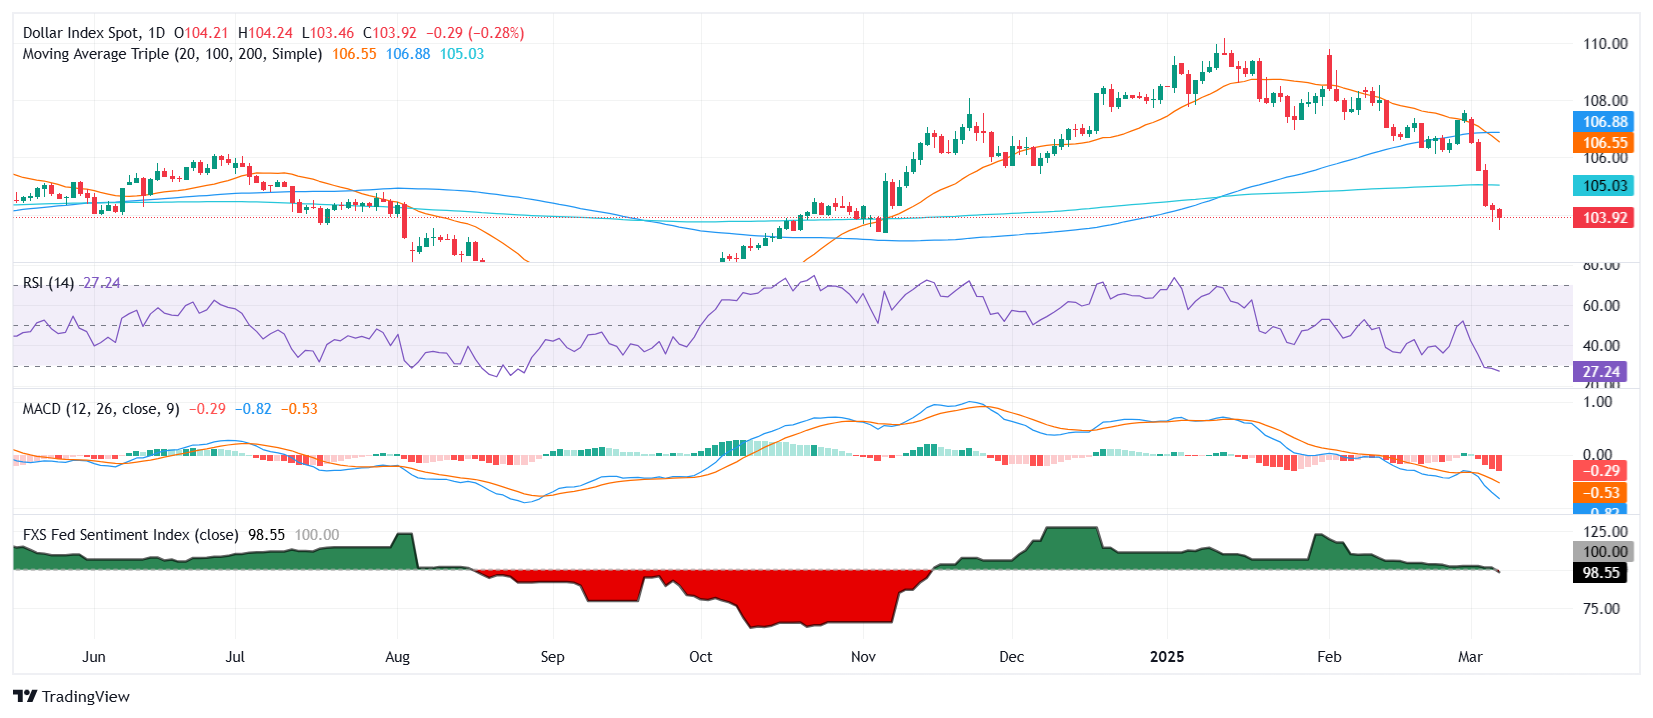
The US Dollar Index (DXY) extends its brutal slide on Friday, heading for its worst weekly performance in over a year as traders accelerate the selloff ahead of the February employment report. The Greenback is now in freefall, with expectations of multiple Fed rate cuts and growing economic uncertainty driving capital outflows.
Meanwhile, tariff-related volatility continues, with United States (US) President Donald Trump keeping markets on edge by hinting at fresh trade measures against Canada but refusing to commit to a timeline. DXY is now struggling to hold the 104.00 handle, having lost over 3.5% since Monday, marking a historic devaluation.
Daily digest market movers: USD spirals lower amid Fed and tariff risks, February’s NFP reading
- On the data front, US Nonfarm Payrolls (NFP) for February came in at 151,000, missing the 160,000 forecast but above January’s 125,000 print.
- Average Hourly Earnings growth slowed to 0.3% month-over-month, a drop from January’s 0.4%.
- The US unemployment rate climbed to 4.1%, marking an uptick from the previous 4.0%.
- Fed Governor Christopher Waller suggested the potential for up to three rate cuts this year, reinforcing the market’s dovish expectations.
- Federal Reserve Chair Jerome Powell warned that ongoing policy uncertainty complicates the central bank’s ability to adjust monetary policy.
- Markets continue digesting shifting Fed policy expectations, with the interest rate differential between the US and other economies narrowing.
- President Trump hinted at fresh tariffs on Canada but refrained from confirming a specific timeline, leaving uncertainty hanging over markets.
- CME FedWatch Tool now shows a rising probability of a June rate cut, as traders further price in easing.
- On the daily chart, the Fed sentiment index fell towards 100, which reflects a slow lean of the Fed towards a more dovish stance.
DXY technical outlook: Bearish pressure dominates
The US Dollar Index (DXY) is entrenched in a deep selloff, having broken below 104.00 and revisiting its lowest levels since November 2024. The 20-day and 100-day Simple Moving Averages (SMA) have now confirmed a bearish crossover, reinforcing negative momentum. The Relative Strength Index (RSI) signals oversold conditions, suggesting a potential short-term rebound, but the MACD remains firmly in bearish territory, pointing to continued downside risk. Should DXY fail to reclaim 104.50, the next key support level lies at 103.50, which could determine whether the selloff extends further.
Nonfarm Payrolls FAQs
Nonfarm Payrolls (NFP) are part of the US Bureau of Labor Statistics monthly jobs report. The Nonfarm Payrolls component specifically measures the change in the number of people employed in the US during the previous month, excluding the farming industry.
The Nonfarm Payrolls figure can influence the decisions of the Federal Reserve by providing a measure of how successfully the Fed is meeting its mandate of fostering full employment and 2% inflation. A relatively high NFP figure means more people are in employment, earning more money and therefore probably spending more. A relatively low Nonfarm Payrolls’ result, on the either hand, could mean people are struggling to find work. The Fed will typically raise interest rates to combat high inflation triggered by low unemployment, and lower them to stimulate a stagnant labor market.
Nonfarm Payrolls generally have a positive correlation with the US Dollar. This means when payrolls’ figures come out higher-than-expected the USD tends to rally and vice versa when they are lower. NFPs influence the US Dollar by virtue of their impact on inflation, monetary policy expectations and interest rates. A higher NFP usually means the Federal Reserve will be more tight in its monetary policy, supporting the USD.
Nonfarm Payrolls are generally negatively-correlated with the price of Gold. This means a higher-than-expected payrolls’ figure will have a depressing effect on the Gold price and vice versa. Higher NFP generally has a positive effect on the value of the USD, and like most major commodities Gold is priced in US Dollars. If the USD gains in value, therefore, it requires less Dollars to buy an ounce of Gold. Also, higher interest rates (typically helped higher NFPs) also lessen the attractiveness of Gold as an investment compared to staying in cash, where the money will at least earn interest.
Nonfarm Payrolls is only one component within a bigger jobs report and it can be overshadowed by the other components. At times, when NFP come out higher-than-forecast, but the Average Weekly Earnings is lower than expected, the market has ignored the potentially inflationary effect of the headline result and interpreted the fall in earnings as deflationary. The Participation Rate and the Average Weekly Hours components can also influence the market reaction, but only in seldom events like the “Great Resignation” or the Global Financial Crisis.
-
19:02
United States Baker Hughes US Oil Rig Count: 486 vs previous 489
-
18:52
US President Donald Trump: We might do Canada tariffs tomorrow
US President Donald Trump took time out of his Oval Office address to deliver new information about impending tariffs on Canada. While addressing the press in the White House, President Trump lobbed a fresh tariff threat, which may or may not come today, or on Monday, or on Tuesday.
The statement comes less than 24 hours after the Trump administration temporarily waived tariffs on all USMCA-associated goods, and the reaffirmation that reciprocal tariffs will happen in April also appears to have fallen by the wayside.
Key highlights
Canada has tremendously high tariffs on lumber.
We will shrink the government and grow the private sector.
I want auto parts to be built and made in the US.
We may do reciprocal tariffs as early as today.
We may do more tariffs today.
We may do today, or on Monday or Tuesday.
EU has been a terrible abuser on tariffs.
India has agreed to cut tariffs way down.
We'll have more manufacturing jobs instead of government jobs.
There hasn't been much disturbance so far.
I'm expecting good eco data and reports.
We want to help companies create jobs.
There will be modifications to tariffs, but very little.
We're going to load up Michigan with auto jobs.
Chips Act is a waste of money.
Finding it more difficult to deal with Ukraine.
It may be easier to deal with Russia on a final settlement.
I believe Putin.
Europe doesn't know how to end the war.
Something's going to happen very soon with Iran.
-
18:50
Mexican Peso struggles to hold gains, loses ground versus USD
- USD/MXN rebounds as US trade policies overshadow economic data.
- Mexico’s inflation beats forecasts, but Banxico still expected to cut rates on March 27.
- USMCA four-week exemptions are secured, but tariffs on steel and aluminum remain in place.
- US Dollar weakens despite solid NFP; markets price in 80 bps of Fed cuts in 2025.
The Mexican Peso (MXN) erases earlier gains against the US Dollar (USD) and remains unable to reach a new weekly high, as the exotic pair seems to have found a floor near 20.22. A mildly hot inflation report in Mexico and solid US Nonfarm Payrolls (NFP) figures continued to be overshadowed by US President Donald Trump's trade policies. The USD/MXN trades at 20.30, up 0.30%.
Inflation in Mexico exceeded forecasts in headline and underlying figures in February. Nevertheless, it wouldn’t offset another rate cut by the Bank of Mexico (Banxico) at the March 27 meeting.
In the meantime, economic data takes a backseat to US trade policies. Although Mexico has achieved a one-month exemption for USMCA-related products imported to the US, duties on steel and aluminum remain. Therefore, the Peso could be pressured as it is one of the four largest exporters in the US. Mexican Economy Minister Marcelo Ebrard said he would meet US trade officials to discuss the matter.
In February, US Nonfarm Payrolls improved compared to January’s data but missed the mark. The Unemployment Rate rose 0.10%, yet it was mostly aligned with estimates.
US jobs data did little to boost the Greenback, which fell over 3.56% in the week, according to the US Dollar Index (DXY). The data doesn’t suggest that the Federal Reserve (Fed) needs to cut rates at the upcoming meeting.
Market participants seem confident that the Federal Reserve (Fed) will cut interest rates in 2025. At the time of writing, December 2025 Fed funds rate futures contract is pricing in 80 basis points of easing.
Ahead on the calendar, USD/MXN traders will be eyeing Fed Chair Jerome Powell's speech at the University of Chicago at 17:30 GMT.
Daily digest market movers: Mexican Peso pressured by US trade rhetoric
- Mexico's headline inflation rose 0.28% MoM in February, above estimates of 0.27% and down from the previous 0.29%. For 12 months, it increased by 3.77% as expected, up from 3.59%.
- Core inflation MoM rose by 0.48% up from 0.46% forecasted by analysts and from January’s 0.41%. Annually, it rose 3.65%, exceeding forecasts of 3.62%, down from last month’s 3.66%.
- Banco de Mexico's (Banxico) private economists' survey showed that headline inflation is forecast to end at 3.71%, while core CPI is expected to finish at 3.75%. The USD/MXN exchange rate is projected to end at 20.85 in 2025, slightly lower than the 20.90 projection in the previous survey. However, for 2026, they anticipate a sharper depreciation of the Peso, well beyond the 21.30 level expected in January’s poll.
- US February’s Nonfarm Payroll figures were 151K, up from January’s 125K but missing estimates of 160K. The Unemployment Rate ticked up to 4.1%, above forecasts of 4%.
- A Reuters poll showed that 70 out of 74 economists say the risk of recession has risen in the US, Canada and Mexico.
- Fed Governor Adriana Kugler said that monetary policy could remain steady for some time, added that inflation risks are tilted to the upside. She added that the labor market has rebalanced and that wages are not a key driver of inflation pressure.
- Trade disputes between the US and Mexico remain front and center. If countries could come to an agreement, it could pave the way for a recovery of the Mexican currency. Otherwise, further USD/MXN upside is seen as US tariffs could trigger a recession in Mexico.
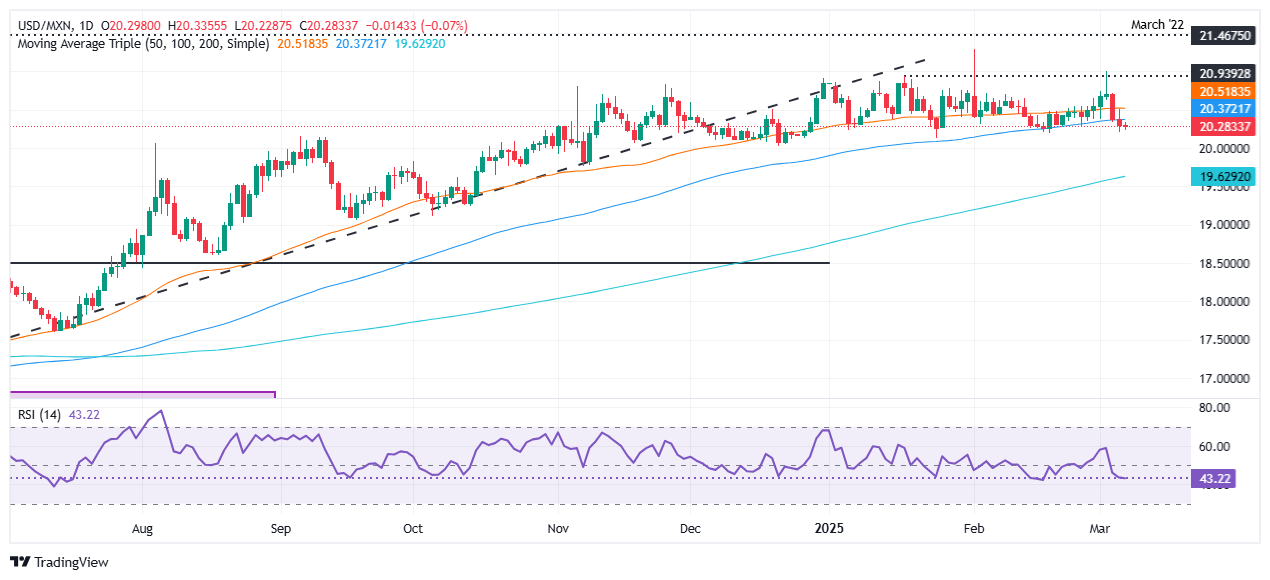
USD/MXN technical outlook: Mexican Peso consolidates as USD/MXN stays flat near 20.30
The USD/MXN, after clearing the 100-day Simple Moving Average (SMA) at 20.33, has consolidated within the 20.20-20.30 range. Price action suggests that neither buyers nor sellers are in charge, and it seems the pair could remain within familiar levels amid the lack of a catalyst.
If USD/MXN clears the 100-day SMA, the next resistance would be 20.50. If surpassed, the next key resistance levels would be the March 4 peak at 20.99 and the year-to-date (YTD) peak of 21.28.
Otherwise, a breach of the 20.00 figure, would expose the 200-day SMA at 19.54.
Mexican Peso FAQs
The Mexican Peso (MXN) is the most traded currency among its Latin American peers. Its value is broadly determined by the performance of the Mexican economy, the country’s central bank’s policy, the amount of foreign investment in the country and even the levels of remittances sent by Mexicans who live abroad, particularly in the United States. Geopolitical trends can also move MXN: for example, the process of nearshoring – or the decision by some firms to relocate manufacturing capacity and supply chains closer to their home countries – is also seen as a catalyst for the Mexican currency as the country is considered a key manufacturing hub in the American continent. Another catalyst for MXN is Oil prices as Mexico is a key exporter of the commodity.
The main objective of Mexico’s central bank, also known as Banxico, is to maintain inflation at low and stable levels (at or close to its target of 3%, the midpoint in a tolerance band of between 2% and 4%). To this end, the bank sets an appropriate level of interest rates. When inflation is too high, Banxico will attempt to tame it by raising interest rates, making it more expensive for households and businesses to borrow money, thus cooling demand and the overall economy. Higher interest rates are generally positive for the Mexican Peso (MXN) as they lead to higher yields, making the country a more attractive place for investors. On the contrary, lower interest rates tend to weaken MXN.
Macroeconomic data releases are key to assess the state of the economy and can have an impact on the Mexican Peso (MXN) valuation. A strong Mexican economy, based on high economic growth, low unemployment and high confidence is good for MXN. Not only does it attract more foreign investment but it may encourage the Bank of Mexico (Banxico) to increase interest rates, particularly if this strength comes together with elevated inflation. However, if economic data is weak, MXN is likely to depreciate.
As an emerging-market currency, the Mexican Peso (MXN) tends to strive during risk-on periods, or when investors perceive that broader market risks are low and thus are eager to engage with investments that carry a higher risk. Conversely, MXN tends to weaken at times of market turbulence or economic uncertainty as investors tend to sell higher-risk assets and flee to the more-stable safe havens.
-
18:41
Fed's Powell: Uncertainty around Trump policies remains high
Federal Reserve (Fed) Chair Jerome Powell stuck to his cautious guns on Friday, warning that policy uncertainty makes it difficult for the Fed to enact policy adjustments.
Key highlights
Uncertainty around Trump Administration policies and their economic effects remains high.
Most longer-term inflation expectations remain stable, consistent with 2% goal.
Net effect of trade, immigration, fiscal, and regulation policy is what matters for the economy anf monetary policy.
Fed policy is not on preset course. We can maintain policy restraint for longer if inflation progress stalls or ease if labor market unexpectedly weakens or inflation falls more than expected.
Labor market solid, broadly in balance. Inflation somewhat above 2% goal but moving closer to target.
US economy in a good place, despite elevated uncertainty.
Zero lower bound is probably not the base case anymore.
We'll be looking at focus on zero lower bound in review.
We will be looking at idea of moderate inflation overshoot.
There is no need to redefine price stability.
It's not appropriate to react to one-time price spikes.
It's still very uncertain about what will be tariffed and for how long.
If this turns into a series of actions, or if tariffs are larger, or expectations start to move, that would influence how the Fed reacts.
It is not simply what is happening with tariffs, but with growth and other changes to economic policy.
The costs of being cautious are very, very low.
The economy is fine; it doesn't need us to do anything.
Some factors suggest productivity burst to be one-time.
Fed staff marking up potential growth estimates for now.
-
18:27
Fed’s Kugler: Inflation risks are tilted to the upside
Federal Reserve Governor Adriana Kugler indicated that rising inflation risks provided a strong argument for keeping interest rates steady for an extended period.
Key Quotes
Sees steady monetary policy ‘for some time’ on recent inflation data.
Strongly supported steady rate policy at January FOMC.
Future Fed policy changes will be driven by data.
There are important upside risks to inflation.
Flags big rise in some inflation expectations readings.
Inflation has been moving sideways for a while.
Job market has substantially rebalanced.
Wages are not a key driver of inflation pressures.
-
17:24
EUR/USD Price Analysis: Bulls push higher, but overbought signals hint at correction
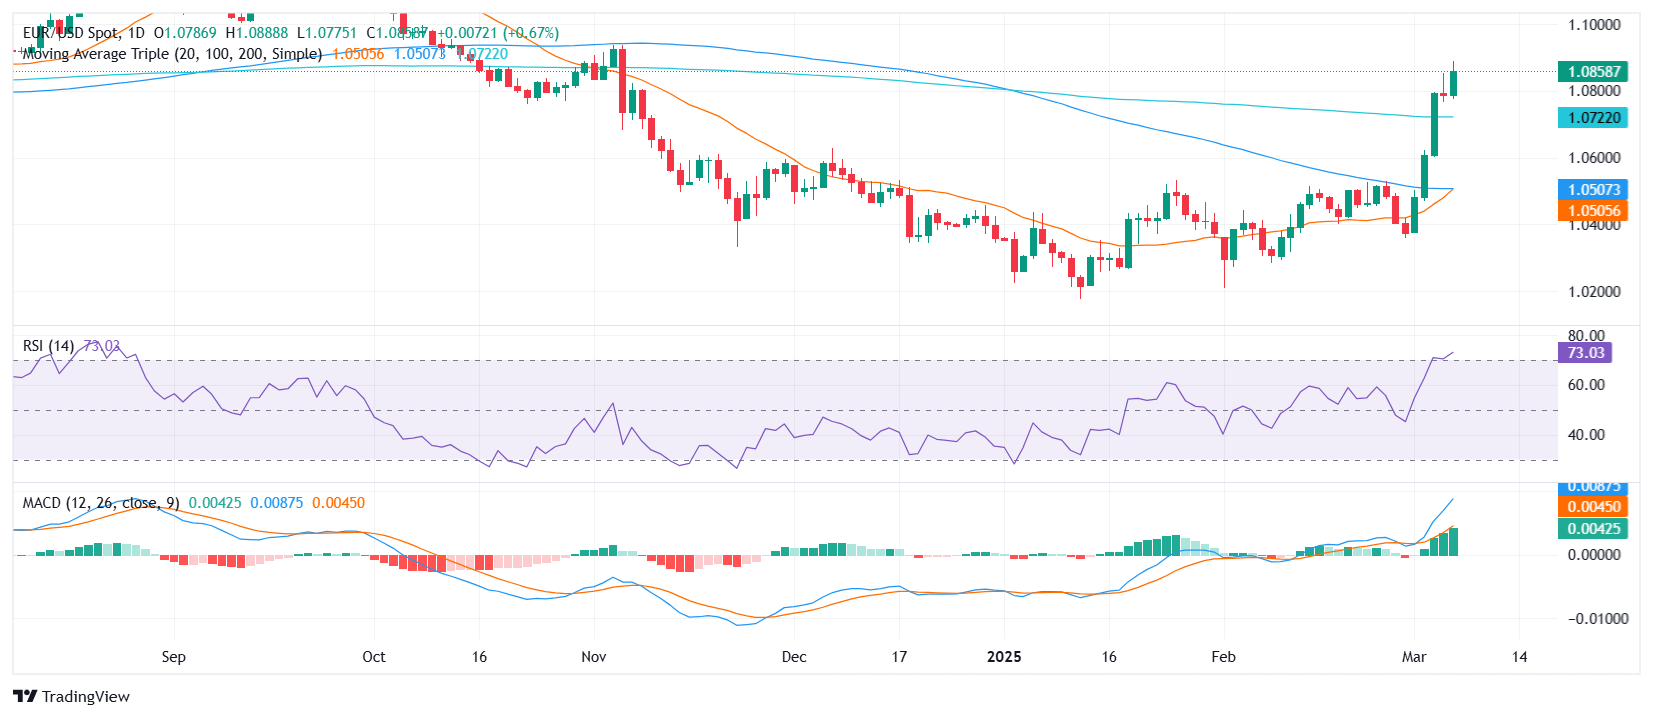
- EUR/USD holds gains after the European session, trading near the 1.0870 area, marking fresh highs since November 2024.
- The 20 and 100-day moving averages are nearing a bullish crossover, while overbought RSI suggests a possible correction.
- Immediate resistance is seen near 1.0900, while key support lies at 1.0800.
The EUR/USD pair stands higher on Friday after the European session, reaching its strongest level since November 2024 above 1.0800 as bullish momentum continued to build. Buyers remain firmly in control, driving the pair into fresh territory, with price action now reflecting strong upward momentum.
The Relative Strength Index (RSI) is positioned in overbought territory and rising sharply, indicating strong buying pressure but also signaling that the rally could face exhaustion soon. Meanwhile, the Moving Average Convergence Divergence (MACD) is printing rising green bars, reinforcing the current bullish outlook. A notable development is the approaching bullish crossover between the 20-day and 100-day Simple Moving Averages (SMAs), which could further support buyers if confirmed.
On the technical front, resistance is now seen near the 1.0900 zone, with a break above potentially opening the door for further gains toward 1.0950. On the downside, immediate support stands around 1.0800, followed by 1.0700 and well below the 20 and 100-day SMA convergence near 1.0500. If selling pressure emerges, a pullback toward these levels could signal a technical correction before another bullish attempt.
EUR/USD daily chart
-
17:18
EUR/USD to target 1.12 on a 12-month view – Rabobank
The proposal from Germany’s expected coalition partners that they plan to relax the country’s debt rules to boost defence spending and support infrastructure has been billed by some commentators as Germany’s whatever it takes moment, Rabobank's FX analyst Jane Foley notes.
Risk of a move back to 1.05 on a 1 to 3-month view
"We have argued for some time that Germany’s structural economic issues means that the country has a need for a weak exchange rate. The prospect of a large fiscal injection weakens this argument considerably."
"We have revised up our expectations for the EUR across the board. We have removed EUR/USD1.00 from our forecast table and are targeting EUR/USD at 1.12 on a 12-month view. That said, we do not expect EUR/USD to trade in a straight line this year and see risk of a move back to 1.05 on a 1 to 3-month view."
-
16:53
Fed’s Williams: Inflation expectations remain anchored
John Williams, President of the Federal Reserve Bank of New York, indicated on Friday that, so far, there was no evidence to suggest that inflation expectations were beginning to encounter any difficulties.
Key Quotes
No sign of inflation expectations becoming unmoored.
Inflation expectations back to pre-pandemic levels.
Data shows lag before inflation shock hits short-term expectations.
-
16:53
Recession risks rise for US, Canada and Mexico – Reuters
A Reuters poll showed that 70 of 74 economists surveyed suggest that risks for the Mexican, Canadian, and American economies are piling up amid US President Donald Trump's controversial trade policies.
US inflation risks, which remained skewed to the upside, worsened, preventing the Federal Reserve from easing policy.
Tariff announcements and sudden rollbacks have kept traders’ risk averse, as the S&P 500 has erased all of its gains since Trump’s November election.
On Thursday, the International Monetary Fund (IMF) said that US tariffs would negatively impact Mexico and Canada.
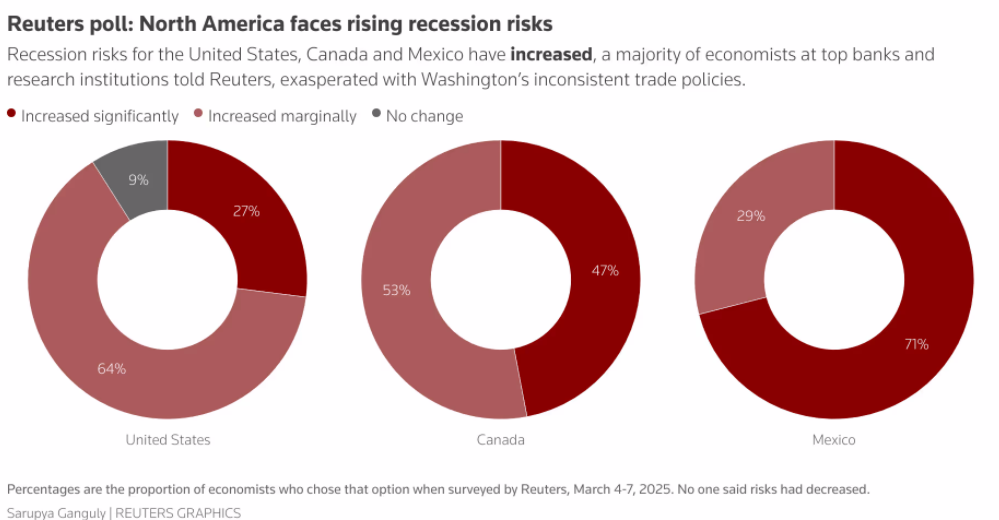
Source: Reuters
Nearly every economist polled revealed that the economic outlook had soured considerably across the continent.
Regarding the central banks, economists estimate a 25-bps rate cut by the Bank of Canada (BoC) on March 12. Meanwhile, 56 of 102 economists foresee the Fed holding rates until mid-2025, while the rest expect a quarter-percentage-point rate cut.
In the meantime, the Bank of Mexico (Banxico) is expected to cut rates by 50 bps at the March meeting. Ramon de la Rosa, the economics deputy director at Actinver, said “If tariffs are prolonged and inflation picks up, Banxico will be more cautious about cutting its rate. While we expect a 50-basis-points reduction in March, subsequent cuts would be in doubt.”
Tariffs FAQs
Tariffs are customs duties levied on certain merchandise imports or a category of products. Tariffs are designed to help local producers and manufacturers be more competitive in the market by providing a price advantage over similar goods that can be imported. Tariffs are widely used as tools of protectionism, along with trade barriers and import quotas.
Although tariffs and taxes both generate government revenue to fund public goods and services, they have several distinctions. Tariffs are prepaid at the port of entry, while taxes are paid at the time of purchase. Taxes are imposed on individual taxpayers and businesses, while tariffs are paid by importers.
There are two schools of thought among economists regarding the usage of tariffs. While some argue that tariffs are necessary to protect domestic industries and address trade imbalances, others see them as a harmful tool that could potentially drive prices higher over the long term and lead to a damaging trade war by encouraging tit-for-tat tariffs.
During the run-up to the presidential election in November 2024, Donald Trump made it clear that he intends to use tariffs to support the US economy and American producers. In 2024, Mexico, China and Canada accounted for 42% of total US imports. In this period, Mexico stood out as the top exporter with $466.6 billion, according to the US Census Bureau. Hence, Trump wants to focus on these three nations when imposing tariffs. He also plans to use the revenue generated through tariffs to lower personal income taxes.
-
16:24
Fed’s Bowman: Rate decisions will look at jobs, economic activity
Federal Reserve Governor Michelle Bowman, regarded as one of the bank’s most hawkish policymakers, indicated that she might place greater emphasis on labour market indicators when considering future policy decisions.
Key Quotes
Labor market, economic activity will become a larger factor in US central bank policy discussions going forward.
Shocks, structural changes since Covid-19 pandemic may have masked transmission of Fed policy to the economy.
-
16:22
GBP/USD climbs above 1.2900 following US NFP data
- US Nonfarm Payrolls rise to 151K, but unemployment ticks up to 4.1%.
- Markets price in three Fed rate cuts in 2025 amid economic uncertainty.
- UK traders eye GDP data next week, while US focuses on inflation and UoM sentiment.
The Pound Sterling registers solid gains versus the US Dollar in early trading on Friday during the North American session, even though the latest jobs report in the United States (US) depicts the economy remains solid. Nevertheless, fears of a recession in the US keep the Greenback on the backfoot, and the GBP/USD trades at 1.2920, up over 0.30%.
Sterling gains 0.30% despite NFP beat, as rising US unemployment weighs on sentiment
February’s Nonfarm Payroll figures were 151K, up from January’s 125K but missing estimates of 160 K. Although the print is solid, the GBP/USD rose as the Unemployment Rate ticked up to 4.1%, above forecasts of 4%.
The data doesn’t suggest that the Federal Reserve (Fed) needs to cut rates at the upcoming meeting. Nevertheless, it didn’t improve the economic outlook due to US President Donald Trump's controversial policies, which keep businesses uncertain of planning ahead.
March’s Nonfarm Payrolls data is expected to be worse due to Elon Musk’s Department of Government Efficiency (DOGE) laying off probationary federal government workers. Investors seem to be pricing a jobs market slowdown, which could exert pressure on the Fed to lower borrowing costs to fulfill its dual mandate.
A Reuters poll showed that 70 out of 74 economists says the risk of recession has risen in the US, Canada, and Mexico. Money market players continued to price in three 25 basis points of rate cuts by the Fed, according to the December 2025 fed funds rate futures contract.
Across the pond, the Sterling has been supported by the weakness of the US Dollar. Traders are awaiting forecasts of the Office for Budget Responsibility (OBR) on March 26, at a time when Finance Minister Rachel Reeves is pressured to clarify how she would balance the books without breaking her own fiscal rules.
Ahead next week, the UK economic docket will feature Gross Domestic Product (GDP) figures. In the US, traders are eyeing inflation data, alongside Consumer Sentiment by the University of Michigan (UoM).
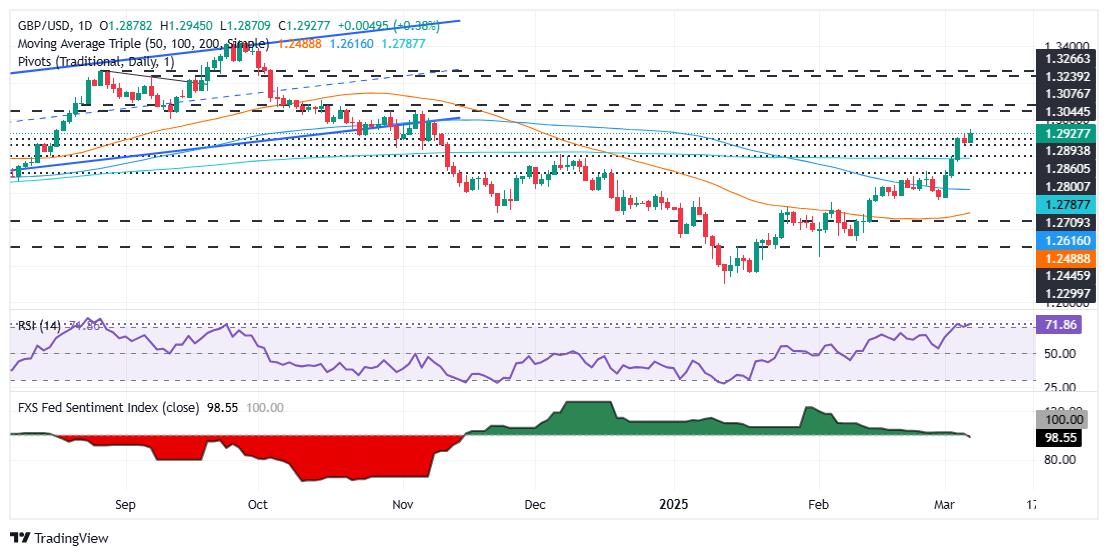
GBP/USD Price Forecast: Technical outlook
The GBP/USD is set to extend its gains once it clears the 1.2900 figure. Momentum favors further upside, although the Relative Strength Index (RSI) turned overbought. Nonetheless, traders must be aware that in strong trends, such as a bullish move, the RSI would reach overbought levels at 80. Hence, further upside is seen.
The next key resistance would be 1.2950 and the 1.3000 mark. On the downside, if GBP/USD falls beneath 1.2900, a test of the December 2024 cycle high at 1.2811 is on the cards.
British Pound PRICE Today
The table below shows the percentage change of British Pound (GBP) against listed major currencies today. British Pound was the strongest against the Australian Dollar.
USD EUR GBP JPY CAD AUD NZD CHF USD -0.65% -0.38% -0.24% 0.26% 0.29% 0.26% -0.51% EUR 0.65% 0.27% 0.43% 0.92% 0.95% 0.92% 0.14% GBP 0.38% -0.27% 0.17% 0.64% 0.67% 0.65% -0.10% JPY 0.24% -0.43% -0.17% 0.50% 0.54% 0.50% -0.24% CAD -0.26% -0.92% -0.64% -0.50% 0.03% 0.00% -0.74% AUD -0.29% -0.95% -0.67% -0.54% -0.03% -0.03% -0.77% NZD -0.26% -0.92% -0.65% -0.50% -0.00% 0.03% -0.74% CHF 0.51% -0.14% 0.10% 0.24% 0.74% 0.77% 0.74% The heat map shows percentage changes of major currencies against each other. The base currency is picked from the left column, while the quote currency is picked from the top row. For example, if you pick the British Pound from the left column and move along the horizontal line to the US Dollar, the percentage change displayed in the box will represent GBP (base)/USD (quote).
-
15:41
USD/CAD jumps to near 1.4380 after US/Canada labor market data
- USD/CAD climbs to near 1.4380 after the release of the US/Canada employment data for February.
- The Canadian Dollar weakens as the economy barely added fresh workers in February.
- US NFP data misses estimates by a slight margin.
The USD/CAD pair gains sharply to near 1.4380 in Friday’s North American session. The Loonie pair attracts significant bids after the release of the labor market data of February of both the United States (US) and Canada.
The Canadian Dollar (CAD) tumbles as Statistics Canada reported that the laborforce barely grew last month. The Canadian economy added 1.1K fresh workers, while economists expected employers to have added 20K job-seekers lower than 76K in January. The Unemployment Rate remains steady at 6.6% against estimates of 6.7%. Average Hourly Wages, a key measure of wage growth, accelerated at a robust pace to 4% from the prior release of 3.7%.
Soft labor market data is expected to boost market expectations that the Bank of Canada (BoC) will cut interest rates again in its monetary policy meeting on Wednesday.
The Canadian Dollar has been underperforming lately as US President Donald Trump has imposed 25% tariffs on Canada and Mexico. He has relaxed tariffs on goods compliant with the United States-Mexico-Canada Agreement (USMCA) till April 2.
During North American trading hours on Friday, Trump ordered a reduction of the duty rate for non-USMCA-compliant potash to 10% from 25% - Federal Register Notice.
In the US region, Nonfarm Payrolls (NFP) came in lower at 151K than estimates of 160K but remained higher than 125K seen in January. The jobless rate accelerated to 4.1% from estimates and the former release of 4%. A slightly lower US NFP than expectations would weigh on market expectations that the Federal Reserve (Fed) will keep interest rates steady for longer.
-
15:32
Turkey Treasury Cash Balance fell from previous -204.9B to -397.602B in February
-
15:02
GBP firm but lags EUR – Scotiabank
Pound Sterling (GBP) is a little stronger on the session but, again, trends largely reflect the broader tone of the USD rather than any GBP-specific developments, Scotiabank's Chief FX Strategist Shaun Osborne notes.
EUR/GBP rebound nears major trend resistance
"Hefty GBP losses versus the EUR this week may draw a veil over the GBP’s longer run improvement on the cross—at least for now– and solidify EURGBP support around the 0.82 point."
"Cable gains are testing retracement resistance (61.8% Fibonacci resistance of the 1.34/1.21 drop seen between September and January) at 1.2924. A clear push through the low 1.29s targets additional retracement gains towards 1.31. Support is 1.2865. Note that EUR/GBP’s rebound is nearing major trend resistance at 0.8425."
-
15:00
Canada Unemployment Rate holds steady at 6.6% in February vs. 6.7% expected
- The Unemployment Rate in Canada remained unchanged at 6.6% in February.
- USD/CAD trades in positive territory above 1.4350 after the data.
The Unemployment Rate in Canada held steady at 6.6% in February, Statistics Canada reported on Friday. This reading came in slightly better than the market expectation of 6.7%. In this period, the Employment Change was 1.1K, below the January print and the market expectation of 76K and 20K, respectively.
"Total hours worked fell 1.3% in the month, but were up 0.5% compared with 12 months earlier," the press release read. "Average hourly wages among employees were up 3.8% (+$1.32 to $36.14) on a year-over-year basis in February, following growth of 3.5% in January (not seasonally adjusted)."
Market reaction
USD/CAD gathers recovery following this report and was last seen rising 0.5% on the day at 1.4368.
-
14:51
EUR extends gains for best week versus the USD since 2009 – Scotiabank
The Euro (EUR) is ending the week with another, solid daily gain on the US Dollar (USD). This is the EUR’s best weekly performance since 2009, according to Bloomberg, Scotiabank's Chief FX Strategist Shaun Osborne notes.
EUR rally has room to flourish still
"Late week gains have been supported by a mild upward revision to Eurozone growth in Q4 (0.2% Q/Q, from 0.1%) and a further, small narrowing in EZ/US spreads (to -170bps). ECB policy hawks are expressing caution about the rate outlook following yesterday’s cut. S&P said Germany’s AAA rating was “not necessarily” at risk from fiscal reforms."
"Solid, sustained gains through 1.0800/05 suggest EUR gains can extend to 1.0950/00 (1.0964 is the 76.4% retracement resistance derived from the EUR 1.12/1.01 drop). Bullish short– and medium-term trend momentum is supportive of further gains at this point and suggest the EUR rally has room to flourish still. Support is 1.0800/10 and (key, in the short run) 1.0765."
-
14:36
CAD steady to slightly lower on temporary tariff relief – Scotiabank
The CAD is a moderate underperformer on the session, easing slightly alongside its commodity peers amid fragile risk appetite, Scotiabank's Chief FX Strategist Shaun Osborne notes.
Corrective USD/CAD gains may extend to 1.4400/50
"President Trump gave Mexico and—eventually—Canada a break on the 25% tariffs until April 2, signaled just as the S&P 500 was testing its 200-day MA. Steel and aluminum tariffs are still coming next week, according to the president, and reciprocal tariffs are still on track for early April, he confirmed in a TV interview this morning, adding that tariffs could go up over time (which would, presumably, then not make them 'reciprocal' anymore)."
"Signals for the broader economy may help inform BoC policymakers about the rate outlook beyond next week’s decision which is expected to result in a 25bps rate cut—although market pricing has shaved a couple of bps off of the anticipated easing following the back and forth in Washington on tariffs. Sunday sees the conclusion of the Liberal party leadership race. Voting concludes at 15ET and the winner should be announced shortly after."
"The USD’s drop under support in the mid/upper 1.43s yielded the expected test of 1.4250 (which remains support) yesterday but intraday price action suggests a more neutral tone for spot today. A mild correction from yesterday’s low may see the USD retest the mid-1.43s but the broader tone of short-term price signals is bearish after the early week rejection of 1.4550 (firm resistance). Corrective USD gains may extend to 1.4400/50 but perhaps not much more for now."
-
14:31
EUR/GBP advances to near 0.8400 as German debt reforms weigh on ECB dovish bets
- EUR/GBP rises sharply to near 0.8400 as the Euro outperforms amid Germany’s debt restructuring plan.
- The ECB reduced its interest rates by 25 bps on Thursday, as expected.
- BoE Mann sees the need for a swift policy-easing cycle due to global market uncertainty.
The EUR/GBP pair climbs to near the key level of 0.8400 in Friday’s North American session. The asset strengthens as the Euro (EUR) outperforms its peers, with traders paring European Central Bank (ECB) dovish bets on expectations that German debt restructuring would accelerate inflationary pressures. Such a scenario would force the ECB to pause the monetary policy-easing cycle in the April meeting.
This week, German leaders, including likely new Chancellor Frederich Merz, have agreed to create a 500 billion Euro infrastructure fund and debt reforms.
While ECB President Christine Lagarde believes that it is to early to predict the impact of German monetary stimulus on the Eurozone economy. Lagarde said in the press conference after the policy decision on Thursday that increased defense and infrastructure spending is still a "work in progress" and the ECB "needs time" to understand the impact.
On Thursday, the ECB reduced its Deposit Facility rate by 25 basis points (bps) to 2.5%, as expected, but refrained from guiding the interest rate outlook. This was the fifth interest rate cut by the ECB in a row.
Meanwhile, the Pound Sterling (GBP) underperforms the Euro as Bank of England (BoE) Monetary Policy Committee (MPC) member Catherine Mann argued that the economy needs strong stimulus through swift policy-easing due to due to “substantial volatility” coming from financial markets, especially from “cross-border spillovers”.
Contrary to BoE Mann, other officials, including Governor Andrew Bailey, favored a gradual monetary expansion cycle as inflationary pressures are unlikely to squeeze out on their own accord while testifying before Parliament’s Treasury Committee.
-
14:30
United States Average Hourly Earnings (YoY) below forecasts (4.1%) in February: Actual (4%)
-
14:30
United States Nonfarm Payrolls came in at 151K, below expectations (160K) in February
-
14:30
United States Average Hourly Earnings (MoM) in line with expectations (0.3%) in February
-
14:30
United States Average Weekly Hours below forecasts (34.2) in February: Actual (34.1)
-
14:30
United States U6 Underemployment Rate up to 11% in February from previous 7.5%
-
14:30
United States Labor Force Participation Rate down to 62.4% in February from previous 62.6%
-
14:30
United States U6 Underemployment Rate up to 8% in February from previous 7.5%
-
14:30
United States Unemployment Rate came in at 4.1%, above forecasts (4%) in February
-
14:30
Canada Unemployment Rate came in at 6.6%, below expectations (6.7%) in February
-
14:30
Canada Participation Rate: 65.3% (February) vs previous 65.5%
-
14:30
Canada Capacity Utilization above expectations (79.3%) in 4Q: Actual (79.8%)
-
14:30
Canada Net Change in Employment below expectations (20K) in February: Actual (1.1K)
-
13:51
US Treasury Sec. Bessent: Committed to policies that will lead to strong dollar
In an interview with CNBC on Friday, US Treasury Secretary Scott Bessent said that they are committed to policies that will lead to a strong US Dollar, per Reuters.
Key takeaways
"April 2 tariffs will be a choice for other countries if they want frictionless trade."
"Tariffs are a one-time price adjustment."
"There's going to be a natural adjustment as we move from public to private spending."
"There's going to be a detox period."
"Very unlikely we will get any credit by the CBO for tariffs."
"No change in strong Dollar policy."
"We are against currency manipulation."
"I think we will see a pick up in corporate activity."
"Real income gains for lower 50% of Americans could be an offset."
"Trump wants to get to fair trading with China, we're a long way off."
"China needs to rebalance."
Market reaction
The US Dollar struggles to rebound following these comments. At the time of press, the USD Index was down 0.4% on the day at 103.73.
-
13:16
US Dollar goes for fifth straight day of losses ahead of NFP
- The US Dollar is facing its worst week in over one year.
- Traders are weakening the Greenback further ahead of the US employment report.
- The US Dollar Index faces devastation and devalues over 3.5% so far this week.
The US Dollar Index (DXY), which tracks the performance of the US Dollar (USD) against six major currencies, is having its most horrible week in more than a year, losing over 3.5% since Monday and trading near 103.70 at the time of writing on Friday. The Greenback is undergoing a regime shift where the US Dollar is no longer in the graces of traders. The interest rate differential between the Federal Reserve (Fed) and other central banks is set to narrow after Fed Governor Christopher Waller said on Thursday that there might be two to three rate cuts this year.
On the economic data front, all eyes are on the Nonfarm Payrolls release this Friday. Expectations are for 160,000 jobs gained in February, though the analysts' range could not be wider, with a small 30,000 on the low estimate and the high estimate at 300,000. That means that any print towards 30,000 or even negative could mean another severe leg lower for the Greenback.
Daily digest market movers: NFP already tilted?
- At 13:30 GMT, the US employment report for February is due:
- The Nonfarm Payrolls are expected to come in at 160,000 against the previous 143,000 reading from January.
- The Average Hourly Earnings month-on-month are set to soften to 0.3% against 0.5%.
- The Unemployment Rate should remain steady at 4%.
- At 15:15 GMT, Fed Governor Michelle W. Bowman discusses "Monetary Policy Transmission Post-COVID" at The University of Chicago Booth School of Business 2025 US Monetary Policy Forum in New York.
- At 15:45 GMT, Federal Reserve Bank of New York President John Williams participates in a discussion of the US Monetary Policy Forum Report titled "Monetary Policy Transmission Post-Covid" at the University of Chicago Booth School of Business in Chicago, Illinois.
- At 17:20 GMT, Fed Governor Adriana Kugler speaks on 'The Rebalancing of Labor Markets Across the World' at the Bank of Portugal's Conference on Monetary Policy Transmission and the Labor Market in Lisbon, Portugal.
- At 17:30 GMT, Fed Chair Jerome Powell delivers a speech on the economic outlook at The University of Chicago Booth School of Business 2025 U.S. Monetary Policy Forum in New York.
- At 18:00 GMT, Fed Governor Adriana Kugler delivers a speech on the economic outlook at the University of Chicago Booth School of Business 2025 U.S. Monetary Policy Forum, in New York.
- Equities look very split this Friday with European indices in the red while US futures are marginally in the green.
- After recent US economic data and Fed policymakers’ comments, the CME Fedwatch Tool projects a 46.8% chance of an interest rate cut in the May meeting compared to a 33.3% probability one week ago.
- The US 10-year yield trades around 4.26%, off its near five-month low of 4.10% printed on Tuesday.
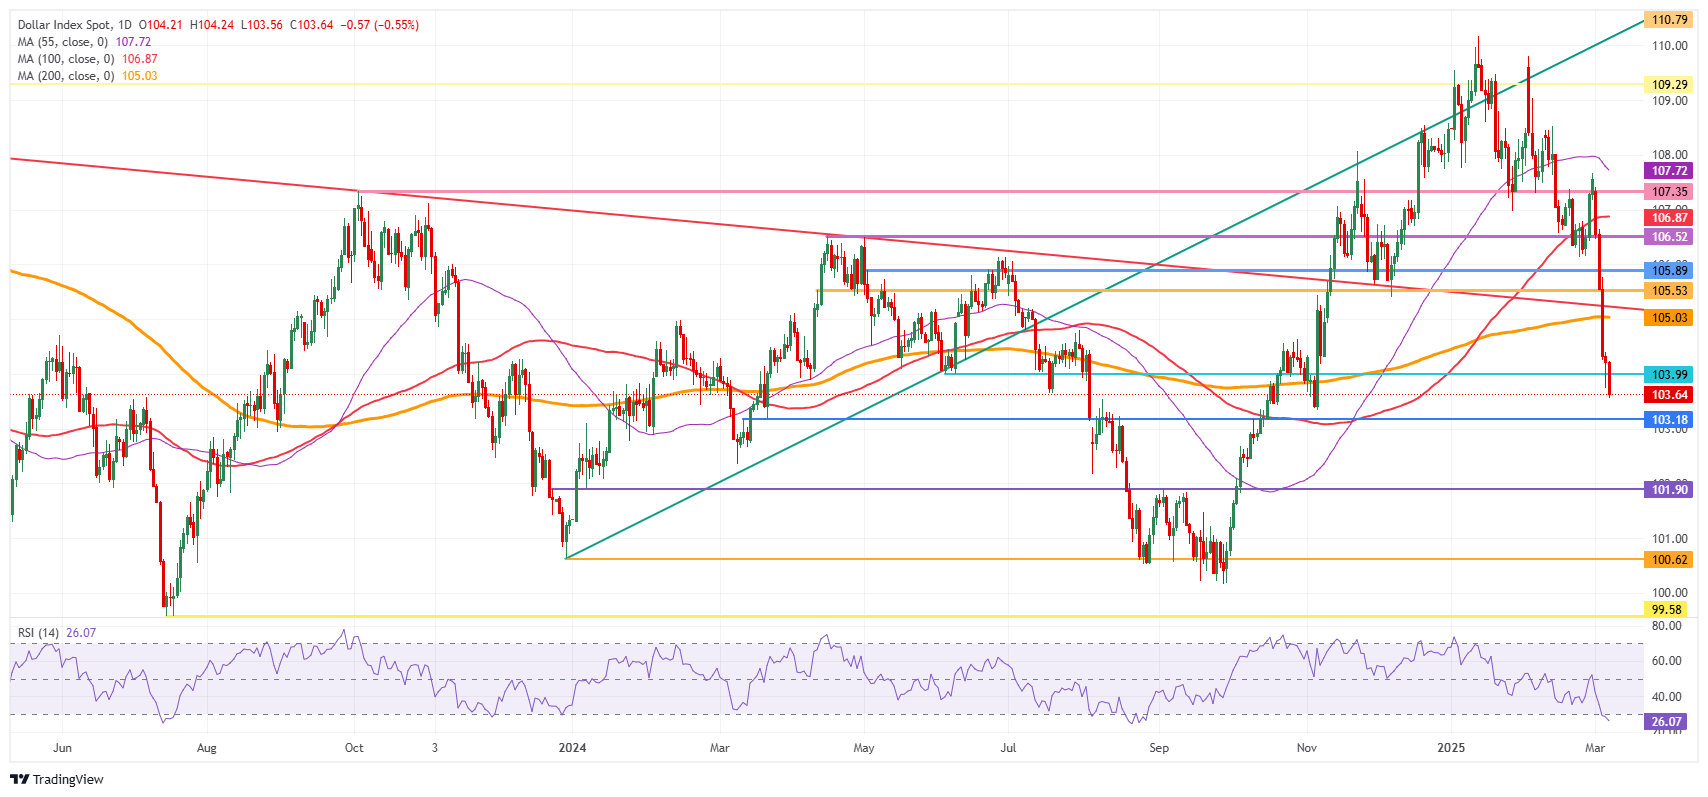
US Dollar Index Technical Analysis: NFP at the worst moment
The US Dollar Index (DXY) is facing a chunky loss this week, with over 3.5% in the red at the time of writing on Friday. The question is whether the Nonfarm Payrolls report can push back and deliver some relief on these losses. However, markets will want to see if the Department of Government Efficiency (DOGE) effect is already impacting the unemployment rate and the change in the Nonfarm Payrolls going forward.
With this week’s sharp decline, the 104.00 round level is being broken at the time of writing on Friday and looks unfit to see a return soon. Further up, the first upside target is to recover the 105.00 round level and the 200-day Simple Moving Average (SMA) at 105.03. Once that zone has been recovered, several near-term resistances are lined up, with 105.53 and 105.89 identified as two heavy pivotal levels before breaking back above 106.00.
On the downside, the 103.00 round level could be considered a bearish target in case US yields roll off again, with even 101.90 not unthinkable if markets further capitulate on their long-term US Dollar holdings.
US Dollar Index: Daily Chart
US-China Trade War FAQs
Generally speaking, a trade war is an economic conflict between two or more countries due to extreme protectionism on one end. It implies the creation of trade barriers, such as tariffs, which result in counter-barriers, escalating import costs, and hence the cost of living.
An economic conflict between the United States (US) and China began early in 2018, when President Donald Trump set trade barriers on China, claiming unfair commercial practices and intellectual property theft from the Asian giant. China took retaliatory action, imposing tariffs on multiple US goods, such as automobiles and soybeans. Tensions escalated until the two countries signed the US-China Phase One trade deal in January 2020. The agreement required structural reforms and other changes to China’s economic and trade regime and pretended to restore stability and trust between the two nations. However, the Coronavirus pandemic took the focus out of the conflict. Yet, it is worth mentioning that President Joe Biden, who took office after Trump, kept tariffs in place and even added some additional levies.
The return of Donald Trump to the White House as the 47th US President has sparked a fresh wave of tensions between the two countries. During the 2024 election campaign, Trump pledged to impose 60% tariffs on China once he returned to office, which he did on January 20, 2025. With Trump back, the US-China trade war is meant to resume where it was left, with tit-for-tat policies affecting the global economic landscape amid disruptions in global supply chains, resulting in a reduction in spending, particularly investment, and directly feeding into the Consumer Price Index inflation.
-
13:00
Brazil Gross Domestic Product (QoQ) registered at 0.2%, below expectations (0.5%) in 4Q
-
13:00
Brazil Gross Domestic Product (YoY) came in at 3.6%, below expectations (4.1%) in 4Q
-
13:00
Mexico Headline Inflation registered at 0.28% above expectations (0.27%) in February
-
13:00
Mexico Core Inflation above expectations (0.46%) in February: Actual (0.48%)
-
13:00
Mexico 12-Month Inflation in line with forecasts (3.77%) in February
-
12:30
India FX Reserves, USD down to $638.7B in February 24 from previous $640.48B
-
12:30
India Bank Loan Growth fell from previous 11.3% to 11% in February 17
-
12:25
Silver Price Forecast: XAG/USD faces pressure near $32.70 with US NFP in focus
- Silver price struggles around $32.70 ahead of the US NFP data for February.
- The US employment data will influence market speculation for the Fed’s monetary policy outlook.
- The Silver price remains supported by global trade war tensions.
Silver price (XAG/USD) faces selling pressure near $32.70 in European trading hours on Friday. The white metal trades cautiously ahead of the United States (US) Nonfarm Payrolls (NFP) data for February, which will be published at 13:30 GMT.
The US NFP data will significantly influence market expectations for the Federal Reserve’s (Fed) monetary policy outlook. Upbeat labor market data would boost market speculation that the Fed will keep interest rates steady in the current range of 4.25%-4.50% for longer. On the contrary, soft numbers would weaken them.
Technically, a restrictive interest rate stance from the Fed bodes poorly for precious metals, such as Silver.
The US NFP report is expected to show that the employers hired 160K workers, higher than 143K recorded in January. The Unemployment Rate is seen steady at 4%. Investors will also focus on the Average Hourly Earnings data, a key measure of wage growth, which is estimated to have grown steadily by 4.1% year-on-year.
Ahead of the US NFP data, the US Dollar Index (DXY), which tracks the Greenback’s value against six major currencies, posts a fresh four-month low near 103.60. 10-year US Treasury yields drops to near 4.27%.
Meanwhile, global trade war tensions continue to offer support to the Silver price. On Thursday, US President Donald Trump confirmed tariff exemptions on products compliant with the United States-Mexico-Canada Agreement (USMCA) till April 2. Trump imposed 25% tariffs on imports from Canada and Mexico on Tuesday.
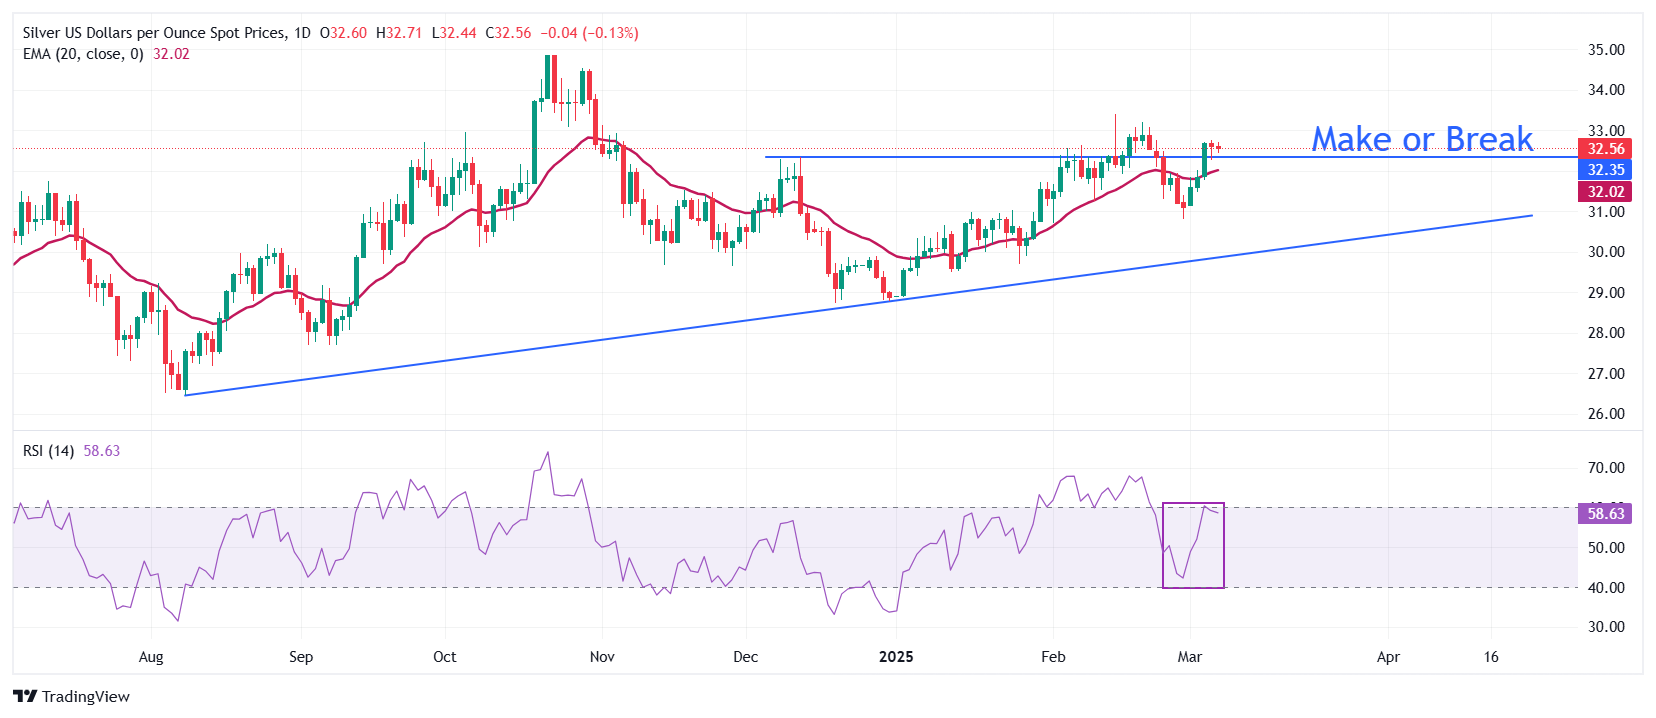
Silver technical analysis
Silver price strives to hold the key resistance of $32.40 plotted from the December 12 high. The asset trades above the 20-day Exponential Moving Average (EMA), which trades around $32.00, suggesting that the near-term trend is bullish.
The 14-day Relative Strength Index (RSI) oscillates inside the 40.00-60.00 range, suggesting a sideways trend.
Looking down, the upward-sloping trendline from the August 8 low of $26.45 will act as key support for the Silver price around $30.00. While, the February 14 high of $33.40 will be the key barrier.
Silver daily chart
Silver FAQs
Silver is a precious metal highly traded among investors. It has been historically used as a store of value and a medium of exchange. Although less popular than Gold, traders may turn to Silver to diversify their investment portfolio, for its intrinsic value or as a potential hedge during high-inflation periods. Investors can buy physical Silver, in coins or in bars, or trade it through vehicles such as Exchange Traded Funds, which track its price on international markets.
Silver prices can move due to a wide range of factors. Geopolitical instability or fears of a deep recession can make Silver price escalate due to its safe-haven status, although to a lesser extent than Gold's. As a yieldless asset, Silver tends to rise with lower interest rates. Its moves also depend on how the US Dollar (USD) behaves as the asset is priced in dollars (XAG/USD). A strong Dollar tends to keep the price of Silver at bay, whereas a weaker Dollar is likely to propel prices up. Other factors such as investment demand, mining supply – Silver is much more abundant than Gold – and recycling rates can also affect prices.
Silver is widely used in industry, particularly in sectors such as electronics or solar energy, as it has one of the highest electric conductivity of all metals – more than Copper and Gold. A surge in demand can increase prices, while a decline tends to lower them. Dynamics in the US, Chinese and Indian economies can also contribute to price swings: for the US and particularly China, their big industrial sectors use Silver in various processes; in India, consumers’ demand for the precious metal for jewellery also plays a key role in setting prices.
Silver prices tend to follow Gold's moves. When Gold prices rise, Silver typically follows suit, as their status as safe-haven assets is similar. The Gold/Silver ratio, which shows the number of ounces of Silver needed to equal the value of one ounce of Gold, may help to determine the relative valuation between both metals. Some investors may consider a high ratio as an indicator that Silver is undervalued, or Gold is overvalued. On the contrary, a low ratio might suggest that Gold is undervalued relative to Silver.
-
12:09
USD/CNH: Set to trade sideways between 7.2300 and 7.2600 – UOB Group
US Dollar (USD) is likely to trade sideways between 7.2300 and 7.2600 vs Chinese Yuan (CNH). In the longer run, downward pressure remains intact; should USD break below 7.2260, the next level to watch is 7.2000, UOB Group's FX analysts Quek Ser Leang and Peter Chia note.
Downward pressure remains intact
24-HOUR VIEW: "Yesterday, we indicated that USD 'could decline gradually, but it does not appear to have enough momentum to break below 7.2260.' Instead of declining, USD traded in a sideways range of 7.2340/7.2524, closing slightly higher (7.2450, +0.14%). There has been no change in either downward or upward momentum, and USD could continue to trade sideways, likely between 7.2300 and 7.2600."
1-3 WEEKS VIEW: "Our update from yesterday (06 Mar, spot at 7.2440) still stands. As highlighted, “the downward pressure remains intact, and should USD break below and hold below 7.2260, the next level to watch is 7.2000.” To maintain the downward pressure, USD must not remain below 7.2800 (‘strong resistance’ level was at 7.2880 yesterday)."
-
12:08
USD/CAD: Unemployment rate is expected at 6.7% vs. 6.6% in January – BBH
Canada’s February labor force report will help shape rate expectations ahead of next week’s Bank of Canada (BOC) policy setting meeting, BBH FX analysts report.
Liberal Party to choose a successor to Prime Minister Justin Trudeau
"Consensus sees a 20k rise in jobs vs. 76k in January, while the unemployment rate is expected at 6.7% vs. 6.6% in January. Overall, the labor market remains soft and firms’ hiring intentions are muted."
"Markets price-in 80% odds of a 25bps BOC policy rate cut at the March 12 meeting given the drag to growth from tariffs uncertainty. Still, we expect the BoC to pause easing next week because core inflation (average of trim and median CPI) is tracking above the BOC’s Q1 projection of 2.5%."
"On Sunday, Liberal Party members will choose a successor to Prime Minister Justin Trudeau. The new leader is expected to face a vote of no confidence once parliament reopens on March 24 which will trigger snap federal elections."
-
11:35
USD/JPY: Room to retest the 147.30 low – UOB Group
Room for US Dollar (USD) to retest the 147.30 low vs Japanese Yen (USD); the next support at 147.00 is unlikely to come under threat. In the longer run, increase in downward momentum suggests USD could weaken to 147.00, UOB Group's FX analysts Quek Ser Leang and Peter Chia note.
USD can weaken to 147.00
24-HOUR VIEW: "Yesterday (Thursday), we indicated that Wednesday’s price action 'has resulted in a slight increase in downward momentum.' We expected USD to 'edge lower,' but we viewed 'any weakness as a part of lower 148.00/150.00 range.' However, USD broke decisively below 148.00, plunging to a low of 147.30. Despite rebounding from the low, the weakness in USD not quite stabilised. Today, there is room for USD to retest the 147.30 low. The next support at 147.00 is unlikely to come under threat. Resistance is at 148.35; a breach of 148.70 would indicate that the weakness has stabilised."
1-3 WEEKS VIEW: "The following are excerpts from our update yesterday (06 Mar, spot at 149.25): 'As highlighted, the recent failure to hold below 148.50 suggests USD could enter a period of indecision, trading in 148.00/151.50 for now. Looking ahead, should USD break decisively below 148.00, it could potentially trigger a sharp decline.' We did not expect USD to easily breach 148.00 and plummet to 147.30. The price action has led to an increase in momentum. From here, we expect USD to weaken to 147.00, provided that the ‘strong resistance’ level, currently at 149.30, remains intact."
-
11:34
USD/CAD Price Forecast: Trades indecisively around 1.4300 ahead of US/Canada Employment data
- USD/CAD wobbles around 1.4300 ahead of the US/Canada labor market data for February.
- US President Trump has announced tariff relaxation on a number of imports from Canada and Mexico.
- The US Dollar Index posts a fresh four-month low near 103.60.
The USD/CAD pair trades in a tight range around 1.4300 in European trading hours on Friday. The Loonie pair struggles for direction as investors await the employment data for February from both the United States (US) and Canada.
The US NFP report is expected to show that the economy added 160K fresh workers, higher than 143K recorded in January. The Unemployment Rate is seen steady at 4%.
In the Canadian region, economists see a fresh addition of 20K workers, fewer than 76K in January. The jobless rate is expected to have accelerated to 6.7% from 6.6% in January.
Meanwhile, the Canadian Dollar (CAD) failed to discover an interim relief despite US President Donald Trump's confirmed tariff exemption on a significant number of products compliant with the United States-Mexico-Canada agreement (USMCA). The CAD is almost sideways against the US Dollar (USD) despite the latter has extended its downside. The US Dollar Index (DXY), which tracks the Greenback’s value against six major currencies, tumbles to near 103.60, the lowest level seen in four months.
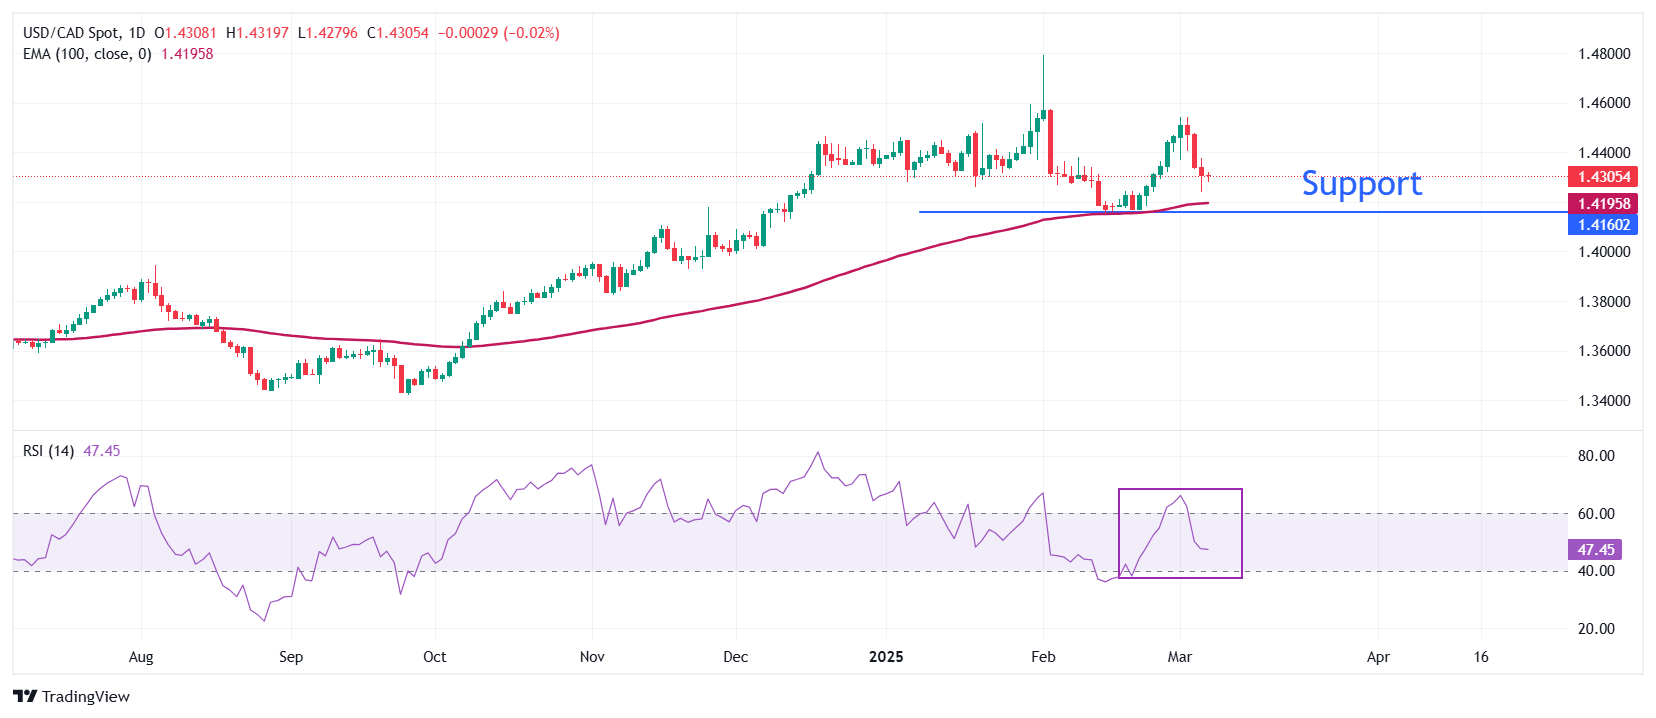
USD/CAD trades inside Thursday’s trading range around 1.4300 on Friday. The Loonie pair holds above the 100-period Exponential Moving Average (EMA), which is around 1.4200, suggesting that the overall trend is bullish.
The 14-period Relative Strength Index (RSI) oscillates in the 40.00-60.00 range, suggesting a sideways trend.
Going forward, an upside move above the February 9 high of 1.4380 will open the door toward the round-level hurdle of 1.4400 and the psychological resistance of 1.4500.
On the contrary, a breakdown below the February 14 low of 1.4151 by the pair would expose it to the December 9 low of 1.4094, followed by the December 6 low of 1.4020.
USD/CAD daily chart
US Dollar FAQs
The US Dollar (USD) is the official currency of the United States of America, and the ‘de facto’ currency of a significant number of other countries where it is found in circulation alongside local notes. It is the most heavily traded currency in the world, accounting for over 88% of all global foreign exchange turnover, or an average of $6.6 trillion in transactions per day, according to data from 2022. Following the second world war, the USD took over from the British Pound as the world’s reserve currency. For most of its history, the US Dollar was backed by Gold, until the Bretton Woods Agreement in 1971 when the Gold Standard went away.
The most important single factor impacting on the value of the US Dollar is monetary policy, which is shaped by the Federal Reserve (Fed). The Fed has two mandates: to achieve price stability (control inflation) and foster full employment. Its primary tool to achieve these two goals is by adjusting interest rates. When prices are rising too quickly and inflation is above the Fed’s 2% target, the Fed will raise rates, which helps the USD value. When inflation falls below 2% or the Unemployment Rate is too high, the Fed may lower interest rates, which weighs on the Greenback.
In extreme situations, the Federal Reserve can also print more Dollars and enact quantitative easing (QE). QE is the process by which the Fed substantially increases the flow of credit in a stuck financial system. It is a non-standard policy measure used when credit has dried up because banks will not lend to each other (out of the fear of counterparty default). It is a last resort when simply lowering interest rates is unlikely to achieve the necessary result. It was the Fed’s weapon of choice to combat the credit crunch that occurred during the Great Financial Crisis in 2008. It involves the Fed printing more Dollars and using them to buy US government bonds predominantly from financial institutions. QE usually leads to a weaker US Dollar.
Quantitative tightening (QT) is the reverse process whereby the Federal Reserve stops buying bonds from financial institutions and does not reinvest the principal from the bonds it holds maturing in new purchases. It is usually positive for the US Dollar.
-
11:29
EU gas prices go down – Danske Bank
European natural gas prices have been on decline recently and fell to the lowest level since last October yesterday below EUR40/MWh, Danske Bank's FX analyst Kirstine Kundby-Nielsen reports.
Oil and coal prices have also set new lows recently
"The move follows the overall trend lower in energy prices, where oil and coal prices have also set new lows recently. Warmer weather in Europe and flexibility when it comes to rebuild of gas storages before next winter has also contributed."
-
11:15
NZD/USD: Set to trade in a range of 0.5710/0.5760 – UOB Group
Further range trading in New Zealand Dollar (NZD) vs US Dollar (USD) seems likely; probably in a range of 0.5710/0.5760. In the longer run, current price movements are likely part of a recovery phase that could reach 0.5775, UOB Group's FX analysts Quek Ser Leang and Peter Chia note.
Current price movements are likely part of a recovery phase
24-HOUR VIEW: "While we expected NZD to 'rise further' yesterday, we indicated that 'overbought conditions suggest the major resistance at 0.5775 is out of reach for now.' However, NZD did not quite 'rise further,' as it traded in a higher range of 0.5721/0.5760, closing modestly higher by 0.13% at 0.5734. Further range trading seems likely today, probably in a range of 0.5710/0.5760."
1-3 WEEKS VIEW: "Our update from yesterday (06 Mar, spot at 0.5720) remains valid. As highlighted, the 'current price movements are likely part of a recovery phase that could reach 0.5775.' Our view will be invalidated if NZD breaks below 0.5660 (‘strong support’ level was at 0.5640 yesterday)."
-
11:11
EUR/USD: Potential catalysts can drive additional gains in the pair – Danske Bank
EUR/USD has largely stabilized around the 1.08 mark following this week's rally, driven by the seismic shift in fiscal spending in the euro area, Danske Bank's FX analyst Kirstine Kundby-Nielsen reports.
Further upside potential for EUR/USD on a tactical basis
"As expected, the ECB meeting had a limited impact after the widely anticipated 25bp rate cut. The central bank maintained a meeting-by-meeting approach with no pre-commitment to a specific rate path. However, a shift in the ECB's statement, describing policy as now 'meaningfully less restrictive,' signalled that the current rate level is closer to the terminal rate, initially providing a slight boost to EUR/USD."
"Today, the focus shifts to the US NFP report for February. We expect a print of 120k, below the market consensus of 160k - a downside surprise that, if realized, could put downward pressure on US yields and the broad USD. Overall, we see further upside potential for EUR/USD on a tactical basis."
"While EUR optimism from increased fiscal spending may now be largely priced in, potential catalysts such as a ceasefire deal in Ukraine or a further deterioration in the US cyclical macro outlook - especially the latter - could drive additional gains in the pair over the next 1-3M."
-
11:06
AUD/USD: Expected to trade in a range between 0.6300 and 0.6350 – UOB Group
Australian Dollar (AUD) is expected to trade in a range between 0.6300 and 0.6350 vs US Dollar (USD). In the longer run, rapid increase in momentum suggests AUD could recover, potentially reaching 0.6410, UOB Group's FX analysts Quek Ser Leang and Peter Chia note.
Rapid increase in momentum suggests AUD can recover
24-HOUR VIEW: "Yesterday, we expected AUD to 'continue to strengthen.' However, we held the view that it 'it does not seem to have enough momentum to reach 0.6410'. We pointed out, 'there is another resistance at 0.6370.' During the NY session, AUD rose briefly to 0.6364 before easing to close largely flat at 0.6332 (-0.05%). The brief advance did not result in any increase in momentum, and we expect range trading today, likely between 0.6300 and 0.6350."
1-3 WEEKS VIEW: "We revised our view from negative to positive yesterday (06 Mar, spot at 0.6330). We highlighted that the strong advance from two days ago 'has resulted in a rapid increase in momentum,' and AUD 'could recover, potentially reaching 0.6410.' Our view remains unchanged. To sustain the momentum, AUD must hold above 0.6265 (‘strong support’ level was at 0.6235 yesterday)."
-
11:00
Greece Unemployment Rate (QoQ) rose from previous 9% to 9.5% in 4Q
-
11:00
Eurozone Gross Domestic Product s.a. (YoY) came in at 1.2%, above expectations (0.9%) in 4Q
-
11:00
Eurozone Employment Change (YoY) above forecasts (0.6%) in 4Q: Actual (0.7%)
-
11:00
Greece Gross Domestic Product s.a (YoY) climbed from previous 2.4% to 2.6% in 4Q
-
11:00
Eurozone Employment Change (QoQ) meets forecasts (0.1%) in 4Q
-
11:00
Eurozone Gross Domestic Product s.a. (QoQ) above forecasts (0.1%) in 4Q: Actual (0.2%)
-
10:54
EUR/USD advances as US Dollar slumps ahead of US NFP
- EUR/USD climbs above 1.0850 as the US Dollar underperforms ahead of the US NFP data release for February.
- US President Trump announced exemptions on more products imported from Canada and Mexico.
- German debt reforms have forced traders to pare ECB dovish bets.
EUR/USD jumps above 1.0850 in Friday’s European session and revisits a four-month high. The major currency pair exhibits strength as the US Dollar (USD) weakens ahead of the United States (US) Nonfarm Payrolls (NFP) data for February, which will be published at 13:30 GMT. The US Dollar Index (DXY), which tracks the Greenback’s value against six major currencies, extends its losing streak for the fifth trading day and slumps to a four-month low of around 103.60.
The Greenback has remained on the backfoot as investors have become increasingly concerned over the United States (US) economic outlook due to uncertainty over President Donald Trump’s tariff agenda. Market participants believe that the pressure of higher tariffs will be borne by US importers, who would pass on the impact to consumers. Such a scenario would diminish their purchasing power and, eventually, the domestic demand.
On Thursday, Trump announced tariff relaxations on a number of products, which come under the purview of the United States-Mexico-Canada Agreement (USMCA) until April 2, the same day when he is expected to introduce reciprocal tariffs. The US President imposed 25% levies on Canada and Mexico on Tuesday but provided a one-month exemption on automobiles after discussing with the big three US carmakers on Wednesday.
The US NFP report is expected to show that the economy added 160K fresh workers, higher than the 143K recorded in January. The Unemployment Rate is seen steady at 4%. Meanwhile, Average Hourly Earnings, a key measure of wage growth, is anticipated to have risen steadily by 4.1% year-on-year. Month-on-month wage growth measure is estimated to have grown at a slower pace of 0.3%, compared to 0.5% in January. The official labor market data will significantly influence market expectations for the Federal Reserve’s (Fed) monetary policy outlook.
Daily digest market movers: EUR/USD strengthens as traders reassess ECB dovish bets on German debt reforms
- Strength in the EUR/USD pair is also driven by the Euro’s (EUR) outperformance on diminishing European Central Bank (ECB) dovish bets due to German debt reforms. Market participants believe that the confirmation of creating a 500 billion Euro (EUR) infrastructure fund and reforms in the so-called “debt brake” by German officials will be inflationary for the economy. Such a scenario would force the ECB to slow down the pace of the monetary expansion cycle.
- However, ECB President Christine Lagarde refrained from gauging the impact of German debt reforms in the press conference after the interest rate decision on Thursday and said the increased defense and infrastructure spending is still a "work in progress" and the ECB "needs time" to understand the impact.
- Traders have revised downward their expectations for the ECB’s monetary policy outlook and think that the central bank could pause the interest rate cut cycle in April after easing five times in a row. Before the monetary policy meeting on Thursday, traders had fully priced in two more interest rate cuts by the summer.
- Christine Lagarde didn’t provide a specific rate-cut plan and reiterated that the central bank remains “data-dependent” and decisions on rates will be made on a “meeting-by-meeting basis" after the ECB reduced the Deposit Facility rate by 25 basis points (bps) to 2.5%, as expected. Lagarde guided that risks to economic growth remain tilted to the “downside” and Trump’s tariff war could weigh on the Eurozone economy further.
- The next major trigger for the Euro is discussions over boosting defense and infrastructure spending as well as sweeping changes to state borrowing rules at Germany's lower house of parliament from March 13. The Bundestag (German parliament) lower house will vote on the "debt brake" reforms on March 18, Reuters reported.
Technical Analysis: EUR/USD rallies above 1.0850
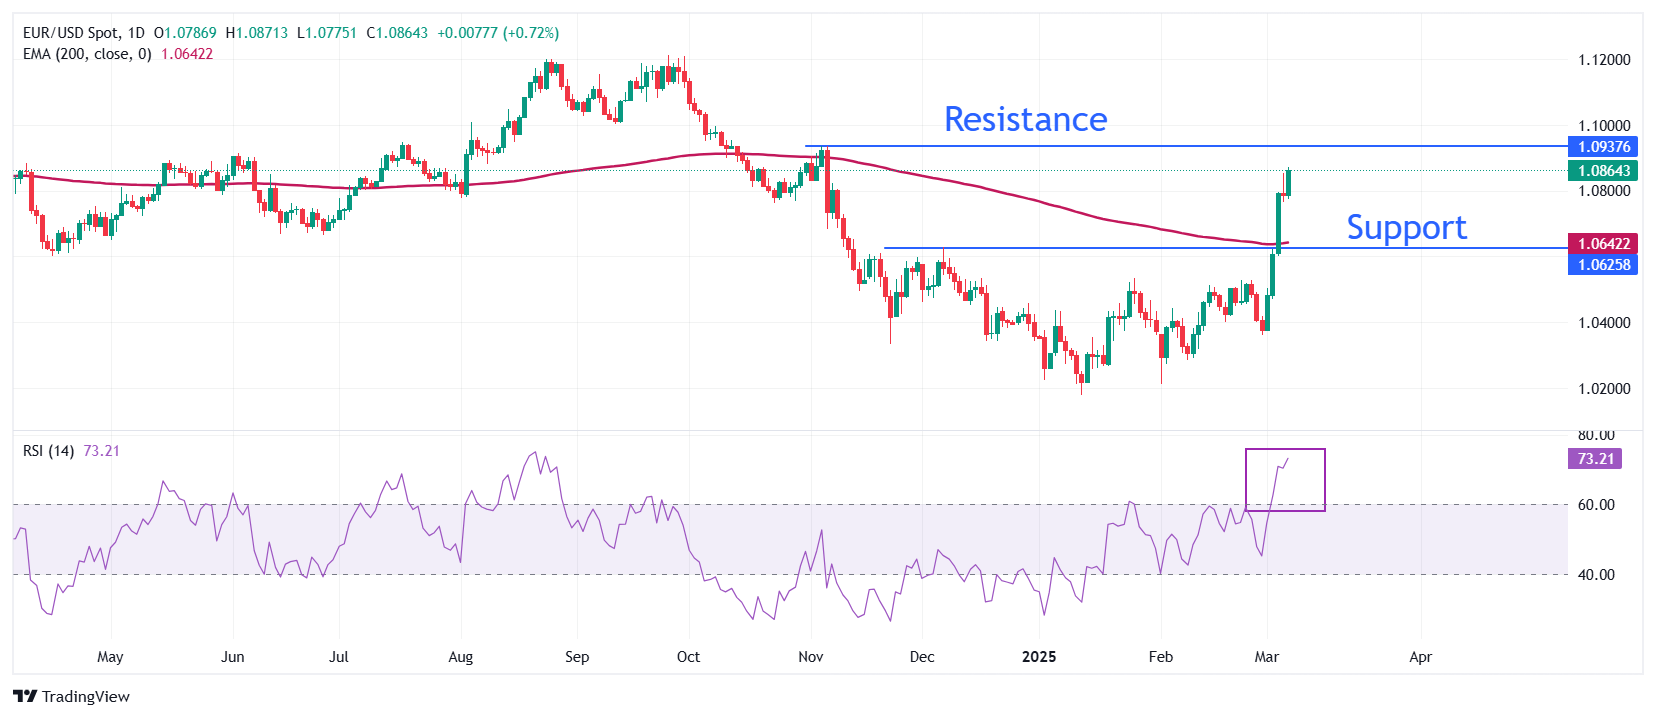
EUR/USD surges to over 1.0850 on Friday after a decisive breakout above the December 6 high of 1.0630 earlier this week. The long-term outlook of the major currency pair is bullish as it holds above the 200-day Exponential Moving Average (EMA), which trades around 1.0640.
The 14-day Relative Strength Index (RSI) jumps above 70.00, indicating a strong bullish momentum.
Looking down, the December 6 high of 1.0630 will act as the major support zone for the pair. Conversely, the November 6 high of 1.0937 and the psychological level of 1.1000 will be key barriers for the Euro bulls.
Euro FAQs
The Euro is the currency for the 19 European Union countries that belong to the Eurozone. It is the second most heavily traded currency in the world behind the US Dollar. In 2022, it accounted for 31% of all foreign exchange transactions, with an average daily turnover of over $2.2 trillion a day. EUR/USD is the most heavily traded currency pair in the world, accounting for an estimated 30% off all transactions, followed by EUR/JPY (4%), EUR/GBP (3%) and EUR/AUD (2%).
The European Central Bank (ECB) in Frankfurt, Germany, is the reserve bank for the Eurozone. The ECB sets interest rates and manages monetary policy. The ECB’s primary mandate is to maintain price stability, which means either controlling inflation or stimulating growth. Its primary tool is the raising or lowering of interest rates. Relatively high interest rates – or the expectation of higher rates – will usually benefit the Euro and vice versa. The ECB Governing Council makes monetary policy decisions at meetings held eight times a year. Decisions are made by heads of the Eurozone national banks and six permanent members, including the President of the ECB, Christine Lagarde.
Eurozone inflation data, measured by the Harmonized Index of Consumer Prices (HICP), is an important econometric for the Euro. If inflation rises more than expected, especially if above the ECB’s 2% target, it obliges the ECB to raise interest rates to bring it back under control. Relatively high interest rates compared to its counterparts will usually benefit the Euro, as it makes the region more attractive as a place for global investors to park their money.
Data releases gauge the health of the economy and can impact on the Euro. Indicators such as GDP, Manufacturing and Services PMIs, employment, and consumer sentiment surveys can all influence the direction of the single currency. A strong economy is good for the Euro. Not only does it attract more foreign investment but it may encourage the ECB to put up interest rates, which will directly strengthen the Euro. Otherwise, if economic data is weak, the Euro is likely to fall. Economic data for the four largest economies in the euro area (Germany, France, Italy and Spain) are especially significant, as they account for 75% of the Eurozone’s economy.
Another significant data release for the Euro is the Trade Balance. This indicator measures the difference between what a country earns from its exports and what it spends on imports over a given period. If a country produces highly sought after exports then its currency will gain in value purely from the extra demand created from foreign buyers seeking to purchase these goods. Therefore, a positive net Trade Balance strengthens a currency and vice versa for a negative balance.
-
10:54
USD: The dollar is fragile – ING
This week's events have added to the appeal of FX as an asset class. We have seen two completely independent stories emerge in the US and Europe, narrowing the wedge between growth, interest rates and currency valuation, ING's FX analyst Chris Turner notes.
Consolidation in the 103.75-104.50 area may be the order of the day
"Here the new US Administration's highly uncertain tariff policy looks to be damaging confidence and impacting activity. My colleague, James Smith, made a great point this week referring to Brexit; UK investment slumped in the run up to the anti-EU vote given the uncertainty. However, it rebounded strongly even after what was perceived as a bad trade deal was signed. The same can be true of the US, where businesses and consumers just want some certainty and are not getting it so far."
"Some softer US data and the year-to-date fall in US equities have seen short-dated US swap rates - so important for dollar pricing - drop 45bp from last month's peak. Markets are now starting to push the terminal rate for the Fed easing cycle under 3.50%. Maybe this has come a little too far, a little too fast, but today's February jobs number should have some say about that. The market looks to be positioned for some soft data. The consensus is for a 160k gain and the unemployment rate to stay low at 4.0%."
"The US Dollar (USD) is fragile and would be hit by a soft number. However, the DXY has already seen its biggest weekly drop since November 2022 and current long dollar positioning is probably nowhere near where it was in late 2022 after a two-year dollar rally. 104.00 looks decent support in DXY, but unless we get a big downside miss in today's jobs reports, a little consolidation in the 103.75-104.50 area may be the order of the day. Given this week's events and the fact that DXY is heavily weighted towards European currencies, it seems fair to say that DXY has now topped for the year."
-
10:47
GBP/USD: Outlook for GBP remains positive – UOB Group
Strong momentum appears to be slowing; Pound Sterling (GBP) is likely to trade in a 1.2850/1.2925 range vs US Dollar (USD). In the longer run, outlook for GBP remains positive; the next technical target is at 1.2975, UOB Group's FX analysts Quek Ser Leang and Peter Chia note.
The next technical target for GBP/USD is at 1.2975
24-HOUR VIEW: "Following the strong rise in GBP two days ago, we indicated yesterday that 'although deeply overbought, GBP appears to have enough momentum to rise further.' We pointed out, 'The levels to monitor are 1.2930 and 1.2975.' However, GBP rose less than expected to 1.2924. It ended the day largely flat at 1.2882 (-0.09%). The strong upward momentum over the past few days appears to be slowing. Today, we expect GBP to trade in a 1.2850/1.2925 range."
1-3 WEEKS VIEW: "We stated yesterday (07 Mar, spot at 1.2890) that 'the outlook for GBP remains positive.' We highlighted that 'the next technical target is at 1.2975.' There is no change in our view. On the downside, a breach of 1.2780 (‘strong support’ level was at 1.2760 yesterday) would mean that GBP is not strengthening further."
-
10:44
USD/CAD: US postpones the imposition of tariffs on Canada – OCBC
The United States has once again postponed the imposition of tariffs on Canada until April 2nd. Coupled with the continuous weakening of the US Dollar (USD) and the stabilization of oil prices, the Canadian Dollar (CAD) continued to rise, by 0.30% on Thursday, against the US dollar, OCBC's FX analysts Frances Cheung and Christopher Wong note.
USD/CAD to trade in a wider range between 1.4194-1.4793
"The temporary tariff deferral only applies to Canadian export products that meet the requirements of the Canada-United States-Mexico Agreement, and approximately 62% of Canadian imported products may still face a 25% tariff."
"Canada stated that it will not lift the tariffs previously imposed on US goods worth CAD 30 billion but agreed to postpone the second round of retaliatory tariffs worth CAD 125 billion until April 2nd. It is expected that the currency pair will continue to be volatile in the short term, with two-way trades."
"Pay attention to the trading range of 1.4300-1.4542, and a wider range is between 1.4194-1.4793."
-
10:36
CAD: Eyes on jobs data after tariff relief – ING
The Canadian dollar rallied yesterday on the US announcement that USMCA-compliant products would be exempt from tariffs until 3 April, ING's FX analyst Chris Turner notes.
Downside risks for USD/CAD are limited
"Almost all US-Canada-Mexico trade falls under USMCA, even though not all exporters are compliant with the Agreement's rules. Markets had never priced in 25% tariffs as a long-lasting measure, and USD/CAD had already corrected from the highs before yesterday's move."
"Today, we'll watch Canadian jobs figures for February ahead of next week's Bank of Canada meeting. Consensus is for a 20k change in employment, and we think we'll need to see a very strong figure to cast doubts on a cut next week."
"We believe the downside risks for USD/CAD are limited given the prospect of Canada still being hit by reciprocal tariffs in April. A return to 1.44 in the coming weeks is entirely possible, but today's US payrolls can still add some pressure."
-
10:33
EUR/USD: Uptrend remains intact – UOB Group
The current price movements are likely part of a range trading phase, probably between 1.0740 and 1.0840. In the longer run, uptrend remains intact, but it is unclear for now if EUR can reach 1.0945 vs US Dollar (USD), UOB Group's FX analysts Quek Ser Leang and Peter Chia note.
EUR may not reach 1.0945 near term
24-HOUR VIEW: "After the remarkable rally in EUR two days ago, we highlighted yesterday that 'while EUR could rise above 1.0825 today, it remains to be seen if it can maintain a foothold above this level.' We added, 'the next key resistance lies significantly higher at 1.0945, which is unlikely to come into view today.' During the NY session, EUR rose to 1.0853, pulling back quickly to close largely unchanged at 1.0783 (-0.06%). The current price movements are likely part of a range trading phase, probably between 1.0740 and 1.0840."
1-3 WEEKS VIEW: "Yesterday (06 Mar, spot at 1.0795), we reiterated our bullish view, indicating that 'the next two key technical targets to monitor are 1.0825 and 1.0945.' We also indicated that 'the former appears to be within reach, but it is uncertain for now if EUR can reach 1.0945 during this phase of rally.' EUR subsequently rose to 1.0853 before closing at 1.0783 (-0.06%). While the uptrend remains intact, at this stage, it is unclear for now if EUR can reach 1.0945. Overall, only a breach of 1.0640 (no change in ‘strong support’ level) would suggest that the rally over the past few days is taking a pause."
-
10:30
Silver price today: Silver broadly unchanged, according to FXStreet data
Silver prices (XAG/USD) broadly unchanged on Friday, according to FXStreet data. Silver trades at $32.63 per troy ounce, broadly unchanged 0.07% from the $32.61 it cost on Thursday.
Silver prices have increased by 12.92% since the beginning of the year.
Unit measure Silver Price Today in USD Troy Ounce 32.63 1 Gram 1.05
The Gold/Silver ratio, which shows the number of ounces of Silver needed to equal the value of one ounce of Gold, stood at 89.56 on Friday, up from 89.21 on Thursday.
Silver FAQs
Silver is a precious metal highly traded among investors. It has been historically used as a store of value and a medium of exchange. Although less popular than Gold, traders may turn to Silver to diversify their investment portfolio, for its intrinsic value or as a potential hedge during high-inflation periods. Investors can buy physical Silver, in coins or in bars, or trade it through vehicles such as Exchange Traded Funds, which track its price on international markets.
Silver prices can move due to a wide range of factors. Geopolitical instability or fears of a deep recession can make Silver price escalate due to its safe-haven status, although to a lesser extent than Gold's. As a yieldless asset, Silver tends to rise with lower interest rates. Its moves also depend on how the US Dollar (USD) behaves as the asset is priced in dollars (XAG/USD). A strong Dollar tends to keep the price of Silver at bay, whereas a weaker Dollar is likely to propel prices up. Other factors such as investment demand, mining supply – Silver is much more abundant than Gold – and recycling rates can also affect prices.
Silver is widely used in industry, particularly in sectors such as electronics or solar energy, as it has one of the highest electric conductivity of all metals – more than Copper and Gold. A surge in demand can increase prices, while a decline tends to lower them. Dynamics in the US, Chinese and Indian economies can also contribute to price swings: for the US and particularly China, their big industrial sectors use Silver in various processes; in India, consumers’ demand for the precious metal for jewellery also plays a key role in setting prices.
Silver prices tend to follow Gold's moves. When Gold prices rise, Silver typically follows suit, as their status as safe-haven assets is similar. The Gold/Silver ratio, which shows the number of ounces of Silver needed to equal the value of one ounce of Gold, may help to determine the relative valuation between both metals. Some investors may consider a high ratio as an indicator that Silver is undervalued, or Gold is overvalued. On the contrary, a low ratio might suggest that Gold is undervalued relative to Silver.
(An automation tool was used in creating this post.)
-
10:29
EUR: Major re-rating is underway – ING
ING's macro and market team have looked through this week's European events. If passed in full, the German infrastructure fund could add 1% p.a. to German growth. The ECB's terminal rate for the easing cycle will be 2.25% not 1.75%. The decline in views of secular stagnation in Europe can see the 10 year EUR swap rate (now 2.70%) head to 3.50%. Looser fiscal and tighter monetary policy in the eurozone have shifted our forecast EUR/USD range to 1.05-1.10 from 1.00-1.05, ING's FX analyst Chris Turner notes.
EUR/USD may struggle to get above the 1.0850/75 area
"In the short term, EUR/USD looks a little overbought and may struggle to get above the 1.0850/75 area. But there now should be good support in the 1.0670/0700 area and investors will now be looking to buy EUR/USD on dips given this week's developments."
"If a major re-weighting of the euro is underway, which could be possible depending on the severity of US tariffs in April, then this will be played out against major trading partners. Looking at the weightings of the ECB's trade-weighted euro against 41 trading partners, the biggest weights in the index are USD and CNY at 15%, GBP at 10% and CHF at 6%."
"Beyond EUR/USD, we also think the market will start to focus on EUR/CNH upside. China has already been the recipient of 20% tariffs this year and more are likely in April. EUR/CNH moving to 8.00 and possibly the 2023 high at 8.12 looks the story for the next couple of months."
-
10:22
China: Exports slowed more than expected in January-February – UOB Group
China’s export growth slowed more than expected while import slumped in the first two months of the year as the first 10% of US tariffs kicked in from 4 February, UOB Group's Economist Ho Woei Chen reports.
Further weakness expected in March as more tariffs kick in
"China’s export growth slowed more than expected while import slumped in the first two months of the year as the first 10% of US tariffs kicked in from 4 February and China retaliated with 10%-15% tariffs on certain US energy goods, farm equipment, cars and trucks from 10 February."
"Exports to key markets including ASEAN and US continued to grow but at a sharply slower pace compared to December. This might have been supported by further frontloading ahead of US tariffs starting on 4 February and 4 March. Thus, we expect more weakness in the trade numbers in Mar as we reached the tail end of frontloading activities until more tariffs are announced."
"Although the announced additional tariff rates on Chinese goods are within our base case assumption, the developments remain fluid and unpredictable, and we can still expect many more iterations in the remaining of Trump’s 4-year term. We currently factor in marginal growth of around 1.0% for both China’s exports and imports in 2025."
-
10:16
Gold consolidates further while chances for new all-time highs this week start to fade
- Gold faces some further pressure after the Trump administration loosens tariff pressure for Mexico and Canada.
- US yields have recovered a touch while Fed’s Waller sees chances for two or even three rate cuts this year.
- Traders brace for the Nonfarm Payrolls release for February this Friday.
Gold’s price (XAU/USD) stabilizes and seems to be consolidating for the third day in a row this week. The rally in Bullion stalls after US President Donald Trump shielded off all goods from Mexico and Canada that fall under the USMCA trade agreement from its freshly baked tariffs that got implemented earlier this week. Meanwhile, US equity markets trade below where they were on President Trump’s inauguration day.
On the rates side, traders got some support from Federal Reserve (Fed) official Christopher Waller, who said on Thursday that he wouldn’t support lowering interest rates in March but sees room to cut two, or possibly three, times this year. This coincides with what markets expected, with June being the first pivotal moment for the Fed to cut interest rates this year.
Daily digest market movers: Fed’s on board
- Tensions rise between the world’s two largest economies, the US and China. Chinese Foreign Minister Wang Yi defended his nation’s actions on stemming the flow of fentanyl to the US on Friday at a high-profile briefing and accused US President Donald Trump of using the issue as a pretext to pressure his government, Bloomberg reports.
- Anticipations were high for the crypto industry after President Donald Trump signed a long-awaited order creating a strategic Bitcoin reserve and an additional stockpile of other digital assets. However, Bitcoin tanked below $90,000 after it turned out that only already owned tokens would be centralized and no new Bitcoin would be bought with taxpayers’ money, Bloomberg reports.
- “If the labor market, everything, seems to be holding, then you can just kind of keep an eye on inflation,” Fed’s Waller said on Thursday at the Wall Street Journal CFO Network Summit. “If you think it’s moving back towards the target, you can start lowering rates. I wouldn’t say at the next meeting, but could certainly see going forward.”, Waller added, Reuters reports.
- Australia shipped a record amount of Gold to the US in January, as fears over potential tariffs saw traders rush to deliver metal into New York warehouses in order to capitalize on extreme price dislocations between key markets. Exports to the US totaled A$4.6 billion ($2.9 billion) in the month — the highest amount in records dating back to 1995, the Australian Bureau of Statistics said in its latest monthly trade report, Bloomberg reports.
Technical Analysis: Equilibrium for now
Bets on interest rate cuts by the Federal Reserve are now starting to get support from the central bank’s policymakers. This should support Gold’s price throughout the year, though it might not be enough to push Gold to fresh all-time highs for now. For that, a fresh catalyst, such as new tariffs or another page in the trade war book, would need to occur.
While Gold trades near $2,917 at the time of writing, the daily Pivot Point at $2,910 and the daily R1 resistance at $2,928 are the key levels to watch for on Friday. In case Gold sees more inflows, the daily R2 resistance at $2,945 will possibly be the final cap ahead of the all-time high of $2,956 reached on February 24.
On the downside, the $2,900 psychological big figure and the S1 support at $2,893 acts as a double support barrier. If Bullion bulls want to avoid another leg lower, that zone must hold. Further down, the daily S2 support at $2,874 should be able to catch any additional downside pressure.
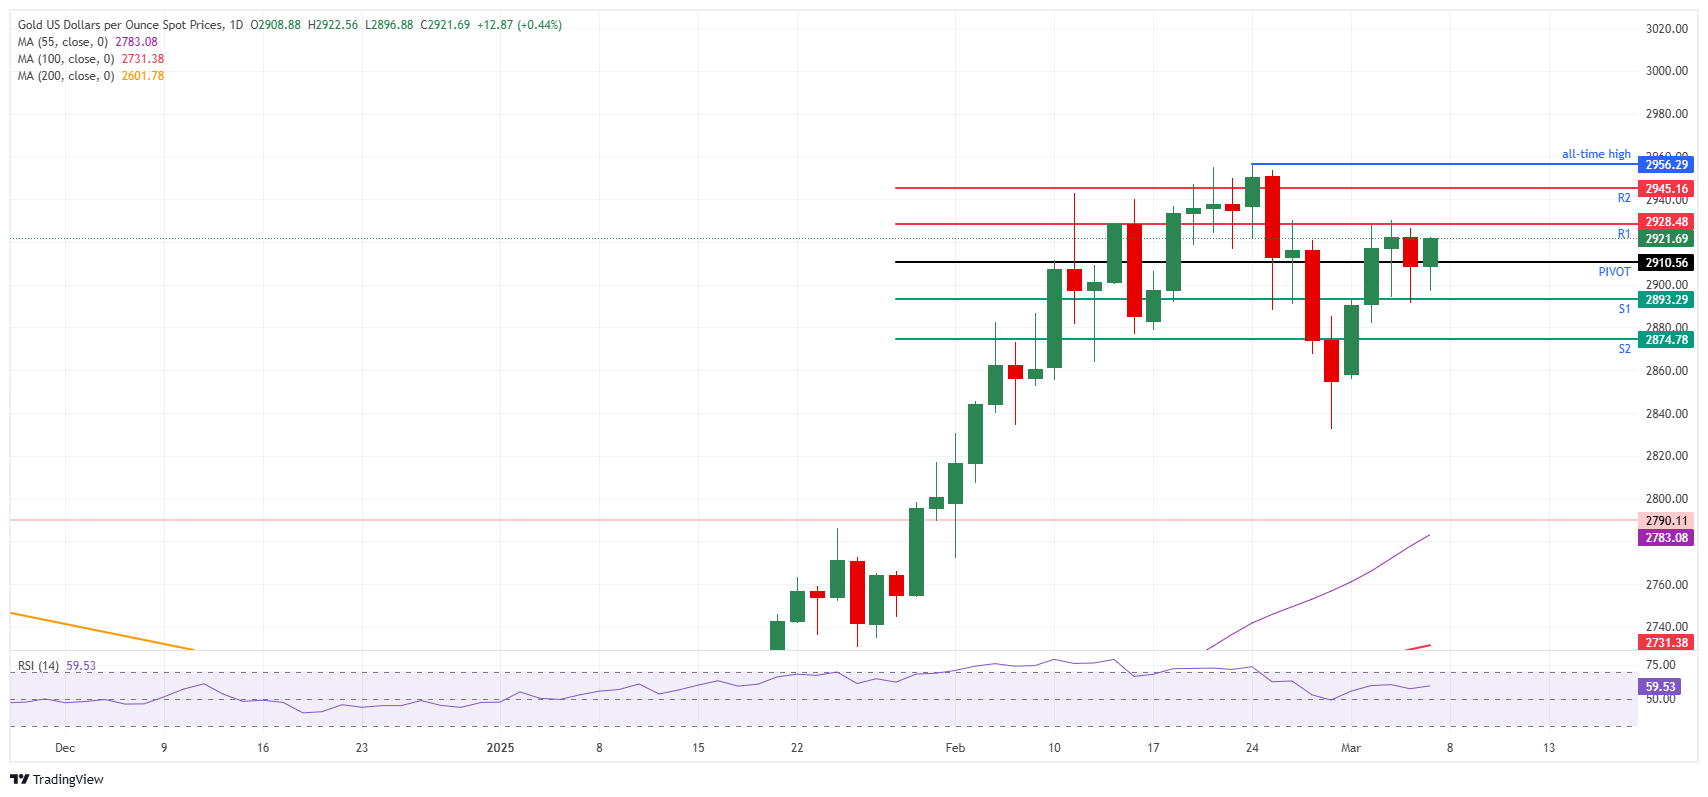
XAU/USD: Daily Chart
Gold FAQs
Gold has played a key role in human’s history as it has been widely used as a store of value and medium of exchange. Currently, apart from its shine and usage for jewelry, the precious metal is widely seen as a safe-haven asset, meaning that it is considered a good investment during turbulent times. Gold is also widely seen as a hedge against inflation and against depreciating currencies as it doesn’t rely on any specific issuer or government.
Central banks are the biggest Gold holders. In their aim to support their currencies in turbulent times, central banks tend to diversify their reserves and buy Gold to improve the perceived strength of the economy and the currency. High Gold reserves can be a source of trust for a country’s solvency. Central banks added 1,136 tonnes of Gold worth around $70 billion to their reserves in 2022, according to data from the World Gold Council. This is the highest yearly purchase since records began. Central banks from emerging economies such as China, India and Turkey are quickly increasing their Gold reserves.
Gold has an inverse correlation with the US Dollar and US Treasuries, which are both major reserve and safe-haven assets. When the Dollar depreciates, Gold tends to rise, enabling investors and central banks to diversify their assets in turbulent times. Gold is also inversely correlated with risk assets. A rally in the stock market tends to weaken Gold price, while sell-offs in riskier markets tend to favor the precious metal.
The price can move due to a wide range of factors. Geopolitical instability or fears of a deep recession can quickly make Gold price escalate due to its safe-haven status. As a yield-less asset, Gold tends to rise with lower interest rates, while higher cost of money usually weighs down on the yellow metal. Still, most moves depend on how the US Dollar (USD) behaves as the asset is priced in dollars (XAU/USD). A strong Dollar tends to keep the price of Gold controlled, whereas a weaker Dollar is likely to push Gold prices up.
-
10:00
Singapore Foreign Reserves (MoM) up to 379.3B in February from previous 376.7B
-
09:52
Crude oil price today: WTI price bullish at European opening
West Texas Intermediate (WTI) Oil price advances on Friday, early in the European session. WTI trades at $66.93 per barrel, up from Thursday’s close at $65.99. Brent Oil Exchange Rate (Brent crude) is also up, advancing from the $69.20 price posted on Thursday, and trading at $70.06.
WTI Oil FAQs
WTI Oil is a type of Crude Oil sold on international markets. The WTI stands for West Texas Intermediate, one of three major types including Brent and Dubai Crude. WTI is also referred to as “light” and “sweet” because of its relatively low gravity and sulfur content respectively. It is considered a high quality Oil that is easily refined. It is sourced in the United States and distributed via the Cushing hub, which is considered “The Pipeline Crossroads of the World”. It is a benchmark for the Oil market and WTI price is frequently quoted in the media.
Like all assets, supply and demand are the key drivers of WTI Oil price. As such, global growth can be a driver of increased demand and vice versa for weak global growth. Political instability, wars, and sanctions can disrupt supply and impact prices. The decisions of OPEC, a group of major Oil-producing countries, is another key driver of price. The value of the US Dollar influences the price of WTI Crude Oil, since Oil is predominantly traded in US Dollars, thus a weaker US Dollar can make Oil more affordable and vice versa.
The weekly Oil inventory reports published by the American Petroleum Institute (API) and the Energy Information Agency (EIA) impact the price of WTI Oil. Changes in inventories reflect fluctuating supply and demand. If the data shows a drop in inventories it can indicate increased demand, pushing up Oil price. Higher inventories can reflect increased supply, pushing down prices. API’s report is published every Tuesday and EIA’s the day after. Their results are usually similar, falling within 1% of each other 75% of the time. The EIA data is considered more reliable, since it is a government agency.
OPEC (Organization of the Petroleum Exporting Countries) is a group of 12 Oil-producing nations who collectively decide production quotas for member countries at twice-yearly meetings. Their decisions often impact WTI Oil prices. When OPEC decides to lower quotas, it can tighten supply, pushing up Oil prices. When OPEC increases production, it has the opposite effect. OPEC+ refers to an expanded group that includes ten extra non-OPEC members, the most notable of which is Russia.
Disclaimer: West Texas Intermediate (WTI) and Brent oil prices mentioned above are based on FXStreet data feed for Contracts for Differences (CFDs).
(An automation tool was used in creating this post.)
-
09:02
China Foreign Exchange Reserves (MoM) above forecasts ($3.22T) in February: Actual ($3.227T)
-
09:01
Switzerland Foreign Currency Reserves climbed from previous 736B to 753B in February
-
09:00
Austria Wholesale Prices n.s.a (YoY) down to -0.1% in February from previous 1.3%
-
09:00
Austria Wholesale Prices n.s.a (MoM) declined to -0.2% in February from previous 1.5%
-
09:00
Austria Trade Balance down to €-825.3M in December from previous €-189.7M
-
09:00
Spain Industrial Output Cal Adjusted (YoY) down to -1% in January from previous 2.1%
-
08:46
France Trade Balance EUR came in at €-6.54B, below expectations (€-4.1B) in January
-
08:46
France Exports, EUR fell from previous €52.255B to €49.84B in January
-
08:46
France Imports, EUR: €56.38B (January) vs €56.16B
-
08:45
France Current Account dipped from previous €2.4B to €-2.2B in January
-
08:44
NZD/USD Price Forecast: Could retest 0.5700 support near 50-day EMA
- NZD/USD may aim for initial resistance at the three-month high of 0.5794, reached on January 24.
- The 14-day Relative Strength Index remains above 50, reinforcing the bullish outlook.
- Immediate support is seen at the psychological level of 0.5700, aligning with the 50-day EMA at 0.5698.
The NZD/USD pair loses ground after registering gains in the previous four successive sessions, trading around 0.5720 during European trading hours on Friday. Technical analysis of the daily chart indicates a bullish bias, with the pair trending higher within a newly formed ascending channel pattern.
The 14-day Relative Strength Index (RSI) remains above the 50 mark, reinforcing the bullish outlook. However, NZD/USD is positioned above the nine-day Exponential Moving Average (EMA), signaling short-term momentum is stronger.
A recovery could see the pair targeting initial resistance at the three-month high of 0.5794, reached on January 24, which is aligned with the upper boundary of the ascending channel at 0.5800 level. A break above this crucial resistance zone could reinforce the prevailing bullish bias and support the NZD/USD pair to explore the region around the four-month high at 0.5922 level, recorded in December 2024.
On the downside, immediate support is seen at the psychological level of 0.5700, coinciding with the 50-day EMA at 0.5698 and the nine-day EMA at 0.5694, aligning with the lower boundary of the ascending channel.
A decisive break below the ascending channel could weaken the bullish bias and put downward pressure on the NZD/USD pair to navigate the area around 0.5516—its lowest level since October 2022, recorded on February 3.
NZD/USD: Daily Chart
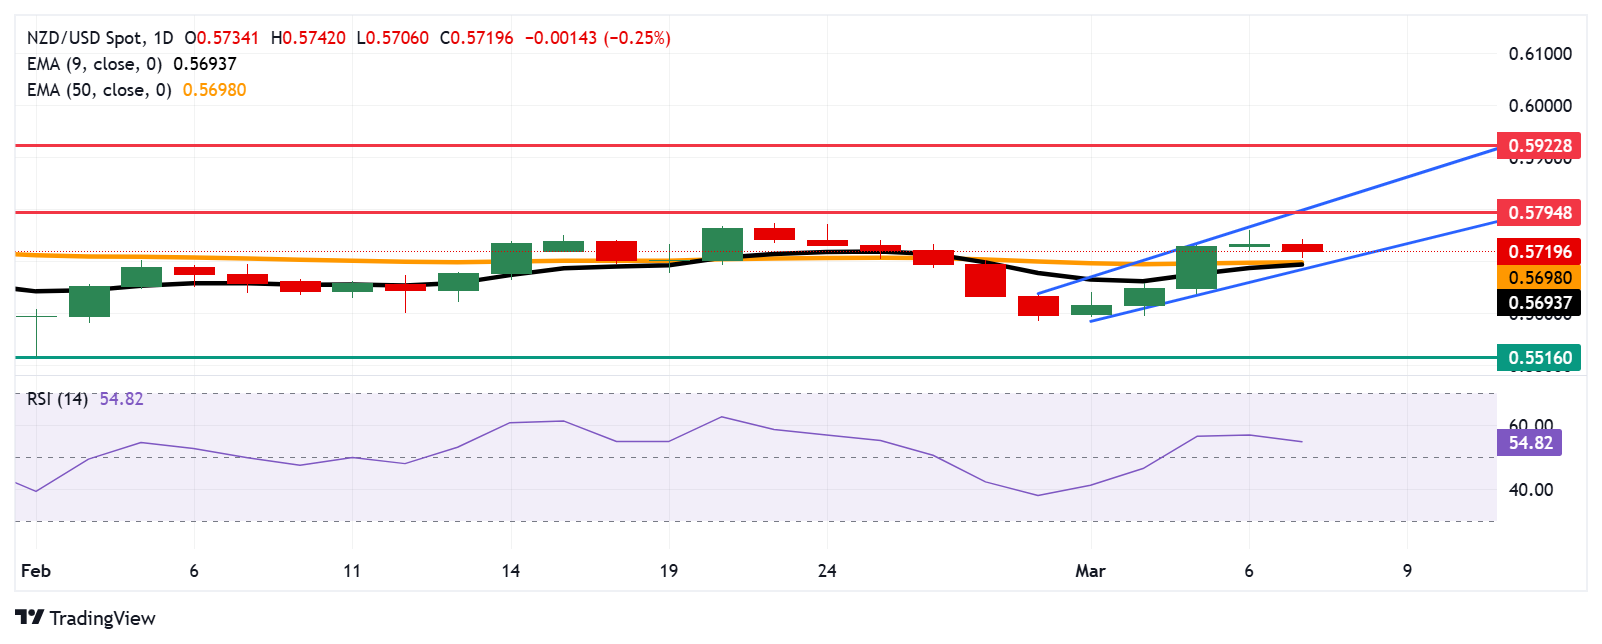
New Zealand Dollar PRICE Today
The table below shows the percentage change of New Zealand Dollar (NZD) against listed major currencies today. New Zealand Dollar was the weakest against the Euro.
USD EUR GBP JPY CAD AUD NZD CHF USD -0.45% -0.19% -0.19% -0.01% 0.36% 0.21% -0.41% EUR 0.45% 0.27% 0.27% 0.44% 0.81% 0.67% 0.04% GBP 0.19% -0.27% 0.04% 0.17% 0.54% 0.40% -0.20% JPY 0.19% -0.27% -0.04% 0.17% 0.54% 0.40% -0.19% CAD 0.01% -0.44% -0.17% -0.17% 0.36% 0.23% -0.37% AUD -0.36% -0.81% -0.54% -0.54% -0.36% -0.14% -0.72% NZD -0.21% -0.67% -0.40% -0.40% -0.23% 0.14% -0.59% CHF 0.41% -0.04% 0.20% 0.19% 0.37% 0.72% 0.59% The heat map shows percentage changes of major currencies against each other. The base currency is picked from the left column, while the quote currency is picked from the top row. For example, if you pick the New Zealand Dollar from the left column and move along the horizontal line to the US Dollar, the percentage change displayed in the box will represent NZD (base)/USD (quote).
-
08:43
Pound Sterling holds onto gains against US Dollar ahead of US NFP report
- The Pound Sterling demonstrates strength against the US Dollar around 1.2900 ahead of the US NFP data for February.
- US President Trump exempted tariffs on the import of goods compliant with the USMCA act till April 2.
- BoE’s Catherine Mann believes that a gradual policy-easing approach is unfavorable amid heightened geopolitical uncertainty.
The Pound Sterling (GBP) clings to gains near 1.2900 against the US Dollar (USD) in the European trading session on Friday. The GBP/USD pair exhibits strength ahead of the United States (US) Nonfarm Payrolls (NFP) report for February, which will be published at 13:30 GMT.
Investors will pay close attention to the US official employment report as it will influence market expectations for the Federal Reserve’s (Fed) monetary policy outlook. Economists expect the US economy to have added 160K fresh workers, higher than 143K recorded in January. The Unemployment Rate is seen steady at 4%.
Market participants will also focus on the US Average Hourly Earnings data, a key measure of wage growth, which is anticipated to have risen steadily by 4.1% year-over-year. On month, the wage growth measure is estimated to have grown by 0.3%, slower than the 0.5% growth seen in January.
Signs of strong labor demand and wage growth momentum would boost expectations that the Fed will keep interest rates in the current range of 4.25%-4.50% for longer. On the contrary, soft numbers would diminish them. According to the CME FedWatch tool, the central bank is almost certain to keep borrowing rates unchanged in the March meeting, but there is a 50% chance that it could cut them in May.
On Thursday, Atlanta Fed Bank President Raphael Bostic said at an event hosted by the Birmingham Business Journal that interest rates should stay in their current range before late spring or summer amid uncertainty over the economy due to US President Donald Trump’s economic agenda. Bostic warned that Trump’s tariffs could fuel inflationary pressures.
Daily digest market movers: Pound Sterling remains firm despite BoE Mann’s dovish guidance
- The Pound Sterling trades higher against its major peers on Friday while Bank of England (BoE) Monetary Policy Committee (MPC) member Catherine Mann argued against the adaptation of a “gradual and cautious” approach to monetary policy easing in her speech at a Reserve Bank of New Zealand (RBNZ) research conference on Thursday.
- Catherine Mann rebutted the need for a moderate monetary expansion approach, as favored by a majority of BoE officials in the February monetary policy meeting and testimony before Parliament’s treasury committee on Wednesday, amid significant volatility in global markets. Mann said that the founding premise for a gradualist approach to monetary policy is “no longer valid” due to “substantial volatility” coming from financial markets, especially from “cross-border spillovers”.
- On Wednesday, a slew of BoE officials, including Governor Andrew Bailey, endorsed a gradual path for “removing monetary policy restrictiveness” as the inflation persistence is less likely to fade “on its own accord”.
- On the geopolitical front, US President Trump has reprieved a significant number of products from tariffs imported from Canada and Mexico that come under the umbrella of the United States-Mexico-Canada Agreement (USMCA) till April 2, the same day when he is expected to impose reciprocal tariffs. On Wednesday, Trump relaxed levies on automobiles coming from Canada and Mexico after discussing with the big three US carmakers.
Technical Analysis: Pound Sterling sees more upside above 61.8% Fibo retracement at 1.2930
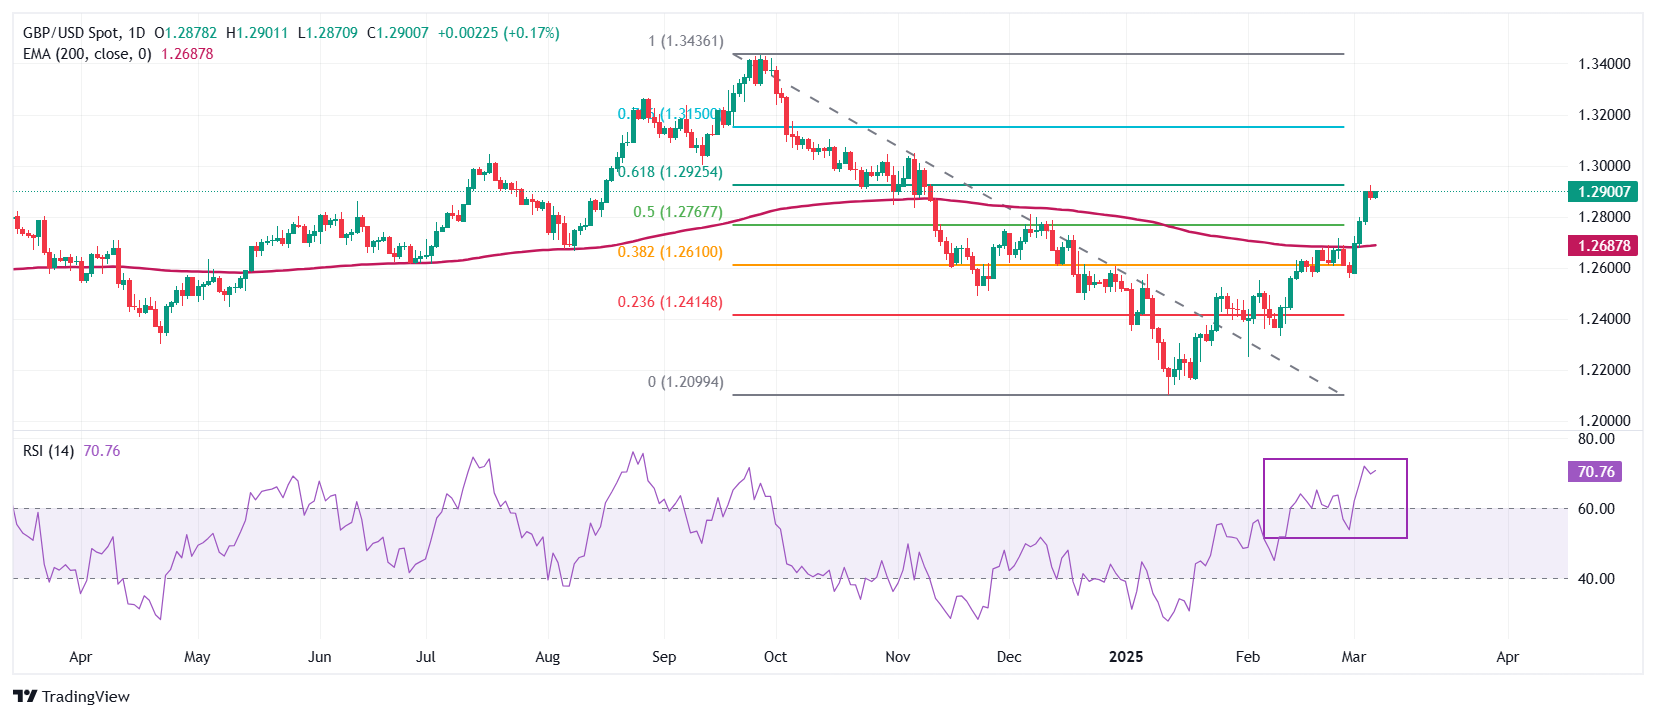
The Pound Sterling gathers strength to break above the 61.8% Fibonacci retracement plotted from the late September high to mid-January low around 1.2930 on Friday. The long-term outlook of the GBP/USD pair has turned bullish as it holds above the 200-day Exponential Moving Average (EMA), which is around 1.2688.
The 14-day Relative Strength Index (RSI) climbs above 60.00, suggesting a strong bullish momentum.
Looking down, the 50% Fibo retracement at 1.2767 and the 38.2% Fibo retracement at 1.2608 will act as key support zones for the pair. On the upside, the psychological 1.3000 level will act as a key resistance zone.
Pound Sterling FAQs
The Pound Sterling (GBP) is the oldest currency in the world (886 AD) and the official currency of the United Kingdom. It is the fourth most traded unit for foreign exchange (FX) in the world, accounting for 12% of all transactions, averaging $630 billion a day, according to 2022 data. Its key trading pairs are GBP/USD, also known as ‘Cable’, which accounts for 11% of FX, GBP/JPY, or the ‘Dragon’ as it is known by traders (3%), and EUR/GBP (2%). The Pound Sterling is issued by the Bank of England (BoE).
The single most important factor influencing the value of the Pound Sterling is monetary policy decided by the Bank of England. The BoE bases its decisions on whether it has achieved its primary goal of “price stability” – a steady inflation rate of around 2%. Its primary tool for achieving this is the adjustment of interest rates. When inflation is too high, the BoE will try to rein it in by raising interest rates, making it more expensive for people and businesses to access credit. This is generally positive for GBP, as higher interest rates make the UK a more attractive place for global investors to park their money. When inflation falls too low it is a sign economic growth is slowing. In this scenario, the BoE will consider lowering interest rates to cheapen credit so businesses will borrow more to invest in growth-generating projects.
Data releases gauge the health of the economy and can impact the value of the Pound Sterling. Indicators such as GDP, Manufacturing and Services PMIs, and employment can all influence the direction of the GBP. A strong economy is good for Sterling. Not only does it attract more foreign investment but it may encourage the BoE to put up interest rates, which will directly strengthen GBP. Otherwise, if economic data is weak, the Pound Sterling is likely to fall.
Another significant data release for the Pound Sterling is the Trade Balance. This indicator measures the difference between what a country earns from its exports and what it spends on imports over a given period. If a country produces highly sought-after exports, its currency will benefit purely from the extra demand created from foreign buyers seeking to purchase these goods. Therefore, a positive net Trade Balance strengthens a currency and vice versa for a negative balance.
-
08:18
Forex Today: US Dollar continues to retreat ahead of key employment data
Here is what you need to know on Friday, March 7:
The US Dollar (USD) Index continues to edge lower on Friday and remains on track to post its largest weekly loss since November 2022. In the second half of the day, February employment data from the US, which will feature Nonfarm Payrolls, Unemployment Rate and wage inflation figures, will be watched closely by market participants.
US Dollar PRICE This week
The table below shows the percentage change of US Dollar (USD) against listed major currencies this week. US Dollar was the weakest against the Euro.
USD EUR GBP JPY CAD AUD NZD CHF USD -4.16% -2.50% -1.98% -0.99% -1.62% -2.13% -2.41% EUR 4.16% 1.62% 2.03% 3.11% 2.55% 1.92% 1.63% GBP 2.50% -1.62% 0.51% 1.47% 0.91% 0.30% 0.02% JPY 1.98% -2.03% -0.51% 1.23% 0.42% -0.11% -0.45% CAD 0.99% -3.11% -1.47% -1.23% -0.48% -1.15% -1.44% AUD 1.62% -2.55% -0.91% -0.42% 0.48% -0.60% -0.89% NZD 2.13% -1.92% -0.30% 0.11% 1.15% 0.60% -0.29% CHF 2.41% -1.63% -0.02% 0.45% 1.44% 0.89% 0.29% The heat map shows percentage changes of major currencies against each other. The base currency is picked from the left column, while the quote currency is picked from the top row. For example, if you pick the US Dollar from the left column and move along the horizontal line to the Japanese Yen, the percentage change displayed in the box will represent USD (base)/JPY (quote).
After suffering heavy losses against its major rivals in the first half of the week, the USD continues to weaken, albeit at a softer pace. Markets expect Nonfarm Payrolls to rise by 160,000 in February, following the 143,000 increase recorded in January. Later in the American session, Federal Reserve (Fed) Chairman Jerome Powell, as well as some other policymakers, will be delivering speeches before the Fed's blackout period starts on Saturday. At the time of press, the USD Index was fluctuating in negative territory below 104.00, losing about 3.4% on a weekly basis.
During the Asian trading hours, the data from China showed Exports rose by 2.3% on a yearly basis in February, while Imports declined by 8.4% in the same period. In turn, China's trade surplus widened to $170.51 billion from $104.84 billion in January. AUD/USD stays on the back foot early Friday and trades near 0.6300.
The European Central Bank (ECB) announced on Thursday that it lowered key rates by 25 basis points (bps), as expected. In the policy statement, the ECB reiterated that future interest rate decisions will be based on the assessment of inflation outlook in light of incoming economic and financial data, dynamics of underlying inflation, and strength of monetary policy transmission. Commenting on the policy outlook, ECB President Christine Lagarde noted that the ECB will remain data-dependent and that they will make decisions on a meeting-by-meeting basis. EUR/USD closed marginally lower on Thursday but started to edge higher above 1.0800 early Friday. Meanwhile, the data from Germany showed that Factory Orders contracted by 7% on a monthly basis in January.
Statistics Canada will publish February jobs data later in the day. Investors expect the Unemployment Rate to tick up to 6.7% from 6.6% in January. After posting losses for three consecutive days, USD/CAD stays in a consolidation phase at around 1.4300 in the European morning on Friday.
GBP/USD fluctuates in a tight channel at around 1.2900 on Friday after setting a multi-month above 1.2920 on Thursday.
USD/JPY stays under bearish pressure on Friday and declined toward 147.50. Japan's Finance Minister, Katsunobu Kato, said early Friday that there have been one-sided and rapid market moves, adding that he will take appropriate action against excessive foreign exchange moves.
After reclaiming $2,900 earlier in the week, Gold struggled to preserve its bullish momentum and registered small losses on Thursday. In the European morning on Friday, XAU/USD moves sideways at around $2,910.
Nonfarm Payrolls FAQs
Nonfarm Payrolls (NFP) are part of the US Bureau of Labor Statistics monthly jobs report. The Nonfarm Payrolls component specifically measures the change in the number of people employed in the US during the previous month, excluding the farming industry.
The Nonfarm Payrolls figure can influence the decisions of the Federal Reserve by providing a measure of how successfully the Fed is meeting its mandate of fostering full employment and 2% inflation. A relatively high NFP figure means more people are in employment, earning more money and therefore probably spending more. A relatively low Nonfarm Payrolls’ result, on the either hand, could mean people are struggling to find work. The Fed will typically raise interest rates to combat high inflation triggered by low unemployment, and lower them to stimulate a stagnant labor market.
Nonfarm Payrolls generally have a positive correlation with the US Dollar. This means when payrolls’ figures come out higher-than-expected the USD tends to rally and vice versa when they are lower. NFPs influence the US Dollar by virtue of their impact on inflation, monetary policy expectations and interest rates. A higher NFP usually means the Federal Reserve will be more tight in its monetary policy, supporting the USD.
Nonfarm Payrolls are generally negatively-correlated with the price of Gold. This means a higher-than-expected payrolls’ figure will have a depressing effect on the Gold price and vice versa. Higher NFP generally has a positive effect on the value of the USD, and like most major commodities Gold is priced in US Dollars. If the USD gains in value, therefore, it requires less Dollars to buy an ounce of Gold. Also, higher interest rates (typically helped higher NFPs) also lessen the attractiveness of Gold as an investment compared to staying in cash, where the money will at least earn interest.
Nonfarm Payrolls is only one component within a bigger jobs report and it can be overshadowed by the other components. At times, when NFP come out higher-than-forecast, but the Average Weekly Earnings is lower than expected, the market has ignored the potentially inflationary effect of the headline result and interpreted the fall in earnings as deflationary. The Participation Rate and the Average Weekly Hours components can also influence the market reaction, but only in seldom events like the “Great Resignation” or the Global Financial Crisis.
-
08:06
US Dollar Index breaks below 104.00 as Treasury yields fall ahead of Nonfarm Payrolls
- The US Dollar Index depreciates as market expectations grow for more aggressive Fed rate cuts amid US growth concerns.
- President Trump exempted Mexican and Canadian goods under the USMCA from his proposed 25% tariffs.
- The US Nonfarm Payrolls is projected to show job growth, with employment rising to 160K in February.
The US Dollar Index (DXY), which tracks the US Dollar (USD) against six major currencies, continues its losing streak for the fifth consecutive day, pressured by declining US Treasury yields. Market expectations of more aggressive Federal Reserve (Fed) rate cuts amid concerns over US economic growth are contributing to the weakness. The DXY is trading around 103.90 with 2- and 10-year yields on US Treasury bonds standing at 3.94% and 4.24%, respectively, during the early European hours on Friday.
Traders are closely watching global trade developments, particularly Canada’s decision to delay its second round of retaliatory tariffs on US products until April 2. This move follows US President Donald Trump’s exemption of Mexican and Canadian goods under the USMCA from his proposed 25% tariffs.
On the labor market front, US Initial Jobless Claims for the week ending March 1 fell to 221K, down from 242K the previous week, according to the US Department of Labor (DOL). The figure came in below market expectations of 235K. Meanwhile, the upcoming US Non-Farm Payrolls (NFP) report is projected to show a modest rebound, with job additions expected to rise to 160K in February, up from 143K in January.
Atlanta Fed President Raphael Bostic commented on Thursday that the US economy remains in a state of flux, making it difficult to predict future developments. Bostic reiterated the Fed’s commitment to bringing inflation down to 2% while minimizing labor market disruptions. He also stressed the importance of business sentiment in shaping monetary policy decisions.
US Dollar PRICE Today
The table below shows the percentage change of US Dollar (USD) against listed major currencies today. US Dollar was the weakest against the Euro.
USD EUR GBP JPY CAD AUD NZD CHF USD -0.31% -0.10% -0.12% 0.04% 0.46% 0.35% -0.25% EUR 0.31% 0.20% 0.21% 0.35% 0.78% 0.67% 0.06% GBP 0.10% -0.20% 0.00% 0.14% 0.57% 0.46% -0.11% JPY 0.12% -0.21% 0.00% 0.17% 0.60% 0.49% -0.08% CAD -0.04% -0.35% -0.14% -0.17% 0.42% 0.32% -0.25% AUD -0.46% -0.78% -0.57% -0.60% -0.42% -0.10% -0.66% NZD -0.35% -0.67% -0.46% -0.49% -0.32% 0.10% -0.56% CHF 0.25% -0.06% 0.11% 0.08% 0.25% 0.66% 0.56% The heat map shows percentage changes of major currencies against each other. The base currency is picked from the left column, while the quote currency is picked from the top row. For example, if you pick the US Dollar from the left column and move along the horizontal line to the Japanese Yen, the percentage change displayed in the box will represent USD (base)/JPY (quote).
-
08:03
Germany Factory Orders n.s.a. (YoY) up to -2.6% in January from previous -6.3%
-
08:01
Germany Factory Orders n.s.a. (YoY) up to -2.9% in January from previous -6.3%
-
08:01
Germany Factory Orders s.a. (MoM) below forecasts (-2.8%) in January: Actual (-7%)
-
08:00
United Kingdom Halifax House Prices (MoM) registered at -0.1%, below expectations (0.3%) in February
-
07:46
EUR/JPY Price Forecast: Remains capped below the 100-day EMA near 159.50
- EUR/JPY weakens to near 159.40 in Friday’s early European session.
- The negative view of the cross remains intact, but further consolidation cannot be ruled out.
- The first downside target to watch is 159.12; the immediate resistance level emerges at 160.70.
The EUR/JPY cross loses traction to around 159.40 during the early European session on Friday. The uncertainty and risk-off sentiment in the markets boost the safe-haven flows, benefiting the Japanese Yen (JPY). Investors await the release of the Eurozone Gross Domestic Product (GDP) for the fourth quarter, which is due later on Friday.
Technically, EUR/JPY keeps the bearish vibe on the daily chart as the index remains capped below the key 100-day Exponential Moving Average (EMA). Nonetheless, further consolidation cannot be ruled out as the 14-day Relative Strength Index (RSI) hovers around the 50-midline near 54.0, suggesting neutral momentum in the near term.
The initial support level for the cross emerges at 159.12, the low of March 6. Any follow-through selling below this level could expose 156.18, the low of December 3, 2024. The crucial contention level to watch is the 154.85-154.80 zone, representing the lower limit of the Bollinger Band and the low of February 28.
On the bright side, the first upside barrier is located at 160.70, the 100-day EMA. Extended gains could pave the way to the 161.00-161.10 region, representing the psychological level and the upper boundary of the Bollinger Band. The next hurdle is seen at 162.80, the high of January 14.EUR/JPY daily chart
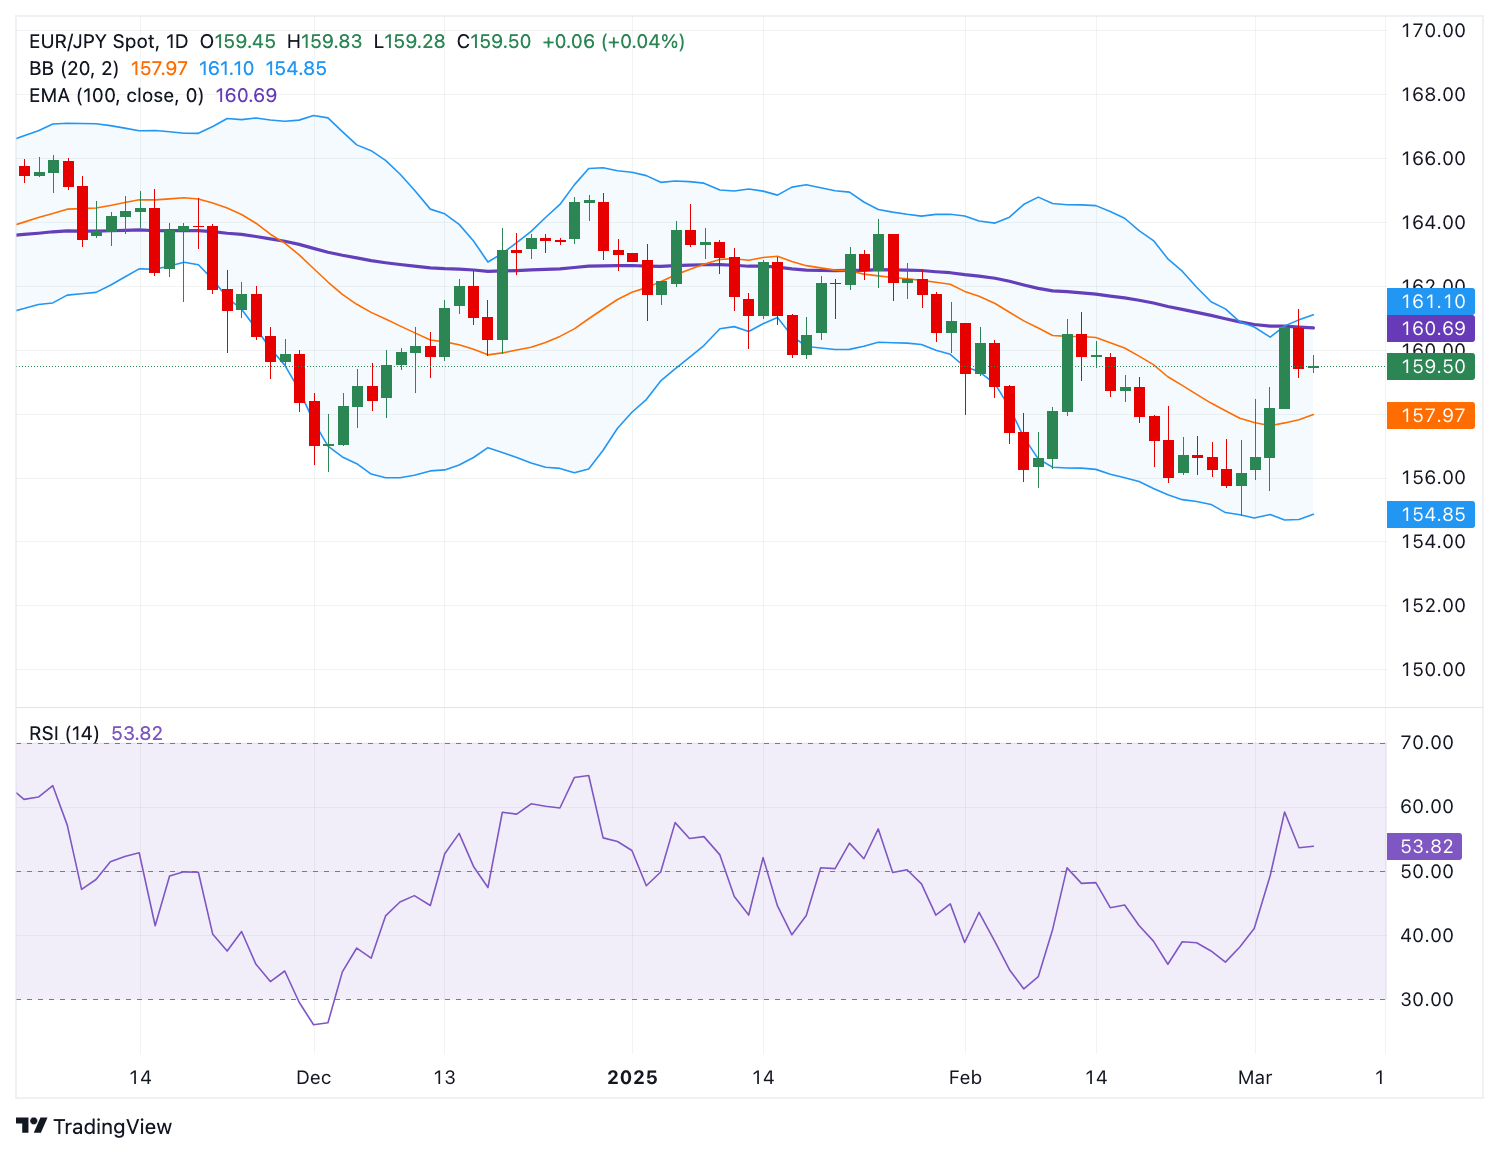
Japanese Yen FAQs
The Japanese Yen (JPY) is one of the world’s most traded currencies. Its value is broadly determined by the performance of the Japanese economy, but more specifically by the Bank of Japan’s policy, the differential between Japanese and US bond yields, or risk sentiment among traders, among other factors.
One of the Bank of Japan’s mandates is currency control, so its moves are key for the Yen. The BoJ has directly intervened in currency markets sometimes, generally to lower the value of the Yen, although it refrains from doing it often due to political concerns of its main trading partners. The BoJ ultra-loose monetary policy between 2013 and 2024 caused the Yen to depreciate against its main currency peers due to an increasing policy divergence between the Bank of Japan and other main central banks. More recently, the gradually unwinding of this ultra-loose policy has given some support to the Yen.
Over the last decade, the BoJ’s stance of sticking to ultra-loose monetary policy has led to a widening policy divergence with other central banks, particularly with the US Federal Reserve. This supported a widening of the differential between the 10-year US and Japanese bonds, which favored the US Dollar against the Japanese Yen. The BoJ decision in 2024 to gradually abandon the ultra-loose policy, coupled with interest-rate cuts in other major central banks, is narrowing this differential.
The Japanese Yen is often seen as a safe-haven investment. This means that in times of market stress, investors are more likely to put their money in the Japanese currency due to its supposed reliability and stability. Turbulent times are likely to strengthen the Yen’s value against other currencies seen as more risky to invest in.
-
07:02
AUD/JPY Price Forecast: Tests 93.00 level, next support at lower descending channel limit
- AUD/JPY tests the psychological support level at 93.00.
- The 14-day RSI remains above the 30 mark, reinforcing the prevailing bearish bias.
- The pair could test the primary barrier at the nine-day EMA of 93.78
AUD/JPY extends its losses for the second consecutive day, trading around 93.00 during Asian hours on Friday. A technical analysis of the daily chart shows that the currency cross remains within a descending channel, confirming a sustained bearish bias.
The 14-day Relative Strength Index (RSI) remains above the 30 level, reinforcing the ongoing bearish sentiment. A drop below 30 would signal an oversold condition, potentially triggering an upward correction. Additionally, the AUD/JPY cross continues to trade below the nine-day Exponential Moving Average (EMA), indicating weak short-term price momentum.
The AUD/JPY cross is testing the psychological support level at 93.00, followed by the lower boundary of the descending channel at 91.90. A decisive break below this channel could reinforce the bearish outlook, potentially driving the currency cross toward the 90.13 region—the lowest level since May 2023, last seen on August 5, 2024.
On the upside, the AUD/JPY cross faces initial resistance at the nine-day EMA of 93.78. A breakout above this level could improve short-term price momentum, potentially driving the currency cross toward the upper boundary of the descending channel at the psychological level of 95.50, followed by the 50-day EMA at 95.91.
AUD/JPY: Daily Chart
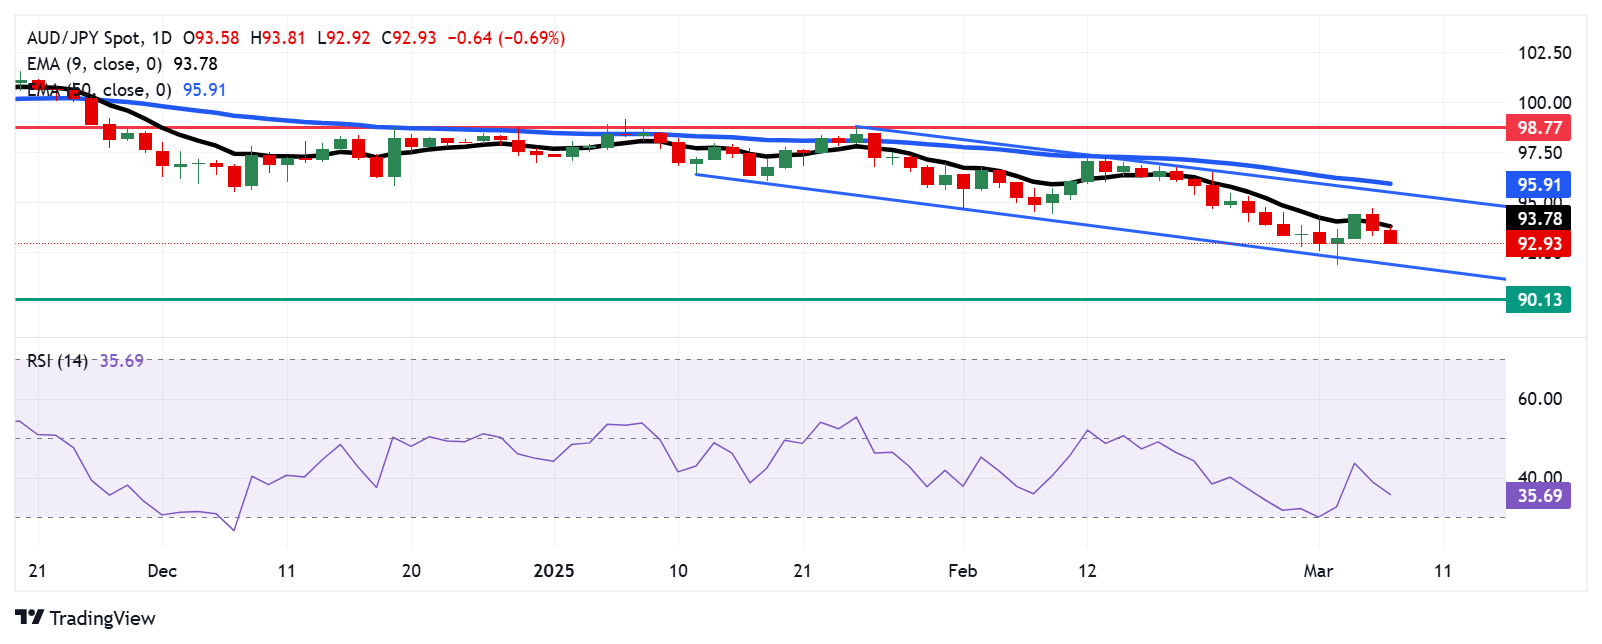
Australian Dollar PRICE Today
The table below shows the percentage change of Australian Dollar (AUD) against listed major currencies today. Australian Dollar was the weakest against the Euro.
USD EUR GBP JPY CAD AUD NZD CHF USD -0.23% -0.04% -0.22% 0.04% 0.47% 0.38% -0.25% EUR 0.23% 0.19% 0.03% 0.27% 0.71% 0.61% -0.02% GBP 0.04% -0.19% -0.17% 0.07% 0.51% 0.42% -0.18% JPY 0.22% -0.03% 0.17% 0.26% 0.70% 0.61% 0.02% CAD -0.04% -0.27% -0.07% -0.26% 0.43% 0.34% -0.25% AUD -0.47% -0.71% -0.51% -0.70% -0.43% -0.09% -0.68% NZD -0.38% -0.61% -0.42% -0.61% -0.34% 0.09% -0.59% CHF 0.25% 0.02% 0.18% -0.02% 0.25% 0.68% 0.59% The heat map shows percentage changes of major currencies against each other. The base currency is picked from the left column, while the quote currency is picked from the top row. For example, if you pick the Australian Dollar from the left column and move along the horizontal line to the US Dollar, the percentage change displayed in the box will represent AUD (base)/USD (quote).
-
07:01
South Africa Net $Gold & Forex Reserve: $61.733B (February) vs $61.328B
-
07:01
South Africa Gross $Gold & Forex Reserve increased to $66.264B in February from previous $65.876B
-
06:26
Silver Price Forecast: XAG/USD holds steady above mid-$32.00s, over one-week top
- Silver consolidates in a range as bulls opt to wait for the release of the US NFP report.
- The setup suggests that the path of least resistance for the XAU/USD is to the upside.
- Any corrective pullback might still be seen as a buying opportunity and remain limited.
Silver (XAG/USD) oscillates in a narrow band during the Asian session on Friday and currently trades above mid-$32.00s, near its highest level in over a week touched the previous day. Moreover, the near-term bias seems tilted in favor of bullish traders and supports prospects for an extension of the weekly uptrend.
The recent bounce from sub-$31.00 levels, nearing the 100-day Exponential Moving Average (EMA), and the fact that oscillators on the daily chart have just started gaining positive traction validate the constructive outlook for the XAG/USD. Hence, some follow-through strength beyond the $33.00 mark, towards the February monthly swing high around the $33.40 area, looks like a distinct possibility.
The momentum could extend further towards the next relevant hurdle near the $33.60-$33.70 area before the XAG/USD climbs further towards the $34.00 round figure en route to the $34.50-$34.55 resistance zone. The white metal might then aim towards challenging a multi-year high, closer to the $35.00 psychological mark touched in October 2024.
On the flip side, the $32.30-$32.25 horizontal resistance breakpoint, which coincides with the overnight swing low, might still protect the immediate downside ahead of the $32.00 mark. This is followed by the $31.80 area, below which the XAG/USD could decline to the $31.25-$31.20 region en route to the 100-day EMA, currently pegged near the $31.10-$31.00 area and last week's swing low, around the $30.80 area.
A convincing break below the latter would shift the bias in favor of bearish traders and drag the XAG/USD towards the $30.00 psychological mark en route to the $29.55-$29.50 support and sub-$29.00 levels, or the year-to-date low touched in January.
Silver daily chart
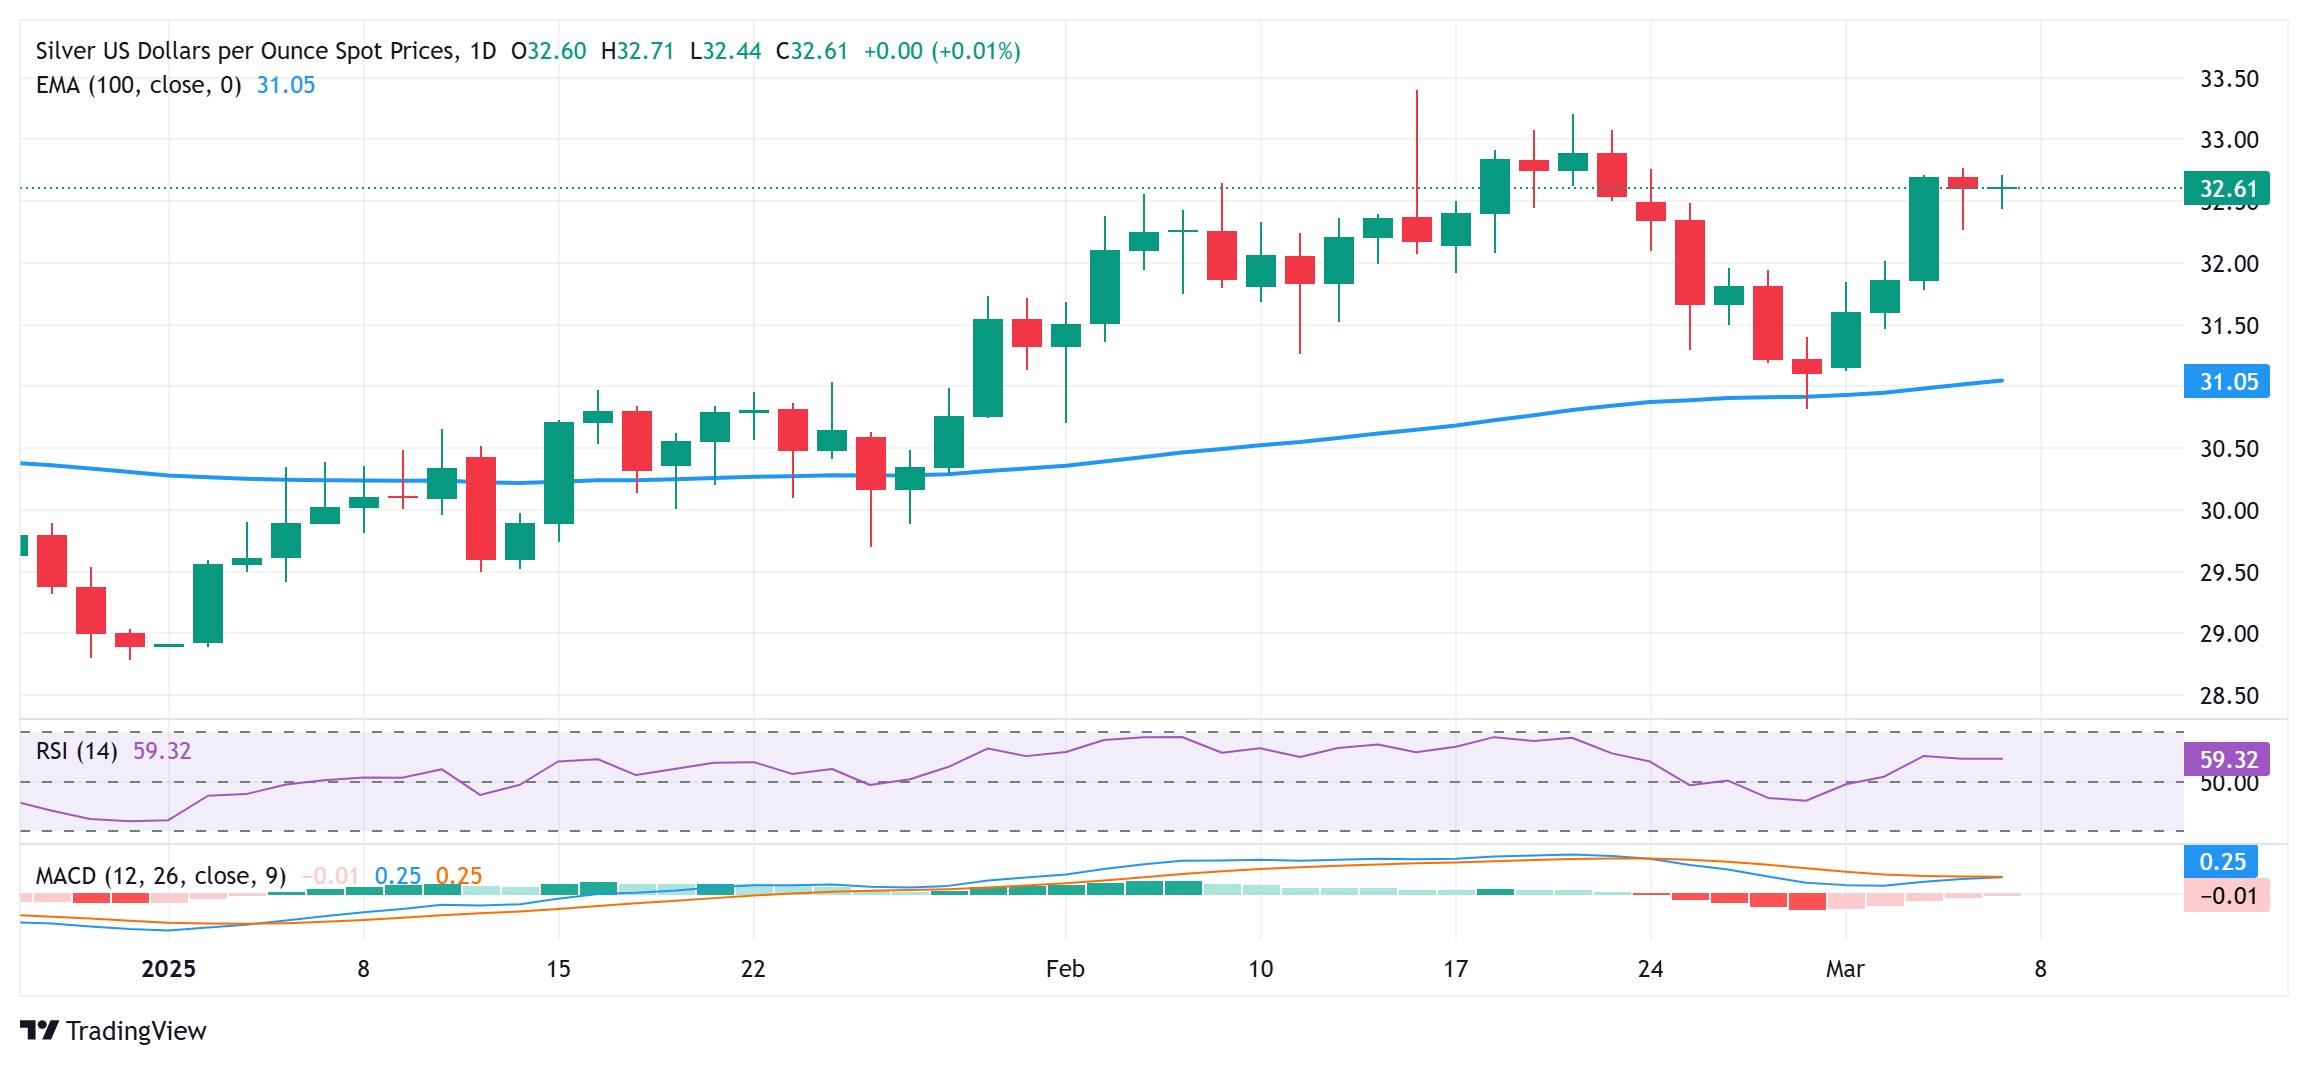
Silver FAQs
Silver is a precious metal highly traded among investors. It has been historically used as a store of value and a medium of exchange. Although less popular than Gold, traders may turn to Silver to diversify their investment portfolio, for its intrinsic value or as a potential hedge during high-inflation periods. Investors can buy physical Silver, in coins or in bars, or trade it through vehicles such as Exchange Traded Funds, which track its price on international markets.
Silver prices can move due to a wide range of factors. Geopolitical instability or fears of a deep recession can make Silver price escalate due to its safe-haven status, although to a lesser extent than Gold's. As a yieldless asset, Silver tends to rise with lower interest rates. Its moves also depend on how the US Dollar (USD) behaves as the asset is priced in dollars (XAG/USD). A strong Dollar tends to keep the price of Silver at bay, whereas a weaker Dollar is likely to propel prices up. Other factors such as investment demand, mining supply – Silver is much more abundant than Gold – and recycling rates can also affect prices.
Silver is widely used in industry, particularly in sectors such as electronics or solar energy, as it has one of the highest electric conductivity of all metals – more than Copper and Gold. A surge in demand can increase prices, while a decline tends to lower them. Dynamics in the US, Chinese and Indian economies can also contribute to price swings: for the US and particularly China, their big industrial sectors use Silver in various processes; in India, consumers’ demand for the precious metal for jewellery also plays a key role in setting prices.
Silver prices tend to follow Gold's moves. When Gold prices rise, Silver typically follows suit, as their status as safe-haven assets is similar. The Gold/Silver ratio, which shows the number of ounces of Silver needed to equal the value of one ounce of Gold, may help to determine the relative valuation between both metals. Some investors may consider a high ratio as an indicator that Silver is undervalued, or Gold is overvalued. On the contrary, a low ratio might suggest that Gold is undervalued relative to Silver.
-
06:20
USD/CHF weakens below 0.8850 as investors await US NFP data
- USD/CHF faces some selling pressure to near 0.8820 in Friday’s early European session, losing 0.13% on the day.
- Trump expanded exemptions to Canada and Mexico tariffs.
- The concerns over a looming slowdown in the US economy weigh on the US Dollar.
The USD/CHF pair extends the decline to around 0.8820 during the early European session on Friday, pressured by the weaker US Dollar (USD). The markets turn cautious amid an escalating trade war initiated by the United States. Later on Friday, traders await the highly anticipated US Nonfarm Payrolls (NFP) for February.
The Greenback edges lower to a three-month low against the Swiss Franc (CHF) after US President Donald Trump on Thursday issued an executive order exempting goods from both Canada and Mexico under a North American trade agreement, known as USMCA, two days after imposing them.Investors are concerned about the potential impact of the Trump administration's tariffs on the US economy. This, in turn, boosts the safe-haven currency like the CHF and acts as a headwind for USD/CHF.
The concerns over a looming slowdown in the US economy contribute to the USD downside. Investors will closely monitor the release of the US NFP data later on Friday for additional insights into the Federal Reserve’s (Fed) monetary policy.Economists predict that 160,000 jobs will be added in February, while the Unemployment Rate is expected to hold steady at 4.0%. If the report shows a stronger-than-expected outcome, this could help limit the USD’s losses.
Swiss Franc FAQs
The Swiss Franc (CHF) is Switzerland’s official currency. It is among the top ten most traded currencies globally, reaching volumes that well exceed the size of the Swiss economy. Its value is determined by the broad market sentiment, the country’s economic health or action taken by the Swiss National Bank (SNB), among other factors. Between 2011 and 2015, the Swiss Franc was pegged to the Euro (EUR). The peg was abruptly removed, resulting in a more than 20% increase in the Franc’s value, causing a turmoil in markets. Even though the peg isn’t in force anymore, CHF fortunes tend to be highly correlated with the Euro ones due to the high dependency of the Swiss economy on the neighboring Eurozone.
The Swiss Franc (CHF) is considered a safe-haven asset, or a currency that investors tend to buy in times of market stress. This is due to the perceived status of Switzerland in the world: a stable economy, a strong export sector, big central bank reserves or a longstanding political stance towards neutrality in global conflicts make the country’s currency a good choice for investors fleeing from risks. Turbulent times are likely to strengthen CHF value against other currencies that are seen as more risky to invest in.
The Swiss National Bank (SNB) meets four times a year – once every quarter, less than other major central banks – to decide on monetary policy. The bank aims for an annual inflation rate of less than 2%. When inflation is above target or forecasted to be above target in the foreseeable future, the bank will attempt to tame price growth by raising its policy rate. Higher interest rates are generally positive for the Swiss Franc (CHF) as they lead to higher yields, making the country a more attractive place for investors. On the contrary, lower interest rates tend to weaken CHF.
Macroeconomic data releases in Switzerland are key to assessing the state of the economy and can impact the Swiss Franc’s (CHF) valuation. The Swiss economy is broadly stable, but any sudden change in economic growth, inflation, current account or the central bank’s currency reserves have the potential to trigger moves in CHF. Generally, high economic growth, low unemployment and high confidence are good for CHF. Conversely, if economic data points to weakening momentum, CHF is likely to depreciate.
As a small and open economy, Switzerland is heavily dependent on the health of the neighboring Eurozone economies. The broader European Union is Switzerland’s main economic partner and a key political ally, so macroeconomic and monetary policy stability in the Eurozone is essential for Switzerland and, thus, for the Swiss Franc (CHF). With such dependency, some models suggest that the correlation between the fortunes of the Euro (EUR) and the CHF is more than 90%, or close to perfect.
-
06:00
Nonfarm Payrolls forecast: US job growth set to rebound in February after weak January data
- Nonfarm Payrolls are expected to rise by 160K in February, following the 143K increase reported in January.
- The Unemployment Rate is forecast to remain unchanged at 4%.
- Markets could reassess the possibility of a Fed rate cut in May after employment data.
The United States (US) Bureau of Labor Statistics (BLS) will publish the highly-anticipated Nonfarm Payrolls (NFP) data for February on Friday at 13:30 GMT.
Growing concerns over US President Donald Trump’s trade policy causing an economic downturn in the US have been driving the action in financial markets lately. The details of the employment report could influence the Federal Reserve’s (Fed) policy outlook and impact the US Dollar’s (USD) valuation.
What to expect from the next Nonfarm Payrolls report?
Markets expect NFP to rise by 160,000 in February, following the disappointing 143,000 increase recorded in January. The Unemployment Rate is forecast to remain unchanged at 4%, and annual wage inflation, as measured by the change in the Average Hourly Earnings, is seen holding steady at 4.1%.
Previewing the February employment report, TD Securities analysts said: “Payroll gains likely remain steady at just below 150k for a second consecutive month in February following last month's underwhelming 143k increase.”
“High-frequency data suggest job creation wasn't as strong as February last year. We also expect the Unemployment Rate to move higher to 4.1% while wage growth likely mean-reverted to 0.2% m/m as hours worked normalize in February,” they added.
Meanwhile, the data published by the Automatic Data Processing (ADP) showed on Wednesday that private sector payrolls rose by 77,000 in February, missing the market expectation of 140,000 by a wide margin.
How will US February Nonfarm Payrolls affect EUR/USD
The US Dollar has been struggling to outperform its rivals since the beginning of the year, even though markets have been pricing in a delay in the continuation of the Federal Reserve’s policy easing. After losing about 0.9% in February, the USD Index, which gauges the USD’s valuation against a basket of six major currencies, is already down more than 3% in March, pressured by heightened fears over an economic downturn in the US.
Earlier in the week, the data from the US showed that ISM Manufacturing Purchasing Managers Index (PMI) declined to 50.3 in February from 50.9 in January. The Employment Index of the PMI survey slumped to 47.6 from 50.3 and showed a contraction in the sector's payrolls. The Atlanta Fed revised its Gross Domestic Product (GDP) projection in its GDPNow report to -2.8% for the first quarter from -1.5% on February 28. "The nowcast of first-quarter real personal consumption expenditures growth and real private fixed investment growth fell from 1.3% and 3.5%, respectively, to 0.0% and 0.1%," the publication read.
Additionally, the Trump administration’s decision to go ahead with the 25% tariffs on Canadian and Mexican imports, as well as the additional 10% tariffs on Chinese goods, this Tuesday triggered retaliatory responses from Canada and China. In turn, investors have to consider the potential negative impact of a deepening trade war on the US economy. According to the CME FedWatch Tool, the probability of a Fed rate cut in May has increased to nearly 40% from about 25% in the previous week.
Hence, a disappointing labor market report, with an NFP reading below 120,000, could feed into expectations for a 25 basis points reduction in interest rates in May. In this scenario, the USD is likely to stay under selling pressure and open the door for a leg higher in EUR/USD. On the other hand, market participants could refrain from pricing in a May rate cut if the NFP offers a positive surprise with a print above 170,000. In addition to growing signs of an economic slowdown in the US, Fed policymakers also have to assess how tariffs could affect inflation and inflation expectations.
Eren Sengezer, European Session Lead Analyst at FXStreet, offers a brief technical outlook for EUR/USD:
“The Relative Strength Index (RSI) indicator on the daily chart rose above 70 for the first time since August, reflecting overbought conditions for EUR/USD. The Fibonacci 61.8% retracement level of the October-January downtrend aligns as a pivot level in the near term. Once EUR/USD stabilizes above this level and confirms it as support, 1.0900 (static level, round level) could be seen as next resistance before 1.0970 (Fibonacci 78.6% retracement).”
“In case EUR/USD fails to hold above 1.0800, the 200-day Simple Moving Average aligns as a key technical level at 1.0720. A daily close below this support could pave the way for a deeper correction toward 1.0570 (Fibonacci 38.2% retracement).”
Employment FAQs
Labor market conditions are a key element to assess the health of an economy and thus a key driver for currency valuation. High employment, or low unemployment, has positive implications for consumer spending and thus economic growth, boosting the value of the local currency. Moreover, a very tight labor market – a situation in which there is a shortage of workers to fill open positions – can also have implications on inflation levels and thus monetary policy as low labor supply and high demand leads to higher wages.
The pace at which salaries are growing in an economy is key for policymakers. High wage growth means that households have more money to spend, usually leading to price increases in consumer goods. In contrast to more volatile sources of inflation such as energy prices, wage growth is seen as a key component of underlying and persisting inflation as salary increases are unlikely to be undone. Central banks around the world pay close attention to wage growth data when deciding on monetary policy.
The weight that each central bank assigns to labor market conditions depends on its objectives. Some central banks explicitly have mandates related to the labor market beyond controlling inflation levels. The US Federal Reserve (Fed), for example, has the dual mandate of promoting maximum employment and stable prices. Meanwhile, the European Central Bank’s (ECB) sole mandate is to keep inflation under control. Still, and despite whatever mandates they have, labor market conditions are an important factor for policymakers given its significance as a gauge of the health of the economy and their direct relationship to inflation.
-
05:58
EUR/USD maintains position above 1.0800 near four-month highs
- EUR/USD holds gains near a four-month high at 1.0853, reached March 7.
- The US Dollar struggles as Treasury yields fall on rising dovish sentiment surrounding the Fed’s policy outlook.
- ECB President Christine Lagarde cautioned that risks to growth remain skewed to the "downside."
EUR/USD edges higher after registering losses in the previous session, trading around 1.0810 during the Asian hours on Friday. The pair gains ground as the US Dollar loses ground, driven by falling Treasury yields as markets anticipate more aggressive Fed rate cuts this year amid US growth concerns.
US Initial Jobless Claims for the week ending March 1 dropped to 221K, compared to 242K in the previous week, according to the US Department of Labor (DOL) on Thursday. This figure came in below the market consensus of 235K. US NFP is expected to show a modest rebound in job growth. Projections suggest net job additions will rise to 160K in February, up from January’s subdued 143K.
Meanwhile, traders remain focused on global trade developments, as Canada postpones its planned second round of retaliatory tariffs on US products until April 2. This decision follows US President Donald Trump’s exemption of Mexican and Canadian goods under the USMCA from his proposed 25% tariffs.
On Thursday, the European Central Bank (ECB) cut its Deposit Facility Rate by 25 basis points (bps) for the fifth consecutive time, bringing it down to 2.5%, as expected. The Main Refinancing Operations Rate was also lowered by 25 bps to 2.65%, in line with forecasts.
During a press conference, ECB President Christine Lagarde explained that the decision to ease rates was aimed at supporting economic stability. However, she cautioned that risks to growth remain skewed to the "downside." Lagarde also warned that trade tensions, driven by US President Donald Trump’s tariff policies, could further dampen economic growth.
While markets continue to seek additional rate cuts to reduce financing and borrowing costs, persistent inflation in the EU—and now in the US, following a recent uptick in key inflation indicators—has constrained central banks' ability to adjust rates more aggressively.
Euro FAQs
The Euro is the currency for the 19 European Union countries that belong to the Eurozone. It is the second most heavily traded currency in the world behind the US Dollar. In 2022, it accounted for 31% of all foreign exchange transactions, with an average daily turnover of over $2.2 trillion a day. EUR/USD is the most heavily traded currency pair in the world, accounting for an estimated 30% off all transactions, followed by EUR/JPY (4%), EUR/GBP (3%) and EUR/AUD (2%).
The European Central Bank (ECB) in Frankfurt, Germany, is the reserve bank for the Eurozone. The ECB sets interest rates and manages monetary policy. The ECB’s primary mandate is to maintain price stability, which means either controlling inflation or stimulating growth. Its primary tool is the raising or lowering of interest rates. Relatively high interest rates – or the expectation of higher rates – will usually benefit the Euro and vice versa. The ECB Governing Council makes monetary policy decisions at meetings held eight times a year. Decisions are made by heads of the Eurozone national banks and six permanent members, including the President of the ECB, Christine Lagarde.
Eurozone inflation data, measured by the Harmonized Index of Consumer Prices (HICP), is an important econometric for the Euro. If inflation rises more than expected, especially if above the ECB’s 2% target, it obliges the ECB to raise interest rates to bring it back under control. Relatively high interest rates compared to its counterparts will usually benefit the Euro, as it makes the region more attractive as a place for global investors to park their money.
Data releases gauge the health of the economy and can impact on the Euro. Indicators such as GDP, Manufacturing and Services PMIs, employment, and consumer sentiment surveys can all influence the direction of the single currency. A strong economy is good for the Euro. Not only does it attract more foreign investment but it may encourage the ECB to put up interest rates, which will directly strengthen the Euro. Otherwise, if economic data is weak, the Euro is likely to fall. Economic data for the four largest economies in the euro area (Germany, France, Italy and Spain) are especially significant, as they account for 75% of the Eurozone’s economy.
Another significant data release for the Euro is the Trade Balance. This indicator measures the difference between what a country earns from its exports and what it spends on imports over a given period. If a country produces highly sought after exports then its currency will gain in value purely from the extra demand created from foreign buyers seeking to purchase these goods. Therefore, a positive net Trade Balance strengthens a currency and vice versa for a negative balance.
-
05:47
USD/CAD moves away from one-week low, retakes 1.4300 ahead of US/Canadian jobs reports
USD/CAD attracts some buyers and snaps a three-day losing streak to over a one-week trough.
Bearish Oil prices undermine the Loonie and support the pair amid some repositioning trade.
Traders now look forward to employment details from the US and Canada for a fresh impetus.The USD/CAD pair builds on the overnight bounce from the 1.4240-1.4235 region, or a one-and-half-week low, and gains some positive traction during the Asian session on Friday. This marks the first day of a positive move in the previous three and lifts spot prices back above the 1.4300 round figure in the last hour.
Bearish Crude Oil prices undermine the commodity-linked Loonie and act as a tailwind for the USD/CAD pair. Apart from this, the uptick could be attributed to some repositioning trade ahead of the crucial employment details from the US and Canada, due later during the North American session. Any meaningful appreciating move, however, still seems elusive amid sustained US Dollar (USD) selling bias.
Worries that US President Donald Trump's trade tariffs could slow the US economic growth in the long run and force the Federal Reserve (Fed) to cut interest rates several times this year dragged the buck to its lowest level since early November on Thursday. Moreover, investors remain uncertain about Trump's trade policies, especially after another U-turn on the recently imposed tariffs on Mexico and Canada.
Trump on Thursday exempted goods from both Canada and Mexico that comply with the US–Mexico–Canada Agreement for a month from the steep 25% tariffs that he had imposed earlier this week. This helps ease trade war fears, which, along with bets the Bank of Canada (BoC) will pause rate cuts at its upcoming meeting later this month, could support the Canadian Dollar (CAD) and cap the USD/CAD pair.
Traders might also opt to wait for the release of the closely-watched US Nonfarm Payrolls (NFP) report, which will play a key role in influencing the near-term USD price dynamics. Apart from this, Canadian jobs data should provide some meaningful impetus to the USD/CAD pair. Nevertheless, spot prices remain on track to register weekly losses, and the fundamental backdrop warrants caution for bullish traders.
Canadian Dollar FAQs
The key factors driving the Canadian Dollar (CAD) are the level of interest rates set by the Bank of Canada (BoC), the price of Oil, Canada’s largest export, the health of its economy, inflation and the Trade Balance, which is the difference between the value of Canada’s exports versus its imports. Other factors include market sentiment – whether investors are taking on more risky assets (risk-on) or seeking safe-havens (risk-off) – with risk-on being CAD-positive. As its largest trading partner, the health of the US economy is also a key factor influencing the Canadian Dollar.
The Bank of Canada (BoC) has a significant influence on the Canadian Dollar by setting the level of interest rates that banks can lend to one another. This influences the level of interest rates for everyone. The main goal of the BoC is to maintain inflation at 1-3% by adjusting interest rates up or down. Relatively higher interest rates tend to be positive for the CAD. The Bank of Canada can also use quantitative easing and tightening to influence credit conditions, with the former CAD-negative and the latter CAD-positive.
The price of Oil is a key factor impacting the value of the Canadian Dollar. Petroleum is Canada’s biggest export, so Oil price tends to have an immediate impact on the CAD value. Generally, if Oil price rises CAD also goes up, as aggregate demand for the currency increases. The opposite is the case if the price of Oil falls. Higher Oil prices also tend to result in a greater likelihood of a positive Trade Balance, which is also supportive of the CAD.
While inflation had always traditionally been thought of as a negative factor for a currency since it lowers the value of money, the opposite has actually been the case in modern times with the relaxation of cross-border capital controls. Higher inflation tends to lead central banks to put up interest rates which attracts more capital inflows from global investors seeking a lucrative place to keep their money. This increases demand for the local currency, which in Canada’s case is the Canadian Dollar.
Macroeconomic data releases gauge the health of the economy and can have an impact on the Canadian Dollar. Indicators such as GDP, Manufacturing and Services PMIs, employment, and consumer sentiment surveys can all influence the direction of the CAD. A strong economy is good for the Canadian Dollar. Not only does it attract more foreign investment but it may encourage the Bank of Canada to put up interest rates, leading to a stronger currency. If economic data is weak, however, the CAD is likely to fall.
-
05:36
India Gold price today: Gold falls, according to FXStreet data
Gold prices fell in India on Friday, according to data compiled by FXStreet.
The price for Gold stood at 8,145.09 Indian Rupees (INR) per gram, down compared with the INR 8,153.50 it cost on Thursday.
The price for Gold decreased to INR 95,002.70 per tola from INR 95,100.79 per tola a day earlier.
Unit measure Gold Price in INR 1 Gram 8,145.09 10 Grams 81,450.88 Tola 95,002.70 Troy Ounce 253,339.80 Daily Digest Market Movers: Gold price traders keenly await the US NFP report before placing fresh directional bets
-
Mounting worries over the potential impact of US President Donald Trump's trade tariffs on the US economy keep the US Dollar depressed near its lowest level since November 11 and should act as a tailwind for the Gold price.
-
The uncertainty surrounding Trump's trade policies, especially after another U-turn on the recently imposed tariffs on Mexico and Canada, continues to weigh on investor sentiment and could support the safe-haven precious metal.
-
Trump on Thursday exempted goods from both Canada and Mexico that comply with the US–Mexico–Canada Agreement for a month from the steep 25% tariffs, which went into effect earlier this week on Tuesday.
-
Traders have been pricing in the possibility of further policy easing by the Federal Reserve amid concerns about an economic slowdown in the US, which further undermines the USD and benefits the non-yielding yellow metal.
-
Philadelphia Fed President Patrick Harker on Thursday flagged growing threats to economic growth and risks to the inflation outlook, though acknowledged that the economy appears to be growing, with still low unemployment.
-
Separately, Atlanta Fed President Raphael Bostic noted that the US economy is in incredible flux and it’s hard to know where things will land. The central bank needs to be mindful of any changes that impact prices and employment.
-
Meanwhile, Fed Governing Board Member Christopher Waller said he leans strongly against a rate cut at the March meeting, although he reckons cuts later in the year remain on track if inflationary pressures continue to abate.
-
On the economic data front, the US Initial Jobless Claims fell more than expected, to 221K during the week ended March 1, though it failed to provide any respite to the USD bulls or influence the XAU/USD pair.
-
Traders keenly await the release of the crucial US Nonfarm Payrolls (NFP) report, which is expected to show that the economy added 160K new jobs in February and the Unemployment Rate held steady at 4%.
FXStreet calculates Gold prices in India by adapting international prices (USD/INR) to the local currency and measurement units. Prices are updated daily based on the market rates taken at the time of publication. Prices are just for reference and local rates could diverge slightly.
Gold FAQs
Gold has played a key role in human’s history as it has been widely used as a store of value and medium of exchange. Currently, apart from its shine and usage for jewelry, the precious metal is widely seen as a safe-haven asset, meaning that it is considered a good investment during turbulent times. Gold is also widely seen as a hedge against inflation and against depreciating currencies as it doesn’t rely on any specific issuer or government.
Central banks are the biggest Gold holders. In their aim to support their currencies in turbulent times, central banks tend to diversify their reserves and buy Gold to improve the perceived strength of the economy and the currency. High Gold reserves can be a source of trust for a country’s solvency. Central banks added 1,136 tonnes of Gold worth around $70 billion to their reserves in 2022, according to data from the World Gold Council. This is the highest yearly purchase since records began. Central banks from emerging economies such as China, India and Turkey are quickly increasing their Gold reserves.
Gold has an inverse correlation with the US Dollar and US Treasuries, which are both major reserve and safe-haven assets. When the Dollar depreciates, Gold tends to rise, enabling investors and central banks to diversify their assets in turbulent times. Gold is also inversely correlated with risk assets. A rally in the stock market tends to weaken Gold price, while sell-offs in riskier markets tend to favor the precious metal.
The price can move due to a wide range of factors. Geopolitical instability or fears of a deep recession can quickly make Gold price escalate due to its safe-haven status. As a yield-less asset, Gold tends to rise with lower interest rates, while higher cost of money usually weighs down on the yellow metal. Still, most moves depend on how the US Dollar (USD) behaves as the asset is priced in dollars (XAU/USD). A strong Dollar tends to keep the price of Gold controlled, whereas a weaker Dollar is likely to push Gold prices up.
(An automation tool was used in creating this post.)
-
-
05:25
China’s Foreign Minister says abuse of fentanyl is an issue that the US has to solve
Chinese Foreign Minister Wang Yi spoke on the sidelines of the National People's Congress (NPC) in Beijing on Friday. Wang said that the abuse of fentanyl is an issue that the US has to solve.
Key quotes
If one side exerts pressure, China will resolutely counter that.
The US and China have broad common interests and room for cooperation.
The US should not unilaterally impose tariffs.Market reaction
At the press time, the AUD/USD pair is down 0.40% on the day to trade at 0.6305.
US-China Trade War FAQs
Generally speaking, a trade war is an economic conflict between two or more countries due to extreme protectionism on one end. It implies the creation of trade barriers, such as tariffs, which result in counter-barriers, escalating import costs, and hence the cost of living.
An economic conflict between the United States (US) and China began early in 2018, when President Donald Trump set trade barriers on China, claiming unfair commercial practices and intellectual property theft from the Asian giant. China took retaliatory action, imposing tariffs on multiple US goods, such as automobiles and soybeans. Tensions escalated until the two countries signed the US-China Phase One trade deal in January 2020. The agreement required structural reforms and other changes to China’s economic and trade regime and pretended to restore stability and trust between the two nations. However, the Coronavirus pandemic took the focus out of the conflict. Yet, it is worth mentioning that President Joe Biden, who took office after Trump, kept tariffs in place and even added some additional levies.
The return of Donald Trump to the White House as the 47th US President has sparked a fresh wave of tensions between the two countries. During the 2024 election campaign, Trump pledged to impose 60% tariffs on China once he returned to office, which he did on January 20, 2025. With Trump back, the US-China trade war is meant to resume where it was left, with tit-for-tat policies affecting the global economic landscape amid disruptions in global supply chains, resulting in a reduction in spending, particularly investment, and directly feeding into the Consumer Price Index inflation.
-
05:24
Gold price remains depressed above $2,900, US NFP awaited
- Gold price edges lower on Friday amid some repositioning ahead of the crucial US NFP release.
- Rising trade tensions, the risk-off mood, and a weaker USD lend support to the precious metal.
- Bets for more interest rate cuts by the Fed contribute to limiting losses for the XAU/USD pair.
Gold price trades with a mild negative bias for the second successive day on Friday, though it lacks follow-through selling and remains confined in a multi-day-old trading range. The intraday downtick could be attributed to some repositioning trade ahead of the closely-watched US monthly employment details due later during the North American session. The popularly known Nonfarm Payrolls (NFP) report will play a key role in influencing the near-term US Dollar (USD) price dynamics and provide a fresh directional impetus to the commodity.
Heading into the key data risk, bets that the Federal Reserve (Fed) could cut rates multiple times in 2025 amid worries about a slowing US economic growth keep the USD depressed near a multi-month low touched on Thursday. Apart from this, persistent worries about US President Donald Trump's trade policies and the risk-off mood might continue to act as a tailwind for the safe-haven Gold price. This, in turn, warrants some caution for bearish traders and makes it prudent to wait for strong follow-through selling before positioning for any further losses.
Daily Digest Market Movers: Gold price traders keenly await the US NFP report before placing fresh directional bets
- Mounting worries over the potential impact of US President Donald Trump's trade tariffs on the US economy keep the US Dollar depressed near its lowest level since November 11 and should act as a tailwind for the Gold price.
- The uncertainty surrounding Trump's trade policies, especially after another U-turn on the recently imposed tariffs on Mexico and Canada, continues to weigh on investor sentiment and could support the safe-haven precious metal.
- Trump on Thursday exempted goods from both Canada and Mexico that comply with the US–Mexico–Canada Agreement for a month from the steep 25% tariffs, which went into effect earlier this week on Tuesday.
- Traders have been pricing in the possibility of further policy easing by the Federal Reserve amid concerns about an economic slowdown in the US, which further undermines the USD and benefits the non-yielding yellow metal.
- Philadelphia Fed President Patrick Harker on Thursday flagged growing threats to economic growth and risks to the inflation outlook, though acknowledged that the economy appears to be growing, with still low unemployment.
- Separately, Atlanta Fed President Raphael Bostic noted that the US economy is in incredible flux and it’s hard to know where things will land. The central bank needs to be mindful of any changes that impact prices and employment.
- Meanwhile, Fed Governing Board Member Christopher Waller said he leans strongly against a rate cut at the March meeting, although he reckons cuts later in the year remain on track if inflationary pressures continue to abate.
- On the economic data front, the US Initial Jobless Claims fell more than expected, to 221K during the week ended March 1, though it failed to provide any respite to the USD bulls or influence the XAU/USD pair.
- Traders keenly await the release of the crucial US Nonfarm Payrolls (NFP) report, which is expected to show that the economy added 160K new jobs in February and the Unemployment Rate held steady at 4%.
Gold price needs to find acceptance below $2,900 mark to back prospects for a meaningful drop
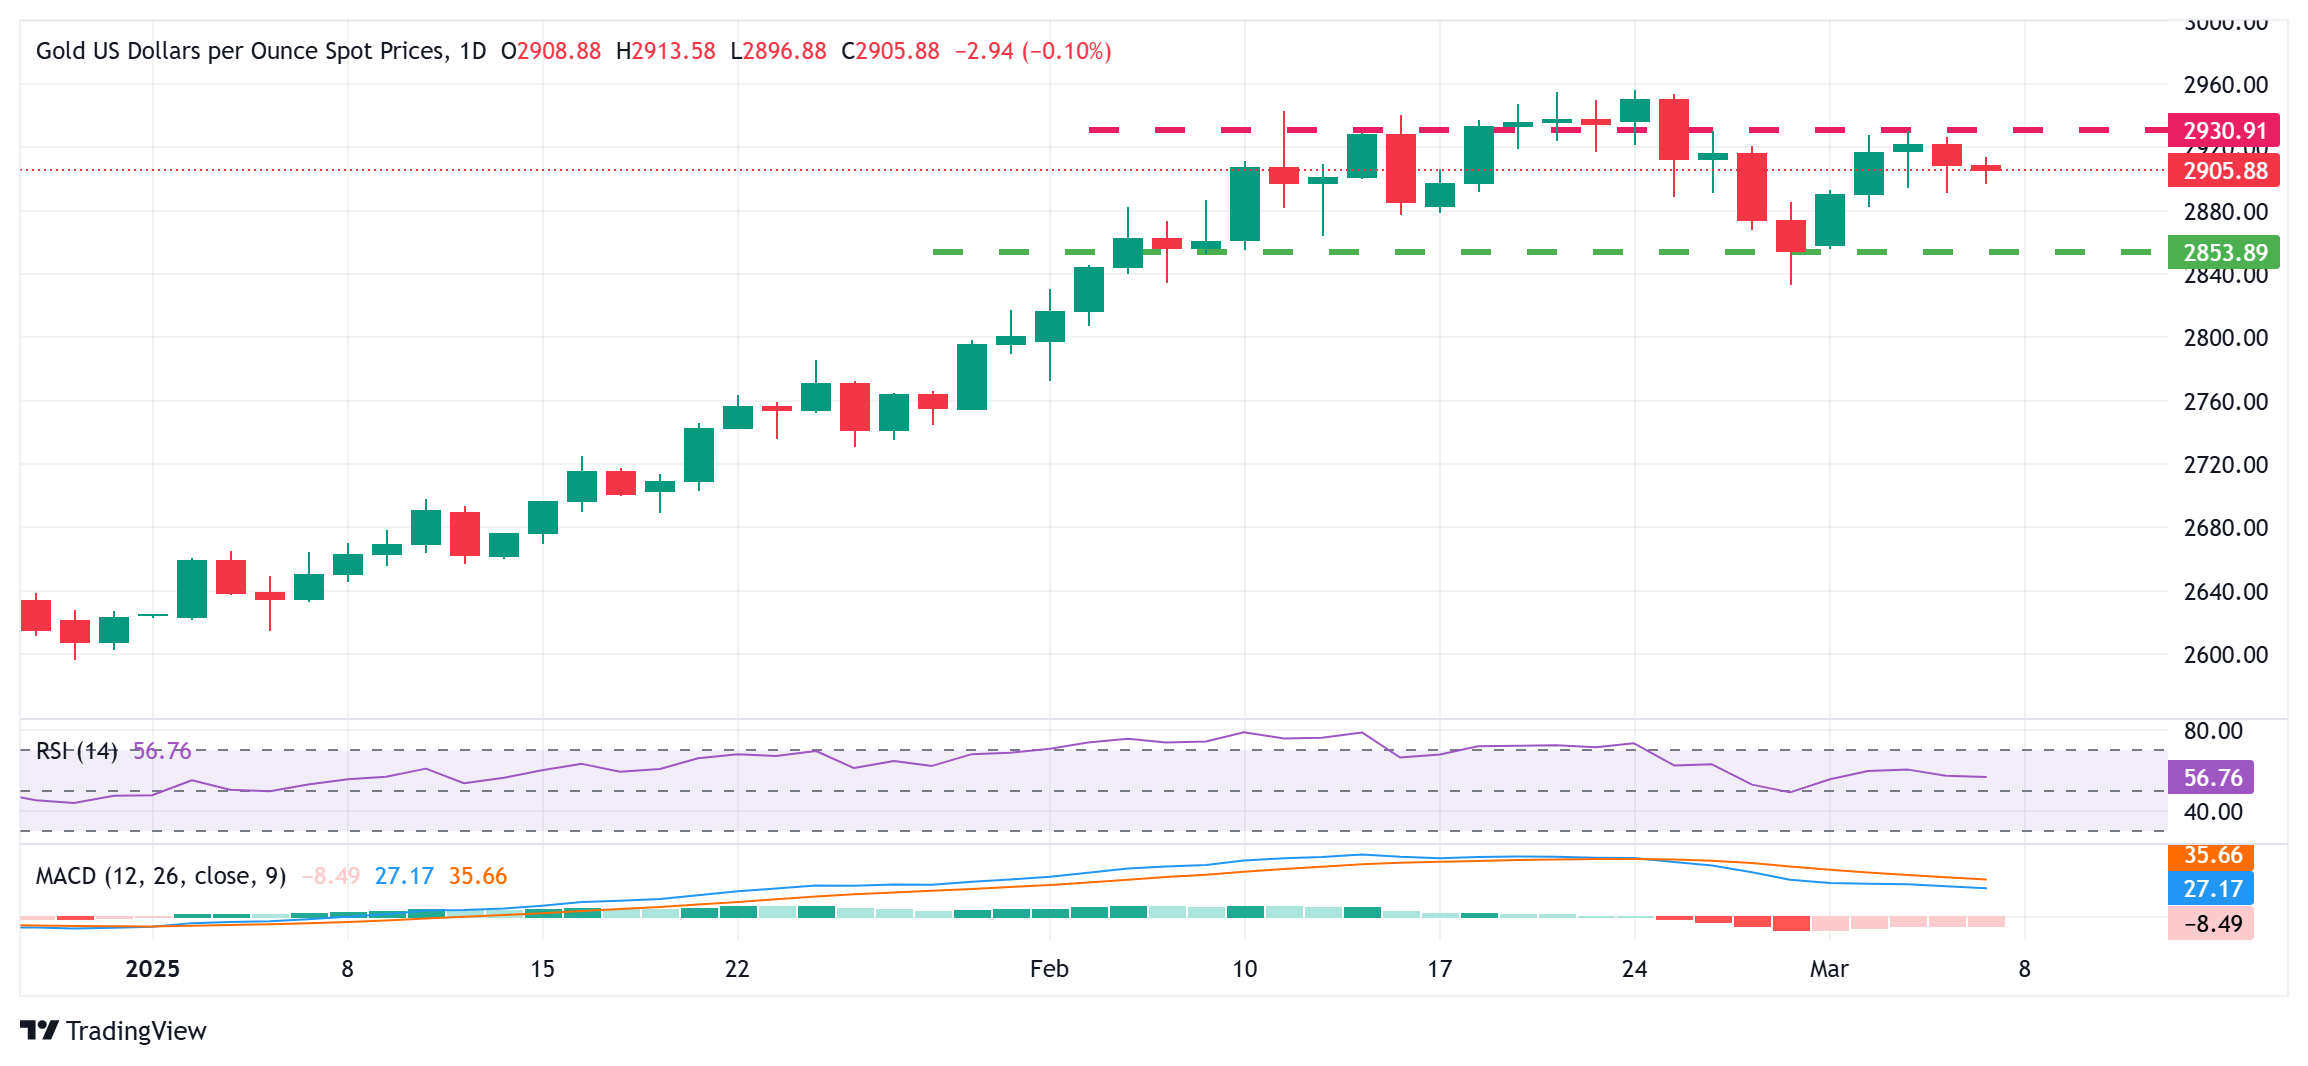
From a technical perspective, the Gold price has been showing resilience below the $2,900 round figure, warranting caution for bearish traders amid still positive oscillators on the daily chart. Acceptance below the said handle, however, could drag the XAU/USD to the $2,860-2,858 horizontal zone with some intermediate support near the $2,884-2,883 region. The downward trajectory could extend further towards last week's swing low, around the $2,833-2,832 area before the commodity eventually drops to the $2,800 mark.
On the flip side, the $2,926-2,930 zone now seems to have emerged as an immediate hurdle, above which the Gold price could aim to retest the all-time peak, around the $2,956 region touched in February. Some follow-through buying would be seen as a fresh trigger for bullish traders and pave the way for the resumption of the recent well-established uptrend witnessed over the past three months or so.
Gold FAQs
Gold has played a key role in human’s history as it has been widely used as a store of value and medium of exchange. Currently, apart from its shine and usage for jewelry, the precious metal is widely seen as a safe-haven asset, meaning that it is considered a good investment during turbulent times. Gold is also widely seen as a hedge against inflation and against depreciating currencies as it doesn’t rely on any specific issuer or government.
Central banks are the biggest Gold holders. In their aim to support their currencies in turbulent times, central banks tend to diversify their reserves and buy Gold to improve the perceived strength of the economy and the currency. High Gold reserves can be a source of trust for a country’s solvency. Central banks added 1,136 tonnes of Gold worth around $70 billion to their reserves in 2022, according to data from the World Gold Council. This is the highest yearly purchase since records began. Central banks from emerging economies such as China, India and Turkey are quickly increasing their Gold reserves.
Gold has an inverse correlation with the US Dollar and US Treasuries, which are both major reserve and safe-haven assets. When the Dollar depreciates, Gold tends to rise, enabling investors and central banks to diversify their assets in turbulent times. Gold is also inversely correlated with risk assets. A rally in the stock market tends to weaken Gold price, while sell-offs in riskier markets tend to favor the precious metal.
The price can move due to a wide range of factors. Geopolitical instability or fears of a deep recession can quickly make Gold price escalate due to its safe-haven status. As a yield-less asset, Gold tends to rise with lower interest rates, while higher cost of money usually weighs down on the yellow metal. Still, most moves depend on how the US Dollar (USD) behaves as the asset is priced in dollars (XAU/USD). A strong Dollar tends to keep the price of Gold controlled, whereas a weaker Dollar is likely to push Gold prices up.
-
05:04
China’s Trade Balance: Surplus widens in February
China's Trade Balance for February, in Chinese Yuan (CNY) terms, came in at CNY122 billion, compared to the previous figure of CNY752.91 billion.
Exports climbed by 3.4% YoY in February vs. 10.9% in January. The country’s imports fell by 7.3% YoY in the same period vs. 1.3% registered previously.
In US Dollar (USD) terms, China’s trade surplus expanded in February.
Trade Balance came in at +170.51B versus +104.84B expected and +142.4B previous.
Exports (YoY): 2.3% vs. 5.0% expected and 10.7% previous.
Imports (YoY): -8.4% vs. 1.0% expected and 1.0% last.Market reaction
The Australia Dollar (AUD) attracts some sellers after China’s trade data. The AUD/USD pair is losing 0.43% on the day to trade near 0.6303, as of writing.
Australian Dollar FAQs
One of the most significant factors for the Australian Dollar (AUD) is the level of interest rates set by the Reserve Bank of Australia (RBA). Because Australia is a resource-rich country another key driver is the price of its biggest export, Iron Ore. The health of the Chinese economy, its largest trading partner, is a factor, as well as inflation in Australia, its growth rate and Trade Balance. Market sentiment – whether investors are taking on more risky assets (risk-on) or seeking safe-havens (risk-off) – is also a factor, with risk-on positive for AUD.
The Reserve Bank of Australia (RBA) influences the Australian Dollar (AUD) by setting the level of interest rates that Australian banks can lend to each other. This influences the level of interest rates in the economy as a whole. The main goal of the RBA is to maintain a stable inflation rate of 2-3% by adjusting interest rates up or down. Relatively high interest rates compared to other major central banks support the AUD, and the opposite for relatively low. The RBA can also use quantitative easing and tightening to influence credit conditions, with the former AUD-negative and the latter AUD-positive.
China is Australia’s largest trading partner so the health of the Chinese economy is a major influence on the value of the Australian Dollar (AUD). When the Chinese economy is doing well it purchases more raw materials, goods and services from Australia, lifting demand for the AUD, and pushing up its value. The opposite is the case when the Chinese economy is not growing as fast as expected. Positive or negative surprises in Chinese growth data, therefore, often have a direct impact on the Australian Dollar and its pairs.
Iron Ore is Australia’s largest export, accounting for $118 billion a year according to data from 2021, with China as its primary destination. The price of Iron Ore, therefore, can be a driver of the Australian Dollar. Generally, if the price of Iron Ore rises, AUD also goes up, as aggregate demand for the currency increases. The opposite is the case if the price of Iron Ore falls. Higher Iron Ore prices also tend to result in a greater likelihood of a positive Trade Balance for Australia, which is also positive of the AUD.
The Trade Balance, which is the difference between what a country earns from its exports versus what it pays for its imports, is another factor that can influence the value of the Australian Dollar. If Australia produces highly sought after exports, then its currency will gain in value purely from the surplus demand created from foreign buyers seeking to purchase its exports versus what it spends to purchase imports. Therefore, a positive net Trade Balance strengthens the AUD, with the opposite effect if the Trade Balance is negative.
-
04:46
GBP/USD steadies around 1.2900 as traders adopt caution ahead of US Nonfarm Payrolls
- GBP/USD remains steady due to market caution ahead of the US NFP data release on Friday.
- The US Dollar weakens as US Treasury yields fall on rising sentiment of more aggressive Fed rate cuts this year.
- BoE’s Mann reiterated that the larger rate cut was intended to better communicate the policy stance.
GBP/USD holds little gains after registering losses in the previous session, trading around 1.2880 during the Asian hours on Friday. The pair steadies as traders adopt caution ahead of the US Nonfarm Payrolls (NFP) report scheduled to be released later in the North American session.
The US Dollar Index (DXY), which measures the USD against six major currencies, extends its losing streak for the fifth successive day, driven by falling US Treasury yields as markets anticipate more aggressive Fed rate cuts this year amid US growth concerns. The DXY is trading around 104.00 with 2- and 10-year yields on US Treasury bonds standing at 3.94% and 4.24%, respectively, at the time of writing.
According to MUFG Bank analysts, expectations are increasing that the Federal Reserve (Fed) may prioritize addressing slowing economic growth over elevated inflation in response to US tariffs, which could weigh on the US Dollar. A recent decline in consumer confidence indicates growing household concerns over the inflationary impact of tariffs and economic risks stemming from rising policy uncertainty in the United States (US).
Meanwhile, traders remain focused on global trade developments, as Canada postpones its planned second round of retaliatory tariffs on US products until April 2. This decision follows US President Donald Trump’s exemption of Mexican and Canadian goods under the USMCA from his proposed 25% tariffs.
In the United Kingdom (UK), rate markets now project fewer than 50 basis points (bps) in rate cuts from the Bank of England (BoE) in 2025, marking a substantial reduction in expectations as central banks continue to struggle with persistent inflation.
BoE Monetary Policy Committee member Catherine Mann stated on Thursday that gradual interest rate adjustments no longer provide clear signals to volatile financial markets. Mann emphasized that larger moves are now necessary to “cut through” market noise for the benefit of the economy. Citing Bloomberg, she noted that the larger rate cut she supported in the latest meeting aimed to more effectively convey policy stance and influence economic conditions.
Pound Sterling FAQs
The Pound Sterling (GBP) is the oldest currency in the world (886 AD) and the official currency of the United Kingdom. It is the fourth most traded unit for foreign exchange (FX) in the world, accounting for 12% of all transactions, averaging $630 billion a day, according to 2022 data. Its key trading pairs are GBP/USD, also known as ‘Cable’, which accounts for 11% of FX, GBP/JPY, or the ‘Dragon’ as it is known by traders (3%), and EUR/GBP (2%). The Pound Sterling is issued by the Bank of England (BoE).
The single most important factor influencing the value of the Pound Sterling is monetary policy decided by the Bank of England. The BoE bases its decisions on whether it has achieved its primary goal of “price stability” – a steady inflation rate of around 2%. Its primary tool for achieving this is the adjustment of interest rates. When inflation is too high, the BoE will try to rein it in by raising interest rates, making it more expensive for people and businesses to access credit. This is generally positive for GBP, as higher interest rates make the UK a more attractive place for global investors to park their money. When inflation falls too low it is a sign economic growth is slowing. In this scenario, the BoE will consider lowering interest rates to cheapen credit so businesses will borrow more to invest in growth-generating projects.
Data releases gauge the health of the economy and can impact the value of the Pound Sterling. Indicators such as GDP, Manufacturing and Services PMIs, and employment can all influence the direction of the GBP. A strong economy is good for Sterling. Not only does it attract more foreign investment but it may encourage the BoE to put up interest rates, which will directly strengthen GBP. Otherwise, if economic data is weak, the Pound Sterling is likely to fall.
Another significant data release for the Pound Sterling is the Trade Balance. This indicator measures the difference between what a country earns from its exports and what it spends on imports over a given period. If a country produces highly sought-after exports, its currency will benefit purely from the extra demand created from foreign buyers seeking to purchase these goods. Therefore, a positive net Trade Balance strengthens a currency and vice versa for a negative balance.
-
04:11
China Trade Balance CNY declined to 122B in February from previous 752.91B
-
04:09
China Trade Balance USD came in at $170.51B, above expectations ($142.4B) in February
-
04:05
China Imports (YoY) came in at -8.4%, below expectations (1%) in February
-
04:05
China Exports (YoY) came in at 2.3%, below expectations (5%) in February
-
04:05
China Exports (YoY) CNY declined to 3.4% in February from previous 10.9%
-
04:00
Indonesia Foreign Reserves dipped from previous $156.1 to $154.5 in February
-
03:39
NZD/USD remains below 0.5750 ahead of China’s trade balance
- NZD/USD holds losses due to market caution ahead of the release of China's trade data on Friday.
- Trump exempted Mexican and Canadian goods under the USMCA from his proposed 25% tariffs.
- US NFP is expected to increase to 160K in February, up from January’s softer reading of 143K.
NZD/USD halts its four-day losing streak, trading around 0.5730 during the Asian hours on Friday. The pair encounters challenges as market caution prevails ahead of the release of China's trade data and the US Nonfarm Payrolls (NFP) report later today.
Meanwhile, traders remain focused on global trade developments, as Canada postpones its planned second round of retaliatory tariffs on US products until April 2. This decision follows US President Donald Trump’s exemption of Mexican and Canadian goods under the USMCA from his proposed 25% tariffs.
US Initial Jobless Claims for the week ending March 1 dropped to 221K, compared to 242K in the previous week, according to the US Department of Labor (DOL) on Thursday. This figure came in below the market consensus of 235K. US NFP is expected to show a modest rebound in job growth. Projections suggest net job additions will rise to 160K in February, up from January’s subdued 143K.
According to MUFG Bank analysts, expectations are increasing that the Federal Reserve (Fed) may prioritize addressing slowing economic growth over elevated inflation in response to US tariffs, which could weigh on the US Dollar. A recent decline in consumer confidence indicates growing household concerns over the inflationary impact of tariffs and economic risks stemming from rising policy uncertainty in the United States (US).
The NZD/USD pair strengthened after Chinese officials pledged additional stimulus beyond the fiscal spending measures outlined in the government’s annual work report released on Wednesday. Given China’s position as New Zealand’s largest trading partner, this development provided support for the New Zealand Dollar (NZD).
China’s Finance Minister, Lan Foan, stated that the government remains open to further stimulus if the economy struggles to meet its 5% Gross Domestic Product (GDP) growth target. Additionally, People’s Bank of China Governor Pan Gongsheng reaffirmed a dovish stance on interest rates, stating that interest rate and Reserve Requirement Ratio (RRR) cuts will be implemented “at an appropriate time.”
New Zealand Dollar FAQs
The New Zealand Dollar (NZD), also known as the Kiwi, is a well-known traded currency among investors. Its value is broadly determined by the health of the New Zealand economy and the country’s central bank policy. Still, there are some unique particularities that also can make NZD move. The performance of the Chinese economy tends to move the Kiwi because China is New Zealand’s biggest trading partner. Bad news for the Chinese economy likely means less New Zealand exports to the country, hitting the economy and thus its currency. Another factor moving NZD is dairy prices as the dairy industry is New Zealand’s main export. High dairy prices boost export income, contributing positively to the economy and thus to the NZD.
The Reserve Bank of New Zealand (RBNZ) aims to achieve and maintain an inflation rate between 1% and 3% over the medium term, with a focus to keep it near the 2% mid-point. To this end, the bank sets an appropriate level of interest rates. When inflation is too high, the RBNZ will increase interest rates to cool the economy, but the move will also make bond yields higher, increasing investors’ appeal to invest in the country and thus boosting NZD. On the contrary, lower interest rates tend to weaken NZD. The so-called rate differential, or how rates in New Zealand are or are expected to be compared to the ones set by the US Federal Reserve, can also play a key role in moving the NZD/USD pair.
Macroeconomic data releases in New Zealand are key to assess the state of the economy and can impact the New Zealand Dollar’s (NZD) valuation. A strong economy, based on high economic growth, low unemployment and high confidence is good for NZD. High economic growth attracts foreign investment and may encourage the Reserve Bank of New Zealand to increase interest rates, if this economic strength comes together with elevated inflation. Conversely, if economic data is weak, NZD is likely to depreciate.
The New Zealand Dollar (NZD) tends to strengthen during risk-on periods, or when investors perceive that broader market risks are low and are optimistic about growth. This tends to lead to a more favorable outlook for commodities and so-called ‘commodity currencies’ such as the Kiwi. Conversely, NZD tends to weaken at times of market turbulence or economic uncertainty as investors tend to sell higher-risk assets and flee to the more-stable safe havens.
-
03:35
Japanese Yen stands firm near a multi-month high against a broadly weaker USD
- The Japanese Yen continues to be underpinned by increasing bets for more BoJ rate hikes.
- Trade tariff jitters and the risk-off mood further seem to underpin demand for the safe-haven JPY.
- Expectations for further policy easing by the Fed weigh on the USD and the USD/JPY pair.
The Japanese Yen (JPY) remains on the front foot against a broadly weaker US Dollar (USD) and keeps the USD/JPY pair close to its lowest level since early October touched on Thursday. Persistent speculation that the Bank of Japan (BoJ) will continue to raise interest rates has been exerting upward pressure on Japanese government bond (JGB) yields. The resultant narrowing of the rate differential between Japan and other countries continues to act as a tailwind for the lower-yielding JPY.
Meanwhile, the uncertainty surrounding US President Donald Trump's trade policies and their impact on global economic growth continue to weigh on investors' sentiment. This is evident from a weaker tone around the equity markets and turns out to be another factor backing the safe-haven JPY. The USD bears, however, seem reluctant to place fresh bets and opt to wait for the release of the US Nonfarm Payrolls (NFP) report, which, in turn, limits losses for the USD/JPY pair.
Japanese Yen remains well supported by hawkish BoJ expectations and rising trade tensions
- Bank of Japan Deputy Governor Shinichi Uchida said earlier this week that the central bank was likely to raise interest rates at a pace in line with dominant views among financial markets and economists.
- Moreover, a global sell-off in bonds contributes to the upswing in the benchmark 10-year Japanese government bond yield, to its highest level since June 2009, and continues to underpin the Japanese Yen.
- Investors remain on the sidelines and keenly await more clarity on US President Donald Trump's trade policies, especially after another U-turn on the recently imposed tariffs on Mexico and Canada.
- Trump on Thursday exempted goods from both Canada and Mexico that comply with the US–Mexico–Canada Agreement for a month from the steep 25% tariffs that he had imposed earlier this week.
- Meanwhile, worries that Trump's trade tariffs could slow the US economic growth in the long run continue to fuel speculation that the Federal Reserve will resume cutting interest rates as soon as May.
- Philadelphia Fed President Patrick Harker said that trouble may be brewing for the US economy which is in good shape but showing signs of stress in the consumer sector and risks to the inflation outlook.
- This, to a larger extent, overshadows data showing that the US Initial Jobless Claims fell more than expected, to 221K during the week ended March 1 and dragged the US Dollar to a multi-month trough.
- Atlanta Fed President Raphael Bostic noted that the US economy is in an incredible state of flux and it’s hard to know where things will land. The central bank needs to be mindful of any changes that impact prices and employment.
- Fed Governing Board Member Christopher Waller said he leans strongly against a rate cut at the March meeting, although he reckons cuts later in the year remain on track if inflation pressures continue to abate.
- Investors currently see negligible odds of a March cut, remain divided over the May meeting, and are pricing in a rate cut at the June FOMC meeting. The Fed is expected to lower borrowing costs again in September.
- Traders now look forward to the release of the US Nonfarm Payrolls (NFP) report, which is expected to show that the economy added 160K new jobs in February and the Unemployment Rate held steady at 4%.
USD/JPY might consolidate before the next leg down; bearish potential remains intact
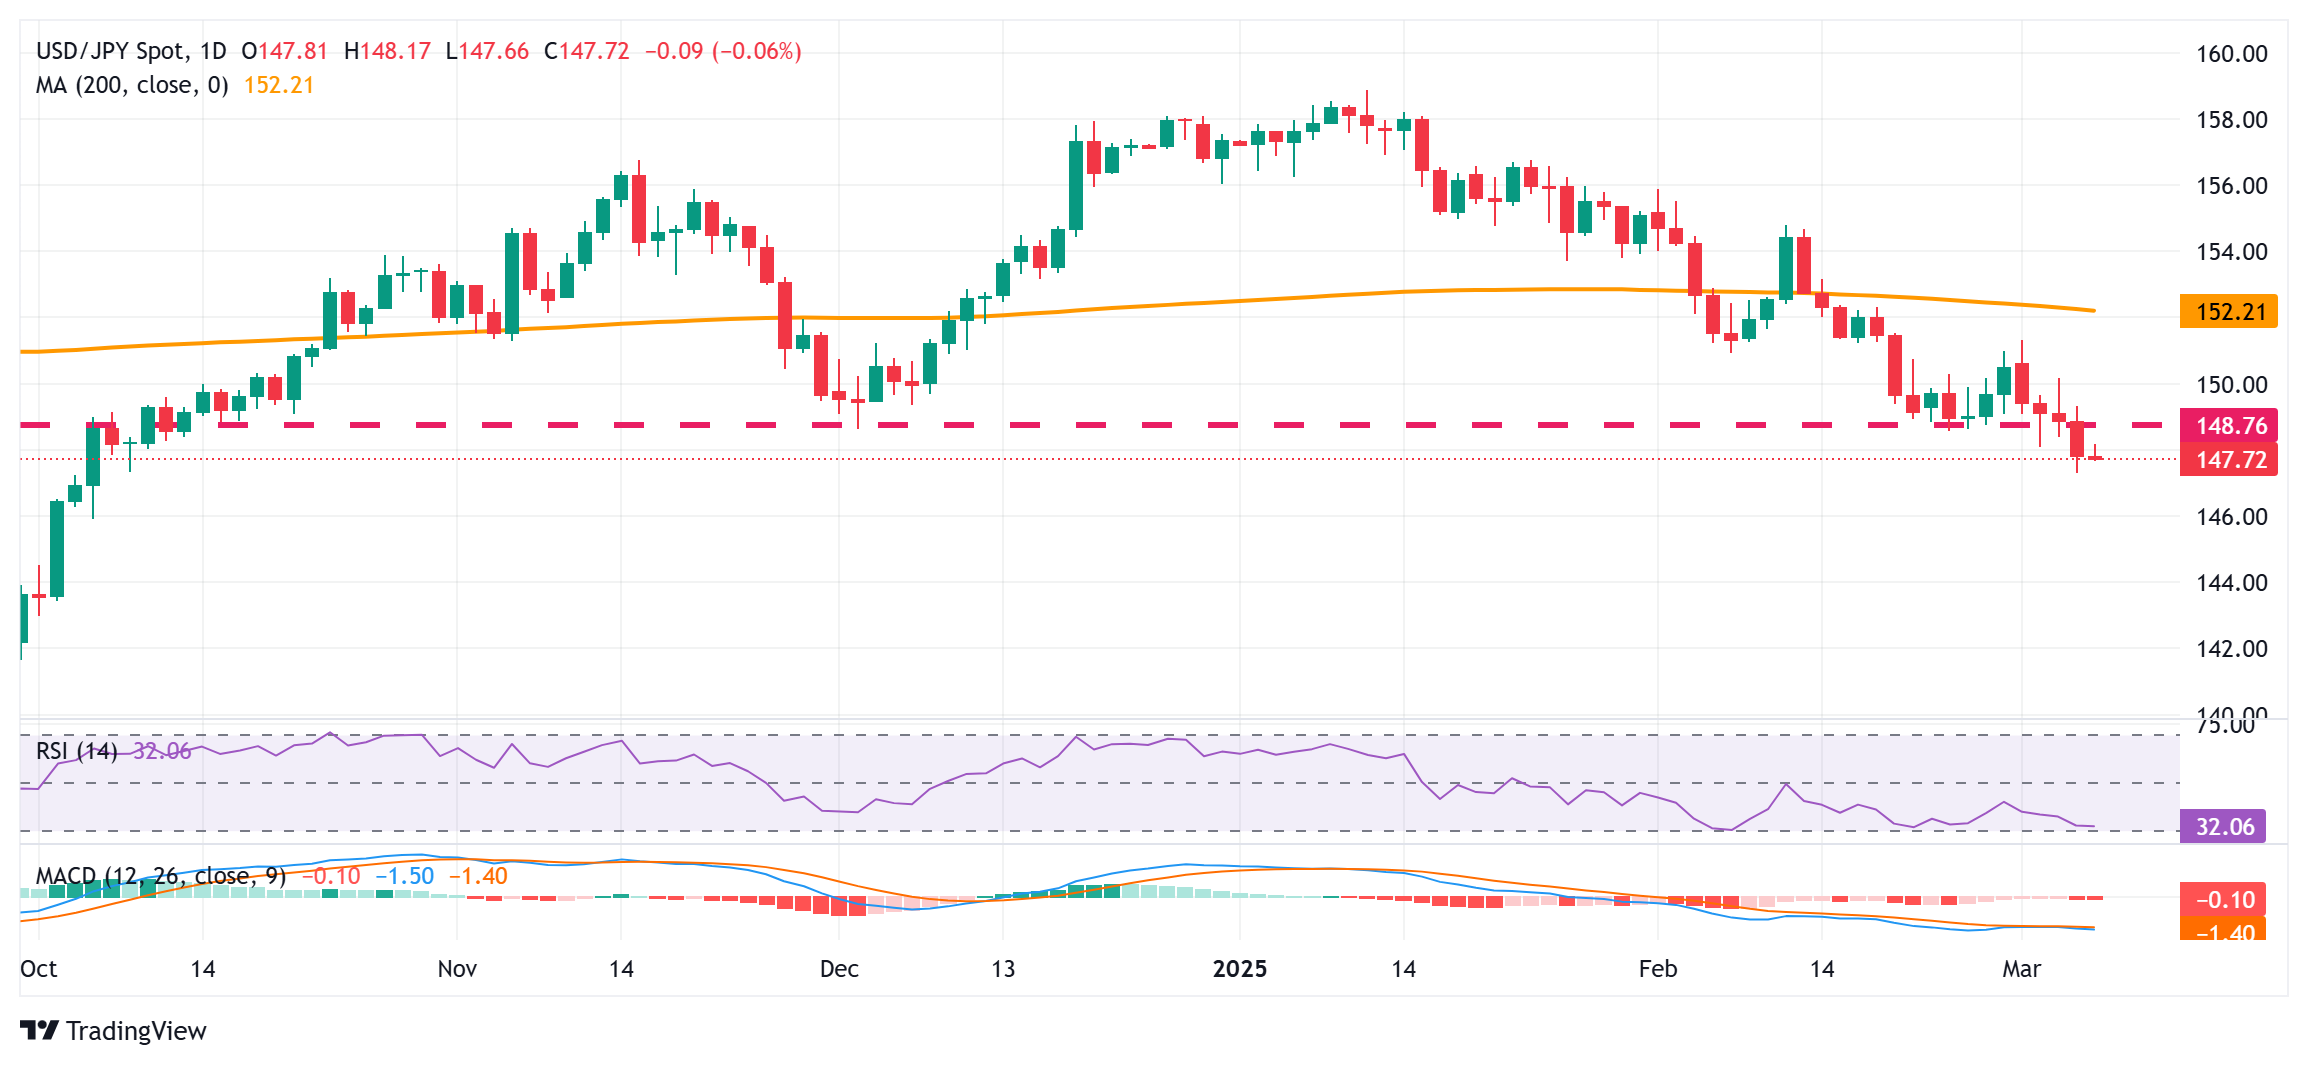
From a technical perspective, this week's breakdown below the 148.70-148.65 horizontal support is seen as a key trigger for bearish traders. That said, the Relative Strength Index (RSI) on the daily chart has moved on the verge of breaking into the oversold territory and warrants some caution. Hence, it will be prudent to wait for some near-term consolidation or a modest bounce before positioning for an extension of the USD/JPY pair's two-month-old downtrend.
In the meantime, the aforementioned support breakpoint, around the 148.65-148.70 region, could cap any attempted recovery. This is closely followed by the 149.00 round figure, above which a bout of a short-covering move has the potential to lift the USD/JPY pair towards the 150.00 psychological mark. The momentum could extend towards the 150.60 intermediate hurdle en route to the 151.00 mark, though it is likely to remain capped near the 151.30 region, or the monthly peak.
On the flip side, the multi-month low, around the 147.30 area touched on Thursday, now seems to act as immediate support ahead of the 147.00 mark. Some follow-through selling could expose the next relevant support near the 146.40 region before the USD/JPY pair eventually drops to the 146.00 round figure en route to the 145.60-145.50 zone and the 145.00 psychological mark.
Japanese Yen FAQs
The Japanese Yen (JPY) is one of the world’s most traded currencies. Its value is broadly determined by the performance of the Japanese economy, but more specifically by the Bank of Japan’s policy, the differential between Japanese and US bond yields, or risk sentiment among traders, among other factors.
One of the Bank of Japan’s mandates is currency control, so its moves are key for the Yen. The BoJ has directly intervened in currency markets sometimes, generally to lower the value of the Yen, although it refrains from doing it often due to political concerns of its main trading partners. The BoJ ultra-loose monetary policy between 2013 and 2024 caused the Yen to depreciate against its main currency peers due to an increasing policy divergence between the Bank of Japan and other main central banks. More recently, the gradually unwinding of this ultra-loose policy has given some support to the Yen.
Over the last decade, the BoJ’s stance of sticking to ultra-loose monetary policy has led to a widening policy divergence with other central banks, particularly with the US Federal Reserve. This supported a widening of the differential between the 10-year US and Japanese bonds, which favored the US Dollar against the Japanese Yen. The BoJ decision in 2024 to gradually abandon the ultra-loose policy, coupled with interest-rate cuts in other major central banks, is narrowing this differential.
The Japanese Yen is often seen as a safe-haven investment. This means that in times of market stress, investors are more likely to put their money in the Japanese currency due to its supposed reliability and stability. Turbulent times are likely to strengthen the Yen’s value against other currencies seen as more risky to invest in.
-
03:33
USD/INR holds steady ahead of US NFP release
- The Indian Rupee flatlines in Friday’s Asian session.
- Persistent outflows from local stocks and expectations of RBI rate cuts undermine the INR.
- The February US Nonfarm Payrolls report on Friday will be closely watched.
The Indian Rupee (INR) trades on a flat note on Friday. Persistent outflows by Foreign Institutional Investors (FII) could exert some selling pressure on the local currency. The rising expectation that the Reserve Bank of India (RBI) will cut its interest rates further is likely to contribute to the INR’s downside.
On the other hand, a fall in crude oil prices might provide some respite for the INR as India is the world's third-largest oil consumer. Foreign exchange intervention from the Indian central bank might prevent the INR from significantly depreciating.
Traders brace for the US February employment report on Friday, including Nonfarm Payrolls (NFP), Unemployment Rate and Average Hourly Earnings. This report could offer some hints about the economic health of the world's biggest economy and gauge the interest rate trajectory.Indian Rupee steadies amid the global market volatility sparked by Trump's tariffs
- RBI said on Wednesday it will infuse $21 billion in Rupee liquidity into the banking system in a bid to ease lending conditions and boost economic growth.
- Trump issued an executive order earlier in the day exempting goods from both Canada and Mexico under a North American trade agreement, known as USMCA, for a month from the 25% tariffs that he imposed earlier this week.
- US Initial Jobless Claims for the week ending March 1 dropped to 221K, compared to 242K in the previous week, according to the US Department of Labor (DOL) on Thursday. This figure came in below the market consensus of 235K.
- Continuing Jobless Claims for the week ending February 22 went up by 42K to reach 1.897M, compared to 1.855M (revised from 1.862M) in the previous week.
- Atlanta Fed President Raphael Bostic said late Thursday that The US economy is in incredible flux and it’s hard to know where things will land.
- Economists predict that 160,000 jobs will be added, and the unemployment rate will hold steady at 4.0%. Average Hourly Earnings are expected to rise by 0.3% compared to the previous month.
USD/INR maintains its constructive bias despite consolidation in the near term
The Indian Rupee trades flat on the day. The bullish outlook of the USD/INR pair remains intact, characterized by the price holding above the key 100-day Exponential Moving Average (EMA) on the daily timeframe. However, the 14-day Relative Strength Index (RSI) hovers around the midline near 50.0, suggesting that further consolidation cannot be ruled out in the near term.
The first upside barrier for USD/INR is located at 87.53, the high of February 28. Sustained trading above the mentioned level could see a rally to an all-time high near 88.00 before 88.50.
On the downside, the low of February 21 at 86.48 acts as an initial support level for the pair. Further south, the next contention level to watch is 86.14, the low of January 27, followed by 85.60, the low of January 6.Indian Rupee FAQs
The Indian Rupee (INR) is one of the most sensitive currencies to external factors. The price of Crude Oil (the country is highly dependent on imported Oil), the value of the US Dollar – most trade is conducted in USD – and the level of foreign investment, are all influential. Direct intervention by the Reserve Bank of India (RBI) in FX markets to keep the exchange rate stable, as well as the level of interest rates set by the RBI, are further major influencing factors on the Rupee.
The Reserve Bank of India (RBI) actively intervenes in forex markets to maintain a stable exchange rate, to help facilitate trade. In addition, the RBI tries to maintain the inflation rate at its 4% target by adjusting interest rates. Higher interest rates usually strengthen the Rupee. This is due to the role of the ‘carry trade’ in which investors borrow in countries with lower interest rates so as to place their money in countries’ offering relatively higher interest rates and profit from the difference.
Macroeconomic factors that influence the value of the Rupee include inflation, interest rates, the economic growth rate (GDP), the balance of trade, and inflows from foreign investment. A higher growth rate can lead to more overseas investment, pushing up demand for the Rupee. A less negative balance of trade will eventually lead to a stronger Rupee. Higher interest rates, especially real rates (interest rates less inflation) are also positive for the Rupee. A risk-on environment can lead to greater inflows of Foreign Direct and Indirect Investment (FDI and FII), which also benefit the Rupee.
Higher inflation, particularly, if it is comparatively higher than India’s peers, is generally negative for the currency as it reflects devaluation through oversupply. Inflation also increases the cost of exports, leading to more Rupees being sold to purchase foreign imports, which is Rupee-negative. At the same time, higher inflation usually leads to the Reserve Bank of India (RBI) raising interest rates and this can be positive for the Rupee, due to increased demand from international investors. The opposite effect is true of lower inflation.
-
03:30
Commodities. Daily history for Thursday, March 6, 2025
Raw materials Closed Change, % Silver 32.636 -0.16 Gold 2911.48 -0.24 Palladium 940.79 -0.73 -
02:37
Australian Dollar depreciates due to market caution ahead of US NFP
- The Australian Dollar weakens as the US Dollar remains firm ahead of Friday’s Nonfarm Payrolls release.
- The AUD may find support after Trump exempted Mexican and Canadian goods under the USMCA from his proposed 25% tariffs.
- US NFP is expected to increase to 160K in February, up from January’s softer reading of 143K.
The Australian Dollar (AUD) remains subdued against the US Dollar (USD) for the second consecutive day on Friday. The AUD/USD pair faces modest headwinds as the USD steadies ahead of the upcoming Nonfarm Payrolls (NFP) report in the North American session.
The Reserve Bank of Australia (RBA) maintains its outlook for economic growth to slow toward 2% by 2025. While its stance has previously bolstered AUD strength, investors remain cautious about potential policy shifts in response to inflation and labor market dynamics.
The AUD could find support from easing concerns after US President Donald Trump altered his stance on tariffs again. Trump exempted Mexican and Canadian goods covered by the USMCA from his proposed 25% tariffs.
The Aussie Dollar struggled despite stronger-than-expected Australian GDP data amid trade policy uncertainties and broader economic concerns. In Q4 2024, Australia’s GDP grew by 0.6% quarter-over-quarter, surpassing Q3’s 0.3% expansion and beating market expectations of 0.5%. On an annual basis, GDP climbed to 1.3% in Q4 from 0.8% in the prior quarter.
Meanwhile, geopolitical tensions remain a downside risk. A Chinese foreign ministry spokesperson warned late Wednesday that China is prepared to engage in "any type" of war in response to Trump’s escalating trade tariffs, according to the BBC. Given China’s status as Australia’s largest trade partner, this development could weigh on the Australian Dollar.
Australian Dollar declines as US Dollar steadies ahead of Nonfarm Payrolls
- The US Dollar Index (DXY), which measures the USD against six major currencies, trades around 104.10 at the time of writing. The Greenback faced downward pressure amid concerns over slowing US economic momentum.
- Traders are now closely watching Friday’s US Nonfarm Payrolls (NFP) report, which is expected to show a modest rebound in job growth. Projections suggest net job additions will rise to 160K in February, up from January’s subdued 143K.
- US Initial Jobless Claims for the week ending March 1 dropped to 221K, compared to 242K in the previous week, according to the US Department of Labor (DOL) on Thursday. This figure came in below the market consensus of 235K. The ADP Employment Change for February reported just 77K new jobs, falling significantly short of the 140K forecast and well below January’s 186K figure.
- Atlanta Fed President Raphael Bostic said late Thursday that the US economy is in incredible flux and it’s hard to know where things will land. Bostic also emphasized later that the Fed remains committed to bringing inflation down to 2% while striving to minimize disruptions to the labor market. He also highlighted that business sentiment plays a key role in his approach to setting interest rates.
- The Federal Reserve’s (Fed) Beige Book for March carries added significance as concerns grow over the economic impact of President Trump’s trade policies. Signs of strain are emerging within the US economy, even before the full implementation of his trade measures.
- Australia’s trade surplus rose to 5,620 million in January, surpassing the expected 5,500 million and improving from the previous 4,924 million (revised from 5,085 million). Exports climbed 1.3% month-over-month from the prior month, reaching an 11-month high driven by non-monetary gold. Meanwhile, imports declined by 0.3% MoM, following a sharp 5.9% increase in the previous month, according to the Australian Bureau of Statistics.
- Building permits in Australia surged 6.3% month-on-month in January, significantly accelerating from an upwardly revised 1.7% growth in December. This marks the second consecutive month of expansion and the fastest pace since last July.
- The Judo Bank Composite Purchasing Managers’ Index (PMI) declined to 50.6 in February from 51.1 in January, marking the fifth consecutive month of growth in business activity, albeit at a slower pace. The Services PMI also eased to 50.8 from 51.2, reflecting continued expansion for the thirteenth straight month, though at a moderated rate.
- Reserve Bank of Australia (RBA) Deputy Governor Andrew Hauser highlighted that global trade uncertainty is at a 50-year high. Hauser warned that uncertainty stemming from US President Donald Trump's tariffs could prompt businesses and households to delay planning and investment, potentially weighing on economic growth.
- China cleared a record 3.8 trillion yuan ($530 billion) in bad assets in 2024 as officials ramped up efforts to tackle financial risks, according to the country’s financial regulator. Looking ahead to 2025, regulators are making the housing market a top priority, signaling continued efforts to steady the economy and rebuild confidence in the struggling property sector.
Australian Dollar tests lower ascending channel boundary near 0.6300
AUD/USD is trading near 0.6320 on Friday, with technical analysis of the daily chart showing that the pair is confined within a newly formed ascending channel pattern, indicating a bullish bias. The 14-day Relative Strength Index (RSI) remains above 50, further supporting the bullish outlook.
On the upside, the first resistance appears at the three-month high of 0.6408, recorded on February 21, followed by the upper boundary of the ascending channel at 0.6440.
The immediate support for AUD/USD is at the 50-day Exponential Moving Average (EMA) of 0.6309, which aligns with the lower boundary of the ascending channel. Additional support is seen at the nine-day EMA of 0.6299. A break below this key support zone could trigger further declines, potentially retesting the four-week low of 0.6187, recorded on March 5.
AUD/USD: Daily Chart
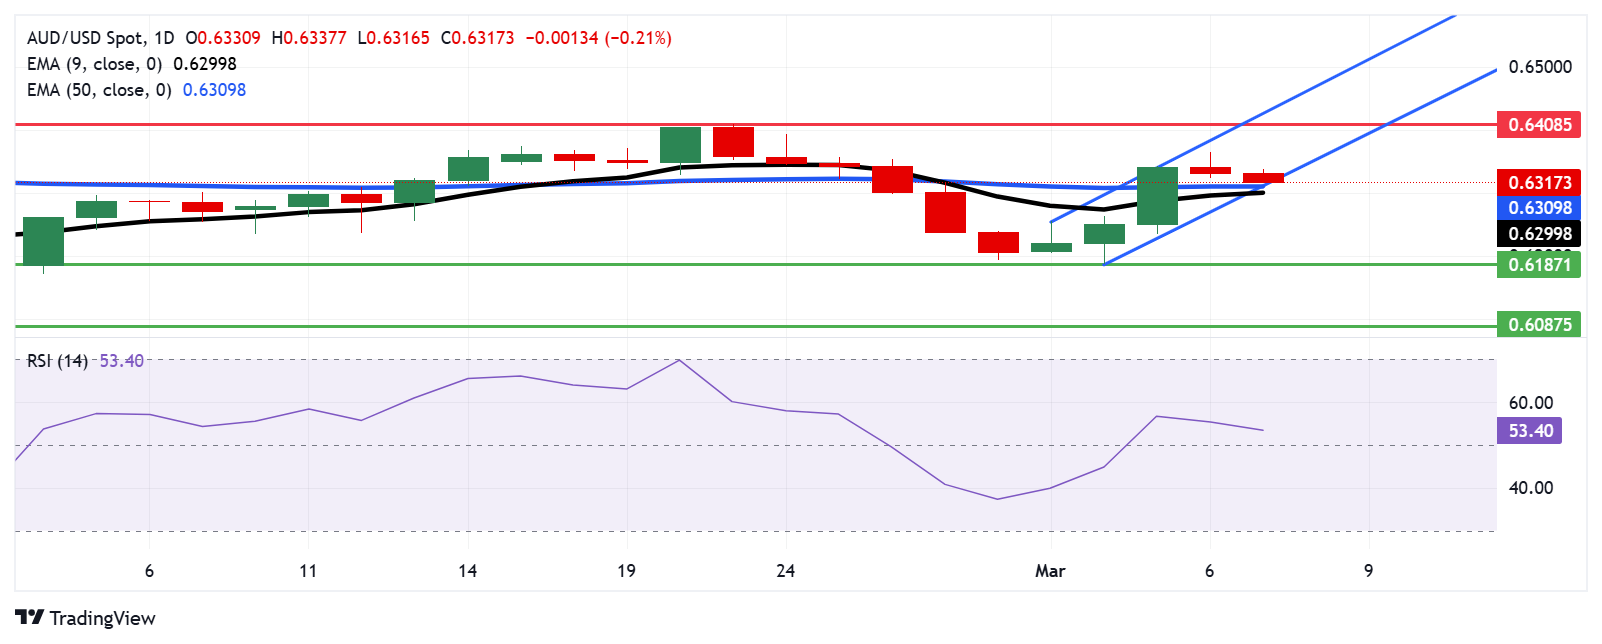
Australian Dollar PRICE Today
The table below shows the percentage change of Australian Dollar (AUD) against listed major currencies today. Australian Dollar was the weakest against the Canadian Dollar.
USD EUR GBP JPY CAD AUD NZD CHF USD 0.01% -0.01% 0.13% -0.05% 0.17% 0.03% -0.08% EUR -0.01% -0.03% 0.13% -0.06% 0.16% 0.02% -0.08% GBP 0.01% 0.03% 0.17% -0.03% 0.18% 0.04% -0.03% JPY -0.13% -0.13% -0.17% -0.19% 0.03% -0.12% -0.18% CAD 0.05% 0.06% 0.03% 0.19% 0.21% 0.08% 0.00% AUD -0.17% -0.16% -0.18% -0.03% -0.21% -0.14% -0.20% NZD -0.03% -0.02% -0.04% 0.12% -0.08% 0.14% -0.07% CHF 0.08% 0.08% 0.03% 0.18% -0.01% 0.20% 0.07% The heat map shows percentage changes of major currencies against each other. The base currency is picked from the left column, while the quote currency is picked from the top row. For example, if you pick the Australian Dollar from the left column and move along the horizontal line to the US Dollar, the percentage change displayed in the box will represent AUD (base)/USD (quote).
Australian Dollar FAQs
One of the most significant factors for the Australian Dollar (AUD) is the level of interest rates set by the Reserve Bank of Australia (RBA). Because Australia is a resource-rich country another key driver is the price of its biggest export, Iron Ore. The health of the Chinese economy, its largest trading partner, is a factor, as well as inflation in Australia, its growth rate and Trade Balance. Market sentiment – whether investors are taking on more risky assets (risk-on) or seeking safe-havens (risk-off) – is also a factor, with risk-on positive for AUD.
The Reserve Bank of Australia (RBA) influences the Australian Dollar (AUD) by setting the level of interest rates that Australian banks can lend to each other. This influences the level of interest rates in the economy as a whole. The main goal of the RBA is to maintain a stable inflation rate of 2-3% by adjusting interest rates up or down. Relatively high interest rates compared to other major central banks support the AUD, and the opposite for relatively low. The RBA can also use quantitative easing and tightening to influence credit conditions, with the former AUD-negative and the latter AUD-positive.
China is Australia’s largest trading partner so the health of the Chinese economy is a major influence on the value of the Australian Dollar (AUD). When the Chinese economy is doing well it purchases more raw materials, goods and services from Australia, lifting demand for the AUD, and pushing up its value. The opposite is the case when the Chinese economy is not growing as fast as expected. Positive or negative surprises in Chinese growth data, therefore, often have a direct impact on the Australian Dollar and its pairs.
Iron Ore is Australia’s largest export, accounting for $118 billion a year according to data from 2021, with China as its primary destination. The price of Iron Ore, therefore, can be a driver of the Australian Dollar. Generally, if the price of Iron Ore rises, AUD also goes up, as aggregate demand for the currency increases. The opposite is the case if the price of Iron Ore falls. Higher Iron Ore prices also tend to result in a greater likelihood of a positive Trade Balance for Australia, which is also positive of the AUD.
The Trade Balance, which is the difference between what a country earns from its exports versus what it pays for its imports, is another factor that can influence the value of the Australian Dollar. If Australia produces highly sought after exports, then its currency will gain in value purely from the surplus demand created from foreign buyers seeking to purchase its exports versus what it spends to purchase imports. Therefore, a positive net Trade Balance strengthens the AUD, with the opposite effect if the Trade Balance is negative.
-
02:15
PBOC sets USD/CNY reference rate at 7.1705 vs. 7.1692 previous
On Friday, the People’s Bank of China (PBOC) set the USD/CNY central rate for the trading session ahead at 7.1705 as compared to the previous day's fix of 7.1692 and 7.2406 Reuters estimates.
PBOC FAQs
The primary monetary policy objectives of the People's Bank of China (PBoC) are to safeguard price stability, including exchange rate stability, and promote economic growth. China’s central bank also aims to implement financial reforms, such as opening and developing the financial market.
The PBoC is owned by the state of the People's Republic of China (PRC), so it is not considered an autonomous institution. The Chinese Communist Party (CCP) Committee Secretary, nominated by the Chairman of the State Council, has a key influence on the PBoC’s management and direction, not the governor. However, Mr. Pan Gongsheng currently holds both of these posts.
Unlike the Western economies, the PBoC uses a broader set of monetary policy instruments to achieve its objectives. The primary tools include a seven-day Reverse Repo Rate (RRR), Medium-term Lending Facility (MLF), foreign exchange interventions and Reserve Requirement Ratio (RRR). However, The Loan Prime Rate (LPR) is China’s benchmark interest rate. Changes to the LPR directly influence the rates that need to be paid in the market for loans and mortgages and the interest paid on savings. By changing the LPR, China’s central bank can also influence the exchange rates of the Chinese Renminbi.
Yes, China has 19 private banks – a small fraction of the financial system. The largest private banks are digital lenders WeBank and MYbank, which are backed by tech giants Tencent and Ant Group, per The Straits Times. In 2014, China allowed domestic lenders fully capitalized by private funds to operate in the state-dominated financial sector.
-
02:04
WTI remains on the defensive near $66.00 amid tariff uncertainty
- WTI price remains under pressure around $66.00 in Friday’s early Asian session.
- Rising US inventories and plans to increase OPEC+ output weigh on the WTI price.
- Oil traders brace for the US February employment report on Friday for fresh impetus.
West Texas Intermediate (WTI), the US crude oil benchmark, is trading around $66.00 during the early Asian session on Friday. The WTI price remains on the defensive near a three-year low as traders are concerned about the impact of tariffs between the US, Canada, and China and plans by OPEC+ to raise output.
US President Donald Trump issued an executive order earlier in the day exempting goods from both Canada and Mexico under a North American trade agreement, known as USMCA, for a month from the 25% tariffs that he slapped earlier this week. However, tariff uncertainty under the Trump administration continues to undermine the WTI price.
A larger-than-expected build in US crude inventories further pressured the black gold. Crude oil stockpiles in the United States for the week ending February 28 rose by 3.614 million barrels, compared to a fall of 2.332 million barrels in the previous week, according to the Energy Information Administration (EIA) weekly report. The market consensus estimated that stocks would decrease by 290,000 barrels.
OPEC+, the Organization of the Petroleum Exporting Countries and allies including Russia, decided to increase output for the first time since 2022. This, in turn, drags the black gold price lower. Downside risks on demand will likely be greater than supply-side risks at this point with the additional oil coming from OPEC, said Scott Shelton, energy analyst at TP ICAP.
Oil traders will closely watch the release of the US employment report for February on Friday, including Nonfarm Payrolls (NFP), Unemployment Rate and Average Hourly Earnings. If the report shows a weaker-than-expected outcome, this could exert some selling pressure on the Greenback and lift the USD-denominated commodity price in the near term.WTI Oil FAQs
WTI Oil is a type of Crude Oil sold on international markets. The WTI stands for West Texas Intermediate, one of three major types including Brent and Dubai Crude. WTI is also referred to as “light” and “sweet” because of its relatively low gravity and sulfur content respectively. It is considered a high quality Oil that is easily refined. It is sourced in the United States and distributed via the Cushing hub, which is considered “The Pipeline Crossroads of the World”. It is a benchmark for the Oil market and WTI price is frequently quoted in the media.
Like all assets, supply and demand are the key drivers of WTI Oil price. As such, global growth can be a driver of increased demand and vice versa for weak global growth. Political instability, wars, and sanctions can disrupt supply and impact prices. The decisions of OPEC, a group of major Oil-producing countries, is another key driver of price. The value of the US Dollar influences the price of WTI Crude Oil, since Oil is predominantly traded in US Dollars, thus a weaker US Dollar can make Oil more affordable and vice versa.
The weekly Oil inventory reports published by the American Petroleum Institute (API) and the Energy Information Agency (EIA) impact the price of WTI Oil. Changes in inventories reflect fluctuating supply and demand. If the data shows a drop in inventories it can indicate increased demand, pushing up Oil price. Higher inventories can reflect increased supply, pushing down prices. API’s report is published every Tuesday and EIA’s the day after. Their results are usually similar, falling within 1% of each other 75% of the time. The EIA data is considered more reliable, since it is a government agency.
OPEC (Organization of the Petroleum Exporting Countries) is a group of 12 Oil-producing nations who collectively decide production quotas for member countries at twice-yearly meetings. Their decisions often impact WTI Oil prices. When OPEC decides to lower quotas, it can tighten supply, pushing up Oil prices. When OPEC increases production, it has the opposite effect. OPEC+ refers to an expanded group that includes ten extra non-OPEC members, the most notable of which is Russia.
-
01:42
Japan's Kato: There have been one-sided forex moves since December
Japan's Finance Minister, Katsunobu Kato, said early Friday that there have been one-sided and rapid market moves, adding that he will take appropriate action against excessive foreign exchange moves.
Key quotes
Recently, there have been one-sided, rapid market moves.
It is important for currencies to move in a stable manner that reflects fundamentals.
Appropriate action will be taken against excessive movements.
Monetary policy decisions are up to the Bank of Japan.
Deeply concerned about recent foreign exchange moves.Market reaction
At the press time, the USD/JPY pair is up 0.03% on the day to trade at 147.85.
Japanese Yen FAQs
The Japanese Yen (JPY) is one of the world’s most traded currencies. Its value is broadly determined by the performance of the Japanese economy, but more specifically by the Bank of Japan’s policy, the differential between Japanese and US bond yields, or risk sentiment among traders, among other factors.
One of the Bank of Japan’s mandates is currency control, so its moves are key for the Yen. The BoJ has directly intervened in currency markets sometimes, generally to lower the value of the Yen, although it refrains from doing it often due to political concerns of its main trading partners. The BoJ ultra-loose monetary policy between 2013 and 2024 caused the Yen to depreciate against its main currency peers due to an increasing policy divergence between the Bank of Japan and other main central banks. More recently, the gradually unwinding of this ultra-loose policy has given some support to the Yen.
Over the last decade, the BoJ’s stance of sticking to ultra-loose monetary policy has led to a widening policy divergence with other central banks, particularly with the US Federal Reserve. This supported a widening of the differential between the 10-year US and Japanese bonds, which favored the US Dollar against the Japanese Yen. The BoJ decision in 2024 to gradually abandon the ultra-loose policy, coupled with interest-rate cuts in other major central banks, is narrowing this differential.
The Japanese Yen is often seen as a safe-haven investment. This means that in times of market stress, investors are more likely to put their money in the Japanese currency due to its supposed reliability and stability. Turbulent times are likely to strengthen the Yen’s value against other currencies seen as more risky to invest in.
-
01:30
Stocks. Daily history for Thursday, March 6, 2025
Index Change, points Closed Change, % NIKKEI 225 286.69 37704.93 0.77 Hang Seng 775.5 24369.71 3.29 KOSPI 18.03 2576.16 0.7 ASX 200 -46.4 8094.7 -0.57 DAX 338.45 23419.48 1.47 CAC 40 23.92 8197.67 0.29 Dow Jones -427.51 42579.08 -0.99 S&P 500 -104.11 5738.52 -1.78 NASDAQ Composite -483.47 18069.26 -2.61 -
01:24
Fed's Bostic: Economy in remarkable flux, difficult to know where things will land
Federal Reserve Bank of Atlanta President Raphael Bostic said late Thursday that the US economy is in incredible flux and it’s hard to know where things will land.
Key quotes
The economy is in incredible flux, hard to know where things will land.
If we wait for trends to show up in national economic data before acting, we could be too late.
We are out there watching developments, talking to people on the ground.
We need to be mindful of any changes that impact prices and employment.
Market reaction
At the time of writing, the US Dollar Index (DXY) is trading 0.09% lower on the day to trade at 104.10.
Fed FAQs
Monetary policy in the US is shaped by the Federal Reserve (Fed). The Fed has two mandates: to achieve price stability and foster full employment. Its primary tool to achieve these goals is by adjusting interest rates. When prices are rising too quickly and inflation is above the Fed’s 2% target, it raises interest rates, increasing borrowing costs throughout the economy. This results in a stronger US Dollar (USD) as it makes the US a more attractive place for international investors to park their money. When inflation falls below 2% or the Unemployment Rate is too high, the Fed may lower interest rates to encourage borrowing, which weighs on the Greenback.
The Federal Reserve (Fed) holds eight policy meetings a year, where the Federal Open Market Committee (FOMC) assesses economic conditions and makes monetary policy decisions. The FOMC is attended by twelve Fed officials – the seven members of the Board of Governors, the president of the Federal Reserve Bank of New York, and four of the remaining eleven regional Reserve Bank presidents, who serve one-year terms on a rotating basis.
In extreme situations, the Federal Reserve may resort to a policy named Quantitative Easing (QE). QE is the process by which the Fed substantially increases the flow of credit in a stuck financial system. It is a non-standard policy measure used during crises or when inflation is extremely low. It was the Fed’s weapon of choice during the Great Financial Crisis in 2008. It involves the Fed printing more Dollars and using them to buy high grade bonds from financial institutions. QE usually weakens the US Dollar.
Quantitative tightening (QT) is the reverse process of QE, whereby the Federal Reserve stops buying bonds from financial institutions and does not reinvest the principal from the bonds it holds maturing, to purchase new bonds. It is usually positive for the value of the US Dollar.
-
01:15
Currencies. Daily history for Thursday, March 6, 2025
Pare Closed Change, % AUDUSD 0.6332 0.15 EURJPY 159.598 -0.63 EURUSD 1.07845 -0.04 GBPJPY 190.639 -0.66 GBPUSD 1.2882 -0.08 NZDUSD 0.57347 0.18 USDCAD 1.42974 -0.28 USDCHF 0.88355 -0.66 USDJPY 147.981 -0.57 -
01:07
EUR/USD churns as markets hunker down ahead of Friday NFP print
- EUR/USD overextended its recent bull run, getting rejected from 1.0850.
- ECB rate cut forecasts have plummeted, prompting an FX rebalance.
- US NFP net jobs additions figures loom large on Friday.
EUR/USD tried to stretch for a fourth straight day of gains, but markets are drawing into the middle ahead of Friday’s key US Nonfarm Payrolls (NFP) print. The Euro saw a sharp rejection from the 1.0850 level on Thursday, ending Fiber’s three-day win streak. EUR/USD has had a stellar week, climbing 4.6% bottom-to-top from Monday’s opening bids.
Forex Today: The US Nonfarm Payrolls are coming!
FX markets have sharply rebalanced after rate cut expectations took a tumble this week. According to rate markets, the European Central Bank (ECB) is broadly expected to only cut interest rates one more time in 2025 following Thursday’s 25 bps rate trim. With the Euro facing a much tighter interest rate differential than previously expected, EUR/USD took a hard step higher this week.
Markets remain hungry for more rate cuts to ease financing and borrowing costs, but still-sticky inflation in the EU (and now the US following a recent uptick in key inflation metrics) has hobbled central banks’ ability to enact rate adjustments.
US President Donald Trump shifted his stance on tariffs once again, revealing a temporary suspension on tariffs for all products encompassed by the USMCA agreement, which he personally negotiated in his first term. Even as the Trump administration continues to retract its previous tariff threats, markets are finding it challenging to regain enough risk appetite to trend upward.
On Friday, US Nonfarm Payrolls (NFP) will take on greater importance as investors closely monitor economic indicators. While the US economy remains generally strong, signs of weakness are emerging in the labor market. Additionally, a fresh wave of inflationary pressures, primarily due to concerns over tariffs, dampens growth forecasts.
EUR/USD price forecast
Thursday’s intraday rejection of the 1.0850 level puts the Fiber’s near-term bull run in the ground, at least for now. EUR/USD easily pierced the 200-day Exponential Moving Average (EMA) at 1.0650 this week, pushing the pair back into the bullish side of the key moving average for the first time since November.
Technical oscillators remain pinned in overbought territory, cautioning against further bullish positioning. However, little technical reason to try and catch a rising knife exist on the chart, outside of a potential rejection play off of an old support/resistance level from mid-October of last year.
EUR/USD daily chart
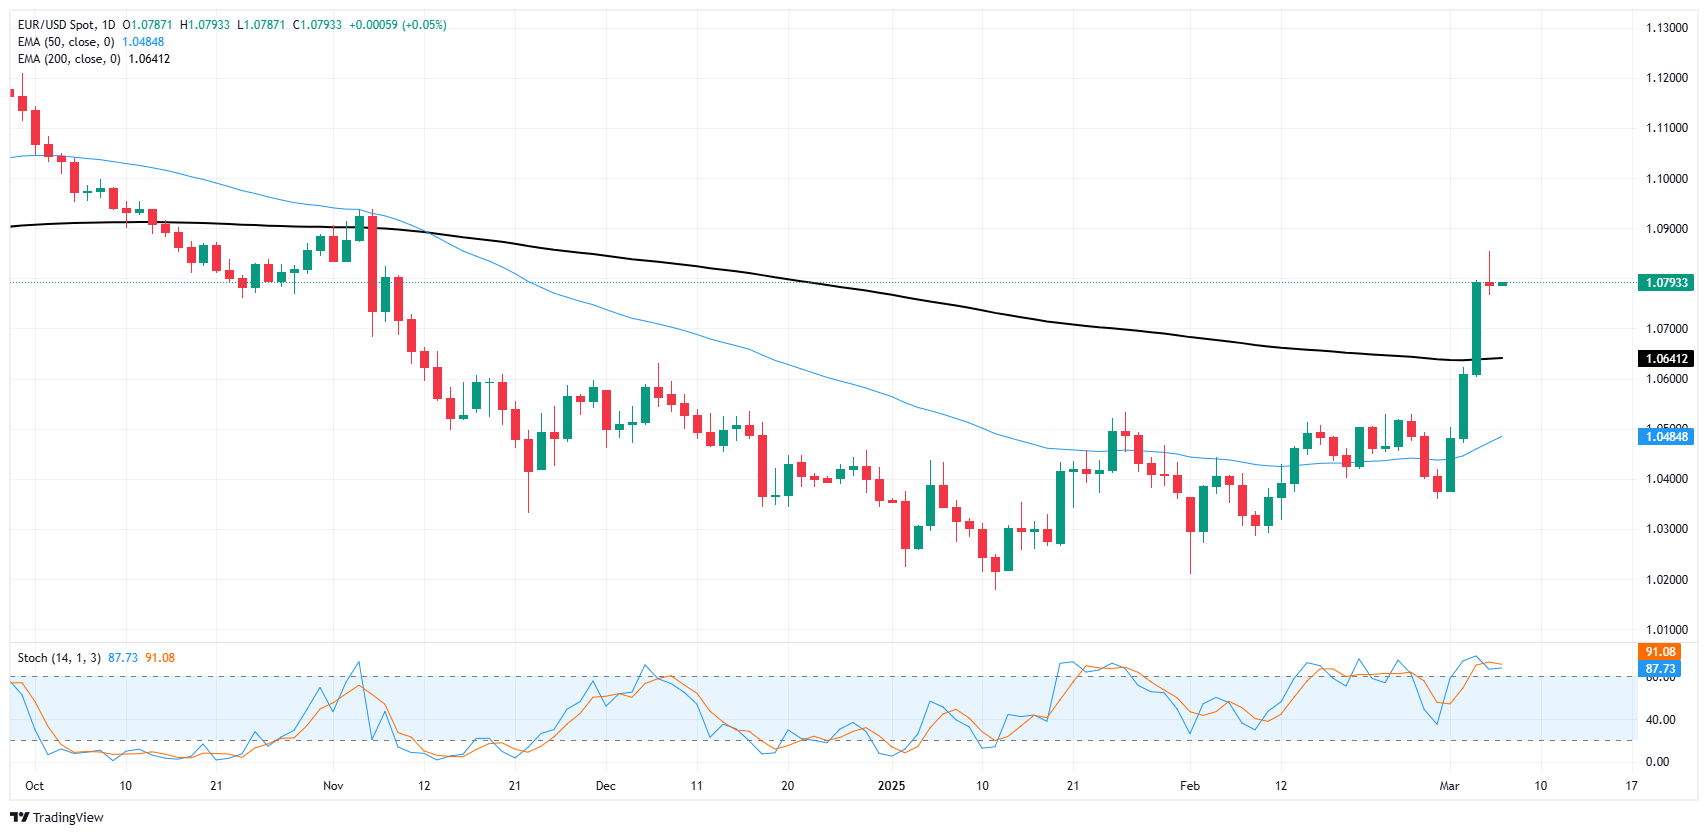
Euro FAQs
The Euro is the currency for the 19 European Union countries that belong to the Eurozone. It is the second most heavily traded currency in the world behind the US Dollar. In 2022, it accounted for 31% of all foreign exchange transactions, with an average daily turnover of over $2.2 trillion a day. EUR/USD is the most heavily traded currency pair in the world, accounting for an estimated 30% off all transactions, followed by EUR/JPY (4%), EUR/GBP (3%) and EUR/AUD (2%).
The European Central Bank (ECB) in Frankfurt, Germany, is the reserve bank for the Eurozone. The ECB sets interest rates and manages monetary policy. The ECB’s primary mandate is to maintain price stability, which means either controlling inflation or stimulating growth. Its primary tool is the raising or lowering of interest rates. Relatively high interest rates – or the expectation of higher rates – will usually benefit the Euro and vice versa. The ECB Governing Council makes monetary policy decisions at meetings held eight times a year. Decisions are made by heads of the Eurozone national banks and six permanent members, including the President of the ECB, Christine Lagarde.
Eurozone inflation data, measured by the Harmonized Index of Consumer Prices (HICP), is an important econometric for the Euro. If inflation rises more than expected, especially if above the ECB’s 2% target, it obliges the ECB to raise interest rates to bring it back under control. Relatively high interest rates compared to its counterparts will usually benefit the Euro, as it makes the region more attractive as a place for global investors to park their money.
Data releases gauge the health of the economy and can impact on the Euro. Indicators such as GDP, Manufacturing and Services PMIs, employment, and consumer sentiment surveys can all influence the direction of the single currency. A strong economy is good for the Euro. Not only does it attract more foreign investment but it may encourage the ECB to put up interest rates, which will directly strengthen the Euro. Otherwise, if economic data is weak, the Euro is likely to fall. Economic data for the four largest economies in the euro area (Germany, France, Italy and Spain) are especially significant, as they account for 75% of the Eurozone’s economy.
Another significant data release for the Euro is the Trade Balance. This indicator measures the difference between what a country earns from its exports and what it spends on imports over a given period. If a country produces highly sought after exports then its currency will gain in value purely from the extra demand created from foreign buyers seeking to purchase these goods. Therefore, a positive net Trade Balance strengthens a currency and vice versa for a negative balance.
-
00:50
Japan JP Foreign Reserves: $1253.3B (February) vs $1240.6B
-
00:50
Japan JP Foreign Reserves fell from previous $1240.6B to $1B in February
-
00:41
Canada will delay its second wave of retaliatory tariffs
Canada's Finance Minister Dominic LeBlanc stated late Thursday that the country will delay its second wave of retaliatory tariffs on $125 billion in US products until April 2. However, there was no sign that Canada will remove the existing $30 billion tariffs, per Reuters.
US President Donald Trump issued an executive order earlier in the day exempting goods from both Canada and Mexico under a North American trade agreement for a month from the 25% tariffs that he slapped earlier this week.
Separately, Canada sets in place plans to toll US trucks heading in to Alaska from British Columbia, indicating that Canadians will not let up until the tariffs are taken off the table.Market reaction
At the time of writing, the USD/CAD pair is trading 0.12% lower on the day to trade at 1.4290.
Canadian Dollar FAQs
The key factors driving the Canadian Dollar (CAD) are the level of interest rates set by the Bank of Canada (BoC), the price of Oil, Canada’s largest export, the health of its economy, inflation and the Trade Balance, which is the difference between the value of Canada’s exports versus its imports. Other factors include market sentiment – whether investors are taking on more risky assets (risk-on) or seeking safe-havens (risk-off) – with risk-on being CAD-positive. As its largest trading partner, the health of the US economy is also a key factor influencing the Canadian Dollar.
The Bank of Canada (BoC) has a significant influence on the Canadian Dollar by setting the level of interest rates that banks can lend to one another. This influences the level of interest rates for everyone. The main goal of the BoC is to maintain inflation at 1-3% by adjusting interest rates up or down. Relatively higher interest rates tend to be positive for the CAD. The Bank of Canada can also use quantitative easing and tightening to influence credit conditions, with the former CAD-negative and the latter CAD-positive.
The price of Oil is a key factor impacting the value of the Canadian Dollar. Petroleum is Canada’s biggest export, so Oil price tends to have an immediate impact on the CAD value. Generally, if Oil price rises CAD also goes up, as aggregate demand for the currency increases. The opposite is the case if the price of Oil falls. Higher Oil prices also tend to result in a greater likelihood of a positive Trade Balance, which is also supportive of the CAD.
While inflation had always traditionally been thought of as a negative factor for a currency since it lowers the value of money, the opposite has actually been the case in modern times with the relaxation of cross-border capital controls. Higher inflation tends to lead central banks to put up interest rates which attracts more capital inflows from global investors seeking a lucrative place to keep their money. This increases demand for the local currency, which in Canada’s case is the Canadian Dollar.
Macroeconomic data releases gauge the health of the economy and can have an impact on the Canadian Dollar. Indicators such as GDP, Manufacturing and Services PMIs, employment, and consumer sentiment surveys can all influence the direction of the CAD. A strong economy is good for the Canadian Dollar. Not only does it attract more foreign investment but it may encourage the Bank of Canada to put up interest rates, leading to a stronger currency. If economic data is weak, however, the CAD is likely to fall.
-
00:19
BoE’s Mann: Interest-rate gradualism ‘no longer valid’
Bank of England Monetary Policy Committee member Catherine Mann said late Thursday that gradual interest-rate moves no longer send clear signals to volatile financial markets and larger shifts are now needed to “cut through” the noise for the good of the economy, per Bloomberg.
Key quotes
Monetary policy must navigate through choppy financial markets, shock-ridden economies, and sticky expectations.
Larger cuts, such as the one I voted for in the latest meeting, cuts through this turbulence, with the objective to more effectively communicate the stance of policy and influence the economy.
Incoming data on wage and price developments and one-year ahead expected trajectories are not yet target-consistent.
I have emphasized the need to hold a restrictive Bank Rate for longer to discipline this upward bias – and I still believe this.
The need to remain restrictive is particularly important.
The founding premise for a gradualist approach to monetary policy is no longer valid.Market reaction
At the time of writing, the GBP/USD is trading 0.07% higher on the day to trade at 1.2887.
BoE FAQs
The Bank of England (BoE) decides monetary policy for the United Kingdom. Its primary goal is to achieve ‘price stability’, or a steady inflation rate of 2%. Its tool for achieving this is via the adjustment of base lending rates. The BoE sets the rate at which it lends to commercial banks and banks lend to each other, determining the level of interest rates in the economy overall. This also impacts the value of the Pound Sterling (GBP).
When inflation is above the Bank of England’s target it responds by raising interest rates, making it more expensive for people and businesses to access credit. This is positive for the Pound Sterling because higher interest rates make the UK a more attractive place for global investors to park their money. When inflation falls below target, it is a sign economic growth is slowing, and the BoE will consider lowering interest rates to cheapen credit in the hope businesses will borrow to invest in growth-generating projects – a negative for the Pound Sterling.
In extreme situations, the Bank of England can enact a policy called Quantitative Easing (QE). QE is the process by which the BoE substantially increases the flow of credit in a stuck financial system. QE is a last resort policy when lowering interest rates will not achieve the necessary result. The process of QE involves the BoE printing money to buy assets – usually government or AAA-rated corporate bonds – from banks and other financial institutions. QE usually results in a weaker Pound Sterling.
Quantitative tightening (QT) is the reverse of QE, enacted when the economy is strengthening and inflation starts rising. Whilst in QE the Bank of England (BoE) purchases government and corporate bonds from financial institutions to encourage them to lend; in QT, the BoE stops buying more bonds, and stops reinvesting the principal maturing on the bonds it already holds. It is usually positive for the Pound Sterling.
-
00:18
GBP/USD snaps winning streak as Cable markets take a breather
- GBP/USD saw little movement compared to recent price action on Thursday.
- Momentum is faltering after a sharp correction in rate cut expectations.
- Investors are hunkering down ahead of key US NFP jobs data figures on Friday.
GBP/USD faltered on Thursday, ending a stellar three-day run that saw the Pound Sterling gain 2.57% bottom-to-top against the Greenback from the start of the week. A sharp readjustment to central bank rate cut expectations means Cable will see a far thinner interest rate differential than previously anticipated, prompting a harsh rebalancing in currency markets.
Forex Today: The US Nonfarm Payrolls are coming!
Rate markets are now pricing in fewer than 50 bps in rate cuts from the Bank of England (BoE) in 2025, a sharp drawdown in rate cut expectations as central banks continue to grapple with sticky inflation. Despite a general weakening in the UK’s domestic economy which would normally prompt a rate response from the BoE, still-high inflation metrics have tied policymakers’ hands.
US President Donald Trump delivered yet another pivot on his tariff plans, announcing a temporary reprieve on tariffs for all products included in the USMCA agreement that he personally negotiated during his first term. Despite the continued walkback from the Trump administration on its own tariff threats, markets were unable to find enough risk appetite to tilt markets back into the high side.
US Nonfarm Payrolls (NFP) will take on renewed significance on Friday as investors begin to watch economic data in earnest. Although the US economy is in an overall healthy place, cracks are beginning to show in the labor market. A Fresh round of inflation pressures, largely attributed to tariff concerns, is also hobbling growth expectations.
GBP/USD price forecast
GBP/USD hit a speed bump at the 1.2900 handle, freezing the near-term bull run in its tracks and squeezing intraday bids into a tight consolidation candlestick. The Cable cleared the 200-day EMA near 1.2685 with ease, but bullish momentum is taking a breather.
Technical oscillators are still pinned in overbought territory, limiting bullish potential. However, an ongoing pattern of higher lows is baked into the chart as price action grinds higher from the technical bottom at 1.2100 in mid-January.
GBP/USD daily chart
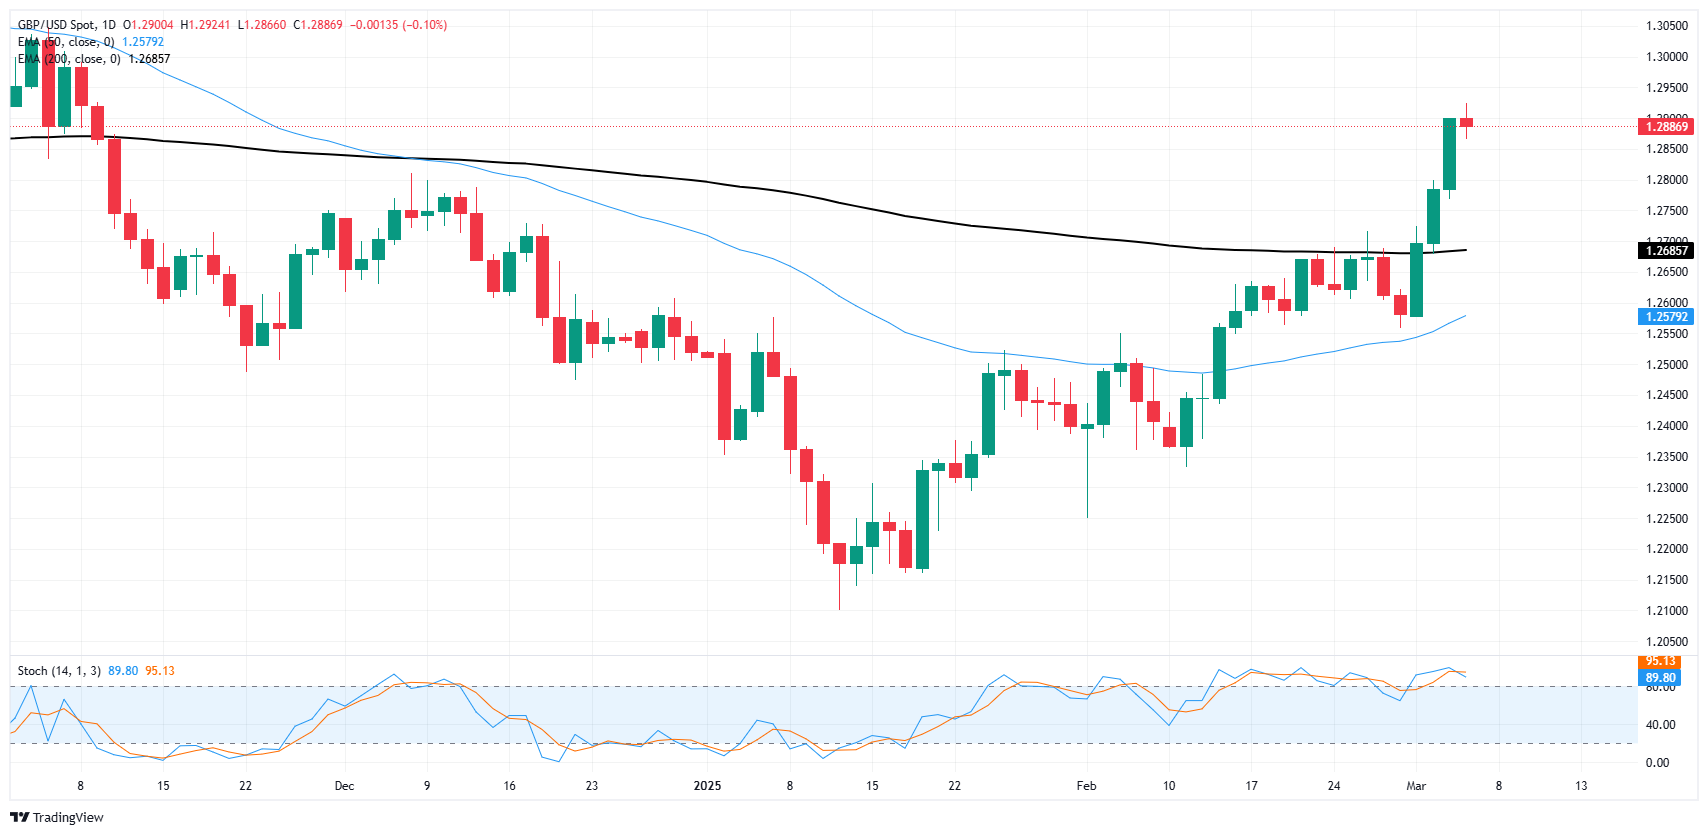
Pound Sterling FAQs
The Pound Sterling (GBP) is the oldest currency in the world (886 AD) and the official currency of the United Kingdom. It is the fourth most traded unit for foreign exchange (FX) in the world, accounting for 12% of all transactions, averaging $630 billion a day, according to 2022 data. Its key trading pairs are GBP/USD, also known as ‘Cable’, which accounts for 11% of FX, GBP/JPY, or the ‘Dragon’ as it is known by traders (3%), and EUR/GBP (2%). The Pound Sterling is issued by the Bank of England (BoE).
The single most important factor influencing the value of the Pound Sterling is monetary policy decided by the Bank of England. The BoE bases its decisions on whether it has achieved its primary goal of “price stability” – a steady inflation rate of around 2%. Its primary tool for achieving this is the adjustment of interest rates. When inflation is too high, the BoE will try to rein it in by raising interest rates, making it more expensive for people and businesses to access credit. This is generally positive for GBP, as higher interest rates make the UK a more attractive place for global investors to park their money. When inflation falls too low it is a sign economic growth is slowing. In this scenario, the BoE will consider lowering interest rates to cheapen credit so businesses will borrow more to invest in growth-generating projects.
Data releases gauge the health of the economy and can impact the value of the Pound Sterling. Indicators such as GDP, Manufacturing and Services PMIs, and employment can all influence the direction of the GBP. A strong economy is good for Sterling. Not only does it attract more foreign investment but it may encourage the BoE to put up interest rates, which will directly strengthen GBP. Otherwise, if economic data is weak, the Pound Sterling is likely to fall.
Another significant data release for the Pound Sterling is the Trade Balance. This indicator measures the difference between what a country earns from its exports and what it spends on imports over a given period. If a country produces highly sought-after exports, its currency will benefit purely from the extra demand created from foreign buyers seeking to purchase these goods. Therefore, a positive net Trade Balance strengthens a currency and vice versa for a negative balance.
-
00:09
Silver Price Forecast: XAG/USD consolidates near $32.50 as doji emerges
- Silver holds near $32.50, with buyers unable to push past key resistance.
- Next upside targets: $33.00, February 20 high of $33.20, and cycle high of $33.39.
- A break below $32.00 could expose $31.50 and the 100-day SMA at $31.21.
Silver price consolidates, snapping three days of gains, trading near the $32.50 area, with buyers failing to prolong their advance to challenge the last cycle high of $33.39. At the time of writing, XAG/USD is virtually unchanged as the Friday’s Asian session begins.
XAG/USD Price Forecast: Technical outlook
Silver (XAG/USD) remains sideways near $32.50 with neither buyers nor the sellers unable to decisively push the grey’s metal quote upwards or downwards. The Relative Strength Index (RSI) shows that momentum remains flat, yet buyers have the upper hand.
That said the XAG/USD first resistance would be $33.00, followed by key levels such as the February 20 high of $33.20 and the February 14 cycle high of $33.39. Conversely, if XAG/USd falls beneath $32.00, the next support would be the $31.50, ahead of the 100-day Simple Moving Average (SMA) at $31.21. Further weakness could expose $31.00, with additional support at the 200-day SMA near $30.48.
XAG/USD Price Chart – Daily
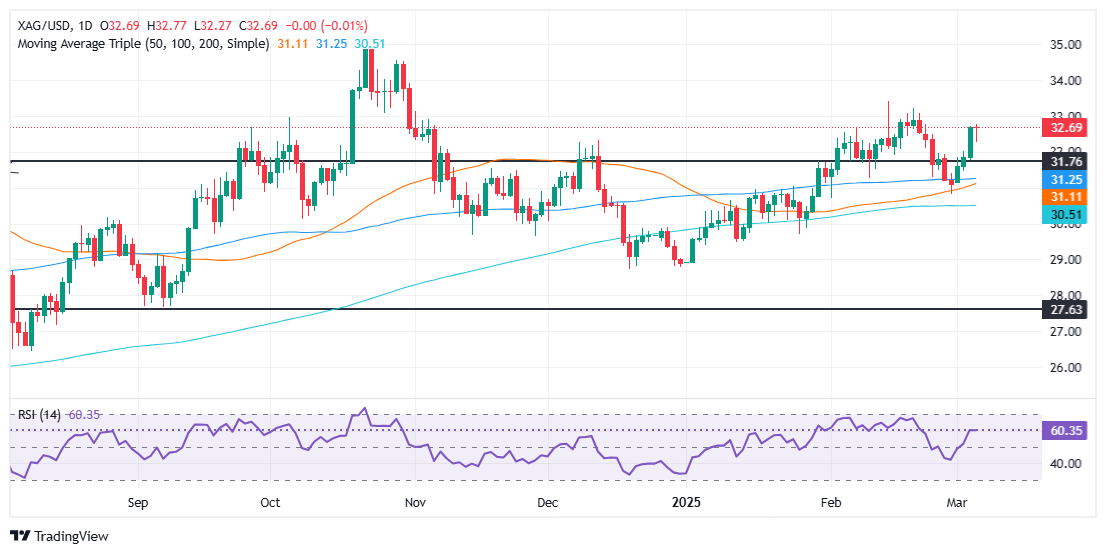
Silver FAQs
Silver is a precious metal highly traded among investors. It has been historically used as a store of value and a medium of exchange. Although less popular than Gold, traders may turn to Silver to diversify their investment portfolio, for its intrinsic value or as a potential hedge during high-inflation periods. Investors can buy physical Silver, in coins or in bars, or trade it through vehicles such as Exchange Traded Funds, which track its price on international markets.
Silver prices can move due to a wide range of factors. Geopolitical instability or fears of a deep recession can make Silver price escalate due to its safe-haven status, although to a lesser extent than Gold's. As a yieldless asset, Silver tends to rise with lower interest rates. Its moves also depend on how the US Dollar (USD) behaves as the asset is priced in dollars (XAG/USD). A strong Dollar tends to keep the price of Silver at bay, whereas a weaker Dollar is likely to propel prices up. Other factors such as investment demand, mining supply – Silver is much more abundant than Gold – and recycling rates can also affect prices.
Silver is widely used in industry, particularly in sectors such as electronics or solar energy, as it has one of the highest electric conductivity of all metals – more than Copper and Gold. A surge in demand can increase prices, while a decline tends to lower them. Dynamics in the US, Chinese and Indian economies can also contribute to price swings: for the US and particularly China, their big industrial sectors use Silver in various processes; in India, consumers’ demand for the precious metal for jewellery also plays a key role in setting prices.
Silver prices tend to follow Gold's moves. When Gold prices rise, Silver typically follows suit, as their status as safe-haven assets is similar. The Gold/Silver ratio, which shows the number of ounces of Silver needed to equal the value of one ounce of Gold, may help to determine the relative valuation between both metals. Some investors may consider a high ratio as an indicator that Silver is undervalued, or Gold is overvalued. On the contrary, a low ratio might suggest that Gold is undervalued relative to Silver.
-
00:00
South Korea Current Account Balance dipped from previous 12.37B to 2.94B in January
-