Noticias del mercado
-
22:47
Australian Dollar plunges to fresh multi-year low after upbeat US NFP data
- AUD tumbles 0.73% to 0.6155 on Friday.
- Hotter-than-expected NFP bolsters USD demand.
- Fed’s hawkish tilt and trade tensions between the US and China weigh on Aussie.
The Australian Dollar remains under intense selling pressure following stronger-than-anticipated US Nonfarm Payrolls (NFP) data, hovering near multi-year lows around 0.6150. The Federal Reserve’s (Fed) hawkish shift keeps US Treasury yields elevated, further supporting the Greenback. On the domestic front, early Reserve Bank of Australia (RBA) rate-cut expectations and simmering US-China trade war fears continue to undermine the Aussie.
Daily digest market movers: Stellar US jobs report boosts USD at Aussie’s expense
- The US Bureau of Labor Statistics reported 256,000 new jobs in December, beating the 160,000 consensus; November’s figure was revised down to 212,000.
- Unemployment Rate dipped to 4.1%, while Average Hourly Earnings eased from 4% to 3.9% YoY, slightly moderating inflation worries.
- Markets now anticipate only one Fed rate cut in 2025, pushing the US Dollar Index (DXY) to a high of 109.96 before a minor pullback.
- China’s economic uncertainty and renewed tariff concerns bolster safe-haven flows into the USD, adding strain to the trade-sensitive Aussie.
- RBA’s dovish outlook and speculation about an imminent rate reduction add another layer of weakness to the Australian Dollar.
AUD/USD technical outlook: Sellers maintain control as RSI signals oversold conditions
The Relative Strength Index (RSI) sits around 28, indicating oversold territory and continuing to trend lower. Meanwhile, the Moving Average Convergence Divergence (MACD) histogram exhibits rising red bars, reflecting intensifying bearish momentum. With the pair firmly below 0.6150, any recovery attempts could struggle unless market sentiment improves or the Fed’s hawkish stance moderates.
The immediate support is at 0.6150, the multi-year trough just reached; a break below exposes 0.6100 and then 0.6060 as next potential floors. On the upside, initial resistance aligns near 0.6200, followed by 0.6260 — the area that needs to be reclaimed for any meaningful recovery attempt.
Australian Dollar FAQs
One of the most significant factors for the Australian Dollar (AUD) is the level of interest rates set by the Reserve Bank of Australia (RBA). Because Australia is a resource-rich country another key driver is the price of its biggest export, Iron Ore. The health of the Chinese economy, its largest trading partner, is a factor, as well as inflation in Australia, its growth rate and Trade Balance. Market sentiment – whether investors are taking on more risky assets (risk-on) or seeking safe-havens (risk-off) – is also a factor, with risk-on positive for AUD.
The Reserve Bank of Australia (RBA) influences the Australian Dollar (AUD) by setting the level of interest rates that Australian banks can lend to each other. This influences the level of interest rates in the economy as a whole. The main goal of the RBA is to maintain a stable inflation rate of 2-3% by adjusting interest rates up or down. Relatively high interest rates compared to other major central banks support the AUD, and the opposite for relatively low. The RBA can also use quantitative easing and tightening to influence credit conditions, with the former AUD-negative and the latter AUD-positive.
China is Australia’s largest trading partner so the health of the Chinese economy is a major influence on the value of the Australian Dollar (AUD). When the Chinese economy is doing well it purchases more raw materials, goods and services from Australia, lifting demand for the AUD, and pushing up its value. The opposite is the case when the Chinese economy is not growing as fast as expected. Positive or negative surprises in Chinese growth data, therefore, often have a direct impact on the Australian Dollar and its pairs.
Iron Ore is Australia’s largest export, accounting for $118 billion a year according to data from 2021, with China as its primary destination. The price of Iron Ore, therefore, can be a driver of the Australian Dollar. Generally, if the price of Iron Ore rises, AUD also goes up, as aggregate demand for the currency increases. The opposite is the case if the price of Iron Ore falls. Higher Iron Ore prices also tend to result in a greater likelihood of a positive Trade Balance for Australia, which is also positive of the AUD.
The Trade Balance, which is the difference between what a country earns from its exports versus what it pays for its imports, is another factor that can influence the value of the Australian Dollar. If Australia produces highly sought after exports, then its currency will gain in value purely from the surplus demand created from foreign buyers seeking to purchase its exports versus what it spends to purchase imports. Therefore, a positive net Trade Balance strengthens the AUD, with the opposite effect if the Trade Balance is negative.
-
21:43
Silver Price Forecast: XAG/USD surges above $30.00 amid high US yields, strong USD
- Silver climbs 0.80% to $30.35, outstripping concerns over U.S. inflation, Fed scrutiny.
- Technical hurdle at 50-day SMA of $30.42; breach could push silver to $30.80.
- Downside risks if silver drops below $30.00, key support at 200-day SMA, lows near $28.78.
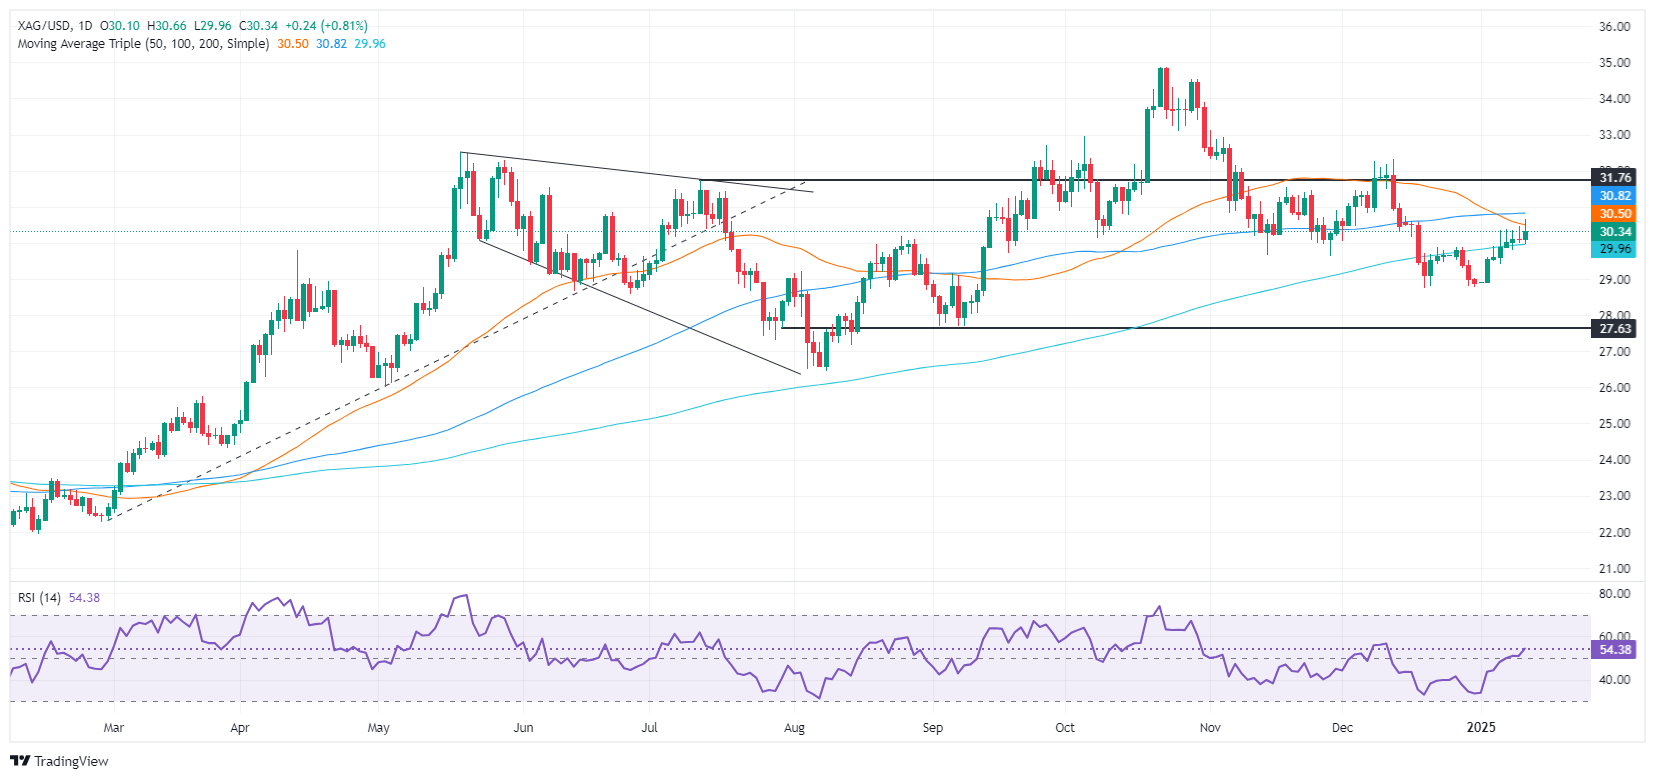
Silver Price rises for the seven straight day putting aside the jump in US Treasury bond yields and the US Dollar, after a strong US jobs report calmed Federal Reserve officials about the employment situation in the US. Nevertheless, the evolution on inflation seems to be stalled, gathering some attention of Fed oficials. The XAG/USD trades at $30.35 up over 0.80%.
XAG/USD Price Forecast: Technical outlook
Silver continues to trend higher, advancing steadily above the $30.00 figure for the latest fhree trading days, boosted by buyers emerging at crucial support found at the 200-day Simple Moving Average (SMA) at $29.93. However, they are struggling with stir resistance at the 50-day SMA at $30.42, which has kept prices from reaching the 100-day SMA at $30.80.
If bulls clear those levels, that will clear the path to challenge $31.00 and expose the next cycle high seen at $32.32, December’s 12 peak.
Conversely, if XAG/USD slides beneath $30.00, the 200-day SMA emerges as bulls’ first line of defense. A breach of that level, could drive Silver’s price towards the January 6 low of $29.41, ahead of the December 31 low of $28.78.
XAG/USD Price Chart – Daily
Silver FAQs
Silver is a precious metal highly traded among investors. It has been historically used as a store of value and a medium of exchange. Although less popular than Gold, traders may turn to Silver to diversify their investment portfolio, for its intrinsic value or as a potential hedge during high-inflation periods. Investors can buy physical Silver, in coins or in bars, or trade it through vehicles such as Exchange Traded Funds, which track its price on international markets.
Silver prices can move due to a wide range of factors. Geopolitical instability or fears of a deep recession can make Silver price escalate due to its safe-haven status, although to a lesser extent than Gold's. As a yieldless asset, Silver tends to rise with lower interest rates. Its moves also depend on how the US Dollar (USD) behaves as the asset is priced in dollars (XAG/USD). A strong Dollar tends to keep the price of Silver at bay, whereas a weaker Dollar is likely to propel prices up. Other factors such as investment demand, mining supply – Silver is much more abundant than Gold – and recycling rates can also affect prices.
Silver is widely used in industry, particularly in sectors such as electronics or solar energy, as it has one of the highest electric conductivity of all metals – more than Copper and Gold. A surge in demand can increase prices, while a decline tends to lower them. Dynamics in the US, Chinese and Indian economies can also contribute to price swings: for the US and particularly China, their big industrial sectors use Silver in various processes; in India, consumers’ demand for the precious metal for jewellery also plays a key role in setting prices.
Silver prices tend to follow Gold's moves. When Gold prices rise, Silver typically follows suit, as their status as safe-haven assets is similar. The Gold/Silver ratio, which shows the number of ounces of Silver needed to equal the value of one ounce of Gold, may help to determine the relative valuation between both metals. Some investors may consider a high ratio as an indicator that Silver is undervalued, or Gold is overvalued. On the contrary, a low ratio might suggest that Gold is undervalued relative to Silver.
-
20:44
Gold price rallies despite strong US NFP report
- Gold rebounds 0.69% despite significant US job additions, challenging Fed's rate cut path.
- Gold recovers from post-labor report drop as investors weigh Fed's cautious disinflation stance.
- Upcoming US inflation and retail sales data set to influence gold's trajectory, Fed policy.
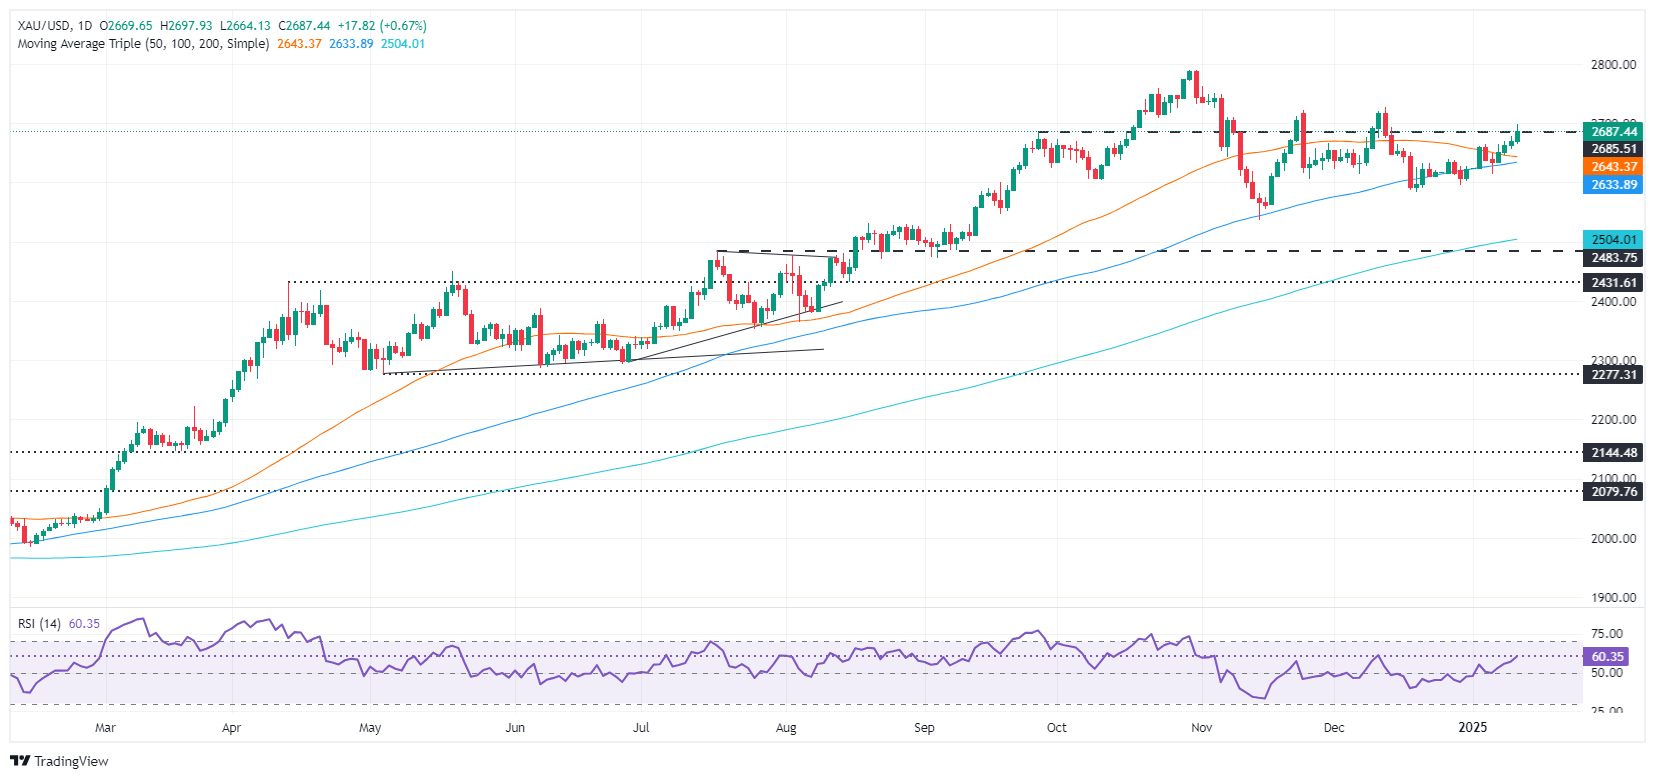
Gold price rebounded off daily lows on Friday, extending its rally for the fourth consecutive day as traders shrugged off a strong United States (US) Nonfarm Payrolls report. This tempered the Federal Reserve’s (Fed) concerns about the labor market, but not so much inflation as some officials acknowledged. The XAU/USD trades at $2,687, up 0.69%.
Bullion fell sharply after the US Bureau of Labor Statistics (BLS) revealed that the economy added an outstanding number of people to the workforce, topping 200K. As a consequence, the Unemployment Rate dipped, while investors priced in fewer interest rate cuts based on the fact that the economy continues to create enough jobs, while the disinflation process “halted,” according to the Fed’s latest minutes.
Nevertheless, XAU/USD recovered once market participants digested the data. The data reassured Fed officials that the labor market remains healthy while they tackle inflation, which recently edged higher after the US central bank lowered rates by 100 basis points in 2024.
The US Dollar rose sharply to multi-month highs according to the US Dollar Index (DXY). The DXY hit 109.96 before trimming gains and is at 109.68, up 0.49%. US Treasury bond yields soared, yet had stabilized, particularly the belly of the curve.
Chicago Fed President Austan Goolsbee said they don’t complain because the economy has created over 250K jobs. He added that the jobs market seems stable “at full employment,” adding that if conditions are stable and there’s no rise in inflation, “rates should go down.”
Given the backdrop, investor focus will shift to next week’s data. The US schedule will feature inflation figures on the producer and consumer side, alongside Retail Sales and jobless claims for the week ending January 11.
Daily digest market movers: Gold price surges accompanied by the US Dollar
- Gold price shrugs off higher US real yields, which rose by two bps to 2.30%. At the same time, the US 10-year T-note yield soared seven and a half bps to 4.767%.
- The US Bureau of Labor Statistics (BLS) revealed that the economy created 256K jobs last month, although November was revised downward from 227K to 212K. The consensus projected 160K people to be added to the workforce, with private hiring totaling 223K.
- The Unemployment Rate fell to 4.1%, while Average Hourly Earnings (AHE) dipped from 4% to 3.9%. Following the data release, traders expect the Federal Reserve to cut rates just once in 2025.
- Easing expectations of the Federal Reserve continued to edge lower. The December Fed funds futures contract is pricing in 30 basis points of easing.
- US Consumer Sentiment in January announced by the University of Michigan (UoM) missed estimates of 73.8 and was down to 73.2. Inflation expectations for one year rose by 3.3% up from 2.8% and for a five-year period increased from 3% to 3.3%.
- On Thursday, Fed Governor Michelle Bowman maintained a hawkish stance, saying the central bank should be cautious in adjusting interest rates, while Kansas City Fed Jeffrey Schmid added that rates are “near” neutral.
- Earlier, Philadelphia Fed Patrick Harker revealed that the US central bank could pause amid uncertainty, while Boston Fed Susan Collins said the current outlook suggests a gradual approach to rate cuts.
XAU/USD technical outlook: Gold price soars above $2,650 as bulls stepped in
Gold’s uptrend remains in place as the yellow metal has carved successive series of higher highs and higher lows, with traders eyeing the $2,700 mark. Momentum is strongly tilted to the upside as seen on the Relative Strength Index (RSI) indicator, which shows bulls are in charge.
If XAU/USD clears $2,700, the next resistance would be the December 12 high of $2,726 and the all-time high (ATH) at $2,790.
Conversely, a drop below $2,650 will put into play a challenge of the 50 and 100-day Simple Moving Averages (SMAs) at $2,645 and $2,632 respectively. On further weakness, $2,600 is up next, ahead of the 200-day SMA at $2,503.
Gold FAQs
Gold has played a key role in human’s history as it has been widely used as a store of value and medium of exchange. Currently, apart from its shine and usage for jewelry, the precious metal is widely seen as a safe-haven asset, meaning that it is considered a good investment during turbulent times. Gold is also widely seen as a hedge against inflation and against depreciating currencies as it doesn’t rely on any specific issuer or government.
Central banks are the biggest Gold holders. In their aim to support their currencies in turbulent times, central banks tend to diversify their reserves and buy Gold to improve the perceived strength of the economy and the currency. High Gold reserves can be a source of trust for a country’s solvency. Central banks added 1,136 tonnes of Gold worth around $70 billion to their reserves in 2022, according to data from the World Gold Council. This is the highest yearly purchase since records began. Central banks from emerging economies such as China, India and Turkey are quickly increasing their Gold reserves.
Gold has an inverse correlation with the US Dollar and US Treasuries, which are both major reserve and safe-haven assets. When the Dollar depreciates, Gold tends to rise, enabling investors and central banks to diversify their assets in turbulent times. Gold is also inversely correlated with risk assets. A rally in the stock market tends to weaken Gold price, while sell-offs in riskier markets tend to favor the precious metal.
The price can move due to a wide range of factors. Geopolitical instability or fears of a deep recession can quickly make Gold price escalate due to its safe-haven status. As a yield-less asset, Gold tends to rise with lower interest rates, while higher cost of money usually weighs down on the yellow metal. Still, most moves depend on how the US Dollar (USD) behaves as the asset is priced in dollars (XAU/USD). A strong Dollar tends to keep the price of Gold controlled, whereas a weaker Dollar is likely to push Gold prices up.
-
19:04
United States Baker Hughes US Oil Rig Count: 480 vs previous 482
-
19:00
US Dollar climbs on robust NFP results, rises to multi-year highs
- December’s NFP report showed better results than expected.
- The Federal Reserve’s easing timeline faces fresh scrutiny after Unemployment Rate falls.
- Higher Treasury yields and lingering inflationary pressures reinforce the Greenback’s appeal across most major currency pairs.
The Dollar Index (DXY), which measures the value of the USD against a basket of currencies, rallies on renewed inflation concerns as the stronger than expected Nonfarm Payrolls (NFP) report pushes out the Federal Reserve’s (Fed) rate cut timeline, fueling US Dollar demand and driving the DXY closer to 110.00.
Daily digest market movers: US Dollar sees gains on a solid NFP report
- December Nonfarm Payrolls soared by 256,000, far exceeding the 160,000 forecast and reinforcing labor market resilience.
- Unemployment Rate dips to 4.1% from 4.2%, while wage inflation eased to 3.9% YoY, moderating Fed cut bets slightly.
- Bloomberg consensus initially stood at 165K for December’s job gains, though many analysts had warned of upside risks.
- Fed officials highlight diminished urgency for additional rate cuts, with concerns over major labor market slack now fading.
- Strong labor data helps the US Dollar retain its gains with the Fed likely to continue gradual cuts later in 2025 if inflation cools.
- Fed officials have shifted toward a more careful approach after December’s pivot.
- The strong employment metrics reduce the need for imminent easing, while fresh developments in growth, inflation and fiscal policy remain key variables. Markets increasingly price in no additional cuts in the near term, reinforcing US Dollar strength.
DXY technical outlook: Index hits November 2022 highs near 110.00
The US Dollar Index soared to fresh peaks not seen since November 2022 and is now approaching the 110.00 mark. Technical indicators are verging on overbought territory, suggesting a potential short-term pullback.
Nevertheless, the DXY’s solid break above prior resistance signals ongoing bullish momentum, supported by firm economic data and tempered Fed rate cut expectations. Any dip may find support near the 108.50–109.00 range.
US Dollar FAQs
The US Dollar (USD) is the official currency of the United States of America, and the ‘de facto’ currency of a significant number of other countries where it is found in circulation alongside local notes. It is the most heavily traded currency in the world, accounting for over 88% of all global foreign exchange turnover, or an average of $6.6 trillion in transactions per day, according to data from 2022. Following the second world war, the USD took over from the British Pound as the world’s reserve currency. For most of its history, the US Dollar was backed by Gold, until the Bretton Woods Agreement in 1971 when the Gold Standard went away.
The most important single factor impacting on the value of the US Dollar is monetary policy, which is shaped by the Federal Reserve (Fed). The Fed has two mandates: to achieve price stability (control inflation) and foster full employment. Its primary tool to achieve these two goals is by adjusting interest rates. When prices are rising too quickly and inflation is above the Fed’s 2% target, the Fed will raise rates, which helps the USD value. When inflation falls below 2% or the Unemployment Rate is too high, the Fed may lower interest rates, which weighs on the Greenback.
In extreme situations, the Federal Reserve can also print more Dollars and enact quantitative easing (QE). QE is the process by which the Fed substantially increases the flow of credit in a stuck financial system. It is a non-standard policy measure used when credit has dried up because banks will not lend to each other (out of the fear of counterparty default). It is a last resort when simply lowering interest rates is unlikely to achieve the necessary result. It was the Fed’s weapon of choice to combat the credit crunch that occurred during the Great Financial Crisis in 2008. It involves the Fed printing more Dollars and using them to buy US government bonds predominantly from financial institutions. QE usually leads to a weaker US Dollar.
Quantitative tightening (QT) is the reverse process whereby the Federal Reserve stops buying bonds from financial institutions and does not reinvest the principal from the bonds it holds maturing in new purchases. It is usually positive for the US Dollar.
-
18:53
Mexican Peso plunges after US NFP data, Banxico dovish tilt
- Mexican Peso is under pressure, falling over 1% as USD/MXN hits a six-day high at 20.74.
- Strong December US Nonfarm Payrolls boost dollar; Fed may hold rates longer.
- Banxico minutes hint at larger rate cuts, adding pressure on the Peso.
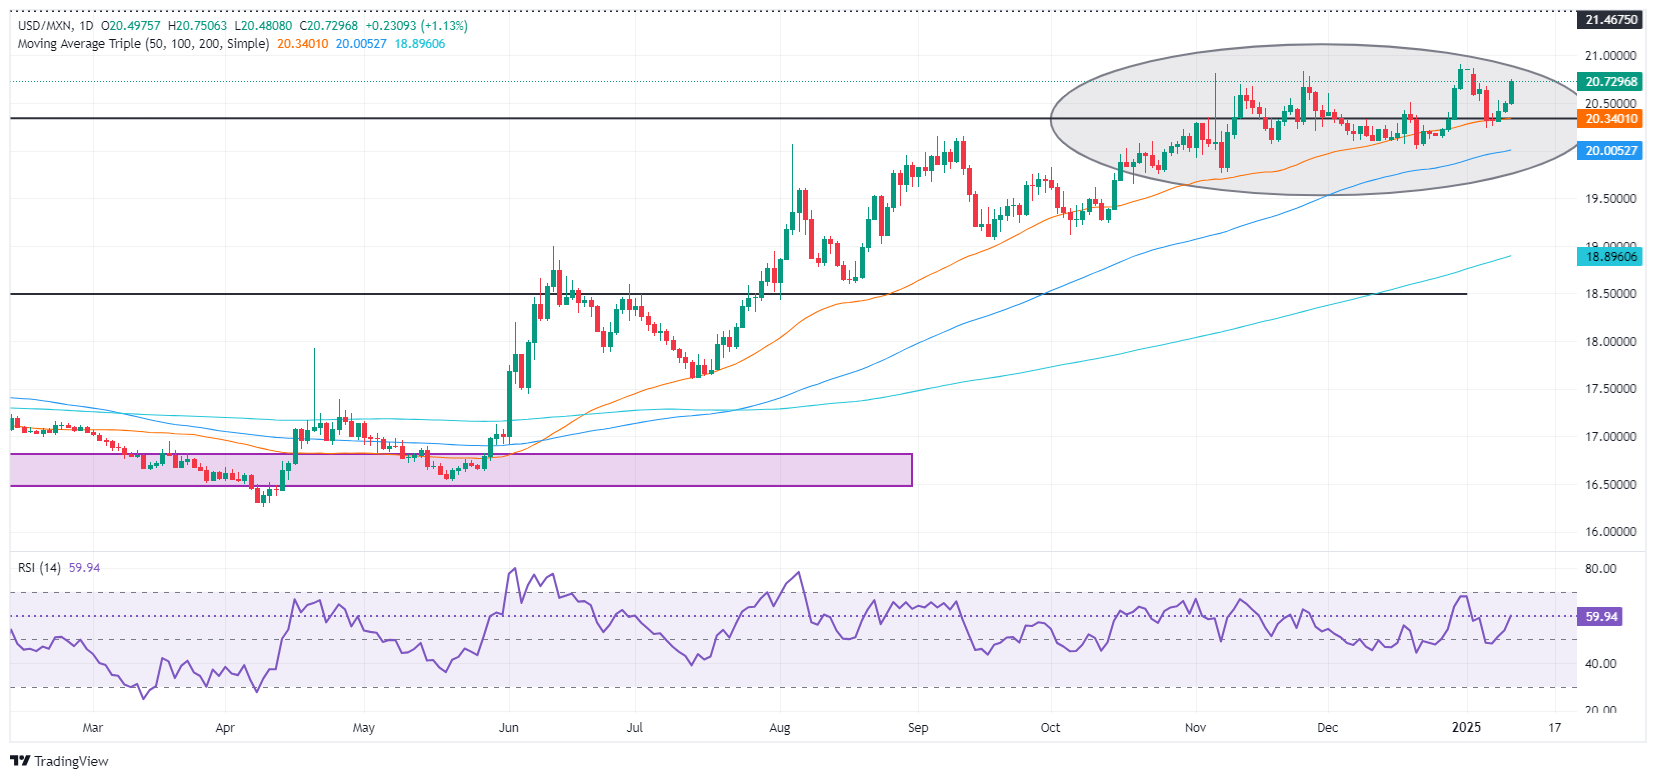
The Mexican Peso (MXN) is under pressure against the Greenback, hitting a six-day low following the release of a stellar United States (US) employment report and after the Bank of Mexico (Banxico) revealed that larger interest rate cuts could be discussed in the coming meetings. The USD/MXN trades at 20.70, up more than 1%.
The US Bureau of Labor Statistics (BLS) revealed that the economy added more jobs than expected, causing a slight dip in the Unemployment Rate. This adds pressure on the Federal Reserve (Fed), which has become more worried about its mandate of maximum employment in the second half of 2024.
Recent job reports hinted that the labor market is strong, but not so inflation. According to the ISM Services PMI report, the prices paid sub-component rose sharply to 64.4, its highest level since early 2023. Following the data release, market participants anticipated one interest rate cut by the Fed in 2025.
Mexico’s economic docket revealed that Industrial Production in November improved slightly, yet data was overshadowed by US data. On Thursday, Banxico released its latest meeting minutes, which despite acknowledging that inflation risks are tilted to the upside, indicated that monetary policy needs to be less restrictive, according to the Governing board.
Next week, Mexico’s docket will feature Gross Fixed Investment and Retail Sales. In the US, key data releases include inflation figures on the producer and the consumer side, alongside Retail Sales and jobless claims for the week ending January 11.
Therefore, the Peso would be at risk of further depreciation due to the reduction of the interest rate differential between Mexico and the US. Although Fed officials stated they are in an easing cycle, market players are eyeing just 39 basis points (bps) of easing in the US this year against 150 bps by Banxico.
Daily digest market movers: Mexican Peso plunges amid strong US Dollar
- The BLS reported that the economy added 256K people to the workforce, according to the December Nonfarm Payrolls report, surpassing expectations of 160K. This is despite the downward revision to November's figures, which were 212K instead of 227K.
- The Unemployment Rate declined to 4.1%, while Average Hourly Earnings (AHE) slipped from 4% to 3.9%. Following the report, traders now anticipate that the Federal Reserve will implement only one rate cut in 2025.
- Banxico’s meeting minutes revealed the evolution of disinflation, suggesting that the easing cycle might continue to reduce the restiveness of monetary policy. To achieve that, the Governing board stated that “larger downward adjustments could be considered in some meetings.”
- Mexico’s central bank improved the inflation outlook due to the progress in headline and core inflation. Officials acknowledged that services inflation decreased and they expect CPI to converge to its 3% goal in Q3 2026.
- The US 10-year Treasury note skyrocketed to 4.788% before retreating five basis points (bps) to 4.739%. This consequently weighed on the Greenback, as the USD/JPY turned negative, yet close to remaining almost unchanged.
- The US Dollar Index (DXY) rose to 109.96, its highest level since November 2022. Recently, DXY pared some of its gains and is at 109.55, up 0.36%.
- The Fed revealed its December Meeting Minutes on Wednesday. Although policymakers reduced interest rates, some participants favored keeping rates unchanged, as they noted that the evolution of the inflation downward trajectory stalled.
- Consequently, they adopted a more gradual approach as Minutes underscored that Fed officials opened the door to slowing the pace of interest rate cuts.
USD/MXN technical outlook: Mexican Peso remains heavy as USD/MXN climbs above 20.35
Having surpassed the 20.50 figure, the USD/MXN is on course to test the current year-to-date (YTD) peak of 20.90 is on the cards. The Relative Strength Index (RSI) slope cleared its latest peak, signaling bulls are gathering steam. Therefore, further upside is seen to the detriment of the bettered Peso.
The first resistance would be 20.90, followed by the 21.00 mark. On further strength, the next resistance would be the March 8, 2022 high of 21.46, ahead of 21.50 and the 22.00 psychological level.
On the flip side and the path of more resistance, if USDMXN drops below 20.50 this will expose the 50-day Simple Moving Average (SMA) at 20.30. Once surpassed the next stop is the psychological 20.00 level, followed by the 100-day SMA at 19.96.
Mexican Peso FAQs
The Mexican Peso (MXN) is the most traded currency among its Latin American peers. Its value is broadly determined by the performance of the Mexican economy, the country’s central bank’s policy, the amount of foreign investment in the country and even the levels of remittances sent by Mexicans who live abroad, particularly in the United States. Geopolitical trends can also move MXN: for example, the process of nearshoring – or the decision by some firms to relocate manufacturing capacity and supply chains closer to their home countries – is also seen as a catalyst for the Mexican currency as the country is considered a key manufacturing hub in the American continent. Another catalyst for MXN is Oil prices as Mexico is a key exporter of the commodity.
The main objective of Mexico’s central bank, also known as Banxico, is to maintain inflation at low and stable levels (at or close to its target of 3%, the midpoint in a tolerance band of between 2% and 4%). To this end, the bank sets an appropriate level of interest rates. When inflation is too high, Banxico will attempt to tame it by raising interest rates, making it more expensive for households and businesses to borrow money, thus cooling demand and the overall economy. Higher interest rates are generally positive for the Mexican Peso (MXN) as they lead to higher yields, making the country a more attractive place for investors. On the contrary, lower interest rates tend to weaken MXN.
Macroeconomic data releases are key to assess the state of the economy and can have an impact on the Mexican Peso (MXN) valuation. A strong Mexican economy, based on high economic growth, low unemployment and high confidence is good for MXN. Not only does it attract more foreign investment but it may encourage the Bank of Mexico (Banxico) to increase interest rates, particularly if this strength comes together with elevated inflation. However, if economic data is weak, MXN is likely to depreciate.
As an emerging-market currency, the Mexican Peso (MXN) tends to strive during risk-on periods, or when investors perceive that broader market risks are low and thus are eager to engage with investments that carry a higher risk. Conversely, MXN tends to weaken at times of market turbulence or economic uncertainty as investors tend to sell higher-risk assets and flee to the more-stable safe havens.
-
18:23
Canadian Dollar twists after better-than-expected December jobs figures
- The Canadian Dollar rose on Friday, but still lost ground to the Greenback.
- Canada and the US both added more jobs than expected in December.
- The Canadian Unemployment Rate and wage growth also eased.
The Canadian Dollar (CAD) caught a bid on Friday, getting bolstered across the broader FX market after Canadian jobs figures in December surged well above forecasts. However, a wide surge of risk aversion after US Nonfarm Payrolls (NFP) figures also outperformed forecasts kicked the legs out from under investor rate cut expectations in 2025, sending the safe haven US Dollar broadly higher.
Canadian Net Change in Employment came in at 90.9K, a two-year high for monthly job gains, while US NFP net job additions surged to 256K, also beating the street. Firm job growth in the US will make it difficult for the Fed to deliver more rate cuts, and market bets on Fed rate cuts in 2025 are tumbling.
Daily digest market movers: CAD rises on jobs gains, but Greenback rises faster
- Canada added almost a hundred thousand jobs in December, surging to a two-year single-month hiring splurge. Median market forecasts expected a sharp drop to 25K for the month, below November’s print of 50.5K.
- On the US side, NFP net job gains rose to 256K, well above the forecast 160K, 212K previous.
- Overall, retroactive revisions to datasets remain a key issue: employment survey participation remains low overall, with a respondent rate typically around 50%, leaving lots of room for holes in the reported figures.
- Canadian Average Hourly Wages grew at an annualized rate of 3.7% in December, down slightly from the previous period’s 3.9%.
- The Canadian Unemployment Rate also ticked down to 6.7% from 6.8%; the street expected a move higher to 6.9%.
Canadian Dollar price forecast
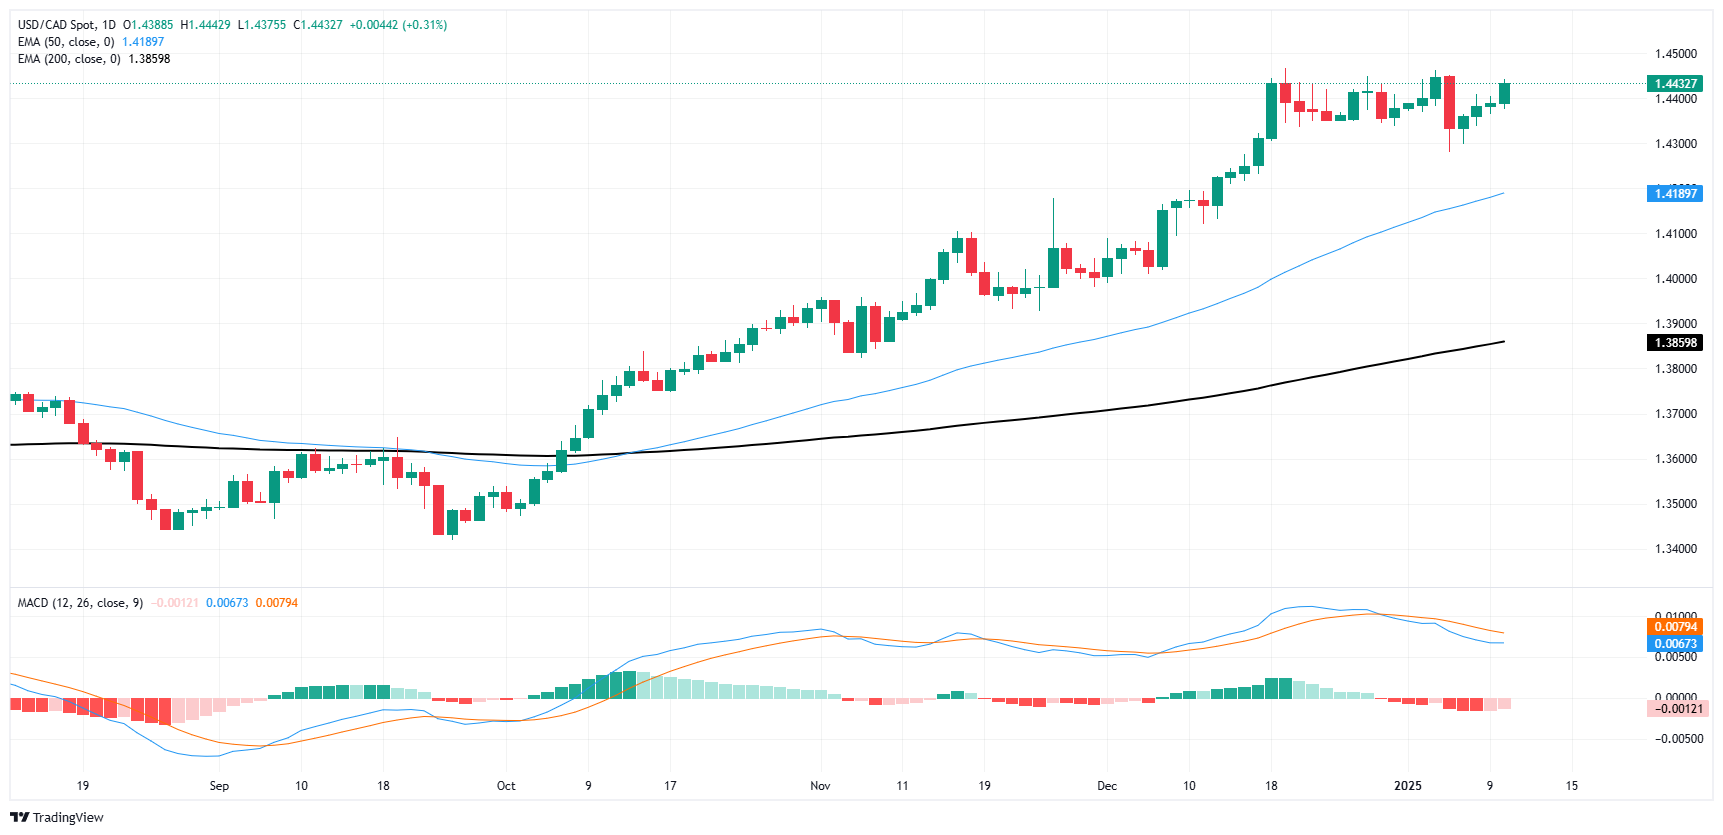
Despite a firm print in Canadian job figures, markets are still pivoting into the safety of the Greenback, pushing the Loonie back down. The USD/CAD chart is once again bumping against the ceiling as the US Dollar rises to test multi-year highs against the Canadian Dollar.
USD/CAD is back over the 1.4400 handle, a key barrier for Loonie bulls. It’s a short trip to new multi-year highs near the 1.4500 level, a price the pair hasn’t seen since the pandemic era. Despite a plunge early this week, USD/CAD has pared away nearly all of its losses and is testing back into Monday’s opening bids, leaving room for the CAD to fall further and push the pair into fresh highs.
USD/CAD daily chart
Canadian Dollar FAQs
The key factors driving the Canadian Dollar (CAD) are the level of interest rates set by the Bank of Canada (BoC), the price of Oil, Canada’s largest export, the health of its economy, inflation and the Trade Balance, which is the difference between the value of Canada’s exports versus its imports. Other factors include market sentiment – whether investors are taking on more risky assets (risk-on) or seeking safe-havens (risk-off) – with risk-on being CAD-positive. As its largest trading partner, the health of the US economy is also a key factor influencing the Canadian Dollar.
The Bank of Canada (BoC) has a significant influence on the Canadian Dollar by setting the level of interest rates that banks can lend to one another. This influences the level of interest rates for everyone. The main goal of the BoC is to maintain inflation at 1-3% by adjusting interest rates up or down. Relatively higher interest rates tend to be positive for the CAD. The Bank of Canada can also use quantitative easing and tightening to influence credit conditions, with the former CAD-negative and the latter CAD-positive.
The price of Oil is a key factor impacting the value of the Canadian Dollar. Petroleum is Canada’s biggest export, so Oil price tends to have an immediate impact on the CAD value. Generally, if Oil price rises CAD also goes up, as aggregate demand for the currency increases. The opposite is the case if the price of Oil falls. Higher Oil prices also tend to result in a greater likelihood of a positive Trade Balance, which is also supportive of the CAD.
While inflation had always traditionally been thought of as a negative factor for a currency since it lowers the value of money, the opposite has actually been the case in modern times with the relaxation of cross-border capital controls. Higher inflation tends to lead central banks to put up interest rates which attracts more capital inflows from global investors seeking a lucrative place to keep their money. This increases demand for the local currency, which in Canada’s case is the Canadian Dollar.
Macroeconomic data releases gauge the health of the economy and can have an impact on the Canadian Dollar. Indicators such as GDP, Manufacturing and Services PMIs, employment, and consumer sentiment surveys can all influence the direction of the CAD. A strong economy is good for the Canadian Dollar. Not only does it attract more foreign investment but it may encourage the Bank of Canada to put up interest rates, leading to a stronger currency. If economic data is weak, however, the CAD is likely to fall.
-
18:05
Dow Jones Industrial Average slumps after sturdy NFP print
- The Dow Jones tumbled 700 points on Friday after NFP figures surged in December.
- Market bets for Fed rate cuts sank, rate traders now expect a single rate cut this year.
- Consumer sentiment and inflation expectations also rose, further hitting risk appetite.
The Dow Jones Industrial Average (DJIA) took a hard hit on Friday after investor sentiment soured on the back of a lofty Nonfarm Payrolls (NFP) jobs data report which showed a far higher rate of hirings than most investors anticipated. University of Michigan (UoM) consumer survey results also showed the average US spender expects more inflation rather than less over the next five years, further dampening risk appetite in equities as both strong jobs growth and high consumer inflation expectations bode poorly for more Federal Reserve (Fed) rate cuts.
US NFP net job additions in December rose to 256K, well above the expected 160K, while November’s print saw a slight downside revision to 212K. The UoM Consumer Sentiment Index fell to 73.2 in January, down from the previous month’s 74.0 and a steeper downturn than the expected 73.8. UoM 5-Year Consumer Inflation Expectations also rose to 3.3%, a notable step up from the previous print of 3.0%.
Markets are broadly pivoting out of Fed rate cut expectations in 2025 and dumping equities as traders pile into the safe haven Greenback. Major institutions like Bank of America and Goldman Sachs are pushing out post-NFP research notes that broadly admit everybody now expects even fewer rate cuts from the Fed in 2025 than before. According to the CME’s FedWatch Tool, this sentiment is being picked up by interest rate traders as well: rate markets are pricing in only a single 25 bps rate cut this year, and not until June at the earliest.
Dow Jones news
The Dow Jones is broadly lower on Friday, with less than ten stocks able to find room in the green to wrap up the trading week. Losses were led by Travelers Companies (TRV), which tumbled 4.3% on the day, falling into $232 per share. On its heels was Goldman Sachs (GS), which fell 3.5% and slipped below $560 per share for the first time in almost a month.
Dow Jones price forecast
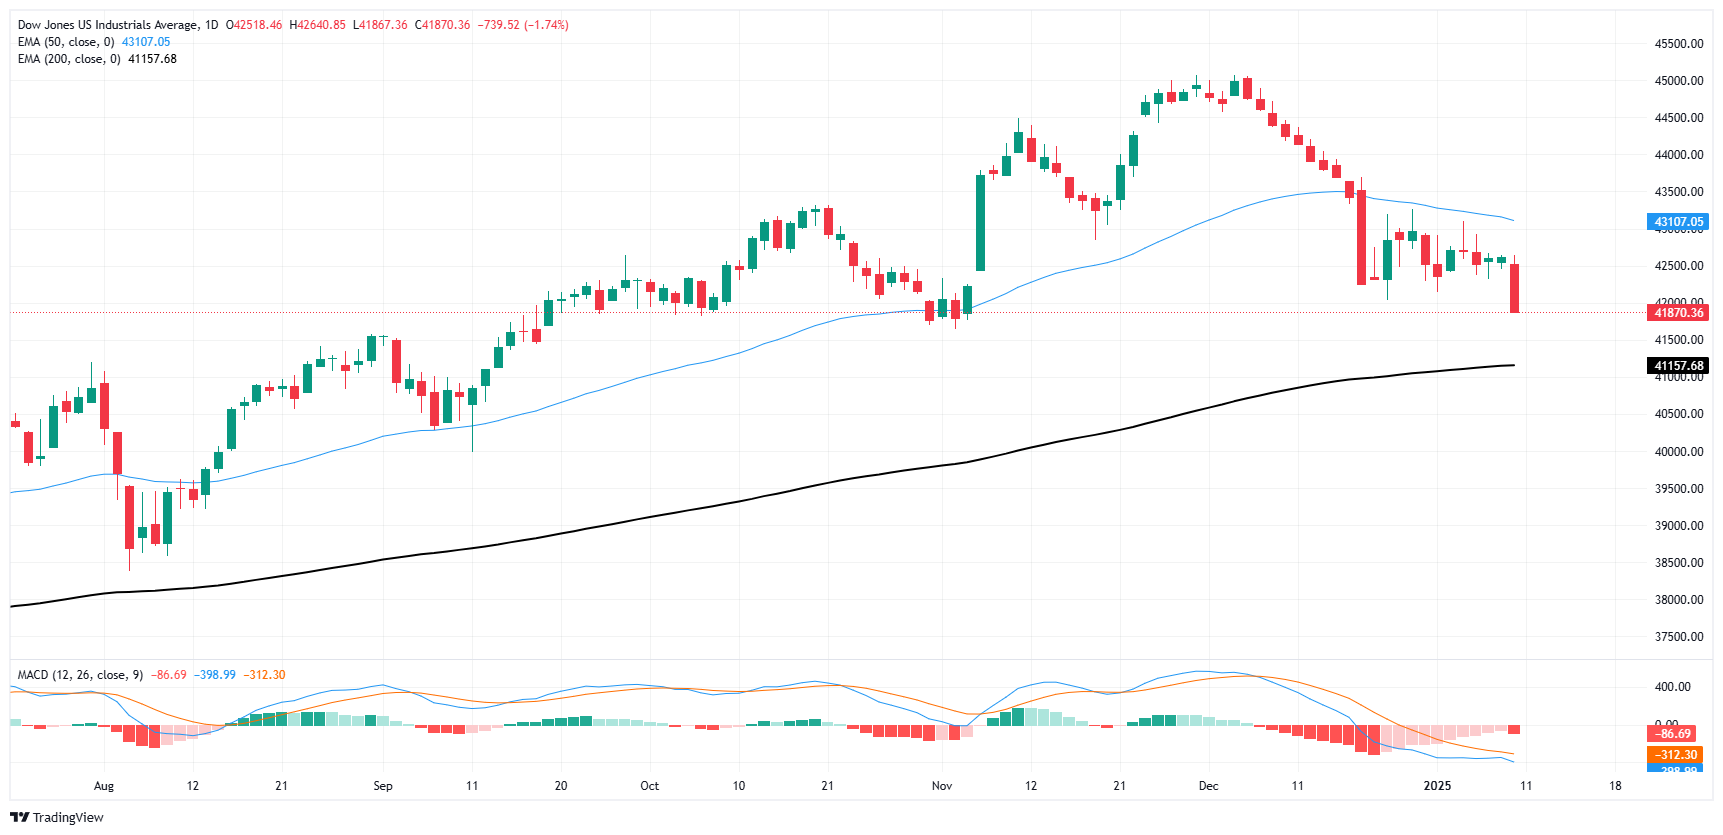
Friday’s post-NFP glut has pushed the Dow Jones within a stone’s throw of the 200-day Exponential Moving Average (EMA) near 41,160. The Dow Jones Industrial Average is poised to close below the 42,000 handle for the first time since early November, and the major equity index is down over 7% from record highs of 45,065 set in December.
The ongoing backslide in the Dow Jones will certainly spark fresh fears of an extended downturn; however, price action still remains north of the last major swing low, which was also supported by the 41,600 level. Despite a poor December performance and more of the same so far in January, the Dow Jones is coming off of a stellar bull run that saw the DJIA add nearly 20% bottom-to-top through 2024.
Dow Jones daily chart
Dow Jones FAQs
The Dow Jones Industrial Average, one of the oldest stock market indices in the world, is compiled of the 30 most traded stocks in the US. The index is price-weighted rather than weighted by capitalization. It is calculated by summing the prices of the constituent stocks and dividing them by a factor, currently 0.152. The index was founded by Charles Dow, who also founded the Wall Street Journal. In later years it has been criticized for not being broadly representative enough because it only tracks 30 conglomerates, unlike broader indices such as the S&P 500.
Many different factors drive the Dow Jones Industrial Average (DJIA). The aggregate performance of the component companies revealed in quarterly company earnings reports is the main one. US and global macroeconomic data also contributes as it impacts on investor sentiment. The level of interest rates, set by the Federal Reserve (Fed), also influences the DJIA as it affects the cost of credit, on which many corporations are heavily reliant. Therefore, inflation can be a major driver as well as other metrics which impact the Fed decisions.
Dow Theory is a method for identifying the primary trend of the stock market developed by Charles Dow. A key step is to compare the direction of the Dow Jones Industrial Average (DJIA) and the Dow Jones Transportation Average (DJTA) and only follow trends where both are moving in the same direction. Volume is a confirmatory criteria. The theory uses elements of peak and trough analysis. Dow’s theory posits three trend phases: accumulation, when smart money starts buying or selling; public participation, when the wider public joins in; and distribution, when the smart money exits.
There are a number of ways to trade the DJIA. One is to use ETFs which allow investors to trade the DJIA as a single security, rather than having to buy shares in all 30 constituent companies. A leading example is the SPDR Dow Jones Industrial Average ETF (DIA). DJIA futures contracts enable traders to speculate on the future value of the index and Options provide the right, but not the obligation, to buy or sell the index at a predetermined price in the future. Mutual funds enable investors to buy a share of a diversified portfolio of DJIA stocks thus providing exposure to the overall index.
-
17:10
EUR/USD Price Analysis: Pair in multi-year lows, sellers advance
- EUR/USD falls for the fourth consecutive session before a modest uptick to 1.0310 on Friday.
- RSI hovers at 33, edging closer to oversold territory amid persistent bearish pressure.
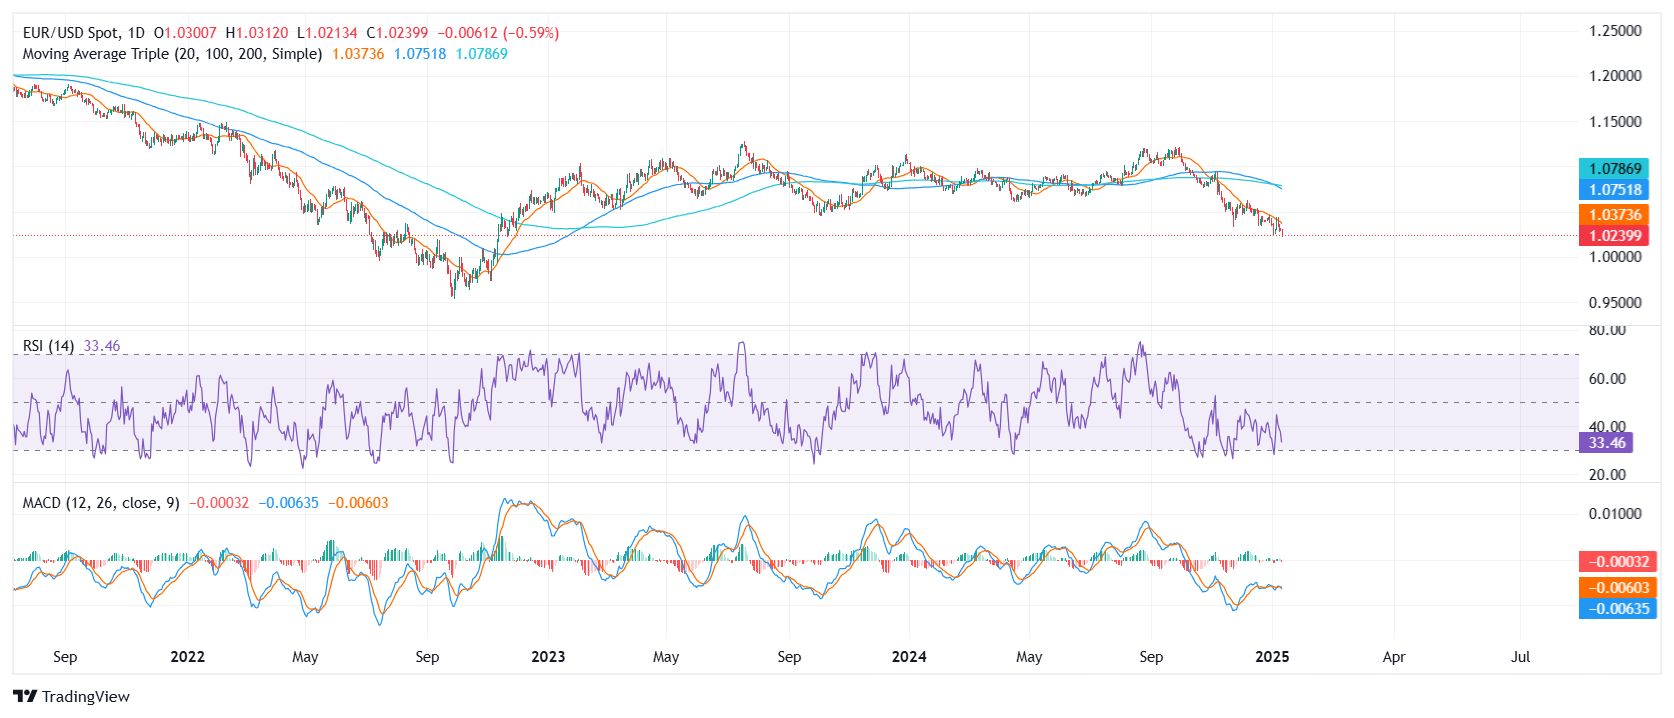
EUR/USD deepened its descent into fresh lows not seen since November 2022, briefly dipping below 1.0250 on Friday and the pair tallies four-day losing streak, reflecting an overall negative tone in recent sessions. Sellers appear to be firmly in control, with any bullish attempts thus far failing to generate a meaningful shift in direction.
Technical indicators underscore the prevailing downside risk. While the Relative Strength Index (RSI) at 33 is nearing oversold territory, its downward trajectory suggests that buyers lack conviction. Meanwhile, the Moving Average Convergence Divergence (MACD) histogram has turned more bearish, printing rising red bars and pointing to an acceleration in negative momentum.
In terms of key levels, immediate support emerges near the 1.0250 mark, and a break beneath that floor would expose the 1.0220 region or potentially lower. On the flip side, if EUR/USD manages to climb above 1.0350, it could alleviate some selling pressure and open the door toward the 1.0380 resistance area, where a more sustained recovery attempt may gain traction.
EUR/USD daily chart
-
16:23
Fed's Goolsbee: Rates should go down if conditions are stable and there is no uptick in inflation
In an interview with CNBC on Friday, Federal Reserve (Fed) Bank of Chicago President Austan Goolsbee said if conditions are stable and there is no uptick in inflation, with full employment, rates should go down, per Reuters.
Key takeaways
"Will never complain about 250,000 jobs."
"Still should not over-index on individual job reports."
"Will have to process if retail gains were a strong holiday season or something more general."
"I do not see job market as a source of inflation."
"Current wage growth consistent with 2% inflation given productivity."
"Job market seems stable at full employment."
"Rise in long rates not explained by expected inflation."
"Some component of rise in long rates is from higher than expected growth, and expected slower pace of fed cuts."
"Inflation rate over the last six months was 1.9%."
"12 to 18 months from now rates would be a fair bit lower if current expectations are met."
"Fed does have to think about issues like tariffs, and other nations' responses, that impact prices."
"Issue would be determining if tariffs are a one time shock to prices or a persistent one."
"Once there are concrete proposals, the Fed will have to think about how they impact dual mandate goals."
"The current high annual inflation number is largely reflecting the uptick of early last year; wrong to say there has not been recent progress."
"The reason inflation looks sticky now is because of the jump a year ago."
"Interest sensitive parts of the economy do show the impact of Fed restraint, even if that is offset by things like business confidence."
"So far, I do not see evidence of overheating in recent months."
"It would be a concern if long rates started rising on the basis of inflation expectations."
Fed FAQs
Monetary policy in the US is shaped by the Federal Reserve (Fed). The Fed has two mandates: to achieve price stability and foster full employment. Its primary tool to achieve these goals is by adjusting interest rates. When prices are rising too quickly and inflation is above the Fed’s 2% target, it raises interest rates, increasing borrowing costs throughout the economy. This results in a stronger US Dollar (USD) as it makes the US a more attractive place for international investors to park their money. When inflation falls below 2% or the Unemployment Rate is too high, the Fed may lower interest rates to encourage borrowing, which weighs on the Greenback.
The Federal Reserve (Fed) holds eight policy meetings a year, where the Federal Open Market Committee (FOMC) assesses economic conditions and makes monetary policy decisions. The FOMC is attended by twelve Fed officials – the seven members of the Board of Governors, the president of the Federal Reserve Bank of New York, and four of the remaining eleven regional Reserve Bank presidents, who serve one-year terms on a rotating basis.
In extreme situations, the Federal Reserve may resort to a policy named Quantitative Easing (QE). QE is the process by which the Fed substantially increases the flow of credit in a stuck financial system. It is a non-standard policy measure used during crises or when inflation is extremely low. It was the Fed’s weapon of choice during the Great Financial Crisis in 2008. It involves the Fed printing more Dollars and using them to buy high grade bonds from financial institutions. QE usually weakens the US Dollar.
Quantitative tightening (QT) is the reverse process of QE, whereby the Federal Reserve stops buying bonds from financial institutions and does not reinvest the principal from the bonds it holds maturing, to purchase new bonds. It is usually positive for the value of the US Dollar.
-
16:09
Big upside in December U.S. payrolls cements a Fed hold this month – RBC Economics
U.S. labor market data continue to show strength towards the end of last year, in line with job openings data that turned around to rise consecutively in October and November, RBC Economics’ economists note.
Fed set to hold this month
“Concerns over substantial weakening in the jobs market have continued to ease, leaving the Fed with much less urgency to cut interest rates.”
“The Fed already pivoted to a more gradual easing cycle in their last meeting In December. We think the odds of an additional rate cut this month are low, and the central bank will more likely be holding rates steady at the current 4.25% - 4.5% range throughout 2025.”
-
16:06
USD/JPY remains subdued near 158.00 after reaching multi-month high
- USD/JPY hovers near 158.00 as it retreaces due to US economy creating 256,000 jobs last month, surpassing the forecasts.
- The US unemployment rate drops to 4.1%, with average hourly earnings slightly decreasing, influencing Fed rate cut projections.
- The US 10-year Treasury yield sees volatility, peaking at 4.788%.
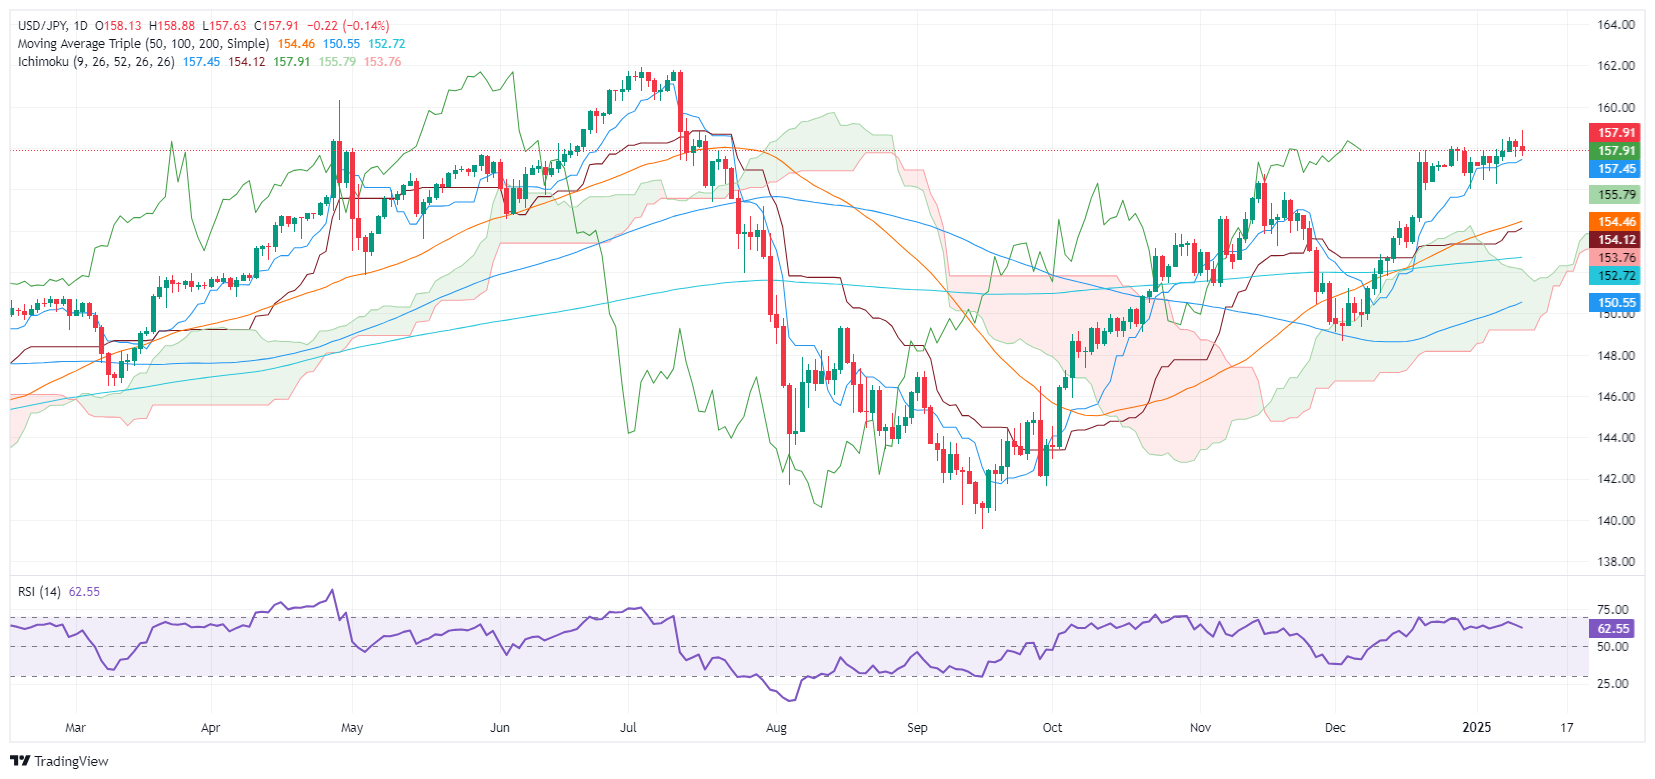
The USD/JPY remains subdued after hitting a six-month high of 158.88 following the release of a stellar US Nonfarm Payrolls report, which saw the Unemployment Rate falling near 4%. The pair trades at 158.27, down 0.09%.
USD/JPY pair hits 158.88 amid speculation of Fed cutting once
The US Bureau of Labor Statistics (BLS) revealed that the economy created 256,000 jobs last month, although November was revised downward from 227,000 to 212,000. Forecasts expected 160,000 people to be added to the workforce, with private hiring totaling 223,000.
Furthermore, the Unemployment Rate fell to 4.1%, while Average Hourly Earnings (AHE) dipped from 4% to 3.9%. Following the data release, traders expect the Federal Reserve to cut rates just once in 2025.
The US 10-year Treasury note skyrocketed to 4.788% before retreating five basis points (bps) to 4.739%. This consequently weighed on the Greenback, as the USD/JPY turned negative, yet close to remaining almost unchanged.
The US Dollar Index (DXY) rose to 109.96, its highest level since November 2022. Recently, DXY pared some of its gains, is at 109.55, up 0.36%.
During the Asian session, Bloomberg revealed that the Bank of Japan (BoJ) is still mulling its rate decision for January and is also increasing inflation forecasts due to the softening Japanese Yen (JPY). The odds for a rate hike in January are seen as a coin flip.
The University of Michigan Consumer Sentiment for January is expected to show a slight improvement later in the day.
USD/JPY Price Analysis: Technical outlook
The USD/JPY ís pressured on Friday, yet the uptrend remains intact. Buyers need to clear the current year-to-date (YTD) peak at 158.88 to challenge 159.00 and eye the 160.00 figure. On the other hand, their first line of defense would be the Tenkan-sen at 157.45 before sliding further toward the latest swing low of 156.24.
Japanese Yen PRICE Today
The table below shows the percentage change of Japanese Yen (JPY) against listed major currencies today. Japanese Yen was the strongest against the New Zealand Dollar.
USD EUR GBP JPY CAD AUD NZD CHF USD 0.53% 0.64% -0.05% 0.10% 0.64% 0.72% 0.45% EUR -0.53% 0.10% -0.60% -0.44% 0.09% 0.18% -0.08% GBP -0.64% -0.10% -0.68% -0.53% -0.00% 0.08% -0.18% JPY 0.05% 0.60% 0.68% 0.16% 0.70% 0.77% 0.51% CAD -0.10% 0.44% 0.53% -0.16% 0.53% 0.61% 0.35% AUD -0.64% -0.09% 0.00% -0.70% -0.53% 0.09% -0.17% NZD -0.72% -0.18% -0.08% -0.77% -0.61% -0.09% -0.26% CHF -0.45% 0.08% 0.18% -0.51% -0.35% 0.17% 0.26% The heat map shows percentage changes of major currencies against each other. The base currency is picked from the left column, while the quote currency is picked from the top row. For example, if you pick the Japanese Yen from the left column and move along the horizontal line to the US Dollar, the percentage change displayed in the box will represent JPY (base)/USD (quote).
-
16:00
United States Michigan Consumer Sentiment Index came in at 73.2, below expectations (73.8) in January
-
16:00
United States UoM 5-year Consumer Inflation Expectation increased to 3.3% in January from previous 3%
-
15:51
Canadian labor markets firmed, but still soft, in December – RBC Economics
The December labor market numbers are clearly firmer than expected, with headlines and details broadly better than feared. Still, the data is notoriously volatile, and the unemployment rate is still up almost a percentage point from a year ago and at its second highest level (outside of the 2020/21 pandemic) since 2017, RBC Economics’ economists note.
Canadian employment in December faces the largest increase in almost 2 years
“We continue to think it is unlikely that the broader uptrend in the unemployment rate has ended (the 3-month average rate continued to rise in December) with hiring demand (job openings) still running well below year-ago levels.”
“The Bank of Canada (BoC) already flagged in December that with interest rates no longer clearly at 'restrictive' levels, and inflation running back around the central bank's 2% target, the pace of rate cuts will be more gradual, and contingent on the evolution of economic data, going forward.”
“We continue to expect that ultimately the BoC will need to cut the overnight rate to slightly 'stimulative' levels this year - below the 2.25% to 3.25% the BoC currently estimates as the likely range for the current neutral rate.”
-
15:03
GBP retains a soft undertone – Scotiabank
The Pound Sterling (USD) is down marginally on the session but, like many of its G10 counterparts, the pound has settled into a tight trading range into the end of the week, Scotiabank’s Chief FX Strategist Shaun Osborne notes.
Gilts underperform again
“UK bonds remain marginal underperformers but 10Y yields are up only fractionally more than peer markets (a 2.5bps gain in UK yields versus a 2 bps rise in core Eurozone debt, for example). The UK government’s fiscal plans remain under threat from the rise in UK bond yields but comparisons with the 2022 market rout remain wide of the mark, I think.”
“Spot is holding an inside range (holding within yesterday’s intraday range) signal on the daily chart so far—a signl that may suggest some relenting—in the short run, at least—in the bearish pressure on the GBP. The broader picture remains bearish, however, amid bearish trend indicators across the short-, medium-, and long-term oscillators.”
“Gains will be hard to sustain and losses easier to come by in this environment. Resistance is 1.2350/60. Support is 1.2240/50.”
-
15:01
EUR/USD: Markets are reluctant perhaps to push FX too hard – Scotiabank
The Euro (EUR) has settled into a tight trading range around the 1.03 point through the latter part of this week, Scotiabank’s Chief FX Strategist Shaun Osborne notes.
EUR consolidates in tight range around 1.03
“Markets are reluctant perhaps to push FX too hard either way ahead of the inauguration. French Industrial Production rose a stronger than expected 0.2% in November while Spanish Industrial Production dropped 0.8% in the month. The data had no tangible impact on spot, however.
“The EUR has managed to stabilize over the week, blunting the USD bull trend for the moment. Trend momentum remains EUR-negative, but the EUR may get a temporary reprieve from somewhat oversold conditions on the longer run studies.”
“Broader trends remain bearish though and unless spot can regain 1.0450 and extend gains through that point in a sustained manner, technical prospects remain dim. EUR support is 1.0200/25.”
-
14:55
USD/CNH: Room for USD to retest the 7.3700 level – UOB Group
Slight increase in upward momentum is likely to lead to US Dollar (USD) trading in a higher range of 7.3450/7.3650. In the longer run, room for USD to retest the 7.3700 level; it is too early to determine if it can break and remain above this level, UOB Group’s FX analysts Quek Ser Leang and Lee Sue Ann note.
USD unlikely to break and remain above 7.3700
24-HOUR VIEW: “Our expectation for USD to ‘trade in a range between 7.3430 and 7.3615’ yesterday was wrong, even though it traded in a narrower range than expected (7.3439/7.3587). USD closed largely unchanged at 7.3561 (+0.05%). Despite the relatively quiet price action, there has been a slight increase in upward momentum. However, this is likely to lead to a higher trading range of 7.3450/7.3650 instead of a sustained rise.”
1-3 WEEKS VIEW: “Our latest narrative was from three days ago (07 Jan, spot at 7.3465), wherein ‘as long as 7.3050 is not breached, there is room for USD to retest the 7.3700 level.’ We indicated that ‘at this time, it is too early to determine if USD can break and remain above this level.’ There is no change in our view, but the ‘strong support’ level at 7.3050 has moved higher to 7.3250.”
-
14:35
GBP/JPY finds cushion near 194.00, more downside remains likely
- GBP/JPY discovers a temporary cushion near 194.00, while its outlook remains uncertain.
- UK 30-year gilt yields soared amid growing concerns over mounting debt and caution over Trump’s protectionist policies.
- The BoJ said that it is considering raising the inflation forecast due to the depreciating Yen.
The GBP/JPY pair finds temporary support near 194.00 in Friday’s North American session after a two-day sell-off amid weakness in the Pound Sterling (GBP) across the board. The British currency faces intense selling pressure as yields on United Kingdom (UK) 30-year gilts spiked above 5.4%, the highest since 1992.
Market participants dumped UK gilts as they are worried about the UK economic outlook. Concerns over UK growth prospects have mounted, partly due to my deepening uncertainty over likely tight United States (US) trade policies under the administration of President-elect Donald Trump and the piling nation’s debt.
Higher UK gilt yields have resulted in a sharp increase in the government’s borrowing costs, which could prompt the need for more tax collection and lower public spending by the finance ministry, given that the Chancellor of the Exchequer vowed to avoid tapping borrowings to incur day-to-day spending.
However, UK Treasury Minister Darren Jones clarified at the House of Commons on Thursday that the government's decision to only borrow for investment was "non-negotiable". Jones added that it is normal for the price of gilts to "vary" and assured that financial markets continue to function in an "orderly way".
Meanwhile, the Japanese Yen (JPY) preforms strongly on Friday as the Bank of Japan (BoJ) is still considering the interest rate decision for its January monetary policy review, Bloomberg reported. The agency further added that the BoJ mulls to upgrade core-core inflation views for FY2024 and FY2025 on depreciating Yen.
-
14:31
Germany Current Account n.s.a. rose from previous €12.5B to €24.1B in November
-
14:31
United States Nonfarm Payrolls registered at 256K above expectations (160K) in November
-
14:31
Canada Unemployment Rate came in at 6.7%, below expectations (6.9%) in December
-
14:30
Canada Net Change in Employment above forecasts (25K) in December: Actual (90.9K)
-
14:30
United States Average Hourly Earnings (MoM) meets forecasts (0.3%) in December
-
14:30
United States U6 Underemployment Rate fell from previous 7.8% to 7.5% in December
-
14:30
Canada Building Permits (MoM) came in at -5.9%, below expectations (1.8%) in November
-
14:30
United States U6 Underemployment Rate climbed from previous 7.8% to 33% in December
-
14:30
United States Average Weekly Hours in line with forecasts (34.3) in December
-
14:30
United States Average Hourly Earnings (YoY) below expectations (4%) in December: Actual (3.9%)
-
14:30
United States Unemployment Rate came in at 4.1%, below expectations (4.2%) in December
-
14:30
United States Labor Force Participation Rate: 62.5% (December)
-
14:30
Canada Participation Rate unchanged at 65.1% in December
-
13:16
US Dollar trades steady while markets await NFP report
- The US Dollar trades flat against most major peers.
- Inflation woes stepped aside while traders focus on the upcoming Employment Report.
- The US Dollar Index (DXY) steadies around 109.00 and is set for some volatility later this Friday.
The US Dollar Index (DXY), which tracks the Greenback’s value against six major currencies, is trading steady this Friday, at 109.17 at the time of writing, ahead of the US employment report due later. Markets are leaving aside for a few hours inflation woes, which were the main theme throughout this week. Those concerns are moving now to the background while Asian equities are set to close off this week with a five-day losing streak.
The US economic calendar is quite interesting on Friday, with the December Nonfarm Payrolls (NFP) release and the January University of Michigan preliminary reading. Expectations for the NFP reading range from 100,000 e to 268,000. Expect any print below 100,000 to trigger substantial US Dollar (USD) weakness, while a print near or above 268,000 will trigger more US Dollar strength.
Daily digest market movers: Last employment report for Biden
- At 13:30 GMT, the US employment report for December will be released with the following main key elements:
- Nonfarm Payrolls headline data is expected to show 160,000 new workers against the 227,000 in November.
- The Unemployment Rate is expected to remain stable at 4.2%.
- The monthly Average Hourly Earnings are expected to ease a touch to 0.3% in December from the previous 0.4%.
- At 15:00 GMT, the University of Michigan releases its January preliminary reading:
- The Consumer Sentiment Index is expected to remain elevated at 73.8, just a bit lower from the previous 74.0.
- The 5-year Consumer Inflation Expectation print has no forecast and was at 3% in the final December reading.
- Equities look sluggish this Friday, with the Asian ones set to end the week with a negative daily close for China or Japan.
- The CME FedWatch Tool is projecting a 93.1% chance that interest rates will be kept unchanged at current levels in the January meeting. Expectations are for the Federal Reserve (Fed) to remain data-dependent with uncertainties that could influence the inflation path once President-elect Donald Trump takes office on January 20.
- US yields are softening a touch with the 10-year benchmark at 4.689%, off the fresh nine -month high at 4.728% seen on Wednesday.
US Dollar Index Technical Analysis: Ten more days
The US Dollar Index (DXY) is entering its last ten days of trading under President Joe Biden before President-elect Donald Trump’s inauguration on January 20. The question will be how much downside there is, given the general consensus that Trump’s policies will be inflationary and drive the US Dollar higher. Expect buyers to come in and quickly push the DXY back up, even with a weaker Nonfarm Payrolls release.
On the upside, it is key that the green ascending trend line can hold as support, although that is often not the scenario going forward. If the DXY can head and break above the 110.00 psychological barrier, 110.79 becomes the next big level. Once beyond there, it is quite a stretch to 113.91, the double top from November 2023.
On the contrary, the first downside barrier is 107.35, which has now turned into support. The next level that might halt any selling pressure is 106.52, with the 55-day Simple Moving Average (SMA) at 106.72 reinforcing this region of support.
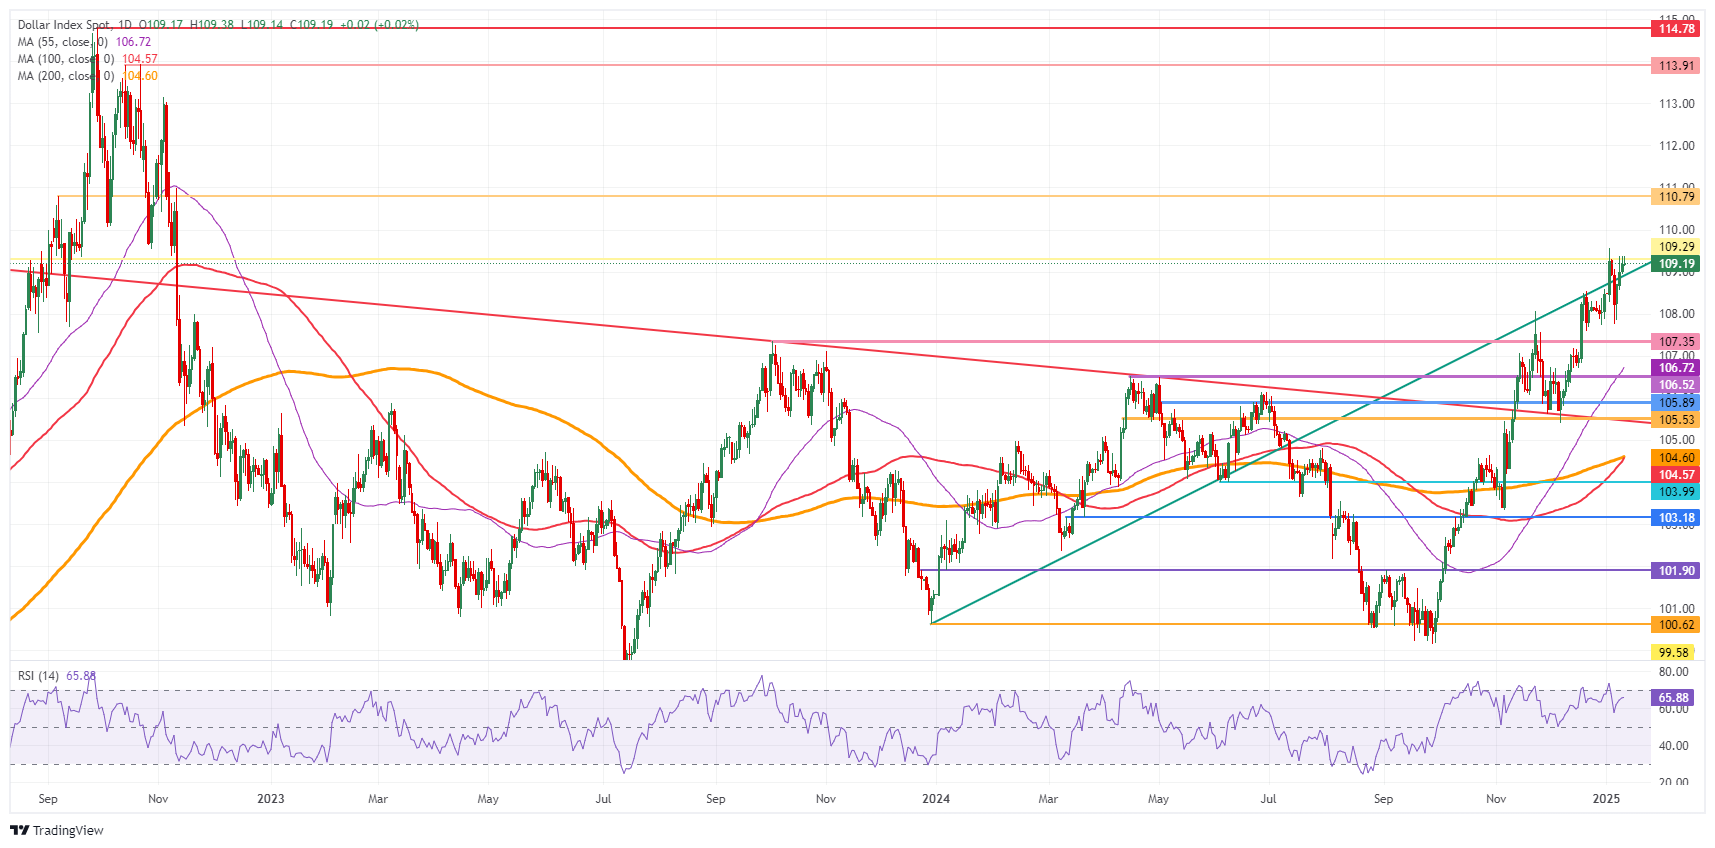
US Dollar Index: Daily Chart
US Dollar FAQs
The US Dollar (USD) is the official currency of the United States of America, and the ‘de facto’ currency of a significant number of other countries where it is found in circulation alongside local notes. It is the most heavily traded currency in the world, accounting for over 88% of all global foreign exchange turnover, or an average of $6.6 trillion in transactions per day, according to data from 2022. Following the second world war, the USD took over from the British Pound as the world’s reserve currency. For most of its history, the US Dollar was backed by Gold, until the Bretton Woods Agreement in 1971 when the Gold Standard went away.
The most important single factor impacting on the value of the US Dollar is monetary policy, which is shaped by the Federal Reserve (Fed). The Fed has two mandates: to achieve price stability (control inflation) and foster full employment. Its primary tool to achieve these two goals is by adjusting interest rates. When prices are rising too quickly and inflation is above the Fed’s 2% target, the Fed will raise rates, which helps the USD value. When inflation falls below 2% or the Unemployment Rate is too high, the Fed may lower interest rates, which weighs on the Greenback.
In extreme situations, the Federal Reserve can also print more Dollars and enact quantitative easing (QE). QE is the process by which the Fed substantially increases the flow of credit in a stuck financial system. It is a non-standard policy measure used when credit has dried up because banks will not lend to each other (out of the fear of counterparty default). It is a last resort when simply lowering interest rates is unlikely to achieve the necessary result. It was the Fed’s weapon of choice to combat the credit crunch that occurred during the Great Financial Crisis in 2008. It involves the Fed printing more Dollars and using them to buy US government bonds predominantly from financial institutions. QE usually leads to a weaker US Dollar.
Quantitative tightening (QT) is the reverse process whereby the Federal Reserve stops buying bonds from financial institutions and does not reinvest the principal from the bonds it holds maturing in new purchases. It is usually positive for the US Dollar.
-
13:00
Mexico Industrial Output (YoY) meets expectations (-1.4%) in November
-
13:00
Brazil IPCA Inflation increased to 0.52% in December from previous 0.39%
-
12:58
USD/JPY: The pair is expected to trade with an upward bias – UOB Group
US Dollar (USD) is expected to trade in a range between 157.60 and 158.55. In the longer run, USD is expected to trade with an upward bias; any advance is expected to face significant resistance at 159.00, UOB Group’s FX analysts Quek Ser Leang and Lee Sue Ann note.
USD/JPY expected to face significant resistance at 159.00
24-HOUR VIEW: “Two days ago, we expected USD to ‘test 158.50.’ USD subsequently rose to 158.54. Yesterday, when USD was at 158.25, we highlighted that ‘despite slowing upward momentum, there is room for USD to 158.65 before a pullback can be expected.’ However, instead of rising, USD traded in a range between 157.56 and 158.43. The current price action is likely part of a range trading phase. Today, we expect USD to trade between 157.60 and 158.55.”
1-3 WEEKS VIEW: “There is not much to add to our update from Tuesday (07 Jan, spot at 158.15). As highlighted, ‘upward momentum is building, and we expect USD to trade with an upward bias.’ We also highlighted that, ‘any advance is expected to face significant resistance at 159.00.’ We continue to hold the same view, provided that 157.20 (no change in ‘strong support level) is not breached.”
-
12:52
Fed's Musalem: Greater caution is warranted on reducing interest rates – WSJ
In an interview with the Wall Street Journal, St. Louis Federal Reserve President Alberto Musalem suggested that greater caution is warranted on reducing interest rates, per Reuters.
Musalem added that the risk that inflation might get stuck between 2.5% and 3% had increased by the time of last month’s meeting.
Market reaction
These comments failed to trigger a noticeable market reaction. At the time of press, the US Dollar Index was virtually unchanged on the day at 109.18.
Fed FAQs
Monetary policy in the US is shaped by the Federal Reserve (Fed). The Fed has two mandates: to achieve price stability and foster full employment. Its primary tool to achieve these goals is by adjusting interest rates. When prices are rising too quickly and inflation is above the Fed’s 2% target, it raises interest rates, increasing borrowing costs throughout the economy. This results in a stronger US Dollar (USD) as it makes the US a more attractive place for international investors to park their money. When inflation falls below 2% or the Unemployment Rate is too high, the Fed may lower interest rates to encourage borrowing, which weighs on the Greenback.
The Federal Reserve (Fed) holds eight policy meetings a year, where the Federal Open Market Committee (FOMC) assesses economic conditions and makes monetary policy decisions. The FOMC is attended by twelve Fed officials – the seven members of the Board of Governors, the president of the Federal Reserve Bank of New York, and four of the remaining eleven regional Reserve Bank presidents, who serve one-year terms on a rotating basis.
In extreme situations, the Federal Reserve may resort to a policy named Quantitative Easing (QE). QE is the process by which the Fed substantially increases the flow of credit in a stuck financial system. It is a non-standard policy measure used during crises or when inflation is extremely low. It was the Fed’s weapon of choice during the Great Financial Crisis in 2008. It involves the Fed printing more Dollars and using them to buy high grade bonds from financial institutions. QE usually weakens the US Dollar.
Quantitative tightening (QT) is the reverse process of QE, whereby the Federal Reserve stops buying bonds from financial institutions and does not reinvest the principal from the bonds it holds maturing, to purchase new bonds. It is usually positive for the value of the US Dollar.
-
12:51
EU natural gas prices get weaker – ING
In Europe, refined product inventories in the ARA region increased by 50kt WoW to 6.77mt. The increase was driven by gasoline stocks which grew by 120kt. All other products saw a decline in inventories with gasoil stocks falling by 35kt. However, with gas/oil inventories still standing at 2.47mt, they are at very comfortable levels for this time of the year, ING’s commodity analysts Warren Patterson and Ewa Manthey note.
European natural gas prices come under further pressure
“European natural gas prices came under further pressure yesterday. TTF fell by 1.26% to settle just below EUR45/MWh. This leaves total declines at more than 9% so far this week. The forecast for North West Europe shows some milder weather next week, which will be easing some concerns.”
“In addition, the spread between European and Asian LNG prices means that Europe should be a more attractive market for LNG. EU storage is now 68% full, down from 83% at the same time last year and below the five-year average of 74%.”
-
12:46
NZD/USD: Sustained break below 0.5570 seems unlikely – UOB Group
Scope for the New Zealand (NZD) to test the 0.5570 level; a sustained break below this level seems unlikely. In the longer run, risk for NZD is beginning to shift to the downside, but it must break clearly below 0.5570, UOB Group’s FX analysts Quek Ser Leang and Lee Sue Ann note.
NZD is beginning to shift to the downside
24-HOUR VIEW: “While we expected NZD to ‘continue to weaken’ yesterday, we pointed out that ‘oversold conditions suggest any decline is unlikely to break clearly below 0.5570.’ Our view was validated, as NZD dropped to a low of 0.5572, rebounding to close at 0.5600 (-0.14%). While downward momentum has slowed somewhat, there is scope for NZD to test the 0.5570 level. A sustained break below this level seems unlikely. Resistance is at 0.5610; a breach of 0.5625 would mean that the current downward pressure has faded.”
1-3 WEEKS VIEW: “We noted yesterday (09 Jan, spot at 0.5605) that ‘the risk for NZD is beginning to shift to the downside.’ However, we pointed out that it ‘must break clearly below 0.5570.’ NZD subsequently dropped to 0.5572 before rebounding. We continue to hold the same view as long as 0.5645 (‘strong resistance’ level was at 0.5660 yesterday) is not breached.
-
12:35
Oil remains well supported – ING
Oil prices remain well supported with ICE Brent settling 1% higher yesterday, ING’s commodity analysts Warren Patterson and Ewa Manthey note.
Market sentiment remains positive
“Sentiment remains positive on the back of colder weather across parts of the Northern Hemisphere, which is likely to boost oil demand. In addition, spot Asian LNG is trading at a premium to oil, increasing the risk of substitution.”
“Meanwhile, uncertainty over how hawkish Trump will be with Iran will be providing some support. Asian buyers have already been looking for alternative grades from the Middle East, with broader sanctions against Russia and Iran making this oil flow more difficult. This move had pushed the Brent-Dubai spread into negative territory in recent weeks, although it has since reverted to a premium.”
-
12:34
Gold positions for a breakout ahead of December’s NFP report
- Gold price heads to $2,680 ahead of Nonfarm Payrolls release.
- The Fed needs to balance recent inflation fears.
- Gold could be set for a breakout towards $2,700, depending on the US employment report.
Gold’s price (XAU/USD) is set to keep its winning streak for a fourth straight day this week, currently trading around $2,680 at the time of writing on Friday. Inflation fears keep driving the precious metal higher while the Federal Reserve (Fed) remains quite sidelined about it by now. Meanwhile, the possibility of fewer interest rate cuts is supporting the odds for Gold to hit $3,000 by mid-2026, according to Goldman Sachs, Bloomberg reports.
On the economic data front, the Nonfarm Payrolls (NFP) release for December will be the crucial catalyst to decide whether Gold prices head higher or lower before closing off this week. Expectations for the Nonfarm Payrolls reading range from 100,000 to 268,000, with market consensus at 168,000. Expect any print below 100,000 to take away some inflation concerns and bring some profit-taking, while a print near or above 268,000 will spark more worries about interest rates remaining elevated.
Daily digest market movers: Employment report at crucial time
- India’s government acknowledged it miscalculated import figures for precious metals for months. Preliminary estimates released earlier this week suggested gold imports for November stood at $9.84 billion — about $5 billion, or a third, lower than what was previously reported for the month. The ministry said Thursday it’s still in the process of the data, Bloomberg reports.
- Fed officials until now have signaled they’ll likely hold interest rates at current levels for an extended period, only cutting again when inflation meaningfully cools, Bloomberg reports.
- At 13:30 GMT, the US employment report for December will be released with the following main key elements:
- Nonfarm Payrolls headline data is expected to show 160,000 new workers against the previous 227,000 in November.
- The Unemployment Rate is expected to remain stable at 4.2%.
- The monthly Average Hourly Earnings are expected to ease a touch to 0.3% in December from the previous 0.4%.
- Near 20:30, Gold NC Net Positions will be released by the Commodity Futures Trading Commission (CFTC). Forecast for this time is not available but previous positioning was at $247,300 The report provides information on the size and the direction of the positions taken, across all maturities, participants primarily based in Chicago and New York futures markets. Forex traders focus on "non-commercial" or speculative positions, to determine whether a trend remains healthy or not and also market sentiment towards a certain asset.
Technical Analysis: Critical moment
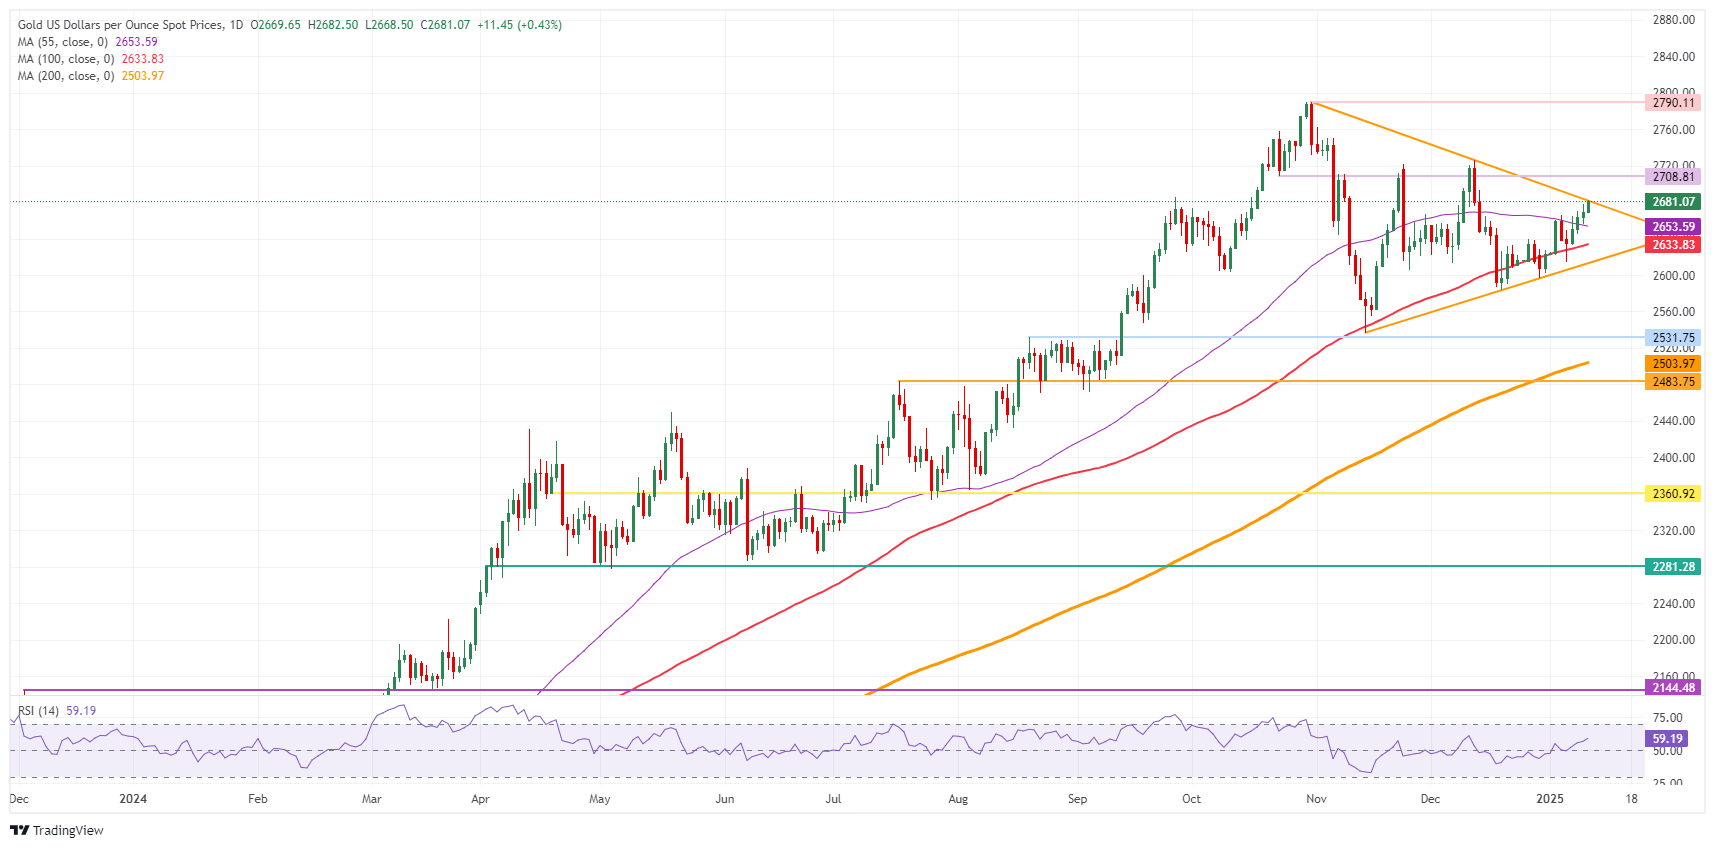
It’s money time for Bullion as the price action knocks on the door of the upper band of the pennant chart formation on Friday. This afternoon’s US employment report will act as a catalyst and could push price action above the resistance zone, with prospects of a rise to $2,700 in the cards. A rejection would mean a move lower, with $2,614 possibly coming back into play.
On the downside, the 55-day SMA at $2,653 acts as the first support after it saw a daily close above it on Wednesday. The 100-day Simple Moving Average (SMA) at $2,633 is the next in line. Further down, the ascending trend line of the pennant pattern should provide support at around $2,614, as it did in the past three occasions. In case that support line snaps, a quick decline to $2,531 (August 20, 2024, high) could come back into play as support level.
On the upside, the descending trendline in the pennant chart formation at $2,682 is the first big upside level to watch. Once through there, $2,708 is the next pivotal level to look out for.
XAU/USD: Daily Chart
Gold FAQs
Gold has played a key role in human’s history as it has been widely used as a store of value and medium of exchange. Currently, apart from its shine and usage for jewelry, the precious metal is widely seen as a safe-haven asset, meaning that it is considered a good investment during turbulent times. Gold is also widely seen as a hedge against inflation and against depreciating currencies as it doesn’t rely on any specific issuer or government.
Central banks are the biggest Gold holders. In their aim to support their currencies in turbulent times, central banks tend to diversify their reserves and buy Gold to improve the perceived strength of the economy and the currency. High Gold reserves can be a source of trust for a country’s solvency. Central banks added 1,136 tonnes of Gold worth around $70 billion to their reserves in 2022, according to data from the World Gold Council. This is the highest yearly purchase since records began. Central banks from emerging economies such as China, India and Turkey are quickly increasing their Gold reserves.
Gold has an inverse correlation with the US Dollar and US Treasuries, which are both major reserve and safe-haven assets. When the Dollar depreciates, Gold tends to rise, enabling investors and central banks to diversify their assets in turbulent times. Gold is also inversely correlated with risk assets. A rally in the stock market tends to weaken Gold price, while sell-offs in riskier markets tend to favor the precious metal.
The price can move due to a wide range of factors. Geopolitical instability or fears of a deep recession can quickly make Gold price escalate due to its safe-haven status. As a yield-less asset, Gold tends to rise with lower interest rates, while higher cost of money usually weighs down on the yellow metal. Still, most moves depend on how the US Dollar (USD) behaves as the asset is priced in dollars (XAU/USD). A strong Dollar tends to keep the price of Gold controlled, whereas a weaker Dollar is likely to push Gold prices up.
-
12:32
GBP: UK Treasury eases market nerves – ING
The 10-year gilt stabilised around 4.80% yesterday, which has allowed the pound to partially recover after hitting a 1.224 low yesterday morning. What has helped calm market nerves was a comment by a top UK Treasury official who claimed ‘meeting the fiscal rules is non-negotiable’, ING’s FX analyst Francesco Pesole notes.
GBP/USD can attract buyers in the 1.225-1.230 area
“In practice, this means that since the rise in yields has eroded the fiscal headroom, Chancellor Rachel Reeves is more likely to deliver some fiscal consolidation should the updated OBR forecasts (released 26 March) show the government is not on track to meet the fiscal rule. That consolidation means higher taxes or lower spending – with the latter generally deemed more likely at this stage.”
“The market seems to be acknowledging the Treasury’s reiterated fiscal pledges and this has prevented the gilt and pound selloffs from becoming disorderly. As discussed in this note, this is not a sovereign crisis, and the rise in yields is – so far – justified.”
“This suggests we can expect some short-term respite for the pound. In the coming months, we expect fresh pressure on GBP on the back of much larger easing by the Bank of England compared to pricing; which may coincide with the fiscal tightening mentioned above. Today, the US leg could add some extra pressure on GBP/USD, but if gilts have another quiet session, the pair should attract buyers in the 1.225-1.230 area.”
-
12:31
India Bank Loan Growth fell from previous 11.5% to 11.2% in December 23
-
12:30
India FX Reserves, USD: $634.59B (December 30) vs previous $640.28B
-
12:30
AUD/USD: Next support at 0.6150 is not expected to come under threat – UOB Group
AUD could retest the 0.6175 level; the next support at 0.6150 is not expected to come under threat. In the longer run, AUD must break and remain below 0.6180 before further weakness can be expected, UOB Group’s FX analysts Quek Ser Leang and Lee Sue Ann note.
Below 0.6180 further weakness can be expected
24-HOUR VIEW: “Two days ago, AUD fell to a low of 0.6188. Yesterday, when AUD was at 0.6210, we noted that ‘the increase in downward momentum is not enough to suggest a sustained decline.’ However, we indicated that ‘provided that AUD remains below 0.6245 (minor resistance is at 0.6225), it could test the major support at 0.6180 before another rebound is likely.’ AUD then dropped to 0.6173, rebounding to close at 0.6198 (-0.29%). Although there has been no further increase in downward momentum, AUD could retest the 0.6175 level. The next support at 0.6150 is not expected to come under threat. Resistance is at 0.6210; a breach of 0.6225 would mean that downward momentum has eased.”
1-3 WEEKS VIEW: “Yesterday (09 Jan, spot at 0.6210), we highlighted that although the recent price action ‘has resulted in an increase in momentum, AUD must break and remain below 0.6180 before further weakness can be expected.’ While AUD subsequently dropped to a low of 0.6173, it rebounded quickly to close at 0.6198. The likelihood of AUD breaking clearly below 0.6180 remains intact, provided that 0.6250 (‘strong resistance’ level was at 0.6265 yesterday) is not breached.”
-
12:20
CAD is pressured by the perceived risk of a US-Canada trade war – ING
Employment data for December is also released in Canada today, where expectations are for a slowdown in hiring to 25k and another tick-up in unemployment to 6.9%, ING’s FX analyst Francesco Pesole notes.
Tew Canadian prime minister can have an impact on CAD
“The impact on CAD would likely be short-lived as the currency is almost entirely trading on the back of the perceived risk of a US-Canada trade war, and how that can be impacted by the new prime minister.”
“At this stage, consensus seems to be building around two candidates: former Finance Minister Chrystia Freeland and former Bank of Canada/Bank of England Governor Mark Carney.”
-
12:17
USD/CAD extends winning streak ahead of US-Canada labor market data
- USD/CAD edges higher slightly above 1.4400 with US-Canada employment data in focus.
- The uncertainty over Trump’s policies continues to keep the USD on the frontfoot.
- The labor growth in Canada is estimated to have slowed significantly in December.
The USD/CAD pair extends its winning spree for the fourth trading session on Friday ahead of the official employment of the United States (US) and Canada for December. The Loonie pair ticks higher slightly above 1.4400 as the US Dollar (USD) edges up, with the US Dollar Index (DXY) staying above the key support of 109.00.
The overall performance of the US Dollar has remained firm for a few weeks as Federal Reserve (Fed) officials have become concerned over upside risks to inflation remaining persistent due to potential tariff and immigration policies under the administration of President-elect Donald Trump.
In Friday’s session, investors will pay close attention to the US Nonfarm Payrolls (NFP) data as it will influence market expectations for the monetary policy outlook.
According to market estimates, the US economy added 160K new workers in December, lower than 227K in November. The Unemployment Rate is expected to have remained steady at 4.2%. Signs of a slowdown in the labor demand would force traders to pare bets supporting the Fed to keep interest rates unchanged in the range of 4.25%-4.50%. On the contrary, strong numbers would boost the same.
Meanwhile, the Canadian Dollar (CAD) will also be influenced by the official employment data. Market participants expect the pace of hiring in December to be half of what had been recorded for November. The Canadian economy witnessed a fresh addition of 25K workers in December against 50.5K in November. The Unemployment Rate is seen accelerating to 6.9% from 6.8%. Signs of a slowdown in the labor demand would boost expectations that the Bank of Canada (BoC) will continue easing the monetary policy at a larger-than-usual pace of 50 basis points (bps).
Economic Indicator
Net Change in Employment
The Net Change in Employment released by Statistics Canada is a measure of the change in the number of people in employment in Canada. Generally speaking, a rise in this indicator has positive implications for consumer spending and indicates economic growth. Therefore, a high reading is seen as bullish for the Canadian Dollar (CAD), while a low reading is seen as bearish.
Read more.Next release: Fri Jan 10, 2025 13:30
Frequency: Monthly
Consensus: 25K
Previous: 50.5K
Source: Statistics Canada
Canada’s labor market statistics tend to have a significant impact on the Canadian dollar, with the Employment Change figure carrying most of the weight. There is a significant correlation between the amount of people working and consumption, which impacts inflation and the Bank of Canada’s rate decisions, in turn moving the C$. Actual figures beating consensus tend to be CAD bullish, with currency markets usually reacting steadily and consistently in response to the publication.
-
12:00
Ireland Retail Sales (MoM) increased to 0.5% in November from previous -0.1%
-
12:00
Ireland Retail Sales (YoY): -1% (November) vs previous 0.9%
-
11:53
India Manufacturing Output rose from previous 4.1% to 5.8% in November
-
11:53
India Cumulative Industrial Output climbed from previous 4% to 4.1% in November
-
11:53
India Industrial Output above forecasts (4%) in November: Actual (5.2%)
-
11:44
USD: Payrolls should keep Fed cautious – ING
The December US jobs report is released today and consensus is for a 138k payroll print and unchanged 4.2% unemployment rate. Our economics team also expects 4.2%, but is flagging room for a surprise on the strong side. Our house projection is 160k, ING’s FX analyst Francesco Pesole notes.
CPI report can have deeper market ramifications
“We think the balance of risks is tilted to the upside for the dollar today, as robust jobs figures could prompt markets to price out a March cut and potentially push the first fully-priced move beyond June. We would still argue that with inflation concerns back on the rise – although the Fedspeak has been quite heterogeneous on that topic – next Wednesday’s CPI report could have deeper market ramifications.”
“In the event of a (moderate) disappointment in today’s job figures, the dollar should take a positioning-readjustment hit, but dollar longs may simply be rebuilt at better levels ahead of key upcoming data releases and Trump’s inauguration on 20 January.”
-
11:32
Silver Price Forecast: XAG/USD rises to near $31.30 ahead of US NFP data
- Silver price moves higher to near $31.30, exhibiting a strong performance ahead of the US NFP data for December.
- The FOMC minutes signaled that policymakers are worried about a slowdown in the US disinflation trend.
- US President-elect Donald Trump-led volatility keeps the outlook of precious metals intact.
Silver price (XAG/USD) gains to near $31.30 in Friday’s European session. The white metal gains ahead of the United States (US) Nonfarm Payroll (NFP) data for December, which will be published at 13:30 GMT. The labor market data will influence market expectations about whether the Federal Reserve (Fed) will continue with its cautious stance on further policy-easing.
The NFP report is expected to show that the US economy added fresh 160K workers in December, lower than 227K in November. The Unemployment Rate is estimated to have remained steady at 4.2%.
Investors will also pay close attention to the Average Hourly Earnings data for December. Being a wage growth measure that drives consumer spending, the Average Hourly Earnings data will provide cues about the inflation outlook. Month-on-month Average Hourly Earnings is expected to have risen at a slower pace of 0.3% from the former release of 0.4%, with annual figures growing steadily by 4%.
The Federal Open Market Committee (FOMC) minutes for the December policy meeting showed that officials were worried about a slowdown in the progress in inflation towards the Fed’s target of 2%.
Broadly, the Silver price has performed strongly for more than a week as market sentiment remains cautious due to uncertainty over the likely global trade war. Investors remain cautious due to incoming protectionist policies from President-elect Donald Trump, which are expected to promote the business outlook of the US. Historically, Silver performs better in a heightened uncertain environment.
Ahead of the US NFP report, the US Dollar Index (DXY), which gauges Greenback’s value against six major currencies, flattens around 109.15. 10-year US Treasury yields rise to near 4.7%.
Silver technical analysis
Silver price continues to face selling pressure near the upward-sloping trendline around $30.50, which is plotted from the February 29 low of $22.30 on a daily timeframe. The white metal oscillates around the 20-day Exponential Moving Average (EMA), which trades near $30.00.
The 14-day Relative Strength Index (RSI) moves higher above 50.00. A fresh bullish momentum would come into action if it decisively breaks above 60.00.
Looking down, the September low of $27.75 would act as key support for the Silver price. On the upside, the December 12 high of $32.33 would be the barrier.
Silver daily chart
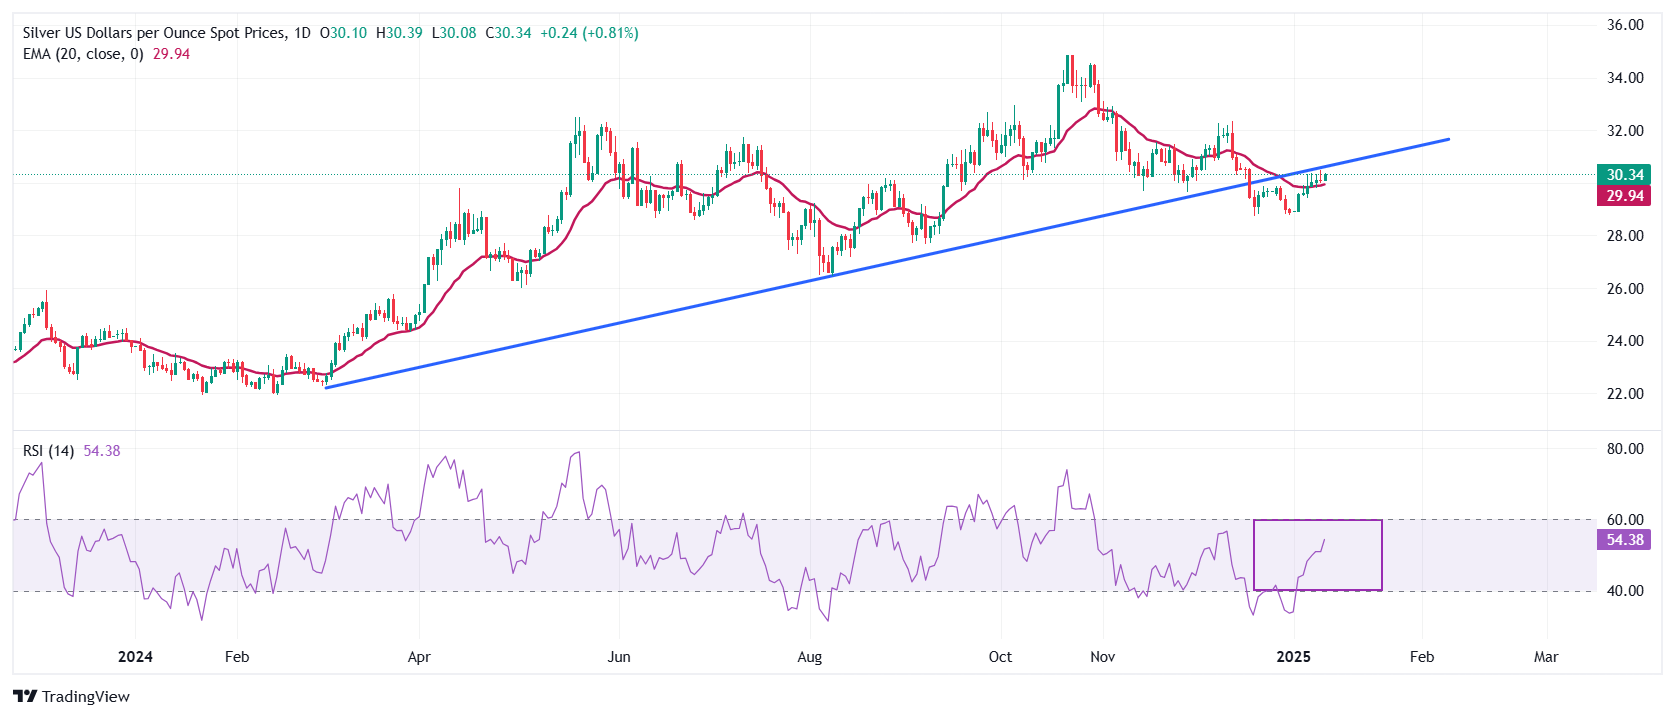
Silver FAQs
Silver is a precious metal highly traded among investors. It has been historically used as a store of value and a medium of exchange. Although less popular than Gold, traders may turn to Silver to diversify their investment portfolio, for its intrinsic value or as a potential hedge during high-inflation periods. Investors can buy physical Silver, in coins or in bars, or trade it through vehicles such as Exchange Traded Funds, which track its price on international markets.
Silver prices can move due to a wide range of factors. Geopolitical instability or fears of a deep recession can make Silver price escalate due to its safe-haven status, although to a lesser extent than Gold's. As a yieldless asset, Silver tends to rise with lower interest rates. Its moves also depend on how the US Dollar (USD) behaves as the asset is priced in dollars (XAG/USD). A strong Dollar tends to keep the price of Silver at bay, whereas a weaker Dollar is likely to propel prices up. Other factors such as investment demand, mining supply – Silver is much more abundant than Gold – and recycling rates can also affect prices.
Silver is widely used in industry, particularly in sectors such as electronics or solar energy, as it has one of the highest electric conductivity of all metals – more than Copper and Gold. A surge in demand can increase prices, while a decline tends to lower them. Dynamics in the US, Chinese and Indian economies can also contribute to price swings: for the US and particularly China, their big industrial sectors use Silver in various processes; in India, consumers’ demand for the precious metal for jewellery also plays a key role in setting prices.
Silver prices tend to follow Gold's moves. When Gold prices rise, Silver typically follows suit, as their status as safe-haven assets is similar. The Gold/Silver ratio, which shows the number of ounces of Silver needed to equal the value of one ounce of Gold, may help to determine the relative valuation between both metals. Some investors may consider a high ratio as an indicator that Silver is undervalued, or Gold is overvalued. On the contrary, a low ratio might suggest that Gold is undervalued relative to Silver.
-
11:20
GBP/USD: Risk remains on the downside – UOB Group
Instead of declining further, Pound Sterling (GBP) is more likely to trade in a 1.2240/1.2360 range. In the longer run, risk remains on the downside; oversold conditions could slow the pace of any further decline. The level to monitor is 1.2200, UOB Group’s FX analysts Quek Ser Leang and Lee Sue Ann note.
Oversold conditions can slow the pace of further decline
24-HOUR VIEW: “GBP plunged to a low of 1.2321 two days ago. Yesterday, we pointed out that ‘while the sharp and swift selloff seems overdone, the weakness in GBP has not stabilized.’ We expected GBP to decline, but we indicated that ‘the significant support level at 1.2300 could be out of reach.’ However, GBP easily broke below 1.2300 and plummeted to a low of 1.2239. GBP rebounded from the low to close at 1.2307 (-0.47%). Downward momentum has slowed somewhat with the rebound. This, combined with oversold conditions suggests that instead of declining further, GBP is more likely to trade in a 1.2240/1.2360 range.”
1-3 WEEKS VIEW: “Yesterday (09 Jan), when GBP was at 1.2360, we indicated that ‘the risk for GBP has shifted to the downside.’ However, we pointed out that ‘1.2300 is a significant support level.’ The anticipated support did not materialize, as GBP plunged below 1.2300, reaching a low of 1.2239. From here, the risk remains on the downside, even though deeply oversold short-term conditions could slow the pace of any further decline. The next level to monitor is 1.2200. On the upside, should GBP break above 1.2405 (‘strong resistance’ level was at 1.2465 yesterday), it would indicate that the downside risk has faded.”
-
11:12
EUR/USD trades cautiously as US NFP takes centre stage
- EUR/USD trades with caution around 1.0300 as investors await the US NFP data for December, which will influence the Fed interest rate outlook.
- US President-elect Donald Trump is expected to declare a national economic emergency.
- The Euro gains despite traders price in four interest rate cuts by the ECB this year.
EUR/USD trades subduedly around 1.0300 in Friday’s European session. The major currency pair trades with caution as investors await the United States (US) Nonfarm Payrolls (NFP) data for December, which will be published at 13:30 GMT. Investors will pay close attention to the US official employment report as it will influence market expectations about when the Federal Reserve (Fed) will deliver its first interest rate cut this year.
Economists expect that fresh 160K workers were added to the labor force in December, fewer than 227K in November. The Unemployment Rate is estimated to have remained steady at 4.2%. Month-on-month Average Hourly Earnings are expected to have risen at a slower pace of 0.3% from the former release of 0.4%, with annual figures growing steadily by 4%.
Signs of cooling labor market conditions would force traders to pare bets supporting the Fed to keep interest rates unchanged in the March meeting at their current range of 4.25%-4.50%. Meanwhile, traders are confident that the central bank will maintain the status quo later this month, according to the CME FedWatch tool.
Ahead of the US NFP data, the US Dollar Index (DXY), which tracks the Greenback’s value against six major currencies, is flattened above 109.00. The performance of the US Dollar (USD) has remained firm as President-elect Donald Trump is expected to declare a national economic emergency to provide legal justification for preparing an import tariff plan for the nation’s allies and adversaries, CNN reported.
Daily digest market movers: EUR/USD trades flat ahead of US labor market data
- EUR/USD is expected to be purely driven by the US Dollar on Friday as the US NFP data is on the horizon. Meanwhile, the Euro (EUR) is outperforming against a majority of its peers, except the Japanese Yen (JPY). The Euro rises even though traders have priced in four interest rate cuts by the European Central Bank (ECB), which will come in every meeting by summer.
- ECB policymakers are comfortable with firm dovish bets as inflationary pressures in the Eurozone are broadly under control. However, price pressures rose expectedly in December. On Wednesday, ECB policymaker and Governor of the Bank of France François Villeroy said that price pressures were expected to tick higher in December, however, interest rates will continue heading towards the neutral rate “without a slowdown in the pace by summer” if the upcoming data confirm that the “pullback in price pressures won’t continue”.
- Meanwhile, a weak Eurozone economic outlook has also boosted bets supporting more interest rate cuts. Investors expect the old continent to face a trade war with the US as incoming policies from President-elect Donald Trump will be highly protectionist and weigh on the Eurozone’s export sector.
Technical Analysis: EUR/USD holds 1.0200
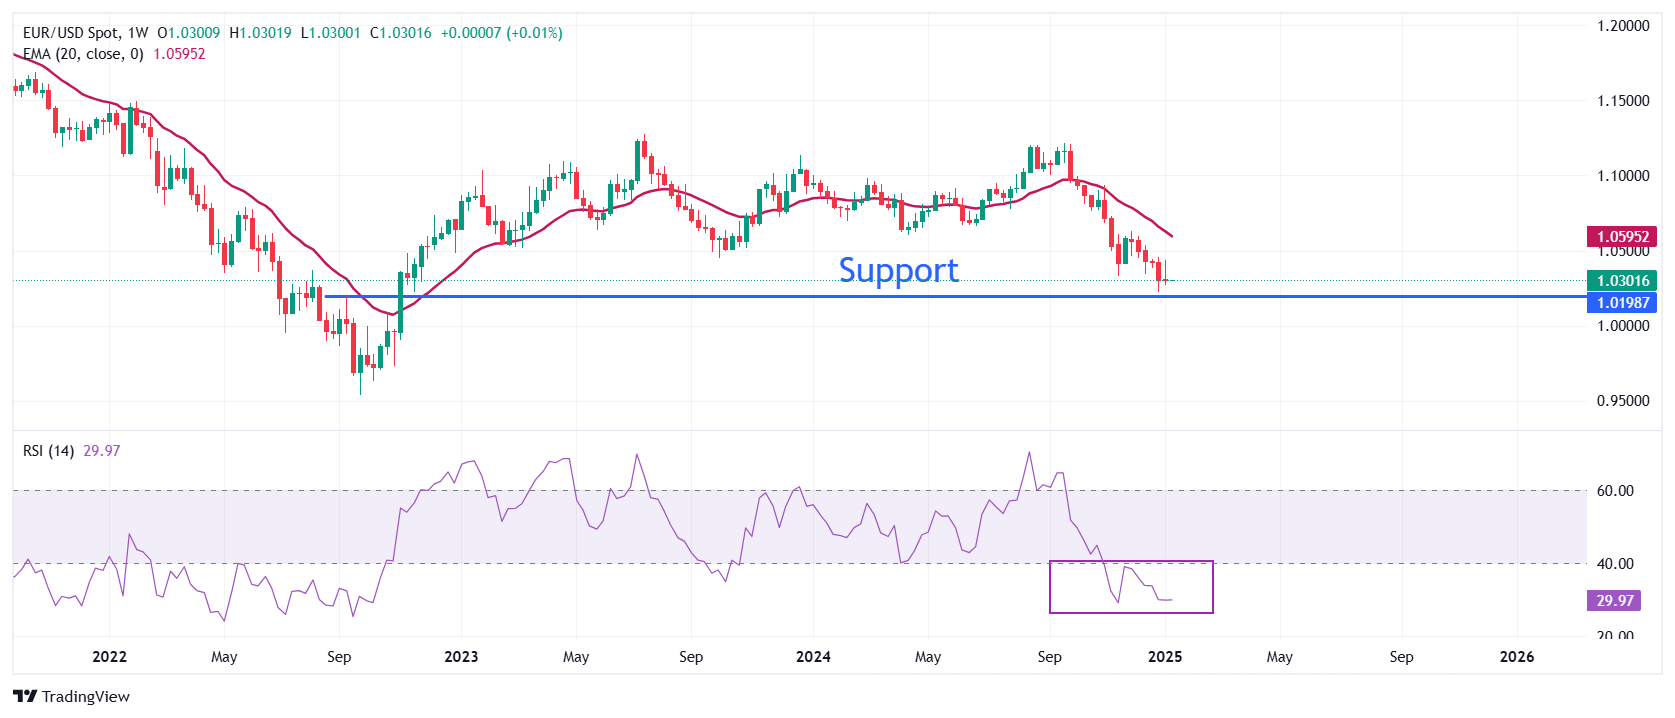
EUR/USD trades near the key support plotted from the September 2022 high of 1.0200 on the weekly chart. The outlook of the major currency pair is broadly bearish as the 20-week Exponential Moving Average (EMA) at 1.0595 is declining.
The 14-week Relative Strength Index (RSI) slides to near 30.00, indicating a strong downside momentum. However, a slight recovery cannot be ruled out as the momentum oscillator has turned oversold.
Looking down, the pair could find support near the round level of 1.0100. Conversely, the January 6 high of 1.0437 will be the key barrier fora the Euro bulls.
Euro FAQs
The Euro is the currency for the 19 European Union countries that belong to the Eurozone. It is the second most heavily traded currency in the world behind the US Dollar. In 2022, it accounted for 31% of all foreign exchange transactions, with an average daily turnover of over $2.2 trillion a day. EUR/USD is the most heavily traded currency pair in the world, accounting for an estimated 30% off all transactions, followed by EUR/JPY (4%), EUR/GBP (3%) and EUR/AUD (2%).
The European Central Bank (ECB) in Frankfurt, Germany, is the reserve bank for the Eurozone. The ECB sets interest rates and manages monetary policy. The ECB’s primary mandate is to maintain price stability, which means either controlling inflation or stimulating growth. Its primary tool is the raising or lowering of interest rates. Relatively high interest rates – or the expectation of higher rates – will usually benefit the Euro and vice versa. The ECB Governing Council makes monetary policy decisions at meetings held eight times a year. Decisions are made by heads of the Eurozone national banks and six permanent members, including the President of the ECB, Christine Lagarde.
Eurozone inflation data, measured by the Harmonized Index of Consumer Prices (HICP), is an important econometric for the Euro. If inflation rises more than expected, especially if above the ECB’s 2% target, it obliges the ECB to raise interest rates to bring it back under control. Relatively high interest rates compared to its counterparts will usually benefit the Euro, as it makes the region more attractive as a place for global investors to park their money.
Data releases gauge the health of the economy and can impact on the Euro. Indicators such as GDP, Manufacturing and Services PMIs, employment, and consumer sentiment surveys can all influence the direction of the single currency. A strong economy is good for the Euro. Not only does it attract more foreign investment but it may encourage the ECB to put up interest rates, which will directly strengthen the Euro. Otherwise, if economic data is weak, the Euro is likely to fall. Economic data for the four largest economies in the euro area (Germany, France, Italy and Spain) are especially significant, as they account for 75% of the Eurozone’s economy.
Another significant data release for the Euro is the Trade Balance. This indicator measures the difference between what a country earns from its exports and what it spends on imports over a given period. If a country produces highly sought after exports then its currency will gain in value purely from the extra demand created from foreign buyers seeking to purchase these goods. Therefore, a positive net Trade Balance strengthens a currency and vice versa for a negative balance.
-
11:08
EUR/USD: Unlikely to reach the major support at 1.0255 – UOB Group
Euro (EUR) could edge lower; any decline is unlikely to reach the major support at 1.0255. In the longer run, EUR has to break clearly below 1.0255 before further losses can be expected, UOB Group’s FX analyst Quek Ser Leang and Lee Sue Ann note.
Below 1.0255 further losses can be expected
24-HOUR VIEW: “Following EUR sharp decline to a low of 1.0273 on Wednesday, we indicated yesterday (Thursday) that ‘the brief decline did not result in a significant increase in downward momentum.’ We added, ‘instead of declining further today, EUR is more likely to trade in a 1.0275/1.0355 range.’ EUR subsequently traded in a narrower range than expected (1.0282/1.0321), closing at 1.0298 (-0.19%). Despite the relatively quiet price action, downward momentum has increased slightly. Today, EUR could edge lower, but any decline is unlikely to reach the major support at 1.0255 (there is another support at 1.0275). On the upside, resistance levels are at 1.0320 and 1.0355.”
1-3 WEEKS VIEW: “Not much has changed since our update yesterday (09 Jan, spot at 1.0315). As highlighted, there has been a tentative buildup in downward momentum. However, EUR ‘has to break clearly below 1.0255 before further losses can be expected.’ The likelihood of EUR breaking clearly below will increase, provided that the ‘strong resistance’ level, currently at 1.0400 (no change from yesterday), is not breached.”
-
10:59
Greece Industrial Production (YoY) up to 4.9% in November from previous -2.9%
-
10:41
BoJ is said to still be mulling the rate decision for January – Bloomberg
Citing people familiar with the Bank of Japan’s (BoJ) thinking, Bloomberg reported on Friday that the Japanese central bank is still considering the interest rate decision for its January monetary policy review.
Additional takeaways
Officials still carefully assessing data ahead of the January meeting.
BoJ to mull upgrading core-core inflation views for FY 2024 and FY 2025.
BoJ is said to weigh raising the inflation forecast on depreciating Yen.
Market reaction
The Japanese Yen picked up bids on the above headlines, driving USD/JPY 0.15% lower on the day at 157.85 at press time.
-
10:18
Silver price today: Silver rises, according to FXStreet data
Silver prices (XAG/USD) rose on Friday, according to FXStreet data. Silver trades at $30.29 per troy ounce, up 0.63% from the $30.10 it cost on Thursday.
Silver prices have increased by 4.83% since the beginning of the year.
Unit measure Silver Price Today in USD Troy Ounce 30.29 1 Gram 0.97
The Gold/Silver ratio, which shows the number of ounces of Silver needed to equal the value of one ounce of Gold, stood at 88.48 on Friday, down from 88.69 on Thursday.
Silver FAQs
Silver is a precious metal highly traded among investors. It has been historically used as a store of value and a medium of exchange. Although less popular than Gold, traders may turn to Silver to diversify their investment portfolio, for its intrinsic value or as a potential hedge during high-inflation periods. Investors can buy physical Silver, in coins or in bars, or trade it through vehicles such as Exchange Traded Funds, which track its price on international markets.
Silver prices can move due to a wide range of factors. Geopolitical instability or fears of a deep recession can make Silver price escalate due to its safe-haven status, although to a lesser extent than Gold's. As a yieldless asset, Silver tends to rise with lower interest rates. Its moves also depend on how the US Dollar (USD) behaves as the asset is priced in dollars (XAG/USD). A strong Dollar tends to keep the price of Silver at bay, whereas a weaker Dollar is likely to propel prices up. Other factors such as investment demand, mining supply – Silver is much more abundant than Gold – and recycling rates can also affect prices.
Silver is widely used in industry, particularly in sectors such as electronics or solar energy, as it has one of the highest electric conductivity of all metals – more than Copper and Gold. A surge in demand can increase prices, while a decline tends to lower them. Dynamics in the US, Chinese and Indian economies can also contribute to price swings: for the US and particularly China, their big industrial sectors use Silver in various processes; in India, consumers’ demand for the precious metal for jewellery also plays a key role in setting prices.
Silver prices tend to follow Gold's moves. When Gold prices rise, Silver typically follows suit, as their status as safe-haven assets is similar. The Gold/Silver ratio, which shows the number of ounces of Silver needed to equal the value of one ounce of Gold, may help to determine the relative valuation between both metals. Some investors may consider a high ratio as an indicator that Silver is undervalued, or Gold is overvalued. On the contrary, a low ratio might suggest that Gold is undervalued relative to Silver.
(An automation tool was used in creating this post.)
-
10:01
US Dollar Index Price Forecast: Sits near two-year peak, above 109.00 ahead of US NFP
- DXY consolidates its recent move up back closer to a two-year peak amid the Fed’s hawkish shift.
- Geopolitical risks and trade war fears further underpin demand for the safe-haven Greenback.
- The USD bulls turn cautious and wait for the release of the US NFP report before placing fresh bets.
The US Dollar Index (DXY), which tracks the Greenback against a basket of currencies, stands firm above the 109.00 mark, or its highest level since November 2022 as traders await the US Nonfarm Payrolls (NFP) report before placing fresh bets.
In the meantime, the prospects for slower rate cuts by the Federal Reserve (Fed), which has been a key factor behind the recent surge in the US Treasury bond yields, continue to act as a tailwind for the buck. Apart from this, concerns about US President-elect Donald Trump's tariff plans, geopolitical risks and a weaker risk tone turn out to be other factors underpinning the safe-haven Greenback.
From a technical perspective, this week's goodish rebound from the 107.55-107.50 resistance-turned-support and the subsequent move up favors bullish traders. Moreover, oscillators on the daily chart are holding in positive territory and are still away from being in the overbought zone. This suggests that the path of least resistance for the index is to the upside and supports prospects for further gains.
That said, it will still be prudent to wait for a move beyond the 109.55 area, or over a two-year peak touched earlier this month, before placing fresh bullish bets. The USD might then accelerate the move-up towards the 110.00 psychological mark. The momentum could extend further towards the 110.50-110.55 region en route to the 111.00 mark and the November 2022 peak, around the 111.15 zone.
On the flip side, the 108.75 region could offer some support, below which the index could accelerate the fall towards the 108.15 area en route to the 108.00 mark and the 107.55 horizontal zone. Some follow-through selling below the latter should pave the way for a deeper corrective decline and drag the USD below the 107.00 round figure, towards testing the next relevant support near mid-106.00s.
DXY daily chart
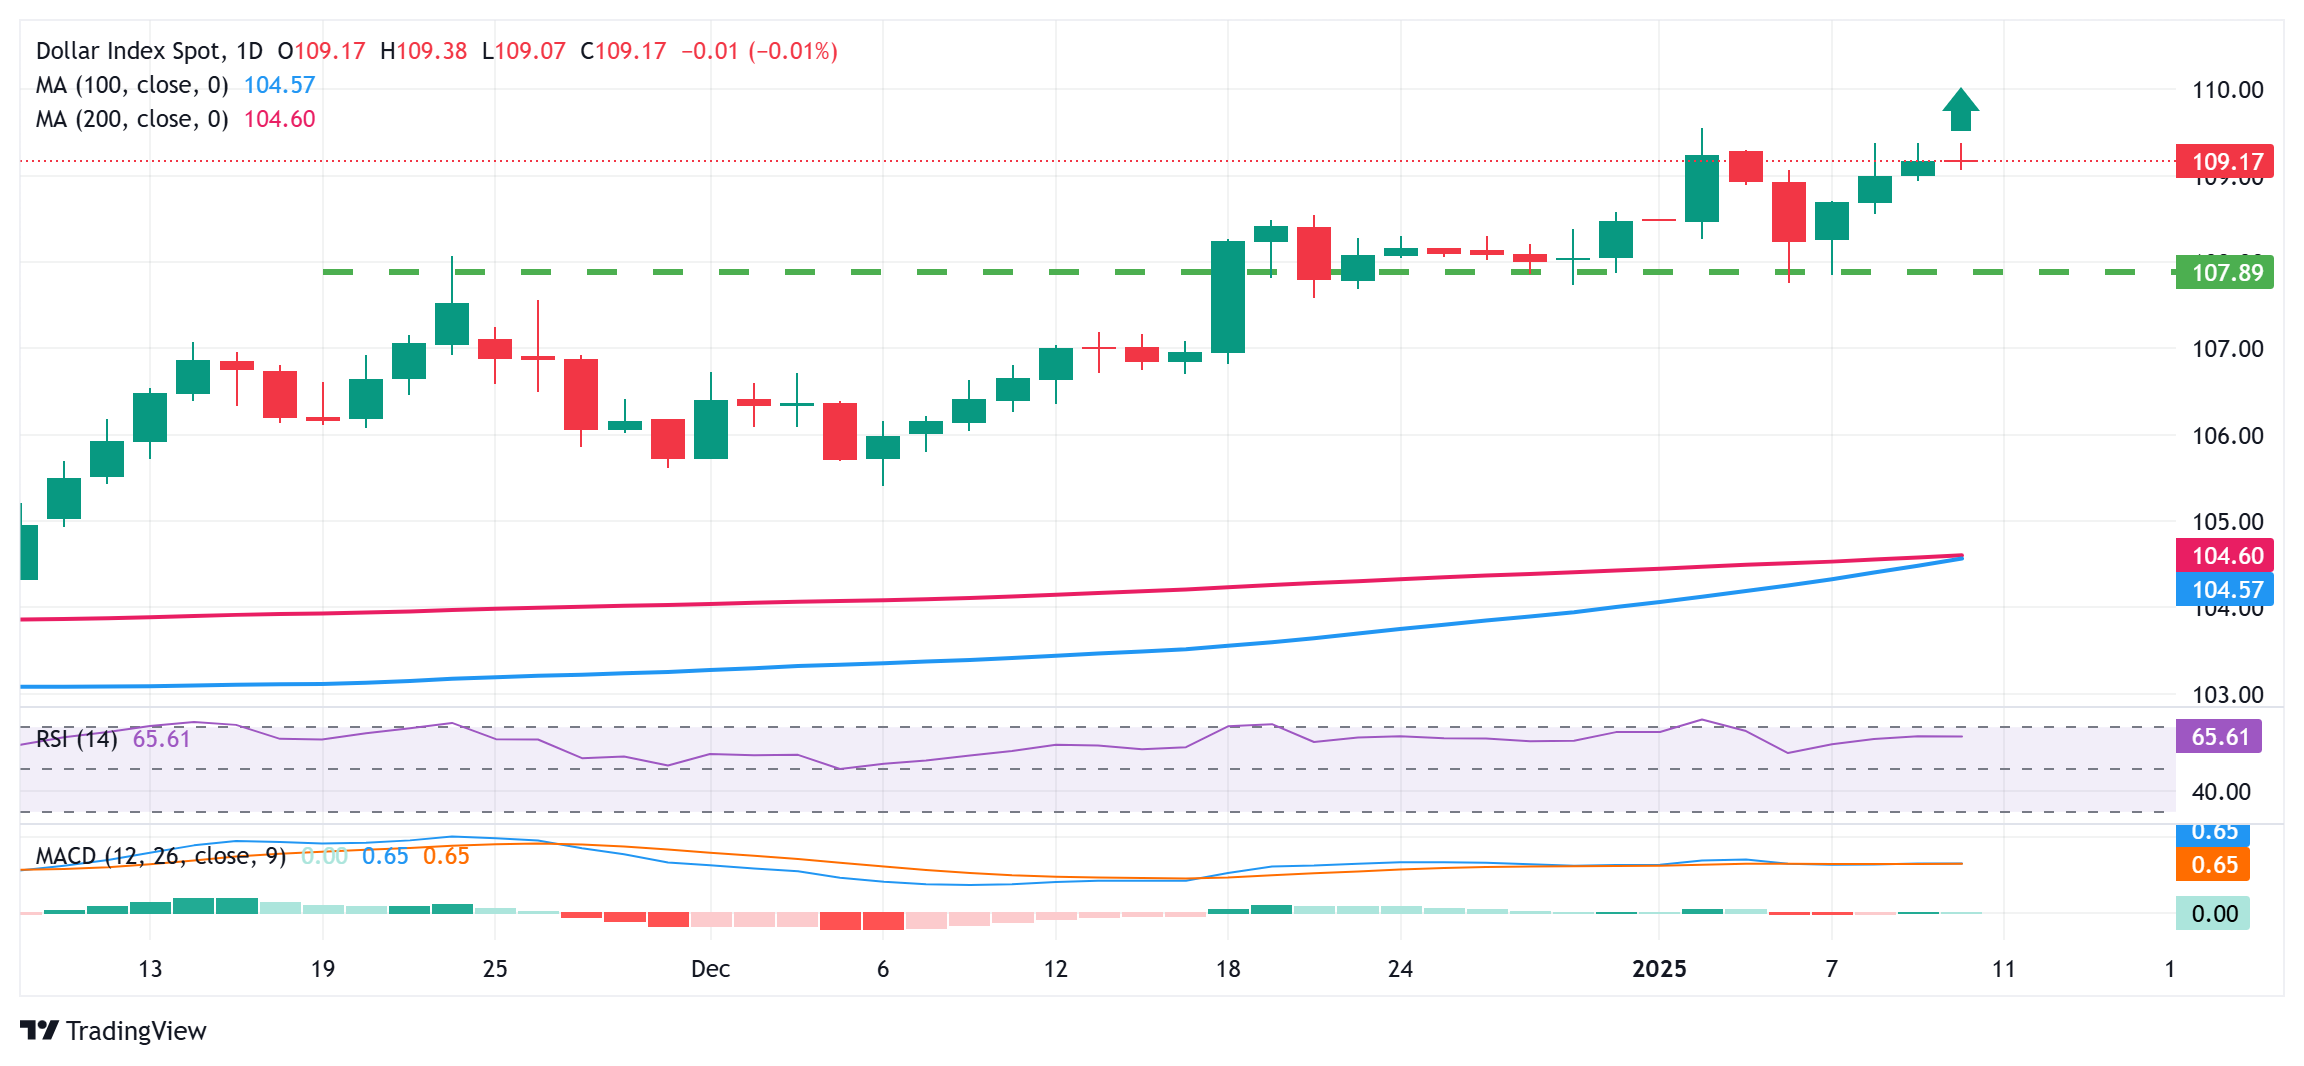
US Dollar FAQs
The US Dollar (USD) is the official currency of the United States of America, and the ‘de facto’ currency of a significant number of other countries where it is found in circulation alongside local notes. It is the most heavily traded currency in the world, accounting for over 88% of all global foreign exchange turnover, or an average of $6.6 trillion in transactions per day, according to data from 2022. Following the second world war, the USD took over from the British Pound as the world’s reserve currency. For most of its history, the US Dollar was backed by Gold, until the Bretton Woods Agreement in 1971 when the Gold Standard went away.
The most important single factor impacting on the value of the US Dollar is monetary policy, which is shaped by the Federal Reserve (Fed). The Fed has two mandates: to achieve price stability (control inflation) and foster full employment. Its primary tool to achieve these two goals is by adjusting interest rates. When prices are rising too quickly and inflation is above the Fed’s 2% target, the Fed will raise rates, which helps the USD value. When inflation falls below 2% or the Unemployment Rate is too high, the Fed may lower interest rates, which weighs on the Greenback.
In extreme situations, the Federal Reserve can also print more Dollars and enact quantitative easing (QE). QE is the process by which the Fed substantially increases the flow of credit in a stuck financial system. It is a non-standard policy measure used when credit has dried up because banks will not lend to each other (out of the fear of counterparty default). It is a last resort when simply lowering interest rates is unlikely to achieve the necessary result. It was the Fed’s weapon of choice to combat the credit crunch that occurred during the Great Financial Crisis in 2008. It involves the Fed printing more Dollars and using them to buy US government bonds predominantly from financial institutions. QE usually leads to a weaker US Dollar.
Quantitative tightening (QT) is the reverse process whereby the Federal Reserve stops buying bonds from financial institutions and does not reinvest the principal from the bonds it holds maturing in new purchases. It is usually positive for the US Dollar.
-
10:01
Italy Retail Sales n.s.a (YoY) dipped from previous 2.6% to 1.1% in November
-
10:01
Italy Retail Sales s.a. (MoM) below forecasts (0.2%) in November: Actual (-0.4%)
-
09:22
AUD/USD remains depressed below 0.6200, lowest since October 2022 ahead of US NFP
- AUD/USD struggles to register any meaningful recovery and hangs near multi-year trough.
- The Fed’s hawkish shift keeps the US bond yields elevated and lends support to the USD.
- US-China trade war fears and bets for an early RBA rate cut further weigh on the Aussie.
- Bearish traders opt to move to the sidelines ahead of the release of the US NFP report.
The AUD/USD pair extends its sideways consolidative price move through the first half of the European session on Friday and remains close to its lowest level since October 2022 touched the previous day. Spot prices currently trade just below the 0.6200 mark and seem vulnerable to prolonging a well-established downtrend witnessed over the past three months or so amid a bullish US Dollar (USD).
The USD Index (DXY), which tracks the Greenback against a basket of currencies, stands firm near a two-year peak in the wake of the Federal Reserve's (Fed) hawkish shift. In fact, the US central bank projected only two quarter-point rate cuts in 2025 amid still elevated inflation in the world's largest economy. Adding to this, the Minutes of the December FOMC meeting revealed that policymakers viewed labor market conditions as gradually easing and were in favor of slowing the pace of rate cuts on the back of stalling progress on inflation.
The outlook remains supportive of elevated US Treasury bond yields, which, along with geopolitical risks and concerns about US President-elect Donald Trump's tariff plans, drive some haven flows towards the buck. The Australian Dollar (AUD), on the other hand, is undermined by rising bets for an interest rate cut by the Reserve Bank of Australia (RBA) as early as next month, bolstered by a drop in Australia's core inflation. Apart from this, China's economic woes suggest that the path of least resistance for the Aussie is to the downside.
Traders, however, seem reluctant to place aggressive bets and opt to wait on the sidelines ahead of the release of the crucial US Nonfarm Payrolls (NFP) report later during the North American session. Furthermore, the Relative Strength Index (RSI) on the daily chart has moved on the verge of breaking into oversold territory and holding back bears from placing fresh bets around the AUD/USD pair. Nevertheless, the fundamental backdrop suggests that any attempted recovery might still be seen as a selling opportunity and remain capped.
Australian Dollar FAQs
One of the most significant factors for the Australian Dollar (AUD) is the level of interest rates set by the Reserve Bank of Australia (RBA). Because Australia is a resource-rich country another key driver is the price of its biggest export, Iron Ore. The health of the Chinese economy, its largest trading partner, is a factor, as well as inflation in Australia, its growth rate and Trade Balance. Market sentiment – whether investors are taking on more risky assets (risk-on) or seeking safe-havens (risk-off) – is also a factor, with risk-on positive for AUD.
The Reserve Bank of Australia (RBA) influences the Australian Dollar (AUD) by setting the level of interest rates that Australian banks can lend to each other. This influences the level of interest rates in the economy as a whole. The main goal of the RBA is to maintain a stable inflation rate of 2-3% by adjusting interest rates up or down. Relatively high interest rates compared to other major central banks support the AUD, and the opposite for relatively low. The RBA can also use quantitative easing and tightening to influence credit conditions, with the former AUD-negative and the latter AUD-positive.
China is Australia’s largest trading partner so the health of the Chinese economy is a major influence on the value of the Australian Dollar (AUD). When the Chinese economy is doing well it purchases more raw materials, goods and services from Australia, lifting demand for the AUD, and pushing up its value. The opposite is the case when the Chinese economy is not growing as fast as expected. Positive or negative surprises in Chinese growth data, therefore, often have a direct impact on the Australian Dollar and its pairs.
Iron Ore is Australia’s largest export, accounting for $118 billion a year according to data from 2021, with China as its primary destination. The price of Iron Ore, therefore, can be a driver of the Australian Dollar. Generally, if the price of Iron Ore rises, AUD also goes up, as aggregate demand for the currency increases. The opposite is the case if the price of Iron Ore falls. Higher Iron Ore prices also tend to result in a greater likelihood of a positive Trade Balance for Australia, which is also positive of the AUD.
The Trade Balance, which is the difference between what a country earns from its exports versus what it pays for its imports, is another factor that can influence the value of the Australian Dollar. If Australia produces highly sought after exports, then its currency will gain in value purely from the surplus demand created from foreign buyers seeking to purchase its exports versus what it spends to purchase imports. Therefore, a positive net Trade Balance strengthens the AUD, with the opposite effect if the Trade Balance is negative.
-
09:06
Pound Sterling continues to decline due to ramping UK gilt yields
- The Pound Sterling remains under pressure as investors expect higher UK gilt yields could force Chancellor Reeves to cut spending and raise taxes in the Autumn Budget.
- BoE’s Breeden said recent evidence supports a gradual withdrawal of policy restrictiveness.
- The next move in the US Dollar will be influenced by the US NFP data for December.
The Pound Sterling (GBP) continues underperforming its major peers, rattled by rising borrowing costs on the United Kingdom (UK) government’s debt. The 30-year UK gilt yields have risen to 5.36%, the highest level since 1998, causing discomfort for Chancellor of the Exchequer Rachel Reeves.
Market participants started dumping UK gilt securities amid fears of higher debt, lower growth, and potentially inflationary United States (US) President-elect Donald Trump policies, which could lead to economic stagflation. Investors anticipated that higher gilt yields would force Rachel Reeves to make fresh borrowings to fund day-to-day expenditures. Earlier, Reeves vowed to fund daily spending with tax receipts and cut public spending.
The British Finance Ministry remained committed to not seeking fresh borrowings. UK Treasury Minister Darren Jones clarified at the House of Commons on Thursday that the government's decision to borrow only for investment was "non-negotiable." Jones added that it is normal for the price of gilts to "vary" and assured that financial markets continue to function in an "orderly way."
Darren Jones also confirmed that public spending will be “in line with what was set out in the Autumn Budget” and added that there is no need for any “emergency intervention” by the Chancellor.
On the sharp spike in UK gilt yields, BoE Deputy Governor Sarah Breeden said that the rise in government’s borrowing costs is partly linked to uncertainty over “incoming policies from United States (US) President-elect Donald Trump” in her speech at the University of Edinburgh. When asked about her view on the monetary policy outlook, Breeden said: "The recent evidence further supports the case to withdraw “policy restrictiveness.” She added that the withdrawal of policy restrictiveness will be “gradual” over time.
Daily digest market movers: Pound Sterling weakens against US Dollar ahead of US NFP
- The Pound Sterling drops to near 1.2275 against the US Dollar (USD) in Friday’s London session. The GBP/USD pair faces pressure as the US Dollar extends its upside ahead of the US Nonfarm Payrolls (NFP) data for December, which will be published at 13:30 GMT. Investors will pay close attention to the US NFP report as the Federal Reserve (Fed) pivoted to a dovish policy stance in September 2024 due to firm downside risks to labor demand.
- The outcome of the Fed’s December monetary policy meeting showed that officials were less concerned about labor market conditions and more worried about stalling progress in the disinflation trend. However, signs of weak labor demand could stem fears that job market conditions have yet to return to their restoration state, which could force officials to dial back their cautious stance on further policy easing.
- The US NFP report is expected to show that the economy added 160K fresh workers in December, lower than the previous release of 227K. The Unemployment Rate is expected to have remained steady at 4.2%. Investors will also focus on Average Hourly Earnings data, a key measure of wage growth that drives consumer spending. Signs of strong wage growth would prompt fears of a re-acceleration in price pressures. On the contrary, soft numbers will ease fears of inflationary pressures remaining persistent.
- Economists expect Average Hourly Earnings to have grown at a steady pace of 4% year-over-year. On a month-on-month basis, the wage growth measure is estimated to have risen by 0.3%, slower than the 0.4% in November.
- According to the CME FedWatch tool, traders are confident that the Fed will not cut interest rates till the March meeting but are divided over the policy announcement in May.
Technical Analysis: Pound Sterling is exposed to more downside
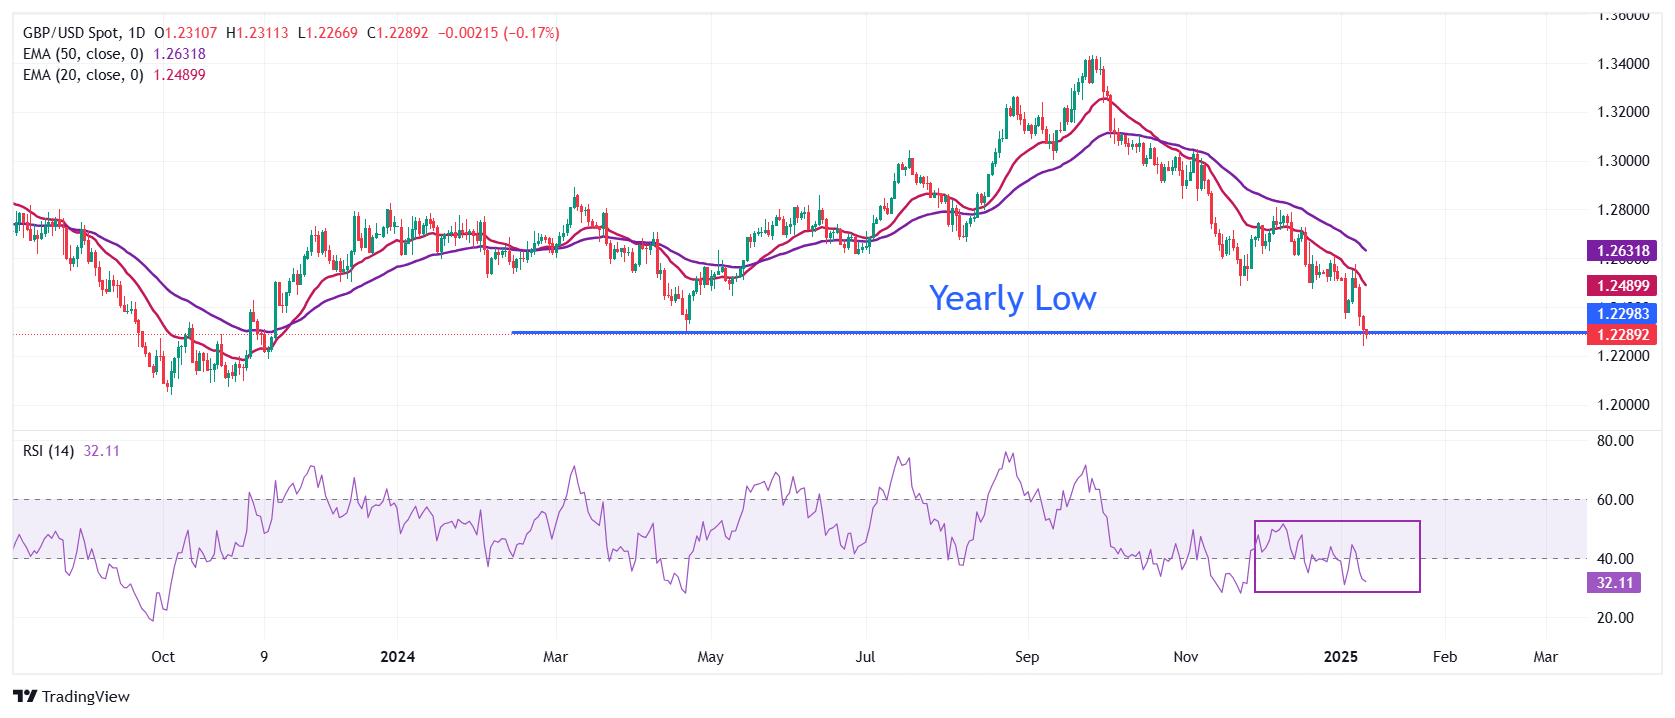
The Pound Sterling trades near a more-than-a-year-low around 1.2250 against the US Dollar (USD) on Friday. The GBP/USD pair faced a sharp sell-off after breaking below the January 2 low of 1.2350. The broader outlook for the Cable remains bearish as the 20-day and 50-day Exponential Moving Averages (EMAs) near 1.2490 and 1.2630, respectively, are declining.
The 14-day Relative Strength Index (RSI) drops sharply to near 30.00, suggesting a strong bearish momentum.
Looking down, the pair is expected to find support near the November 10, 2023, low of 1.2185. On the upside, the 20-day EMA will act as key resistance.
Pound Sterling FAQs
The Pound Sterling (GBP) is the oldest currency in the world (886 AD) and the official currency of the United Kingdom. It is the fourth most traded unit for foreign exchange (FX) in the world, accounting for 12% of all transactions, averaging $630 billion a day, according to 2022 data. Its key trading pairs are GBP/USD, also known as ‘Cable’, which accounts for 11% of FX, GBP/JPY, or the ‘Dragon’ as it is known by traders (3%), and EUR/GBP (2%). The Pound Sterling is issued by the Bank of England (BoE).
The single most important factor influencing the value of the Pound Sterling is monetary policy decided by the Bank of England. The BoE bases its decisions on whether it has achieved its primary goal of “price stability” – a steady inflation rate of around 2%. Its primary tool for achieving this is the adjustment of interest rates. When inflation is too high, the BoE will try to rein it in by raising interest rates, making it more expensive for people and businesses to access credit. This is generally positive for GBP, as higher interest rates make the UK a more attractive place for global investors to park their money. When inflation falls too low it is a sign economic growth is slowing. In this scenario, the BoE will consider lowering interest rates to cheapen credit so businesses will borrow more to invest in growth-generating projects.
Data releases gauge the health of the economy and can impact the value of the Pound Sterling. Indicators such as GDP, Manufacturing and Services PMIs, and employment can all influence the direction of the GBP. A strong economy is good for Sterling. Not only does it attract more foreign investment but it may encourage the BoE to put up interest rates, which will directly strengthen GBP. Otherwise, if economic data is weak, the Pound Sterling is likely to fall.
Another significant data release for the Pound Sterling is the Trade Balance. This indicator measures the difference between what a country earns from its exports and what it spends on imports over a given period. If a country produces highly sought-after exports, its currency will benefit purely from the extra demand created from foreign buyers seeking to purchase these goods. Therefore, a positive net Trade Balance strengthens a currency and vice versa for a negative balance.
-
09:01
Austria Industrial Production (YoY): -2.7% (November) vs previous -1.3%
-
09:00
Spain Industrial Output Cal Adjusted (YoY) fell from previous 1.9% to -0.4% in November
-
08:52
WTI rises to near $74.00 due to increased likelihood of higher heating fuel demand
- WTI price appreciates on expectations of increased heating fuel demand driven by prolonged cold weather across the Northern Hemisphere.
- JP Morgan attributes the increase in Oil prices to growing concerns over supply disruptions driven by multiple factors.
- Oil prices rise amid rising concerns over supply disruptions, driven by Biden’s plan to announce sanctions targeting Russia's Oil revenues.
West Texas Intermediate (WTI) Oil price extends gains for the second successive session, trading around $73.90 per barrel during the European hours on Friday. Crude Oil prices are bolstered by expectations of higher heating fuel demand due to extended cold weather across the Northern Hemisphere.
The United States (US) Weather Bureau predicts below-average temperatures in central and eastern regions of the country. Similarly, much of Europe has been gripped by severe cold and is likely to face an unusually chilly start to the year.
According to Reuters, analysts at JP Morgan credit the Oil prices increase to mounting concerns over supply disruptions caused by tighter sanctions, combined with low oil inventories and freezing conditions across parts of the US and Europe.
Oil prices also climb due to heightened concerns over supply disruptions fueled by ongoing geopolitical tensions. US President Joe Biden is expected to announce new sanctions this week targeting Russia's Oil revenues, aiming to strengthen Ukraine's resistance against Moscow ahead of President-elect Donald Trump taking office on January 20.
On Friday, ING analysts mentioned in a note "Uncertainty surrounding how aggressive Trump will be toward Iran is offering additional support to crude oil prices,". They also highlighted that Asian buyers are already seeking alternative grades from the Middle East, as broader sanctions on Russia and Iran complicate Oil trade flows.
WTI Oil FAQs
WTI Oil is a type of Crude Oil sold on international markets. The WTI stands for West Texas Intermediate, one of three major types including Brent and Dubai Crude. WTI is also referred to as “light” and “sweet” because of its relatively low gravity and sulfur content respectively. It is considered a high quality Oil that is easily refined. It is sourced in the United States and distributed via the Cushing hub, which is considered “The Pipeline Crossroads of the World”. It is a benchmark for the Oil market and WTI price is frequently quoted in the media.
Like all assets, supply and demand are the key drivers of WTI Oil price. As such, global growth can be a driver of increased demand and vice versa for weak global growth. Political instability, wars, and sanctions can disrupt supply and impact prices. The decisions of OPEC, a group of major Oil-producing countries, is another key driver of price. The value of the US Dollar influences the price of WTI Crude Oil, since Oil is predominantly traded in US Dollars, thus a weaker US Dollar can make Oil more affordable and vice versa.
The weekly Oil inventory reports published by the American Petroleum Institute (API) and the Energy Information Agency (EIA) impact the price of WTI Oil. Changes in inventories reflect fluctuating supply and demand. If the data shows a drop in inventories it can indicate increased demand, pushing up Oil price. Higher inventories can reflect increased supply, pushing down prices. API’s report is published every Tuesday and EIA’s the day after. Their results are usually similar, falling within 1% of each other 75% of the time. The EIA data is considered more reliable, since it is a government agency.
OPEC (Organization of the Petroleum Exporting Countries) is a group of 12 Oil-producing nations who collectively decide production quotas for member countries at twice-yearly meetings. Their decisions often impact WTI Oil prices. When OPEC decides to lower quotas, it can tighten supply, pushing up Oil prices. When OPEC increases production, it has the opposite effect. OPEC+ refers to an expanded group that includes ten extra non-OPEC members, the most notable of which is Russia.
-
08:47
China’s Vice Finance Minister: Expect more proactive fiscal policy this year
Liao Min, China’s Vice Finance Minister, said on Friday that “we can expect more proactive fiscal policy in 2025, in terms of strength, efficiency and timing.”
Additional comments
To speed up fiscal spending in a bid to formulate actual spending.
China's fiscal policy has abundant policy room and tools.
China has relatively big room of raising debt and deficit.
We will step up the coordinated efforts between fiscal policy and monetary policy in 2025.
-
08:45
France Consumer Spending (MoM) registered at 0.3% above expectations (0.2%) in November
-
08:45
France Industrial Output (MoM) came in at 0.2%, above expectations (0%) in November
-
08:15
Forex Today: US Dollar holds near multi-year highs ahead of key jobs report
Here is what you need to know on Friday, January 10:
Following Thursday's quiet action in financial markets, the US Dollar (USD) stays resilient against its major rivals in the European morning on Friday. In the early American session, the US Bureau of Labor Statistics will release the jobs report for December, which will feature Nonfarm Payrolls (NFP), Unemployment Rate and wage inflation figures.
US Dollar PRICE This week
The table below shows the percentage change of US Dollar (USD) against listed major currencies this week. US Dollar was the strongest against the British Pound.
USD EUR GBP JPY CAD AUD NZD CHF USD 0.20% 1.10% 0.71% -0.27% 0.36% 0.47% 0.30% EUR -0.20% 0.89% 0.49% -0.42% 0.20% 0.31% 0.14% GBP -1.10% -0.89% -0.39% -1.30% -0.69% -0.58% -0.75% JPY -0.71% -0.49% 0.39% -0.98% -0.33% -0.21% -0.19% CAD 0.27% 0.42% 1.30% 0.98% 0.56% 0.70% 0.56% AUD -0.36% -0.20% 0.69% 0.33% -0.56% 0.11% -0.06% NZD -0.47% -0.31% 0.58% 0.21% -0.70% -0.11% -0.17% CHF -0.30% -0.14% 0.75% 0.19% -0.56% 0.06% 0.17% The heat map shows percentage changes of major currencies against each other. The base currency is picked from the left column, while the quote currency is picked from the top row. For example, if you pick the US Dollar from the left column and move along the horizontal line to the Japanese Yen, the percentage change displayed in the box will represent USD (base)/JPY (quote).
After closing in positive territory on Tuesday and Wednesday, the USD Index registered small gains on Thursday as trading conditions remained thin, with US stock markets closing in observance of a national day of mourning to honor the death of former President Jimmy Carter. Early Friday, the index stays in positive territory and remains within a touching distance of the 25-month high it touched at 109.53 on January 2nd. Markets expect NFP to rise by 160,000 in December following the 227,000 increase recorded in November. The Unemployment Rate is forecast to remain unchanged at 4.2%.
USD/CAD closed marginally higher on Thursday and was last seen trading above 1.4400. Statistics Canada will also release employment data for December on Friday.
EUR/USD failed to stage a rebound on Thursday but its losses were limited. Early Friday, the pair stays under modest bearish pressure and trades below 1.0300.
GBP/USD dropped to its weakest level since November 2023 below 1.2250 on Thursday as the selloff in UK gilts continued. With gilt yields correcting lower, the pair managed to erase a portion of its daily losses in the second half of the day. In the European morning on Friday, GBP/USD stays on the back foot and trades in the red below 1.2300.
USD/JPY closed marginally lower on Thursday. The pair stays relatively quiet on Friday and fluctuates in a narrow channel above 158.00.
Gold closed the third consecutive trading day in positive territory on Thursday. XAU/USD continues to edge higher in the European morning and trades at its strongest level in nearly a month above $2,670.
Nonfarm Payrolls FAQs
Nonfarm Payrolls (NFP) are part of the US Bureau of Labor Statistics monthly jobs report. The Nonfarm Payrolls component specifically measures the change in the number of people employed in the US during the previous month, excluding the farming industry.
The Nonfarm Payrolls figure can influence the decisions of the Federal Reserve by providing a measure of how successfully the Fed is meeting its mandate of fostering full employment and 2% inflation. A relatively high NFP figure means more people are in employment, earning more money and therefore probably spending more. A relatively low Nonfarm Payrolls’ result, on the either hand, could mean people are struggling to find work. The Fed will typically raise interest rates to combat high inflation triggered by low unemployment, and lower them to stimulate a stagnant labor market.
Nonfarm Payrolls generally have a positive correlation with the US Dollar. This means when payrolls’ figures come out higher-than-expected the USD tends to rally and vice versa when they are lower. NFPs influence the US Dollar by virtue of their impact on inflation, monetary policy expectations and interest rates. A higher NFP usually means the Federal Reserve will be more tight in its monetary policy, supporting the USD.
Nonfarm Payrolls are generally negatively-correlated with the price of Gold. This means a higher-than-expected payrolls’ figure will have a depressing effect on the Gold price and vice versa. Higher NFP generally has a positive effect on the value of the USD, and like most major commodities Gold is priced in US Dollars. If the USD gains in value, therefore, it requires less Dollars to buy an ounce of Gold. Also, higher interest rates (typically helped higher NFPs) also lessen the attractiveness of Gold as an investment compared to staying in cash, where the money will at least earn interest.
Nonfarm Payrolls is only one component within a bigger jobs report and it can be overshadowed by the other components. At times, when NFP come out higher-than-forecast, but the Average Weekly Earnings is lower than expected, the market has ignored the potentially inflationary effect of the headline result and interpreted the fall in earnings as deflationary. The Participation Rate and the Average Weekly Hours components can also influence the market reaction, but only in seldom events like the “Great Resignation” or the Global Financial Crisis.
-
08:09
NZD/USD tumbles below 0.5600 on bullish US Dollar, all eyes on US NFP data
- NZD/USD declines to around 0.5585 in Friday’s early European session, down 0.25% on the day.
- The prospect of a slower pace of Fed rate cuts could boost the USD against the NZD.
- The US December Nonfarm Payrolls data will be closely watched on Friday.
The NZD/USD pair attracts some sellers to around 0.5585 during the early European trading hours on Friday. The pair remains under selling pressure amid the strengthening US Dollar (USD) due to heightened expectations that the US Federal Reserve (Fed) will move forward cautiously with future rate cuts. All eyes will be on the US Nonfarm Payrolls (NFP) report for December, which is due later on Friday.
The US Dollar index (DXY), a measure of the USD's value relative to its most significant trading partners' currencies, is set for a sixth consecutive weekly gain and currently trades near 103.35. The firmer Greenback is underpinned by rising bond yields and expectations of another strong US economic data.
The Fed decided to lower its policy rate of interest a full percentage point in the final three meetings of 2024 but is expected to leave the rate steady in the current 4.25% to 4.5% range at the upcoming January policy meeting. According to the CME FedWatch tool, traders have priced in nearly a 93.1% odds that the Fed will pause the rate cut this month.
On the other hand, the dovish bets of the Reserve Bank of New Zealand (RBNZ) and the deflationary pressures in China could drag the Kiwi lower. Data released on Thursday showed China’s Consumer Price Index (CPI) remained close to flat in December, stoking deflation worries. Any signs of weakness in China’s economy are likely to undermine the New Zealand Dollar (NZD), as China is a major trading partner to New Zealand.New Zealand Dollar FAQs
The New Zealand Dollar (NZD), also known as the Kiwi, is a well-known traded currency among investors. Its value is broadly determined by the health of the New Zealand economy and the country’s central bank policy. Still, there are some unique particularities that also can make NZD move. The performance of the Chinese economy tends to move the Kiwi because China is New Zealand’s biggest trading partner. Bad news for the Chinese economy likely means less New Zealand exports to the country, hitting the economy and thus its currency. Another factor moving NZD is dairy prices as the dairy industry is New Zealand’s main export. High dairy prices boost export income, contributing positively to the economy and thus to the NZD.
The Reserve Bank of New Zealand (RBNZ) aims to achieve and maintain an inflation rate between 1% and 3% over the medium term, with a focus to keep it near the 2% mid-point. To this end, the bank sets an appropriate level of interest rates. When inflation is too high, the RBNZ will increase interest rates to cool the economy, but the move will also make bond yields higher, increasing investors’ appeal to invest in the country and thus boosting NZD. On the contrary, lower interest rates tend to weaken NZD. The so-called rate differential, or how rates in New Zealand are or are expected to be compared to the ones set by the US Federal Reserve, can also play a key role in moving the NZD/USD pair.
Macroeconomic data releases in New Zealand are key to assess the state of the economy and can impact the New Zealand Dollar’s (NZD) valuation. A strong economy, based on high economic growth, low unemployment and high confidence is good for NZD. High economic growth attracts foreign investment and may encourage the Reserve Bank of New Zealand to increase interest rates, if this economic strength comes together with elevated inflation. Conversely, if economic data is weak, NZD is likely to depreciate.
The New Zealand Dollar (NZD) tends to strengthen during risk-on periods, or when investors perceive that broader market risks are low and are optimistic about growth. This tends to lead to a more favorable outlook for commodities and so-called ‘commodity currencies’ such as the Kiwi. Conversely, NZD tends to weaken at times of market turbulence or economic uncertainty as investors tend to sell higher-risk assets and flee to the more-stable safe havens.
-
08:03
AUD/JPY hovers around 98.00, upside seems possible due to uncertainty over BoJ rate hikes
- AUD/JPY gains ground as the uncertainty continues over the timing of interest rate hikes by the Bank of Japan.
- Japan's Economy Minister, Ryosei Akazawa, offers no clear indication of when the BoJ may raise interest rates.
- The AUD weakens as ANZ revises its outlook, now forecasting a 25-basis points rate cut by the RBA in February.
AUD/JPY remains steady after its recent losses registered in the previous session, trading around 98.00 during the early European hours on Friday. The AUD/JPY cross may appreciate as the Japanese Yen (JPY) depreciates due to continued uncertainty over the timing of interest rate hikes by the Bank of Japan (BoJ).
Japan's Economy Minister, Ryosei Akazawa, stated on Friday that the country is at a "critical stage" in overcoming the public's deflationary mindset. Akazawa added, “Once we can officially declare the end of deflation, we will be able to stop using the tools we’ve had in place to combat it.”
However, the upside of the AUD/JPY cross could be restrained as the Australian Dollar (AUD) faces challenges as the ANZ is now forecasting a 25 basis points (bps) rate cut by the Reserve Bank of Australia (RBA) in February.
The Australian Dollar struggled as the trimmed mean, a closely watched measure of core inflation, fell to an annual 3.2% from 3.5%, edging closer to the Reserve Bank of Australia's (RBA) target band of 2% to 3%. Markets are currently divided on whether the RBA will act in February, but a quarter-point rate cut in April is fully priced in.
Additionally, the Aussie Dollar found no support from China's latest inflation data, which highlighted increasing deflationary risks. China's Consumer Price Index (CPI) increased by 0.1% year-over-year in December, slightly lower than the 0.2% rise in November. Meanwhile, monthly inflation remained unchanged at 0% in December. Any change in Chinese economic conditions could impact the Australian markets as both nations are close trading partners.
Central banks FAQs
Central Banks have a key mandate which is making sure that there is price stability in a country or region. Economies are constantly facing inflation or deflation when prices for certain goods and services are fluctuating. Constant rising prices for the same goods means inflation, constant lowered prices for the same goods means deflation. It is the task of the central bank to keep the demand in line by tweaking its policy rate. For the biggest central banks like the US Federal Reserve (Fed), the European Central Bank (ECB) or the Bank of England (BoE), the mandate is to keep inflation close to 2%.
A central bank has one important tool at its disposal to get inflation higher or lower, and that is by tweaking its benchmark policy rate, commonly known as interest rate. On pre-communicated moments, the central bank will issue a statement with its policy rate and provide additional reasoning on why it is either remaining or changing (cutting or hiking) it. Local banks will adjust their savings and lending rates accordingly, which in turn will make it either harder or easier for people to earn on their savings or for companies to take out loans and make investments in their businesses. When the central bank hikes interest rates substantially, this is called monetary tightening. When it is cutting its benchmark rate, it is called monetary easing.
A central bank is often politically independent. Members of the central bank policy board are passing through a series of panels and hearings before being appointed to a policy board seat. Each member in that board often has a certain conviction on how the central bank should control inflation and the subsequent monetary policy. Members that want a very loose monetary policy, with low rates and cheap lending, to boost the economy substantially while being content to see inflation slightly above 2%, are called ‘doves’. Members that rather want to see higher rates to reward savings and want to keep a lit on inflation at all time are called ‘hawks’ and will not rest until inflation is at or just below 2%.
Normally, there is a chairman or president who leads each meeting, needs to create a consensus between the hawks or doves and has his or her final say when it would come down to a vote split to avoid a 50-50 tie on whether the current policy should be adjusted. The chairman will deliver speeches which often can be followed live, where the current monetary stance and outlook is being communicated. A central bank will try to push forward its monetary policy without triggering violent swings in rates, equities, or its currency. All members of the central bank will channel their stance toward the markets in advance of a policy meeting event. A few days before a policy meeting takes place until the new policy has been communicated, members are forbidden to talk publicly. This is called the blackout period.
-
08:01
Sweden Industrial Production Value (MoM): 2.4% (November) vs -0.9%
-
08:00
Sweden Industrial Production Value (YoY) climbed from previous -2% to 2.6% in November
-
08:00
Sweden New Orders Manufacturing (YoY) rose from previous -1% to 5.1% in November
-
07:46
USD/CAD rises above 1.4400 as US Dollar Index rallies toward two-year highs
- USD/CAD appreciates as US Dollar Index advances toward two-year highs ahead of labor market figures.
- The US NFP is expected to decrease to 160K in December, down from the previous 227K.
- Statistics Canada could report a Net Change in Employment of 25,000 for December, as compared to November’s figure of 50,500.
USD/CAD continues its winning streak for the fourth successive session, trading around 1.4420 during the Asian hours on Friday. The USD/CAD pair appreciates as the US Dollar (USD) receives support from hawkish Federal Open Market Committee (FOMC) Meeting Minutes and uncertainties surrounding tariff plans proposed by the incoming Trump administration.
The US Dollar Index (DXY), which measures the USD’s performance against six key currencies, trades near 109.30 at the time of writing, just below its two-year high of 109.56 reached on January 2. The Greenback gains strength as long-term US bond yields continue to rise due to significant supply. As of now, the 10-year yield is at 4.69%, while the 30-year yield stands at 4.93%.
Kansas Fed President Jeffrey Schmid made headlines on Thursday, emphasizing the need to reduce the Fed's balance sheet, suggesting that interest rate policy is approaching its long-term equilibrium. He noted that any future rate cuts should be gradual and guided by economic data.
Additionally, Federal Reserve Board of Governors member Michelle Bowman added her voice to a chorus of Fed speakers this week as policymakers work double-duty to try and smooth over market reactions to a much tighter pace of rate cuts in 2025 than many market participants had previously anticipated.
Canadian Prime Minister Justin Trudeau said Thursday that he would respond if Trump does impose tariffs. Trudeau further stated that President-elect Donald Trump’s threat of slapping a 25% tariff on Canadian products would ultimately hurt American consumers and businesses. Canada, Mexico, and China are the US’s biggest trade partners.
Meanwhile, higher crude Oil prices may help limit the Canadian Dollar's (CAD) losses, as Canada remains the largest Oil exporter to the United States (US). At the time of writing, West Texas Intermediate (WTI) Oil price holds steady after recent gains, trading around $73.70 per barrel.
Crude Oil prices are supported by expectations of increased heating fuel consumption due to prolonged colder temperatures across the Northern Hemisphere. Additionally, signs of strong demand are evident, highlighted by a report indicating a seventh consecutive weekly decline in US crude stockpiles.
On the data front, traders are now focused on US labor market figures, particularly Nonfarm Payrolls (NFP), for clues on the Fed’s future policy direction. In Canada, attention will turn to December's Net Change in Employment and Unemployment Rate for further economic insights.
Canadian Dollar FAQs
The key factors driving the Canadian Dollar (CAD) are the level of interest rates set by the Bank of Canada (BoC), the price of Oil, Canada’s largest export, the health of its economy, inflation and the Trade Balance, which is the difference between the value of Canada’s exports versus its imports. Other factors include market sentiment – whether investors are taking on more risky assets (risk-on) or seeking safe-havens (risk-off) – with risk-on being CAD-positive. As its largest trading partner, the health of the US economy is also a key factor influencing the Canadian Dollar.
The Bank of Canada (BoC) has a significant influence on the Canadian Dollar by setting the level of interest rates that banks can lend to one another. This influences the level of interest rates for everyone. The main goal of the BoC is to maintain inflation at 1-3% by adjusting interest rates up or down. Relatively higher interest rates tend to be positive for the CAD. The Bank of Canada can also use quantitative easing and tightening to influence credit conditions, with the former CAD-negative and the latter CAD-positive.
The price of Oil is a key factor impacting the value of the Canadian Dollar. Petroleum is Canada’s biggest export, so Oil price tends to have an immediate impact on the CAD value. Generally, if Oil price rises CAD also goes up, as aggregate demand for the currency increases. The opposite is the case if the price of Oil falls. Higher Oil prices also tend to result in a greater likelihood of a positive Trade Balance, which is also supportive of the CAD.
While inflation had always traditionally been thought of as a negative factor for a currency since it lowers the value of money, the opposite has actually been the case in modern times with the relaxation of cross-border capital controls. Higher inflation tends to lead central banks to put up interest rates which attracts more capital inflows from global investors seeking a lucrative place to keep their money. This increases demand for the local currency, which in Canada’s case is the Canadian Dollar.
Macroeconomic data releases gauge the health of the economy and can have an impact on the Canadian Dollar. Indicators such as GDP, Manufacturing and Services PMIs, employment, and consumer sentiment surveys can all influence the direction of the CAD. A strong economy is good for the Canadian Dollar. Not only does it attract more foreign investment but it may encourage the Bank of Canada to put up interest rates, leading to a stronger currency. If economic data is weak, however, the CAD is likely to fall.
-
07:45
Switzerland Unemployment Rate s.a (MoM) in line with forecasts (2.6%) in December
-
07:27
FX option expiries for Jan 10 NY cut
FX option expiries for Jan 10 NY cut at 10:00 Eastern Time via DTCC can be found below.
EUR/USD: EUR amounts
- 1.0200 1.1b
- 1.0225 769m
- 1.0275 1b
- 1.0300 2.6b
- 1.0315 1.4b
- 1.0325 1.3b
- 1.0350 1.8b
- 1.0400 2.3b
- 1.0500 742m
USD/JPY: USD amounts
- 157.00 728m
- 157.75 553m
- 158.00 521m
USD/CHF: USD amounts
- 0.9000 447m
AUD/USD: AUD amounts
- 0.6185 1.6b
- 0.6500 944m
USD/CAD: USD amounts
- 1.4170 1.6b
- 1.4175 749m
- 1.4300 758m
- 1.4325 909m
- 1.4400 761m
-
06:58
EUR/GBP extends the rally above 0.8350 amid UK fiscal concerns
- EUR/GBP climbs to around 0.8375 in Friday’s early European session.
- Pound falls after UK borrowing costs hit their highest for 16 years.
- The Eurozone December inflation data has pushed back expectations that the ECB will deliver a jumbo rate cut.
The EUR/GBP cross extends its upside to near 0.8375 during the early European session on Friday. The Pound Sterling (GBP) remains under selling pressure amid concerns about the UK's fiscal outlook and the Bank of England's (BoE) ability to control inflation.
The significant depreciation of the GBP came after a rise in the yields of the UK benchmark 10-year treasury bonds to their highest level since 2008. The high costs of UK debt have raised significant concerns about the financial situation in the UK, resulting in a sharp decline in the British pound.
The sharp fall of the GBP followed a rise in yields of the UK benchmark 10-year treasury bonds to their highest level since 2008. The high costs of UK debt have prompted serious worries about the UK's financial condition, resulting in a sharp decline in the GBP. Bank of England Deputy Governor Sarah Breeden said on Thursday that recent evidence supported the case to cut interest rates gradually, although it was difficult to know how quickly.
On the Euro front, the Eurozone preliminary Harmonized Index of Consumer Prices (HICP) data for December will likely push the European Central Bank (ECB) to pursue its rate-cutting cycle more cautiously, supporting the shared currency. We project that the ECB will only cut rates once in the first half of this year, with additional cuts concentrated in the latter half of 2025," said Charlie Cornes, senior economist at the U.K.-based Centre for Economics and Business Research.Pound Sterling FAQs
The Pound Sterling (GBP) is the oldest currency in the world (886 AD) and the official currency of the United Kingdom. It is the fourth most traded unit for foreign exchange (FX) in the world, accounting for 12% of all transactions, averaging $630 billion a day, according to 2022 data. Its key trading pairs are GBP/USD, also known as ‘Cable’, which accounts for 11% of FX, GBP/JPY, or the ‘Dragon’ as it is known by traders (3%), and EUR/GBP (2%). The Pound Sterling is issued by the Bank of England (BoE).
The single most important factor influencing the value of the Pound Sterling is monetary policy decided by the Bank of England. The BoE bases its decisions on whether it has achieved its primary goal of “price stability” – a steady inflation rate of around 2%. Its primary tool for achieving this is the adjustment of interest rates. When inflation is too high, the BoE will try to rein it in by raising interest rates, making it more expensive for people and businesses to access credit. This is generally positive for GBP, as higher interest rates make the UK a more attractive place for global investors to park their money. When inflation falls too low it is a sign economic growth is slowing. In this scenario, the BoE will consider lowering interest rates to cheapen credit so businesses will borrow more to invest in growth-generating projects.
Data releases gauge the health of the economy and can impact the value of the Pound Sterling. Indicators such as GDP, Manufacturing and Services PMIs, and employment can all influence the direction of the GBP. A strong economy is good for Sterling. Not only does it attract more foreign investment but it may encourage the BoE to put up interest rates, which will directly strengthen GBP. Otherwise, if economic data is weak, the Pound Sterling is likely to fall.
Another significant data release for the Pound Sterling is the Trade Balance. This indicator measures the difference between what a country earns from its exports and what it spends on imports over a given period. If a country produces highly sought-after exports, its currency will benefit purely from the extra demand created from foreign buyers seeking to purchase these goods. Therefore, a positive net Trade Balance strengthens a currency and vice versa for a negative balance.
-
06:43
USD/CNH Price Analysis: Remains above 7.3500 near two-year highs
- USD/CNH could approach initial resistance at 7.3697, marking the highest level since October 2022.
- The 14-day RSI remains below the 70 level, further supporting the sustained bullish bias.
- The immediate support zone is seen around the nine-day EMA at the 7.3435 level.
The USD/CNH pair retraces its two days of gains, trading around 7.3520 during the Asian hours on Friday. An analysis of the daily chart indicates that the price movement within the ascending channel pattern is intensifying, which points to a strengthening bullish trend.
The 14-day Relative Strength Index (RSI), a key momentum indicator, holds below the 70 level, reinforcing the ongoing bullish momentum. Moreover, the USD/CNH pair trades above both the nine-day and 14-day Exponential Moving Averages (EMAs), further suggesting robust short-term price momentum.
The USD/CNH pair could test primary resistance at 7.3697, the highest level since October 2022, reached on December 31. A break above this level could reinforce the bullish bias and support the pair to approach the upper boundary of the ascending channel at the 7.4150 level.
On the downside, the USD/CNH pair may initially test the nine-day Exponential Moving Average at the 7.3435 level, followed by the 14-day EMA at the 7.3348 level. A break below this level would weaken the short-term price momentum and lead the pair to navigate the area around the ascending channel’s lower boundary at the 7.2890 level.
USD/CNH: Daily Chart
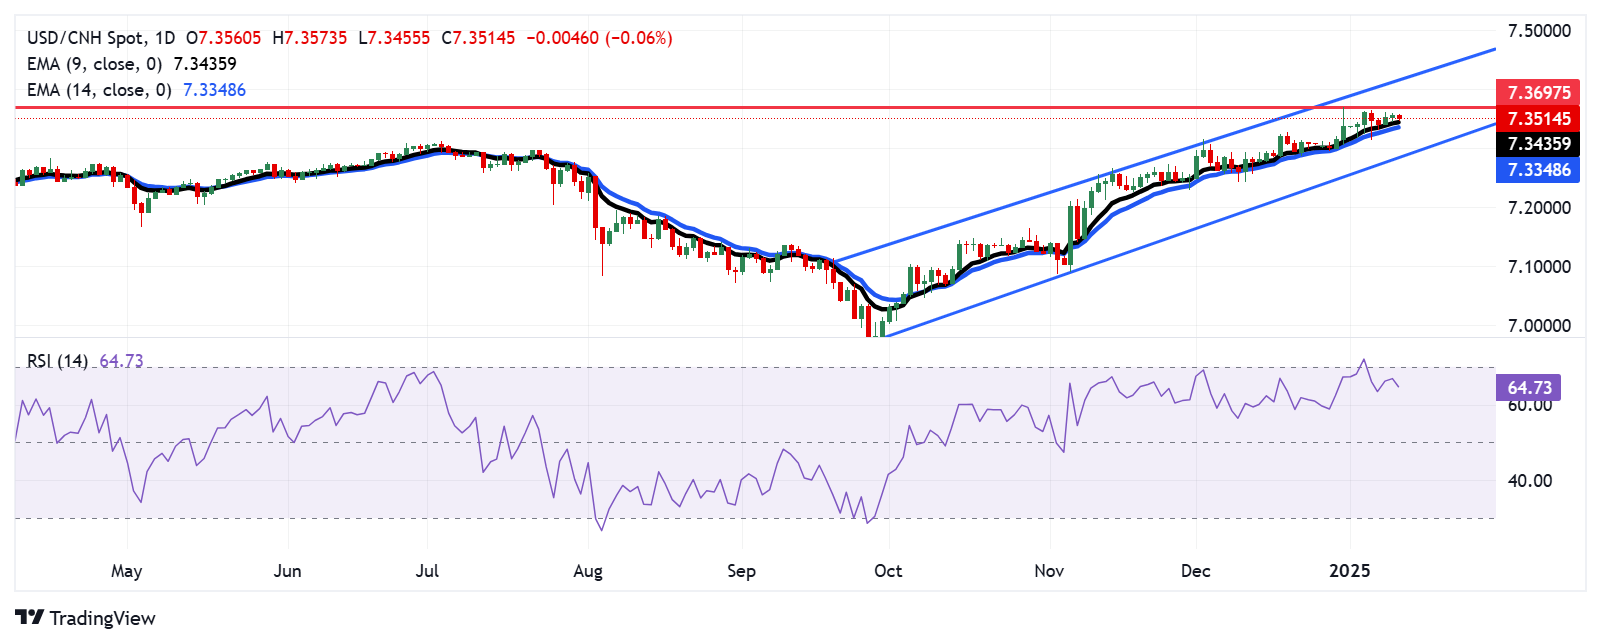
-
06:31
Netherlands, The Manufacturing Output (MoM) rose from previous -0.6% to 1.3% in November
-
06:01
Japan Leading Economic Index registered at 107, below expectations (107.2) in November
-
06:00
Japan Coincident Index: 115.3 (November) vs previous 116.8
-
06:00
Nonfarm Payrolls forecast: US December job gains set to decline sharply from November
- US Nonfarm Payrolls are expected to rise by 160K in December after jumping by 227K in November.
- The United States Bureau of Labor Statistics will release the labor data on Friday at 13:30 GMT.
- US jobs data is set to rock the US Dollar after hawkish Fed Minutes published on Wednesday.
The highly anticipated United States (US) Nonfarm Payrolls (NFP) data for December will be published by the Bureau of Labor Statistics (BLS) on Friday at 13:30 GMT.
The December jobs report is critical to the US Dollar’s (USD) next directional move as it will help the markets gauge future interest rate cuts by the US Federal Reserve (Fed) amid the incoming administration of President-elect Donald Trump.
What to expect from the next Nonfarm Payrolls report?
Economists expect the Nonfarm Payrolls report to show that the US economy added 160,000 jobs in December after witnessing a stellar 227K job gain in November as distortions caused by two hurricanes and the Boeing strike faded.
The Unemployment Rate (UE) is expected to remain at 4.2% in the same period.
Meanwhile, Average Hourly Earnings (AHE), a closely-watched measure of wage inflation, are expected to rise by 4% year-over-year (YoY) in December, at the same pace as seen in November.
Investors will assess the December jobs data for fresh signs on the health of the US labor market, as they remain wary about the inflation and monetary policy outlook under Trump’s presidency. Incoming Trump’s immigration and trade policies are expected to stoke up inflation, calling for higher interest rates.
The Minutes of the Fed’s December meeting released on Wednesday showed policymakers’ concerns about inflation and the potential impact of Trump’s policies, suggesting that they will move more slowly and cautiously on interest rate cuts because of the uncertainty.
Previewing the December employment situation report, TD Securities analysts said: “We expect payroll growth to cool down closer to trend in December following the October-November gyrations that were triggered by one-off shocks.”
“The UE rate likely stabilized at 4.2% despite our expectation for a meaningful rebound in the household survey's employment series. Separately, we look for wage growth to mean-revert to 0.1% m/m following a string of hot monthly prints,” they added.
How will US December Nonfarm Payrolls affect EUR/USD?
Speculations around Trump's potential tariff plans continued to offset any impact from the recent US economic data releases. However, that failed to alter the market’s pricing of a no-rate change decision at the Fed meeting later this month, according to the CME Group's FedWatch tool.
Earlier in the week, the BLS reported that the JOLTS Job Openings climbed to 8.09 million, outpacing forecasts for a 7.7 million growth and higher than October's 7.83 million print.
The Automatic Data Processing (ADP) announced on Wednesday that employment in the US private sector grew by 122,000 jobs last month, lower than the estimated 140,000 and November’s 146,000 job gain.
The disappointing ADP jobs report ramped up expectations of a weak payrolls data on Friday. However, the US ADP data is generally not correlated with the official NFP data.
If the headline NFP figure shows a payroll growth below 100,000, the US Dollar could witness a massive selling wave in a knee-jerk reaction to the data, as it would create a dilemma for the Fed and could revive dovish Fed expectations. In such a scenario, EUR/USD could stage a solid comeback toward the 1.0450 level.
On the other hand, an upside surprise to the NFP and wage inflation data could double down on the Fed’s hawkish shift, sending the USD back to multi-year highs while knocking off the EUR/USD pair to the lowest level in over two years to below 1.0250.
Dhwani Mehta, Asian Session Lead Analyst at FXStreet, offers a brief technical outlook for EUR/USD:
“EUR/USD remains below all major daily Simple Moving Averages (SMA) in the lead-up to the NFP showdown. Meanwhile, the 14-day Relative Strength Index (RSI) points south below the 50 level. These technical indicators suggest that the pair remains exposed to downside risks in the near term.”
“Buyers needs a decisive break above the 21-day Simple Moving Average (SMA) at 1.0391 to initiate a meaningful recovery toward the January 7 high of 1.0437. The next relevant topside target aligns at the 50-day SMA at 1.0510. Fresh buying opportunities will rise above that level, calling for a test of the December 6 high of 1.0630. Conversely, if EUR/USD yields a sustained break of the two-year low at 1.0224, additional declines will aim for the 1.0150 psychological barrier.”
Economic Indicator
Nonfarm Payrolls
The Nonfarm Payrolls release presents the number of new jobs created in the US during the previous month in all non-agricultural businesses; it is released by the US Bureau of Labor Statistics (BLS). The monthly changes in payrolls can be extremely volatile. The number is also subject to strong reviews, which can also trigger volatility in the Forex board. Generally speaking, a high reading is seen as bullish for the US Dollar (USD), while a low reading is seen as bearish, although previous months' reviews and the Unemployment Rate are as relevant as the headline figure. The market's reaction, therefore, depends on how the market assesses all the data contained in the BLS report as a whole.
Read more.Next release: Fri Jan 10, 2025 13:30
Frequency: Monthly
Consensus: 160K
Previous: 227K
Source: US Bureau of Labor Statistics
America’s monthly jobs report is considered the most important economic indicator for forex traders. Released on the first Friday following the reported month, the change in the number of positions is closely correlated with the overall performance of the economy and is monitored by policymakers. Full employment is one of the Federal Reserve’s mandates and it considers developments in the labor market when setting its policies, thus impacting currencies. Despite several leading indicators shaping estimates, Nonfarm Payrolls tend to surprise markets and trigger substantial volatility. Actual figures beating the consensus tend to be USD bullish.
Employment FAQs
Labor market conditions are a key element to assess the health of an economy and thus a key driver for currency valuation. High employment, or low unemployment, has positive implications for consumer spending and thus economic growth, boosting the value of the local currency. Moreover, a very tight labor market – a situation in which there is a shortage of workers to fill open positions – can also have implications on inflation levels and thus monetary policy as low labor supply and high demand leads to higher wages.
The pace at which salaries are growing in an economy is key for policymakers. High wage growth means that households have more money to spend, usually leading to price increases in consumer goods. In contrast to more volatile sources of inflation such as energy prices, wage growth is seen as a key component of underlying and persisting inflation as salary increases are unlikely to be undone. Central banks around the world pay close attention to wage growth data when deciding on monetary policy.
The weight that each central bank assigns to labor market conditions depends on its objectives. Some central banks explicitly have mandates related to the labor market beyond controlling inflation levels. The US Federal Reserve (Fed), for example, has the dual mandate of promoting maximum employment and stable prices. Meanwhile, the European Central Bank’s (ECB) sole mandate is to keep inflation under control. Still, and despite whatever mandates they have, labor market conditions are an important factor for policymakers given its significance as a gauge of the health of the economy and their direct relationship to inflation.
-
05:53
USD/CHF holds above 0.9100 mark, close to multi-month peak ahead of US NFP
- USD/CHF remains within striking distance of a multi-month peak touched last week.
- The Fed’s hawkish shift keeps the US bond yields elevated and underpins the USD.
- Bets for more rate cuts by the SNB weigh on the CHF and also lend support to the pair.
- A weaker risk tone benefits the safe-haven CHF and cap gains ahead of the US NFP.
The USD/CHF pair consolidates its gains registered over the past three days and oscillates in a narrow trading band, around the 0.9120 area during the Asian session on Friday. Spot prices, meanwhile, remain close to the highest level since May touched last week as traders opt to await the release of the US monthly employment details before placing fresh directional bets.
The popularly known US Nonfarm Payrolls (NFP) report is expected to show that the economy added 160K jobs in December, down from 227K in the previous month, while the Unemployment Rate is expected to hold steady at 4.2%. Apart from this, the focus will be on the wage growth data, which, in turn, will play a key role in influencing the near-term US Dollar (USD) price dynamics and provide some meaningful impetus to the USD/CHF pair.
Heading into the key data risk, the prospects for slower interest rate cuts by the Federal Reserve (Fed) remain supportive of elevated US Treasury bond yields and assist the USD to stand firm near a two-week top. Apart from this, expectations for more rate cuts by the Swiss National Bank (SNB) this year, bolstered by a further fall in Swiss consumer inflation in December, act as a tailwind for the USD/CHF pair and support prospects for further gains.
Meanwhile, concerns about US President Donald Trump's tariff plans, along with persistent geopolitical risks stemming from the protracted Russia-Ukraine war and tensions in the Middle East, continue to weigh on investors' sentiment. This is evident from a generally weaker tone around the equity markets, which could support the safe-haven Swiss Franc (CHF) and keep a lid on the USD/CHF pair, warranting some caution for bulls.
US Dollar PRICE This week
The table below shows the percentage change of US Dollar (USD) against listed major currencies this week. US Dollar was the strongest against the British Pound.
USD EUR GBP JPY CAD AUD NZD CHF USD 0.14% 1.06% 0.78% -0.26% 0.46% 0.53% 0.31% EUR -0.14% 0.91% 0.59% -0.34% 0.36% 0.42% 0.21% GBP -1.06% -0.91% -0.31% -1.24% -0.54% -0.48% -0.70% JPY -0.78% -0.59% 0.31% -1.04% -0.29% -0.22% -0.24% CAD 0.26% 0.34% 1.24% 1.04% 0.65% 0.74% 0.55% AUD -0.46% -0.36% 0.54% 0.29% -0.65% 0.06% -0.15% NZD -0.53% -0.42% 0.48% 0.22% -0.74% -0.06% -0.22% CHF -0.31% -0.21% 0.70% 0.24% -0.55% 0.15% 0.22% The heat map shows percentage changes of major currencies against each other. The base currency is picked from the left column, while the quote currency is picked from the top row. For example, if you pick the US Dollar from the left column and move along the horizontal line to the Japanese Yen, the percentage change displayed in the box will represent USD (base)/JPY (quote).
-
05:50
EUR/USD trades with mild losses near 1.0300 as traders await US NFP release
- EUR/USD softens to around 1.0300 in Friday’s Asian session.
- Several Fed officials favour slowing the pace of interest-rate cuts.
- Eurozone Retail Sales showed tepid growth in November.
The EUR/USD pair trades with a mild negative bias around 1.0300 during the Asian trading hours on Friday. The Federal Reserve’s (Fed) move to delay the interest rate cut continues to lift the Greenback and exert some selling pressure on the major pair. Traders brace for the US December Nonfarm Payrolls (NFP) report, which is due later on Friday.
Several Fed officials signalled rate cut caution, citing elevated inflation and the uncertainty under the incoming Donald Trump administration. Fed Bank of Boston President Susan Collins said on Thursday that significant uncertainty over the outlook calls for the US central bank to move forward cautiously with future rate reduction.
Meanwhile, Fed Governor Michelle Bowman noted that she sees the interest rates on hold for the time being until the data shows inflation has resumed its downward trend. The hawkish comments from the Fed policymakers could underpin the US Dollar (USD) against the Euro (EUR) in the near term.
Across the pond, the Eurozone Retail Sales figures fail to boost the shared currency ahead of Friday’s US key employment data. Data released by Eurostat on Thursday showed that Retail Sales increased 1.2% YoY in November after rising by a revised 2.1% in October.
However, the Eurozone preliminary Harmonized Index of Consumer Prices (HICP) data for December has pushed back expectations that the European Central Bank (ECB) will deliver a jumbo rate cut. This, in turn, might help limit the EUR’s losses for the time being.Euro FAQs
The Euro is the currency for the 19 European Union countries that belong to the Eurozone. It is the second most heavily traded currency in the world behind the US Dollar. In 2022, it accounted for 31% of all foreign exchange transactions, with an average daily turnover of over $2.2 trillion a day. EUR/USD is the most heavily traded currency pair in the world, accounting for an estimated 30% off all transactions, followed by EUR/JPY (4%), EUR/GBP (3%) and EUR/AUD (2%).
The European Central Bank (ECB) in Frankfurt, Germany, is the reserve bank for the Eurozone. The ECB sets interest rates and manages monetary policy. The ECB’s primary mandate is to maintain price stability, which means either controlling inflation or stimulating growth. Its primary tool is the raising or lowering of interest rates. Relatively high interest rates – or the expectation of higher rates – will usually benefit the Euro and vice versa. The ECB Governing Council makes monetary policy decisions at meetings held eight times a year. Decisions are made by heads of the Eurozone national banks and six permanent members, including the President of the ECB, Christine Lagarde.
Eurozone inflation data, measured by the Harmonized Index of Consumer Prices (HICP), is an important econometric for the Euro. If inflation rises more than expected, especially if above the ECB’s 2% target, it obliges the ECB to raise interest rates to bring it back under control. Relatively high interest rates compared to its counterparts will usually benefit the Euro, as it makes the region more attractive as a place for global investors to park their money.
Data releases gauge the health of the economy and can impact on the Euro. Indicators such as GDP, Manufacturing and Services PMIs, employment, and consumer sentiment surveys can all influence the direction of the single currency. A strong economy is good for the Euro. Not only does it attract more foreign investment but it may encourage the ECB to put up interest rates, which will directly strengthen the Euro. Otherwise, if economic data is weak, the Euro is likely to fall. Economic data for the four largest economies in the euro area (Germany, France, Italy and Spain) are especially significant, as they account for 75% of the Eurozone’s economy.
Another significant data release for the Euro is the Trade Balance. This indicator measures the difference between what a country earns from its exports and what it spends on imports over a given period. If a country produces highly sought after exports then its currency will gain in value purely from the extra demand created from foreign buyers seeking to purchase these goods. Therefore, a positive net Trade Balance strengthens a currency and vice versa for a negative balance.
-
05:45
EUR/JPY rises to near 163.00 as uncertainty persists over timing of BoJ’s rate hikes
- EUR/JPY strengthens as Japan's Economy Minister, Ryosei Akazawa, offers no clear indication of when the BoJ may raise interest rates.
- Japan’s Overall Household Spending contracted by 0.4% YoY in November, better than the expected 0.6% decline.
- The Euro may struggle as traders expect the EC to implement a 25 basis point rate cut in January.
EUR/JPY recovers its recent losses from the previous session, trading around 163.00 during the Asian hours on Friday. The recent rise in the EUR/JPY cross is attributed to the weaker Japanese Yen (JPY), as uncertainty continues over the timing of interest rate hikes by the Bank of Japan (BoJ).
Japan's Economy Minister, Ryosei Akazawa, stated on Friday that the country is at a "critical stage" in overcoming the public's deflationary mindset. Akazawa added, “Once we can officially declare the end of deflation, we will be able to stop using the tools we’ve had in place to combat it.”
In November, Japan’s Overall Household Spending contracted by 0.4% year-over-year in real terms, which was less than the expected 0.6% decline and an improvement from the 1.3% drop seen the previous month. Additionally, JP Foreign Reserves fell by $8.28 billion to $1.12 trillion in December, marking the lowest level since July.
In the Eurozone, inflation increased to 2.4% in December, up from 2.2% in November, while retail sales saw a modest rise of 0.1% month-over-month in November, following a 0.3% decline in October. However, analysts believe this won’t deter the European Central Bank (ECB) from implementing a 25 basis point (bps) rate cut in January.
Markets are currently pricing in a 96% probability of a 25 bps rate cut this month, and expectations for further easing in 2025 have been reduced to three quarter-point cuts, with a 70% chance of a fourth.
Interest rates FAQs
Interest rates are charged by financial institutions on loans to borrowers and are paid as interest to savers and depositors. They are influenced by base lending rates, which are set by central banks in response to changes in the economy. Central banks normally have a mandate to ensure price stability, which in most cases means targeting a core inflation rate of around 2%. If inflation falls below target the central bank may cut base lending rates, with a view to stimulating lending and boosting the economy. If inflation rises substantially above 2% it normally results in the central bank raising base lending rates in an attempt to lower inflation.
Higher interest rates generally help strengthen a country’s currency as they make it a more attractive place for global investors to park their money.
Higher interest rates overall weigh on the price of Gold because they increase the opportunity cost of holding Gold instead of investing in an interest-bearing asset or placing cash in the bank. If interest rates are high that usually pushes up the price of the US Dollar (USD), and since Gold is priced in Dollars, this has the effect of lowering the price of Gold.
The Fed funds rate is the overnight rate at which US banks lend to each other. It is the oft-quoted headline rate set by the Federal Reserve at its FOMC meetings. It is set as a range, for example 4.75%-5.00%, though the upper limit (in that case 5.00%) is the quoted figure. Market expectations for future Fed funds rate are tracked by the CME FedWatch tool, which shapes how many financial markets behave in anticipation of future Federal Reserve monetary policy decisions.
-
05:36
India Gold price today: Gold rises, according to FXStreet data
Gold prices rose in India on Friday, according to data compiled by FXStreet.
The price for Gold stood at 7,379.50 Indian Rupees (INR) per gram, up compared with the INR 7,370.89 it cost on Thursday.
The price for Gold increased to INR 86,072.05 per tola from INR 85,972.55 per tola a day earlier.
Unit measure Gold Price in INR 1 Gram 7,379.50 10 Grams 73,794.16 Tola 86,072.05 Troy Ounce 229,528.20 FXStreet calculates Gold prices in India by adapting international prices (USD/INR) to the local currency and measurement units. Prices are updated daily based on the market rates taken at the time of publication. Prices are just for reference and local rates could diverge slightly.
Gold FAQs
Gold has played a key role in human’s history as it has been widely used as a store of value and medium of exchange. Currently, apart from its shine and usage for jewelry, the precious metal is widely seen as a safe-haven asset, meaning that it is considered a good investment during turbulent times. Gold is also widely seen as a hedge against inflation and against depreciating currencies as it doesn’t rely on any specific issuer or government.
Central banks are the biggest Gold holders. In their aim to support their currencies in turbulent times, central banks tend to diversify their reserves and buy Gold to improve the perceived strength of the economy and the currency. High Gold reserves can be a source of trust for a country’s solvency. Central banks added 1,136 tonnes of Gold worth around $70 billion to their reserves in 2022, according to data from the World Gold Council. This is the highest yearly purchase since records began. Central banks from emerging economies such as China, India and Turkey are quickly increasing their Gold reserves.
Gold has an inverse correlation with the US Dollar and US Treasuries, which are both major reserve and safe-haven assets. When the Dollar depreciates, Gold tends to rise, enabling investors and central banks to diversify their assets in turbulent times. Gold is also inversely correlated with risk assets. A rally in the stock market tends to weaken Gold price, while sell-offs in riskier markets tend to favor the precious metal.
The price can move due to a wide range of factors. Geopolitical instability or fears of a deep recession can quickly make Gold price escalate due to its safe-haven status. As a yield-less asset, Gold tends to rise with lower interest rates, while higher cost of money usually weighs down on the yellow metal. Still, most moves depend on how the US Dollar (USD) behaves as the asset is priced in dollars (XAU/USD). A strong Dollar tends to keep the price of Gold controlled, whereas a weaker Dollar is likely to push Gold prices up.
(An automation tool was used in creating this post.)
-
05:26
Gold price stands tall near multi-week top; looks to US NFP for fresh impetus
- Gold price attracts buyers for the fourth straight day on Friday amid some haven flows.
- The Fed’s hawkish stance, elevated US bond yields and a bullish USD should cap gains.
- Traders might also opt to wait for the release of the key US NFP report later this Friday.
Gold price (XAU/USD) trades with a positive bias for the fourth straight day on Friday and is currently placed just below a near four-week high touched the previous day. The uncertainty around US President-elect Donald Trump's proposed tariffs, along with geopolitical risks, continues to weigh on investors' sentiment and underpin the safe-haven bullion. Moreover, expectations that Trump's expansionary policies will boost inflation turns out to be another factor that benefits the precious metal's status as a hedge against rising prices.
That said, the prospects for slower interest rate cuts by the Federal Reserve (Fed) remain supportive of elevated US Treasury bond yields and assist the US Dollar (USD) to hold steady near a two-year high. This, in turn, could act as a headwind for the non-yielding Gold price and cap any further gains. Traders also seem reluctant and opt to wait for the release of the US Nonfarm Payrolls (NFP) report later during the US session. Nevertheless, the XAU/USD pair remains on track to register gains for the second consecutive week.
Gold price continues to benefit from worries about Trump’s tariff plans, geopolitical risks
- CNN reported on Wednesday that US President-elect Donald Trump is considering declaring a national economic emergency to provide legal justification for universal tariffs on allies and adversaries.
- Ukrainian forces launched a new surprise offensive in Kursk, inside Russia on August 6 and were reported to have advanced in three waves using company-sized assaults backed by armoured vehicles.
- The Israel Defense Forces stated that the commander of Hamas' Sabra battalion in Gaza City, his deputy and two elite Nukhba company commanders were killed in a series of airstrikes last week.
- The Federal Reserve adopted a more hawkish stance in December and projected only two quarter-point interest rate cuts in 2025 amid still elevated inflation in the world's largest economy.
- Boston Fed President Susan Collins said on Thursday that the economy is on a gradual, uneven trajectory to the 2% inflation target and the current outlook calls for a patient approach to rate cuts.
- Philadelphia Fed President Patrick Harker noted that the central bank is expected to cut rates further but explained that the path will depend on data and that it is taking longer to get inflation back to 2%.
- Kansas Fed President Jeffrey Schmid noted that inflation is moving toward target, growth is showing momentum, and the jobs market is still healthy. Any further rate cuts should be gradual and data-driven.
- Fed Board of Governors member Michelle Bowman said that the current stance of policy may not be as restrictive as others may see it and pent-up demand following the election could pose inflationary risks.
- Trump's policies are expected to stoke further inflation and further force the Fed to slow the pace of rate cuts this year, which keeps the US Treasury bond yields close to a multi-month high touched last week.
- Traders now look forward to the release of the US Nonfarm Payrolls (NFP) report, which is expected to show that the economy added 160K jobs in December and the Unemployment Rate held steady at 4.2%.
Gold price might now aim to reclaim the $2,700 round figure amid a bullish technical setup
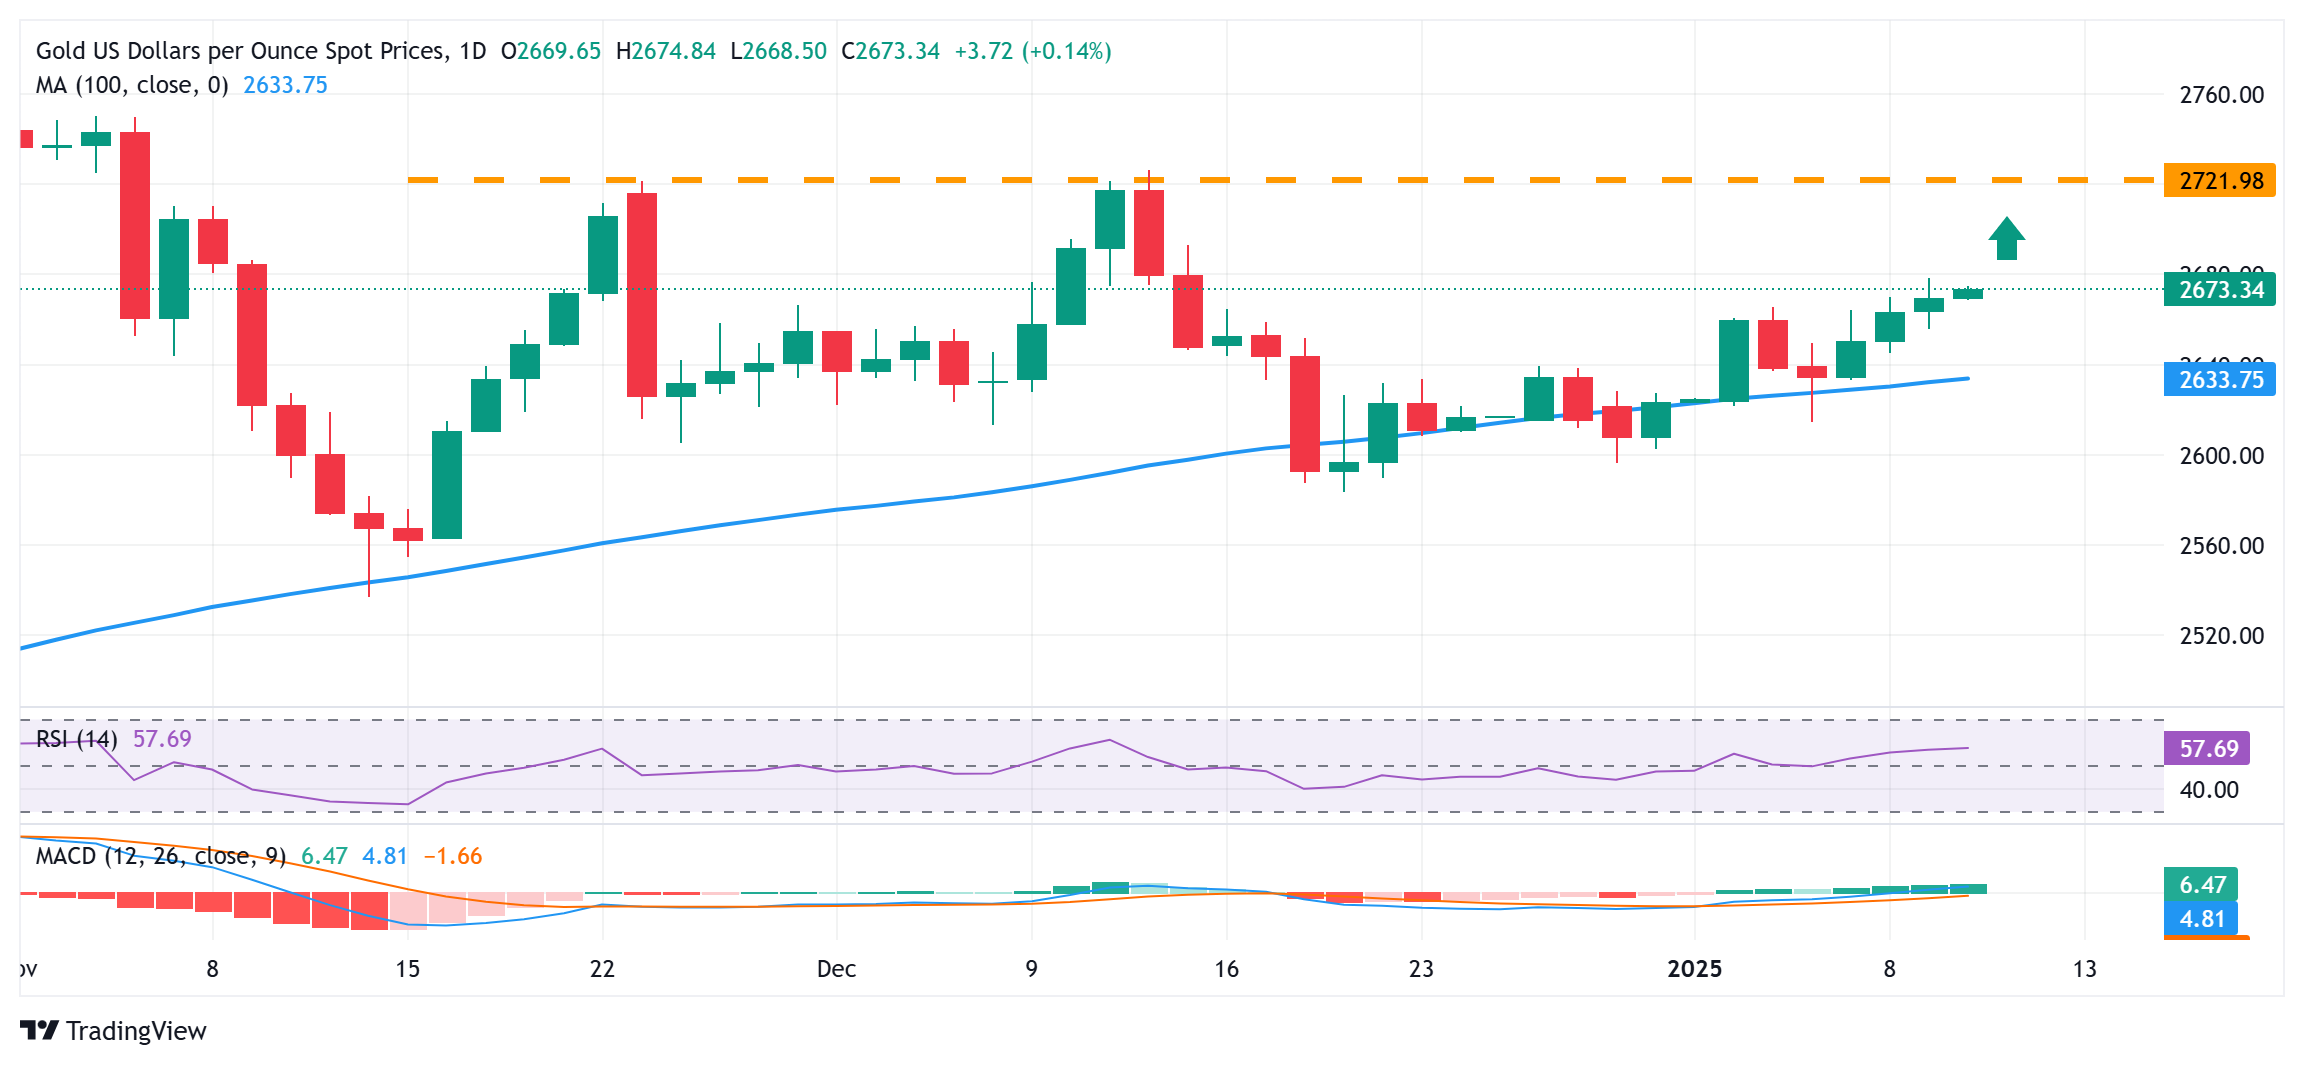
From a technical perspective, this week's breakout through the $2,665 horizontal resistance was seen as a fresh trigger for bullish traders. Given that oscillators on the daily chart have just started gaining positive traction, the Gold price seems poised to climb further to the $2,681-2,683 intermediate hurdle and then aim to reclaim the $2,700 round-figure mark.
On the flip side, dips towards the overnight swing low, around the $2,655 area, could be seen as a buying opportunity. This is followed by support near the $2,635 region and the weekly low, around the $2,615-2,614 zone touched on Monday, and the $2,600 confluence. The latter comprises the 100-day Exponential Moving Average (EMA) and a short-term ascending trend line extending from the November monthly low, which if broken decisively will shift the bias in favor of bearish traders.
Gold FAQs
Gold has played a key role in human’s history as it has been widely used as a store of value and medium of exchange. Currently, apart from its shine and usage for jewelry, the precious metal is widely seen as a safe-haven asset, meaning that it is considered a good investment during turbulent times. Gold is also widely seen as a hedge against inflation and against depreciating currencies as it doesn’t rely on any specific issuer or government.
Central banks are the biggest Gold holders. In their aim to support their currencies in turbulent times, central banks tend to diversify their reserves and buy Gold to improve the perceived strength of the economy and the currency. High Gold reserves can be a source of trust for a country’s solvency. Central banks added 1,136 tonnes of Gold worth around $70 billion to their reserves in 2022, according to data from the World Gold Council. This is the highest yearly purchase since records began. Central banks from emerging economies such as China, India and Turkey are quickly increasing their Gold reserves.
Gold has an inverse correlation with the US Dollar and US Treasuries, which are both major reserve and safe-haven assets. When the Dollar depreciates, Gold tends to rise, enabling investors and central banks to diversify their assets in turbulent times. Gold is also inversely correlated with risk assets. A rally in the stock market tends to weaken Gold price, while sell-offs in riskier markets tend to favor the precious metal.
The price can move due to a wide range of factors. Geopolitical instability or fears of a deep recession can quickly make Gold price escalate due to its safe-haven status. As a yield-less asset, Gold tends to rise with lower interest rates, while higher cost of money usually weighs down on the yellow metal. Still, most moves depend on how the US Dollar (USD) behaves as the asset is priced in dollars (XAU/USD). A strong Dollar tends to keep the price of Gold controlled, whereas a weaker Dollar is likely to push Gold prices up.
-
04:51
GBP/USD remains subdued near 1.2300, 14-month lows, US NFP eyed
- GBP/USD continues to decline as concerns over the UK’s fiscal and inflation outlook intensify.
- The British Pound failed to gain support, even amid a surge in long-term UK bond yields.
- The US Nonfarm Payrolls is expected to decrease to 160K in December, down from the previous 227K.
GBP/USD remains subdued for the fourth successive day, trading around 1.2300 during the Asian session on Friday. The GBP/USD pair dropped to 1.2238 on Thursday, marking its lowest level since November 2023, as the Pound Sterling (GBP) struggled under mounting concerns about the United Kingdom’s (UK) fiscal and inflation outlook, which weighed heavily on investor sentiment.
Despite a surge in long-term UK bond yields— with the 30-year yield hitting its highest level since 1998 and the 10-year yield reaching levels last seen in 2008—the British Pound failed to find support. Typically, higher yields strengthen a currency, but in this case, the decline reflects capital flight driven by fears of persistent inflation and fiscal instability.
On Thursday, UK Chief Secretary to the Treasury Darren Jones stated that UK financial markets are continuing to function in an "orderly way." However, markets reacted by selling the Pound Sterling further and increasing expectations of additional rate cuts by the Bank of England (BoE) later this year.
Additionally, the downside risks for the GBP/USD pair increased as the US Dollar (USD) gained support from hawkish Federal Open Market Committee (FOMC) Meeting Minutes and uncertainties surrounding tariff plans proposed by the incoming Trump administration. The US Dollar Index (DXY), which tracks the USD’s performance against six major currencies, remains steady above 109.00 at the moment of writing.
The latest FOMC Meeting Minutes indicated that policymakers agree that the process could take longer than previously anticipated due to recent hotter-than-expected readings on inflation and the effects of potential changes in trade and immigration policy under President-elect Trump’s administration.
Pound Sterling FAQs
The Pound Sterling (GBP) is the oldest currency in the world (886 AD) and the official currency of the United Kingdom. It is the fourth most traded unit for foreign exchange (FX) in the world, accounting for 12% of all transactions, averaging $630 billion a day, according to 2022 data. Its key trading pairs are GBP/USD, also known as ‘Cable’, which accounts for 11% of FX, GBP/JPY, or the ‘Dragon’ as it is known by traders (3%), and EUR/GBP (2%). The Pound Sterling is issued by the Bank of England (BoE).
The single most important factor influencing the value of the Pound Sterling is monetary policy decided by the Bank of England. The BoE bases its decisions on whether it has achieved its primary goal of “price stability” – a steady inflation rate of around 2%. Its primary tool for achieving this is the adjustment of interest rates. When inflation is too high, the BoE will try to rein it in by raising interest rates, making it more expensive for people and businesses to access credit. This is generally positive for GBP, as higher interest rates make the UK a more attractive place for global investors to park their money. When inflation falls too low it is a sign economic growth is slowing. In this scenario, the BoE will consider lowering interest rates to cheapen credit so businesses will borrow more to invest in growth-generating projects.
Data releases gauge the health of the economy and can impact the value of the Pound Sterling. Indicators such as GDP, Manufacturing and Services PMIs, and employment can all influence the direction of the GBP. A strong economy is good for Sterling. Not only does it attract more foreign investment but it may encourage the BoE to put up interest rates, which will directly strengthen GBP. Otherwise, if economic data is weak, the Pound Sterling is likely to fall.
Another significant data release for the Pound Sterling is the Trade Balance. This indicator measures the difference between what a country earns from its exports and what it spends on imports over a given period. If a country produces highly sought-after exports, its currency will benefit purely from the extra demand created from foreign buyers seeking to purchase these goods. Therefore, a positive net Trade Balance strengthens a currency and vice versa for a negative balance.
-
03:56
Silver Price Forecast: XAG/USD remains above $30.00 ahead of US Nonfarm Payrolls
- Silver price remains stronger as receives support from safe-haven demand.
- The precious metals like Silver gain support amid uncertainty surrounding inflation and potential Trump tariffs.
- Traders closely monitor the US Nonfarm Payrolls report for further insights into the Federal Reserve's policy direction.
Silver price (XAG/USD) continues its rally after registering little losses in the previous session, trading around $30.20 per troy ounce during the Asian hours on Friday. Traders are now focused on US labor market data including Nonfarm Payrolls (NFP), for additional insights into the Federal Reserve's policy direction.
The precious Silver, often considered a safe-haven asset, gains support amid uncertainty surrounding inflation and potential tariffs under President-elect Trump’s administration, as highlighted by the US Federal Reserve (Fed).
However, the upside of the non-yielding metal could be restrained as long-term US bond yields continue climbing on heavy supply. The 10-year stands at 4.68%, while the 30-year stands at 4.92% at the time of writing. This could be attributed to hawkish Federal Open Market Committee (FOMC) Minutes from the December meeting.
The latest FOMC Meeting Minutes showed that Fed policymakers expressed concern about inflation and the impact that President-elect Donald Trump’s policies could have. Fed officials indicated they would be moving more slowly on rate reductions because of the uncertainty. Fed officials penciled the expected cuts in 2025 to two from four in the previous estimate at September’s meeting.
Heightened geopolitical tensions have intensified market volatility, driving investors toward safe-haven assets like Silver. On Thursday, four people were killed in shelling incidents in Ukraine, with regional officials attributing one attack to Russia's military and another to Ukrainian forces. In the Russian-controlled Zaporizhzhia region, two additional fatalities occurred when the town of Kamyanka-Dniprovska came under Ukrainian fire, according to Russia-appointed governor Yevgeny Balitsky, as reported by Reuters.
Silver FAQs
Silver is a precious metal highly traded among investors. It has been historically used as a store of value and a medium of exchange. Although less popular than Gold, traders may turn to Silver to diversify their investment portfolio, for its intrinsic value or as a potential hedge during high-inflation periods. Investors can buy physical Silver, in coins or in bars, or trade it through vehicles such as Exchange Traded Funds, which track its price on international markets.
Silver prices can move due to a wide range of factors. Geopolitical instability or fears of a deep recession can make Silver price escalate due to its safe-haven status, although to a lesser extent than Gold's. As a yieldless asset, Silver tends to rise with lower interest rates. Its moves also depend on how the US Dollar (USD) behaves as the asset is priced in dollars (XAG/USD). A strong Dollar tends to keep the price of Silver at bay, whereas a weaker Dollar is likely to propel prices up. Other factors such as investment demand, mining supply – Silver is much more abundant than Gold – and recycling rates can also affect prices.
Silver is widely used in industry, particularly in sectors such as electronics or solar energy, as it has one of the highest electric conductivity of all metals – more than Copper and Gold. A surge in demand can increase prices, while a decline tends to lower them. Dynamics in the US, Chinese and Indian economies can also contribute to price swings: for the US and particularly China, their big industrial sectors use Silver in various processes; in India, consumers’ demand for the precious metal for jewellery also plays a key role in setting prices.
Silver prices tend to follow Gold's moves. When Gold prices rise, Silver typically follows suit, as their status as safe-haven assets is similar. The Gold/Silver ratio, which shows the number of ounces of Silver needed to equal the value of one ounce of Gold, may help to determine the relative valuation between both metals. Some investors may consider a high ratio as an indicator that Silver is undervalued, or Gold is overvalued. On the contrary, a low ratio might suggest that Gold is undervalued relative to Silver.
-
03:36
USD/INR loses ground ahead of US NFP data
- The Indian Rupee edges higher in Friday’s early Asian session.
- The firmer USD, a rise in crude oil prices and foreign outflows pressured the INR.
- Investors will closely monitor the US December NFP data.
The Indian Rupee (INR) recovers some lost ground on Friday after reaching a record low in the previous session. The stronger US Dollar (USD) and higher crude oil prices continue to weigh on the local currency. This, along with relentless selling in domestic equities and outflow of foreign capital, might keep the INR under pressure in the near term.
Nonetheless, the RBI could intervene in the foreign exchange market to prevent the INR from depreciating to its historic low level. Later on Friday, traders will keep an eye on the Indian Industrial Output and Manufacturing Output for November. On the US docket, the labor market data for December will be closely watched, including the Nonfarm Payrolls (NFP), Unemployment Rate and Average Hourly Earnings.Indian Rupee rebounds from record low amid uncertainties
- Foreign investors have removed around $2 billion dollars from India’s stock market since the start of the year.
- India’s economy is estimated to grow by 6.6% in 2025, according to the United Nations World Economic Situation and Prospects (WESP) report on Thursday.
- Federal Reserve Bank of Boston President Susan Collins said on Thursday that significant uncertainty over the outlook calls for the Fed to move forward cautiously with future rate reductions.
- Philadelphia Fed President Patrick Harker still expects rate cuts, but any sort of imminent move down is not needed amid considerable uncertainty over the economic outlook, per Reuters.
- Kansas City Fed President Jeff Schmid stated he favors slowing the pace of interest-rate cuts, though only after a persistent change in incoming economic data.
- Fed Governor Michelle Bowman said on Thursday that said she sees the interest rates on hold for the time being until the data shows inflation has resumed its downward trend.
USD/INR’s bullish outlook remains in play, but overbought conditions could limit any advance
The Indian Rupee trades on a firmer note on the day. The path of least resistance is to the upside as the USD/INR pair is well-supported above the key 100-day Exponential Moving Average (EMA) on the daily timeframe.
However, the 14-day Relative Strength Index (RSI) moves beyond the 70.00 mark, indicating the overbought condition. This suggests that further consolidation cannot be ruled out before positioning for any near-term USD/INR appreciation.
The first immediate resistance level for USD/INR is located at the 85.95-86.00 region, representing the all-time high and the psychological mark. Sustained bullish momentum past the mentioned level could even lift the pair to the next upside target at 86.50.
On the downside, the initial support level to watch for the pair emerges at 85.65, the low of January 7. If bears are taking the upper hand, this could be followed by a drop to 84.51, the 100-day EMA.Indian Rupee FAQs
The Indian Rupee (INR) is one of the most sensitive currencies to external factors. The price of Crude Oil (the country is highly dependent on imported Oil), the value of the US Dollar – most trade is conducted in USD – and the level of foreign investment, are all influential. Direct intervention by the Reserve Bank of India (RBI) in FX markets to keep the exchange rate stable, as well as the level of interest rates set by the RBI, are further major influencing factors on the Rupee.
The Reserve Bank of India (RBI) actively intervenes in forex markets to maintain a stable exchange rate, to help facilitate trade. In addition, the RBI tries to maintain the inflation rate at its 4% target by adjusting interest rates. Higher interest rates usually strengthen the Rupee. This is due to the role of the ‘carry trade’ in which investors borrow in countries with lower interest rates so as to place their money in countries’ offering relatively higher interest rates and profit from the difference.
Macroeconomic factors that influence the value of the Rupee include inflation, interest rates, the economic growth rate (GDP), the balance of trade, and inflows from foreign investment. A higher growth rate can lead to more overseas investment, pushing up demand for the Rupee. A less negative balance of trade will eventually lead to a stronger Rupee. Higher interest rates, especially real rates (interest rates less inflation) are also positive for the Rupee. A risk-on environment can lead to greater inflows of Foreign Direct and Indirect Investment (FDI and FII), which also benefit the Rupee.
Higher inflation, particularly, if it is comparatively higher than India’s peers, is generally negative for the currency as it reflects devaluation through oversupply. Inflation also increases the cost of exports, leading to more Rupees being sold to purchase foreign imports, which is Rupee-negative. At the same time, higher inflation usually leads to the Reserve Bank of India (RBI) raising interest rates and this can be positive for the Rupee, due to increased demand from international investors. The opposite effect is true of lower inflation.
-
03:30
Commodities. Daily history for Thursday, January 9, 2025
Raw materials Closed Change, % Silver 30.096 -0.02 Gold 2669.65 0.28 Palladium 928.17 -0.06 -
03:22
Japanese Yen struggles near multi-month low, seems vulnerable amid BoJ uncertainty
- The Japanese Yen is weighed down by doubts over the likely timing of the next BoJ rate hike.
- The recent widening of the US-Japan yield differential also undermined the lower-yielding JPY.
- The USD holds steady near a two-year top and supports USD/JPY ahead of the US NFP report.
The Japanese Yen (JPY) ticks higher in reaction to comments from Japan's Economy Minister Ryosei Akazawa during the Asian session on Friday, albeit it lacks bullish conviction amid the Bank of Japan (BoJ) rate hike uncertainty. Data released earlier today showed that real household spending in Japan fell for the fourth month in November and pointed to an economic fragility. This gives the BoJ another reason to be cautious about raising interest rate hikes further, which might continue to undermine the JPY.
Furthermore, the US-Japan bond yield differentials have widened significantly over the past month in the wake of the Federal Reserve's (Fed) hawkish shift. This might further contribute to capping the lower-yielding JPY and should act as a tailwind for the USD/JPY pair amid a bullish US Dollar (USD). Meanwhile, traders might opt to move to the sidelines and wait for the release of the crucial US Nonfarm Payrolls (NFP) report before placing aggressive directional bets around the currency pair.
Japanese Yen struggles to attract any buyers amid the BoJ rate-hike uncertainty
- Japan's Economy Minister Ryosei Akazawa said this Friday that Japan's economy is at a 'critical stage' in eradicating the public's deflationary mindset and shifting to a phase where growth is spearheaded by higher wages and investment.
- Government data released earlier today showed that inflation-adjusted household spending in Japan – a key indicator of private consumption – fell for the fourth month, by 0.4% in November from a year earlier amid stubbornly high prices.
- This comes on top of a drop in real wages for the fourth consecutive month in November and points to broadening inflationary pressure, which keeps the door open for another interest rate hike by the Bank of Japan in January or March.
- Some investors, however, are betting that the BoJ may wait until April to seek confirmation that strong wage momentum will carry over into the spring negotiations between companies and labor unions before pulling the trigger.
- The yield on the benchmark 10-year US government bond remains well within striking distance of its highest levels since the middle of last year touched last week amid the Federal Reserve's hawkish shift after the December meeting.
- Boston Fed President Susan Collins said on Thursday that the economy is on gradual, uneven trajectory back towards the 2% inflation target and the current outlook calls for a gradual and a patient approach to interest rate cuts.
- Philadelphia Fed President Patrick Harker noted that it is taking longer to get back to 2% inflation than expected. He added that the US central bank is still expected to continue to cut rates but explained that the path will depend on data.
- Kansas Fed President Jeffrey Schmid noted that inflation is moving toward target and growth is showing momentum, while the jobs market is weaker but still healthy. Any further interest rate cuts should be gradual and data-driven.
- Fed Board of Governors member Michelle Bowman said that the current stance of policy may not be as restrictive as others may see it and pent-up demand following the election could pose inflationary risks.
- The US Dollar stands tall near a two-year peak and assists the USD/JPY pair to hold steady above the 158.00 mark as traders keenly await the release of the US jobs data – popularly known as the Nonfarm Payrolls report later today.
USD/JPY seems poised to climb further; break out through a short-term range awaited
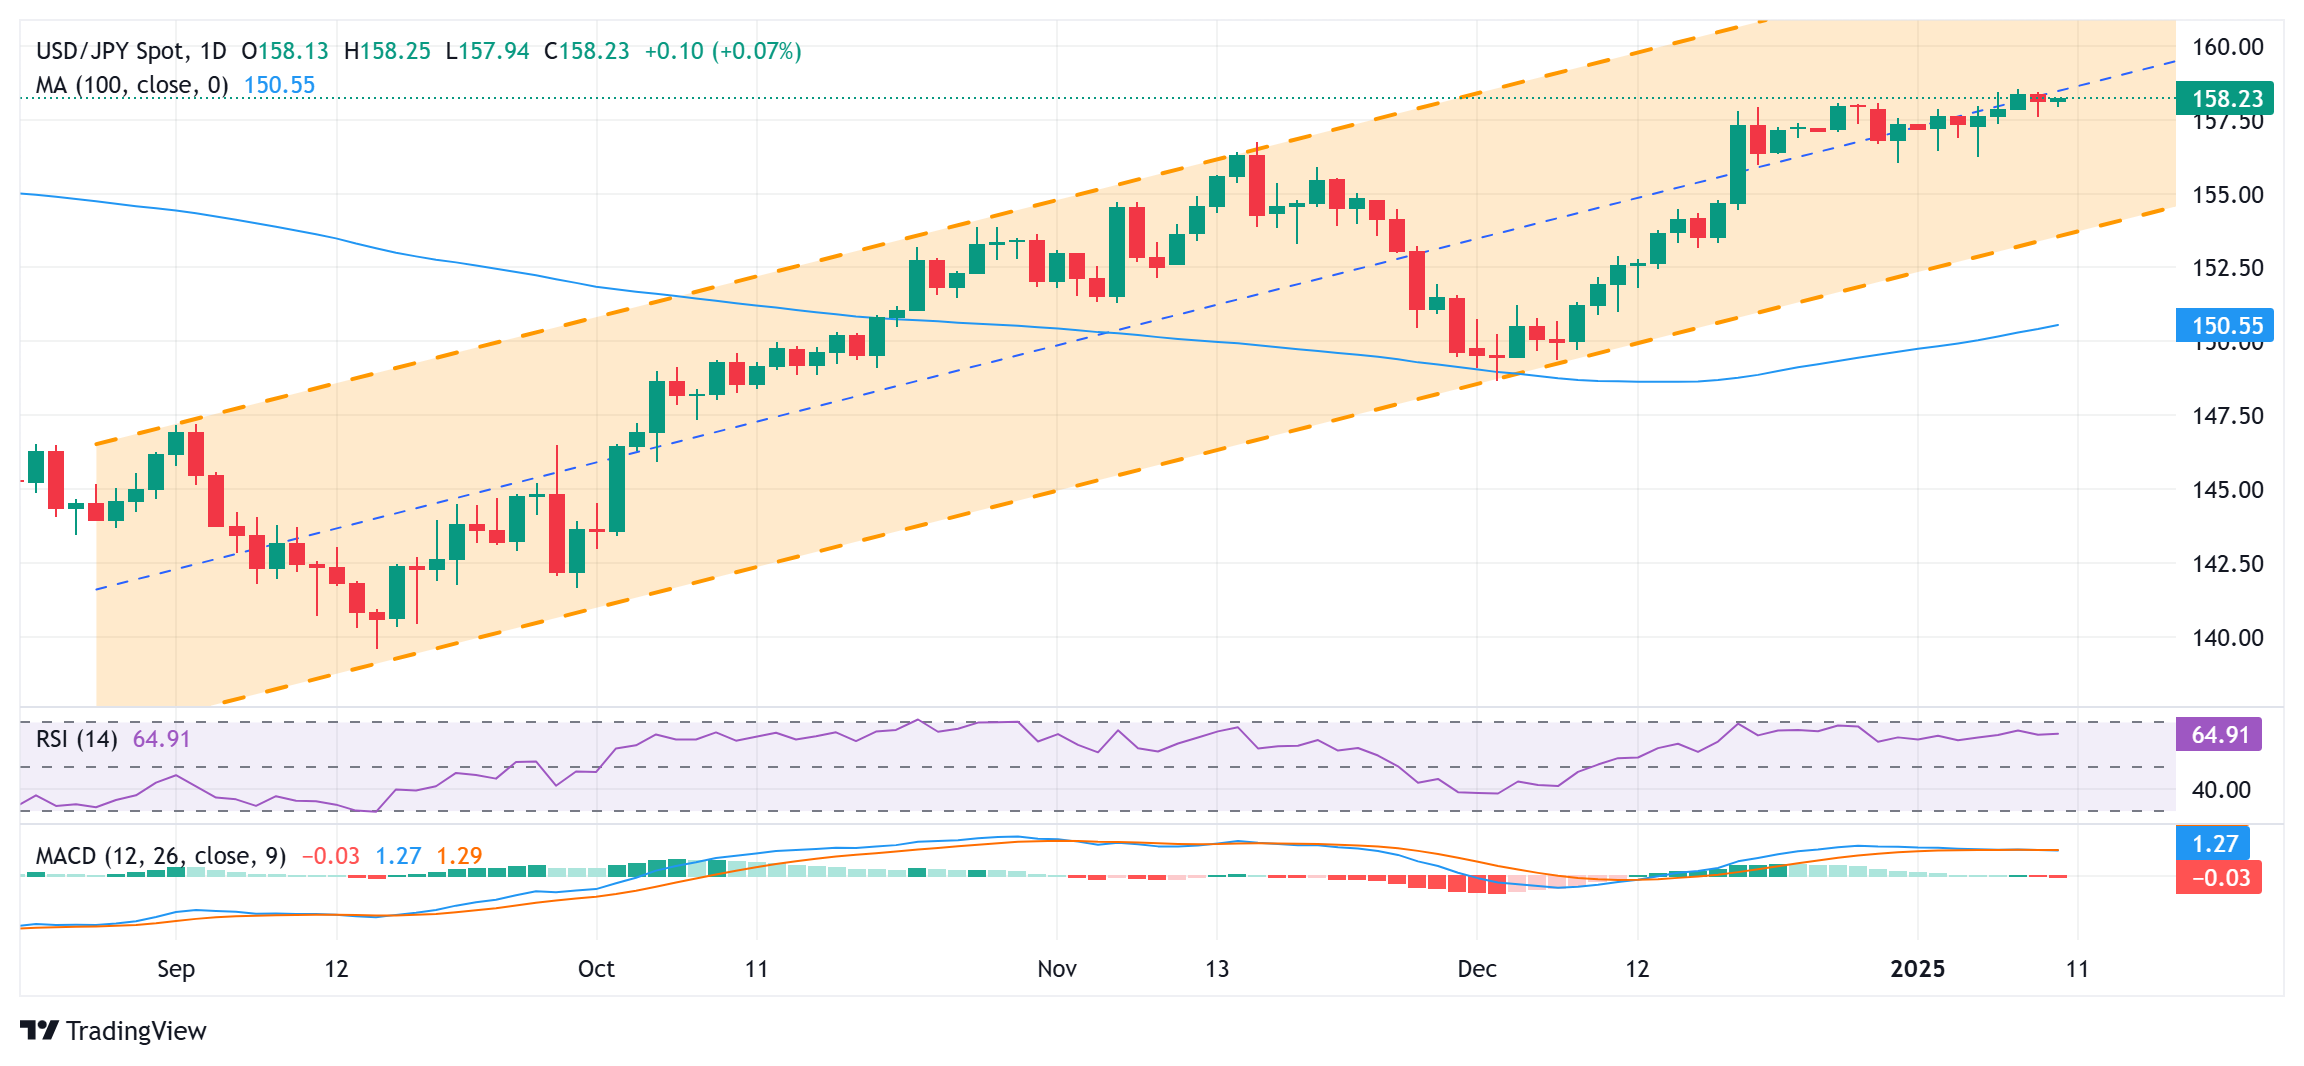
From a technical perspective, the near-term bias remains tilted in favor of bullish traders, though the recent range-bound price action makes it prudent to wait for some meaningful buying before positioning for any further gains. The 158.55 area, or the multi-month top touched on Wednesday, could act as an immediate hurdle, above which the USD/JPY pair could aim to reclaim the 159.00 mark. The momentum could extend further towards the 159.45 intermediate hurdle en route to the 160.00 psychological mark.
On the flip side, the overnight swing low, around the 157.60-157.55 region, might continue to protect the immediate downside. Some follow-through selling, however, could make the USD/JPY pair vulnerable to accelerate the slide towards the 157.00 mark en route to the next relevant support near the 156.75 region and the weekly low, around the 156.25-156.20 area. This is followed by the 156.00 mark, which if broken decisively might shift the near-term bias in favor of bearish traders and pave the way for deeper losses.
Japanese Yen FAQs
The Japanese Yen (JPY) is one of the world’s most traded currencies. Its value is broadly determined by the performance of the Japanese economy, but more specifically by the Bank of Japan’s policy, the differential between Japanese and US bond yields, or risk sentiment among traders, among other factors.
One of the Bank of Japan’s mandates is currency control, so its moves are key for the Yen. The BoJ has directly intervened in currency markets sometimes, generally to lower the value of the Yen, although it refrains from doing it often due to political concerns of its main trading partners. The BoJ ultra-loose monetary policy between 2013 and 2024 caused the Yen to depreciate against its main currency peers due to an increasing policy divergence between the Bank of Japan and other main central banks. More recently, the gradually unwinding of this ultra-loose policy has given some support to the Yen.
Over the last decade, the BoJ’s stance of sticking to ultra-loose monetary policy has led to a widening policy divergence with other central banks, particularly with the US Federal Reserve. This supported a widening of the differential between the 10-year US and Japanese bonds, which favored the US Dollar against the Japanese Yen. The BoJ decision in 2024 to gradually abandon the ultra-loose policy, coupled with interest-rate cuts in other major central banks, is narrowing this differential.
The Japanese Yen is often seen as a safe-haven investment. This means that in times of market stress, investors are more likely to put their money in the Japanese currency due to its supposed reliability and stability. Turbulent times are likely to strengthen the Yen’s value against other currencies seen as more risky to invest in.
-
03:11
Australian Dollar depreciates due to rising odds of an RBA rate cut in February
- The Australian Dollar declines as the ANZ now forecasts a 25 basis points rate cut by the RBA in February.
- China's latest inflation data, which underscored rising deflationary risks, offered no support to the AUD.
- The US Dollar continues to receive support following the latest hawkish FOMC Meeting Minutes.
The Australian Dollar (AUD) extends its losses for the fourth consecutive day against the US Dollar (USD), with the AUD/USD pair hovering near two-year lows on Friday. The AUD receives downward pressure as the ANZ is now forecasting a 25 basis points (bps) rate cut by the Reserve Bank of Australia (RBA) in February. Traders are now focused on US labor market data including Nonfarm Payrolls (NFP), for additional policy direction insights.
The AUD found no support from China's latest inflation data, which highlighted increasing deflationary risks. China's Consumer Price Index (CPI) increased by 0.1% year-over-year in December, slightly lower than the 0.2% rise in November, matching market expectations. Monthly, CPI inflation remained unchanged at 0% in December, aligning with estimates, following a 0.6% decline in November. Any change in Chinese economic conditions could impact the Australian markets as both nations are close trading partners.
Traders digested data showing Australia's Retail Sales, a key indicator of consumer spending, increased by 0.8% month-on-month in November, up from the 0.5% growth recorded in October (revised from 0.6%). However, the figure fell short of market expectations, which had anticipated a 1.0% rise.
The Australian Dollar faced challenges as the trimmed mean, a closely watched measure of core inflation, fell to an annual 3.2% from 3.5%, edging closer to the Reserve Bank of Australia's (RBA) target band of 2% to 3%. Markets are currently divided on whether the RBA will act in February, but a quarter-point rate cut in April is fully priced in.
Australian Dollar continues to decline amid increased hawkish mood surrounding Fed
- The US Dollar Index (DXY), which tracks the US Dollar’s (USD) performance against six major currencies, remains steady above 109.00. The Greenback gained support from hawkish Federal Open Market Committee (FOMC) Meeting Minutes and uncertainties surrounding tariff plans proposed by the incoming Trump administration.
- The latest FOMC Meeting Minutes indicated that policymakers agree that the process could take longer than previously anticipated due to recent hotter-than-expected readings on inflation and the effects of potential changes in trade and immigration policy under President-elect Trump’s administration.
- Federal Reserve Board of Governors member Michelle Bowman added her voice to a chorus of Fed speakers this week as policymakers work double-duty to try and smooth over market reactions to a much tighter pace of rate cuts in 2025 than many market participants had previously anticipated.
- Kansas Fed President Jeffrey Schmid made headlines on Thursday, stating that most of the Federal Reserve's mandated targets have recently been achieved. Schmid emphasized the need to reduce the Fed's balance sheet, suggesting that interest rate policy is approaching its long-term equilibrium. He noted that any future rate cuts should be gradual and guided by economic data.
- US Initial Jobless Claims fell to 201,000 for the week ending January 3, beating the 218,000 consensus. ADP Employment Change rose by 122K in December, though below market expectations of 140K.
- The US ISM Services PMI increased to 54.1 in November, up from 52.1, exceeding the market expectation of 53.3. The Prices Paid Index, which reflects inflation, rose significantly to 64.4 from 58.2, while the Employment Index dipped slightly to 51.4 from 51.5.
- According to Bloomberg, Federal Reserve Bank of Atlanta President Raphael Bostic stated on Tuesday that Fed officials should exercise caution with policy decisions due to uneven progress in reducing inflation. Bostic emphasized the need to lean toward keeping interest rates elevated to ensure the achievement of price stability goals.
- Richmond Fed President Thomas Barkin highlighted on Friday that the benchmark policy rate should remain restrictive until there is greater confidence that inflation will return to the 2% target. Meanwhile, Fed Governor Adriana Kugler and San Francisco Fed President Mary Daly underscored the challenging balancing act facing US central bankers as they aim to slow the pace of monetary easing this year.
- Australia's trade surplus rose to 7,079 million in November, surpassing the expected 5,750 million and the previous reading of 5,670 million (revised from 5,953 million). Exports increased by 4.8% month-on-month (MoM) in November, up from 3.5% (revised from 3.6%) in October. Meanwhile, imports grew by 1.7% MoM in November, compared to 0% (revised from 0.1%) in the previous month.
- Australia's monthly Consumer Price Index (CPI) rose 2.3% year-over-year in November, surpassing the market forecast of 2.2% and marking an increase from the 2.1% rise seen in the previous two months. This is the highest reading since August. However, the figure remains within the RBA’s target range of 2–3% for the fourth consecutive month, aided by the ongoing impact of the Energy Bill Relief Fund rebate.
Technical Analysis: Australian Dollar remains above 0.6200 near nine-day EMA
AUD/USD trades near 0.6200 on Friday, maintaining a bearish tone as it stays within a descending channel on the daily chart. The 14-day Relative Strength Index (RSI) hovers just above 30, indicating a risk of heightened bearish momentum.
Regarding its support, the AUD/USD pair could approach the lower boundary of the descending channel around the 0.5960 level.
The immediate resistance is seen near the nine-day Exponential Moving Average (EMA) at 0.6216, followed by the 14-day EMA at 0.6230. A stronger resistance level lies near the upper boundary of the descending channel, around 0.6240.
AUD/USD: Daily Chart
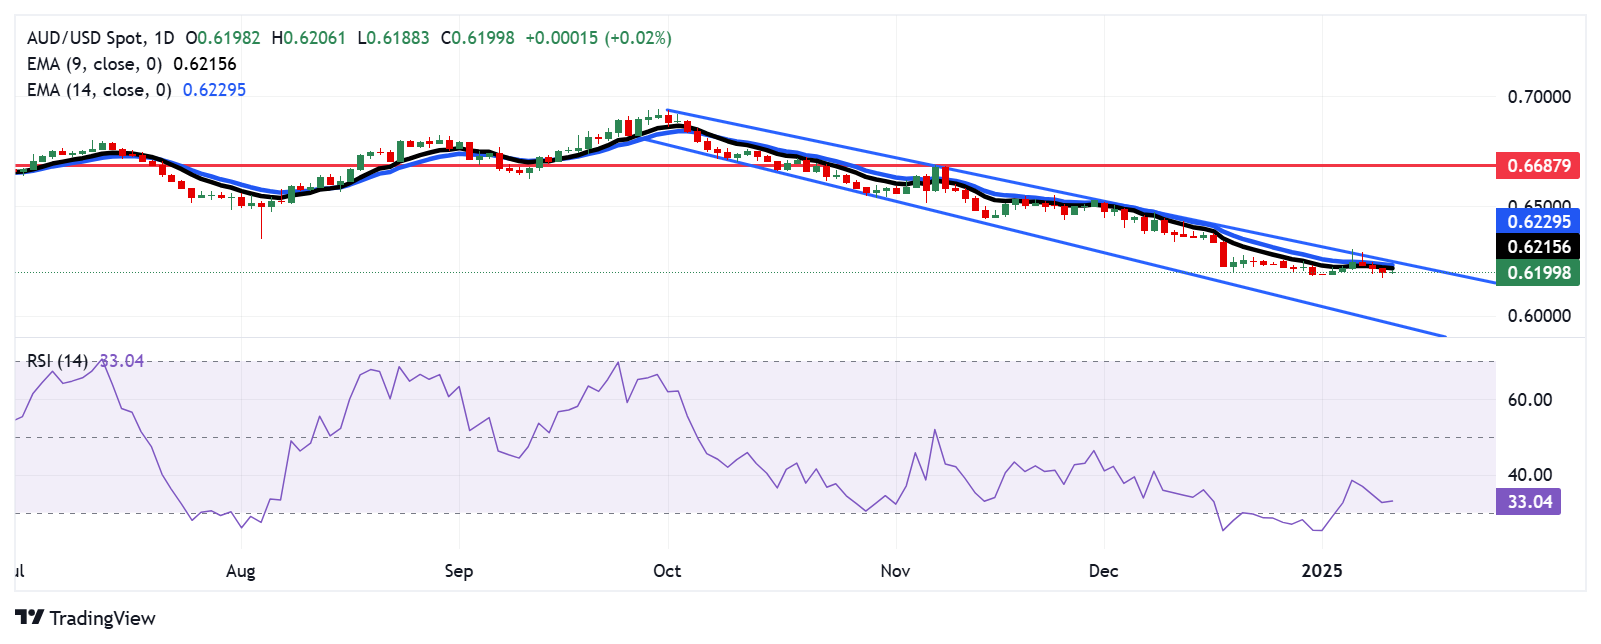
Australian Dollar PRICE Today
The table below shows the percentage change of Australian Dollar (AUD) against listed major currencies today. Australian Dollar was the weakest against the Swiss Franc.
USD EUR GBP JPY CAD AUD NZD CHF USD 0.01% 0.08% 0.05% 0.10% -0.01% 0.03% -0.03% EUR -0.01% 0.07% 0.02% 0.08% -0.02% 0.01% -0.04% GBP -0.08% -0.07% -0.02% 0.02% -0.09% -0.05% -0.11% JPY -0.05% -0.02% 0.02% 0.05% -0.05% -0.03% -0.07% CAD -0.10% -0.08% -0.02% -0.05% -0.11% -0.06% -0.13% AUD 0.00% 0.02% 0.09% 0.05% 0.11% 0.04% -0.02% NZD -0.03% -0.01% 0.05% 0.03% 0.06% -0.04% -0.06% CHF 0.03% 0.04% 0.11% 0.07% 0.13% 0.02% 0.06% The heat map shows percentage changes of major currencies against each other. The base currency is picked from the left column, while the quote currency is picked from the top row. For example, if you pick the Australian Dollar from the left column and move along the horizontal line to the US Dollar, the percentage change displayed in the box will represent AUD (base)/USD (quote).
Australian Dollar FAQs
One of the most significant factors for the Australian Dollar (AUD) is the level of interest rates set by the Reserve Bank of Australia (RBA). Because Australia is a resource-rich country another key driver is the price of its biggest export, Iron Ore. The health of the Chinese economy, its largest trading partner, is a factor, as well as inflation in Australia, its growth rate and Trade Balance. Market sentiment – whether investors are taking on more risky assets (risk-on) or seeking safe-havens (risk-off) – is also a factor, with risk-on positive for AUD.
The Reserve Bank of Australia (RBA) influences the Australian Dollar (AUD) by setting the level of interest rates that Australian banks can lend to each other. This influences the level of interest rates in the economy as a whole. The main goal of the RBA is to maintain a stable inflation rate of 2-3% by adjusting interest rates up or down. Relatively high interest rates compared to other major central banks support the AUD, and the opposite for relatively low. The RBA can also use quantitative easing and tightening to influence credit conditions, with the former AUD-negative and the latter AUD-positive.
China is Australia’s largest trading partner so the health of the Chinese economy is a major influence on the value of the Australian Dollar (AUD). When the Chinese economy is doing well it purchases more raw materials, goods and services from Australia, lifting demand for the AUD, and pushing up its value. The opposite is the case when the Chinese economy is not growing as fast as expected. Positive or negative surprises in Chinese growth data, therefore, often have a direct impact on the Australian Dollar and its pairs.
Iron Ore is Australia’s largest export, accounting for $118 billion a year according to data from 2021, with China as its primary destination. The price of Iron Ore, therefore, can be a driver of the Australian Dollar. Generally, if the price of Iron Ore rises, AUD also goes up, as aggregate demand for the currency increases. The opposite is the case if the price of Iron Ore falls. Higher Iron Ore prices also tend to result in a greater likelihood of a positive Trade Balance for Australia, which is also positive of the AUD.
The Trade Balance, which is the difference between what a country earns from its exports versus what it pays for its imports, is another factor that can influence the value of the Australian Dollar. If Australia produces highly sought after exports, then its currency will gain in value purely from the surplus demand created from foreign buyers seeking to purchase its exports versus what it spends to purchase imports. Therefore, a positive net Trade Balance strengthens the AUD, with the opposite effect if the Trade Balance is negative.
-
02:54
PBOC stalls treasury bond buying citing short supply
The People's Bank of China (PBOC) announced on Friday that it has halted treasury bond purchases temporarily due to short supply of the bonds.
The Chinese central bank’s declaration comes after repeated warnings of bubble risks in country’s red-hot bond market.
Market reaction
The Chinese Yuan has come under moderate selling pressure despite the above decision, with USD/CNY rising 0.25% on the day to near 7.3485 at press time.
-
02:18
Japan’s Akazawa: 'Critical stage' in eradicating the public's deflationary mindset
Japan economy minister Ryosei Akazawa said on Friday that Japan’s economy is at a 'critical stage' in eradicating the public's deflationary mindset.
Key quotes
No change to the government's stance to work closely with the BOJ on policy with an eye on the economy and prices.
In deciding whether to declare a full exit from deflation, what's important is to ensure Japan does not slip back into deflation again.
Once we are able to declare a full end to deflation, we can relieve ourselves from deploying the tools we had in store to fight deflation.
Japan's economy is at a 'critical stage' in eradicating the public's deflationary mindset and shifting to a phase where growth is spearheaded by higher wages and investment.Market reaction
At the time of writing, the USD/JPY pair is trading near 158.03, holding lower while losing 0.06% on the day
Japanese Yen FAQs
The Japanese Yen (JPY) is one of the world’s most traded currencies. Its value is broadly determined by the performance of the Japanese economy, but more specifically by the Bank of Japan’s policy, the differential between Japanese and US bond yields, or risk sentiment among traders, among other factors.
One of the Bank of Japan’s mandates is currency control, so its moves are key for the Yen. The BoJ has directly intervened in currency markets sometimes, generally to lower the value of the Yen, although it refrains from doing it often due to political concerns of its main trading partners. The BoJ ultra-loose monetary policy between 2013 and 2024 caused the Yen to depreciate against its main currency peers due to an increasing policy divergence between the Bank of Japan and other main central banks. More recently, the gradually unwinding of this ultra-loose policy has given some support to the Yen.
Over the last decade, the BoJ’s stance of sticking to ultra-loose monetary policy has led to a widening policy divergence with other central banks, particularly with the US Federal Reserve. This supported a widening of the differential between the 10-year US and Japanese bonds, which favored the US Dollar against the Japanese Yen. The BoJ decision in 2024 to gradually abandon the ultra-loose policy, coupled with interest-rate cuts in other major central banks, is narrowing this differential.
The Japanese Yen is often seen as a safe-haven investment. This means that in times of market stress, investors are more likely to put their money in the Japanese currency due to its supposed reliability and stability. Turbulent times are likely to strengthen the Yen’s value against other currencies seen as more risky to invest in.
-
02:16
PBOC sets USD/CNY reference rate at 7.1891 vs. 7.1886 previous
On Friday, the People’s Bank of China (PBoC) set the USD/CNY central rate for the trading session ahead at 7.1891 as compared to the previous day's fix of 7.1886 and 7.3138 Reuters estimates.
-
02:09
WTI holds steady above $73.50 amid stronger US Dollar, potential supply disruptions
- WTI price trades on a flat note near $73.65 in Friday’s early Asian session.
- A firmer Greenback undermines the USD-denominated WTI price.
- Potential supply disruptions due to geopolitical tensions and increasing demands could cap the downside for WTI.
West Texas Intermediate (WTI), the US crude oil benchmark, is trading around $73.65 on Friday. The WTI price flat lines as the stronger US Dollar (USD) broadly offsets concerns over supply disruptions.
A strengthening of the USD on the cautious stance of the US Federal Reserve (Fed) undermines the WTI price as it makes oil more expensive for holders of other currencies.
FOMC Minutes released on Wednesday showed that the Fed policymakers expressed concern about inflation and the impact that President-elect Donald Trump’s policies could have. Fed officials indicated that they would be moving more slowly on rate reductions because of the uncertainty.
On the other hand, mounting concerns over supply disruptions and increasing demands could support the black gold. The Biden administration plans to impose more sanctions on Russia's oil exports ahead of Donald Trump's inauguration on January 20.
Data released by the American Petroleum Institute (API) and the Energy Information Administration (EIA) earlier this week showed the US oil inventory declined last week, signalling rising energy demand amid a harsh winter in the US, Europe, and Asia.
WTI Oil FAQs
WTI Oil is a type of Crude Oil sold on international markets. The WTI stands for West Texas Intermediate, one of three major types including Brent and Dubai Crude. WTI is also referred to as “light” and “sweet” because of its relatively low gravity and sulfur content respectively. It is considered a high quality Oil that is easily refined. It is sourced in the United States and distributed via the Cushing hub, which is considered “The Pipeline Crossroads of the World”. It is a benchmark for the Oil market and WTI price is frequently quoted in the media.
Like all assets, supply and demand are the key drivers of WTI Oil price. As such, global growth can be a driver of increased demand and vice versa for weak global growth. Political instability, wars, and sanctions can disrupt supply and impact prices. The decisions of OPEC, a group of major Oil-producing countries, is another key driver of price. The value of the US Dollar influences the price of WTI Crude Oil, since Oil is predominantly traded in US Dollars, thus a weaker US Dollar can make Oil more affordable and vice versa.
The weekly Oil inventory reports published by the American Petroleum Institute (API) and the Energy Information Agency (EIA) impact the price of WTI Oil. Changes in inventories reflect fluctuating supply and demand. If the data shows a drop in inventories it can indicate increased demand, pushing up Oil price. Higher inventories can reflect increased supply, pushing down prices. API’s report is published every Tuesday and EIA’s the day after. Their results are usually similar, falling within 1% of each other 75% of the time. The EIA data is considered more reliable, since it is a government agency.
OPEC (Organization of the Petroleum Exporting Countries) is a group of 12 Oil-producing nations who collectively decide production quotas for member countries at twice-yearly meetings. Their decisions often impact WTI Oil prices. When OPEC decides to lower quotas, it can tighten supply, pushing up Oil prices. When OPEC increases production, it has the opposite effect. OPEC+ refers to an expanded group that includes ten extra non-OPEC members, the most notable of which is Russia.
-
01:30
Stocks. Daily history for Thursday, January 9, 2025
Index Change, points Closed Change, % NIKKEI 225 -375.97 39605.09 -0.94 Hang Seng -38.95 19240.89 -0.2 KOSPI 0.85 2521.9 0.03 ASX 200 -19.9 8329.2 -0.24 DAX -12.84 20317.1 -0.06 CAC 40 37.86 7490.28 0.51 -
01:18
USD/CAD extends the rally above 1.4400, Canadian/US employment data in focus
- USD/CAD gains traction to near 1.4400 in Friday’s early Asian session.
- Fed officials signal a rate cut caution, boosting the USD.
- Trump’s tariff threats weigh on the Loonie, but a rise in crude oil prices might cap its downside.
The USD/CAD pair trades in positive territory for the fourth consecutive day around 1.4400 during the early Asian session on Friday. The cautious stance of the US Federal Reserve (Fed) continues to underpin the Greenback. All eyes will be on the US and Canadian labor market data for December.
The potential tariffs from the incoming Donald Trump administration have triggered inflation concerns and heightened expectations the US central bank will take a slower path of interest rate cuts this year, supporting the US Dollar (USD).
The latest Federal Open Market Committee (FOMC) minutes indicated that policymakers agree that the process could take longer than previously anticipated due to recent hotter-than-expected readings on inflation and the effects of potential changes in trade and immigration policy under President-elect Trump’s administration.
Traders will closely watch the development surrounding the likely trade war between the United States and Canada. On Thursday, Canadian Prime Minister Justin Trudeau said that he would definitely respond if Trump does impose tariffs. Meanwhile, higher crude oil prices could help limit the Canadian Dollar’s (CAD) losses as Canada is the largest oil exporter to the United States.Canadian Dollar FAQs
The key factors driving the Canadian Dollar (CAD) are the level of interest rates set by the Bank of Canada (BoC), the price of Oil, Canada’s largest export, the health of its economy, inflation and the Trade Balance, which is the difference between the value of Canada’s exports versus its imports. Other factors include market sentiment – whether investors are taking on more risky assets (risk-on) or seeking safe-havens (risk-off) – with risk-on being CAD-positive. As its largest trading partner, the health of the US economy is also a key factor influencing the Canadian Dollar.
The Bank of Canada (BoC) has a significant influence on the Canadian Dollar by setting the level of interest rates that banks can lend to one another. This influences the level of interest rates for everyone. The main goal of the BoC is to maintain inflation at 1-3% by adjusting interest rates up or down. Relatively higher interest rates tend to be positive for the CAD. The Bank of Canada can also use quantitative easing and tightening to influence credit conditions, with the former CAD-negative and the latter CAD-positive.
The price of Oil is a key factor impacting the value of the Canadian Dollar. Petroleum is Canada’s biggest export, so Oil price tends to have an immediate impact on the CAD value. Generally, if Oil price rises CAD also goes up, as aggregate demand for the currency increases. The opposite is the case if the price of Oil falls. Higher Oil prices also tend to result in a greater likelihood of a positive Trade Balance, which is also supportive of the CAD.
While inflation had always traditionally been thought of as a negative factor for a currency since it lowers the value of money, the opposite has actually been the case in modern times with the relaxation of cross-border capital controls. Higher inflation tends to lead central banks to put up interest rates which attracts more capital inflows from global investors seeking a lucrative place to keep their money. This increases demand for the local currency, which in Canada’s case is the Canadian Dollar.
Macroeconomic data releases gauge the health of the economy and can have an impact on the Canadian Dollar. Indicators such as GDP, Manufacturing and Services PMIs, employment, and consumer sentiment surveys can all influence the direction of the CAD. A strong economy is good for the Canadian Dollar. Not only does it attract more foreign investment but it may encourage the Bank of Canada to put up interest rates, leading to a stronger currency. If economic data is weak, however, the CAD is likely to fall.
-
01:15
Currencies. Daily history for Thursday, January 9, 2025
Pare Closed Change, % AUDUSD 0.61951 -0.25 EURJPY 162.87 -0.26 EURUSD 1.0299 -0.17 GBPJPY 194.627 -0.49 GBPUSD 1.23089 -0.39 NZDUSD 0.55997 -0.17 USDCAD 1.43943 0.14 USDCHF 0.91226 0.11 USDJPY 158.116 -0.13 -
00:50
Japan JP Foreign Reserves declined to $1230.7B in December from previous $1239B
-
00:37
EUR/USD stuck in familiar territory ahead of NFP Friday
- EUR/USD remains stuck to the 1.0300 handle after flubbing 1.0400.
- EU data is done for the week, but a key US NFP print still lies ahead.
- US net jobs additions are expected to ease back in December.
EUR/USD trimmed further into the bearish side on Thursday, falling back a scant but persistent sixth of a percent and keeping bids nailed to the 1.0300 handle as the pair churns near 26-month lows.
European Retail Sales figures missed expectations in November, hobbling any potential bullish Euro momentum heading into Friday’s US Nonfarm Payrolls (NFP) print. Annualized EU Retail Sales slumped to just 1.2% YoY in December, well below November’s revised print of 2.1%.
American markets were dark on Thursday in a day of mourning in observance of the passing of former President Jimmy Carter, who passed away in December at the age of 100. Market participants got a reprieve from the week’s hectic US data release schedule, but another round of Friday NFP jobs figures is looming ahead, further constraining already tight market volumes. US job additions are expected to ease slightly in December, while wage growth is forecast to hold on the flat side and even ease in the monthly figures. Beats in wage and job growth could spell further chaos for broad-market rate cut hopes looking forward to 2025, as high wages keep inflation expectations on the high end. Still, strong employment figures mean the Federal Reserve (Fed) will have little reason to move policy rates.
EUR/USD price forecast
January just started, but Fiber is already on pace to close a fourth consecutive month in the red as the pair kicks the new trading off with a fresh bearish plunge into its lowest bids in over two years. The Euro has fallen sharply against the US Dollar since a bearish rejection from the 200-day Exponential Moving Average (EMA) near the 1.0900 region back in November. EUR/USD fell a little over 6.5% peak-to-trough, and Euro bulls are struggling to find a fresh foothold.
EUR/USD daily chart
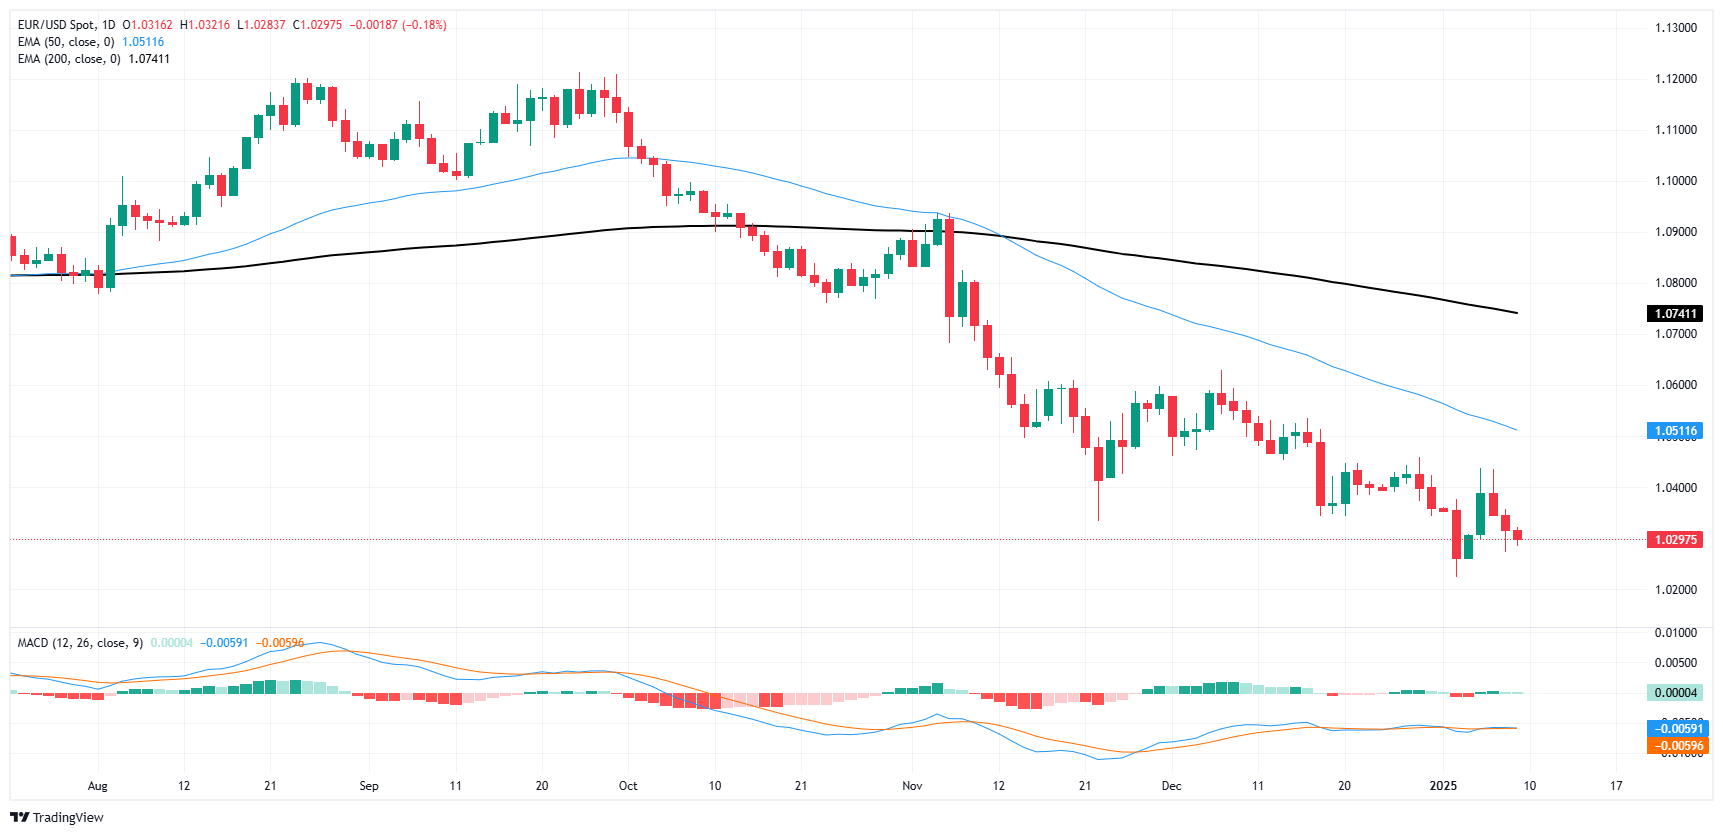
Euro FAQs
The Euro is the currency for the 19 European Union countries that belong to the Eurozone. It is the second most heavily traded currency in the world behind the US Dollar. In 2022, it accounted for 31% of all foreign exchange transactions, with an average daily turnover of over $2.2 trillion a day. EUR/USD is the most heavily traded currency pair in the world, accounting for an estimated 30% off all transactions, followed by EUR/JPY (4%), EUR/GBP (3%) and EUR/AUD (2%).
The European Central Bank (ECB) in Frankfurt, Germany, is the reserve bank for the Eurozone. The ECB sets interest rates and manages monetary policy. The ECB’s primary mandate is to maintain price stability, which means either controlling inflation or stimulating growth. Its primary tool is the raising or lowering of interest rates. Relatively high interest rates – or the expectation of higher rates – will usually benefit the Euro and vice versa. The ECB Governing Council makes monetary policy decisions at meetings held eight times a year. Decisions are made by heads of the Eurozone national banks and six permanent members, including the President of the ECB, Christine Lagarde.
Eurozone inflation data, measured by the Harmonized Index of Consumer Prices (HICP), is an important econometric for the Euro. If inflation rises more than expected, especially if above the ECB’s 2% target, it obliges the ECB to raise interest rates to bring it back under control. Relatively high interest rates compared to its counterparts will usually benefit the Euro, as it makes the region more attractive as a place for global investors to park their money.
Data releases gauge the health of the economy and can impact on the Euro. Indicators such as GDP, Manufacturing and Services PMIs, employment, and consumer sentiment surveys can all influence the direction of the single currency. A strong economy is good for the Euro. Not only does it attract more foreign investment but it may encourage the ECB to put up interest rates, which will directly strengthen the Euro. Otherwise, if economic data is weak, the Euro is likely to fall. Economic data for the four largest economies in the euro area (Germany, France, Italy and Spain) are especially significant, as they account for 75% of the Eurozone’s economy.
Another significant data release for the Euro is the Trade Balance. This indicator measures the difference between what a country earns from its exports and what it spends on imports over a given period. If a country produces highly sought after exports then its currency will gain in value purely from the extra demand created from foreign buyers seeking to purchase these goods. Therefore, a positive net Trade Balance strengthens a currency and vice versa for a negative balance.
-
00:30
Japan Overall Household Spending (YoY) registered at -0.4% above expectations (-0.6%) in November
-
00:26
Canadian PM Justin Trudeau: We would definitely respond if Trump does impose tariffs
Canadian Prime Minister Justin Trudeau said Thursday that he would definitely respond if Trump does impose tariffs.
Trudeau further stated that President-elect Donald Trump’s threat of slapping a 25% tariff on Canadian products would ultimately hurt American consumers and businesses. Canada, Mexico, and China are the US’s biggest trade partners.Market reaction
The USD/CAD pair is trading 0.08% higher on the day at 1.4399, as of writing.
Canadian Dollar FAQs
The key factors driving the Canadian Dollar (CAD) are the level of interest rates set by the Bank of Canada (BoC), the price of Oil, Canada’s largest export, the health of its economy, inflation and the Trade Balance, which is the difference between the value of Canada’s exports versus its imports. Other factors include market sentiment – whether investors are taking on more risky assets (risk-on) or seeking safe-havens (risk-off) – with risk-on being CAD-positive. As its largest trading partner, the health of the US economy is also a key factor influencing the Canadian Dollar.
The Bank of Canada (BoC) has a significant influence on the Canadian Dollar by setting the level of interest rates that banks can lend to one another. This influences the level of interest rates for everyone. The main goal of the BoC is to maintain inflation at 1-3% by adjusting interest rates up or down. Relatively higher interest rates tend to be positive for the CAD. The Bank of Canada can also use quantitative easing and tightening to influence credit conditions, with the former CAD-negative and the latter CAD-positive.
The price of Oil is a key factor impacting the value of the Canadian Dollar. Petroleum is Canada’s biggest export, so Oil price tends to have an immediate impact on the CAD value. Generally, if Oil price rises CAD also goes up, as aggregate demand for the currency increases. The opposite is the case if the price of Oil falls. Higher Oil prices also tend to result in a greater likelihood of a positive Trade Balance, which is also supportive of the CAD.
While inflation had always traditionally been thought of as a negative factor for a currency since it lowers the value of money, the opposite has actually been the case in modern times with the relaxation of cross-border capital controls. Higher inflation tends to lead central banks to put up interest rates which attracts more capital inflows from global investors seeking a lucrative place to keep their money. This increases demand for the local currency, which in Canada’s case is the Canadian Dollar.
Macroeconomic data releases gauge the health of the economy and can have an impact on the Canadian Dollar. Indicators such as GDP, Manufacturing and Services PMIs, employment, and consumer sentiment surveys can all influence the direction of the CAD. A strong economy is good for the Canadian Dollar. Not only does it attract more foreign investment but it may encourage the Bank of Canada to put up interest rates, leading to a stronger currency. If economic data is weak, however, the CAD is likely to fall.
-
00:11
GBP/USD taps new 14-month low as NFP watch begins
- GBP/USD sank to its lowest bids in over a year on Thursday.
- Markets are coiling ahead of another NFP Friday data dump.
- Pound-Dollar rate differential may widen further, weakening Cable even more.
GBP/USD tapped a fresh 14-month low on Thursday as the Pound Sterling rolls over further against the Greenback. Holiday-thinned markets are keeping one foot firmly in the safe haven US Dollar as investors await a fresh round of US Nonfarm Payrolls (NFP) data on Friday.
UK Chief Secretary to the Treasury Darren Jones spoke on Thursday, noting that UK financial markets continue to function in an “orderly way.” UK financial markets responded by promptly selling the Pound Sterling even further and stepping up their bets of further rate cuts from the Bank of England (BoE) throughout the year.
American markets were dark on Thursday, shuttered in a day of mourning in observance of the passing of former President Jimmy Carter, who passed away in December at the age of 100. Maretk participants got a reprieve from the week’s hectic US data release schedule, but another round of Friday NFP jobs figures are looming ahead, further constraining already-tight market volumes. US jobs additions are expected to ease slightly in December, while wage growth is forecast to hold on the flat side, and even ease in the monthly figures. Beats in wage and jobs growth could spell further chaos for broad-market rate cut hopes looking forward into 2025, as high wages keep inflation expectations on the high end and still-strong employment figures mean the Federal Reserve (Fed) will have little reason to move policy rates.
GBP/USD price forecast
A near-term bullish recovery for GBP/USD fizzled faster than it started, with a two-day win streak followed by a three-day losing run, sending Cable tumbling a little under 3% top-to-bottom this week. Price action has found fresh 14-month lows, but Pound Sterling bulls are still trying to put in a floor above the 1.2200 handle.
A continued backslide will see Cable retesting 15-month lows just above the 1.2000 major handle, a level the pair hasn’t had to contend with in almost two years.
GBP/USD daily chart
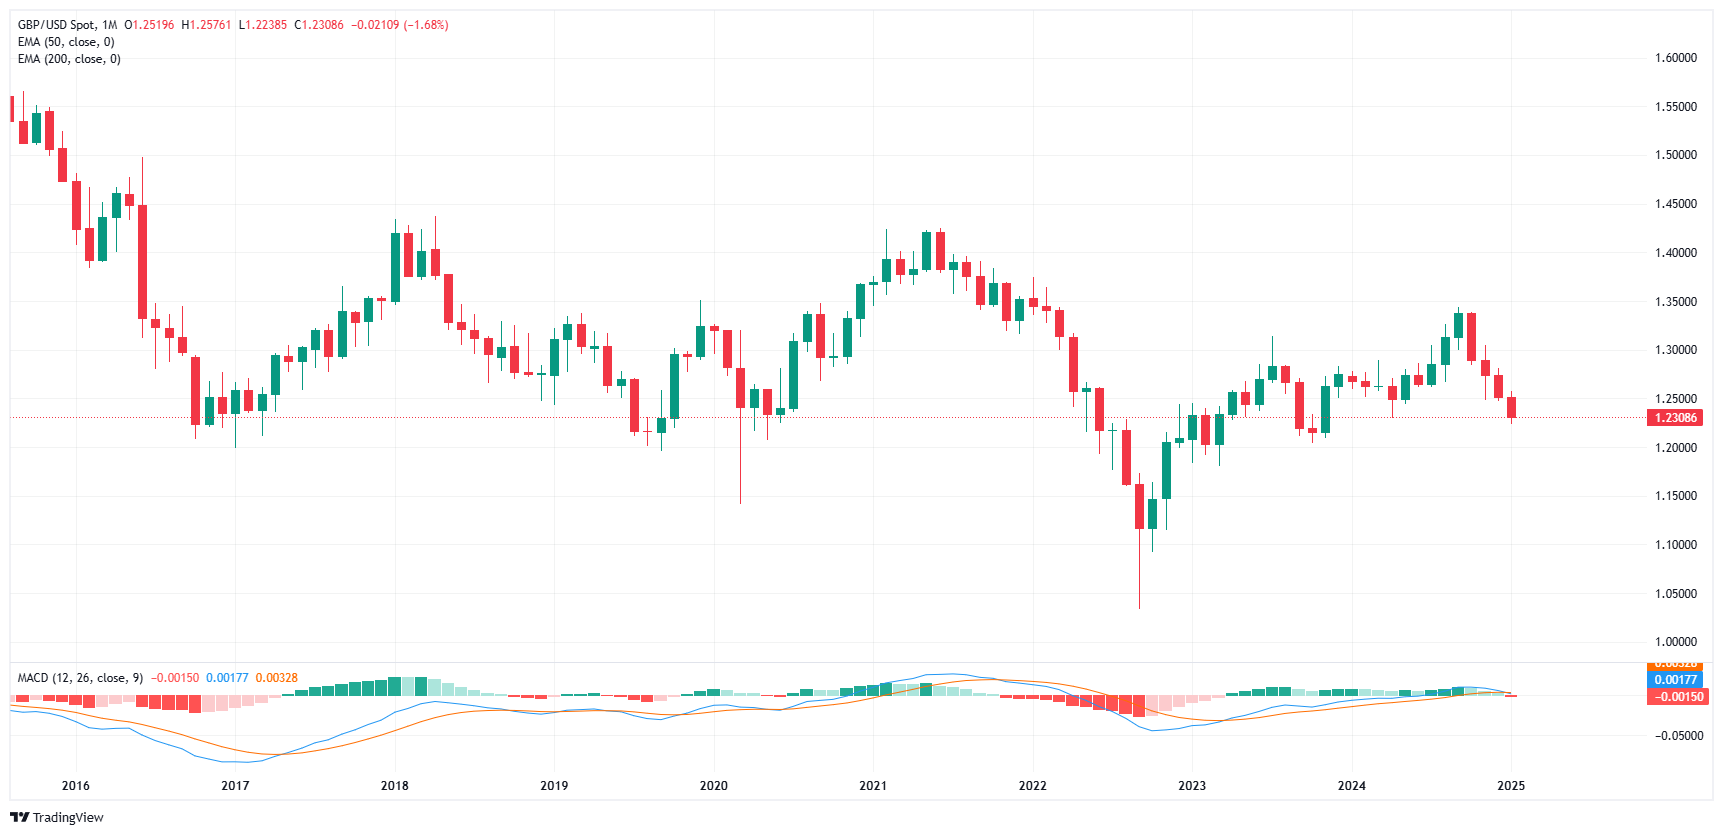
Pound Sterling FAQs
The Pound Sterling (GBP) is the oldest currency in the world (886 AD) and the official currency of the United Kingdom. It is the fourth most traded unit for foreign exchange (FX) in the world, accounting for 12% of all transactions, averaging $630 billion a day, according to 2022 data. Its key trading pairs are GBP/USD, also known as ‘Cable’, which accounts for 11% of FX, GBP/JPY, or the ‘Dragon’ as it is known by traders (3%), and EUR/GBP (2%). The Pound Sterling is issued by the Bank of England (BoE).
The single most important factor influencing the value of the Pound Sterling is monetary policy decided by the Bank of England. The BoE bases its decisions on whether it has achieved its primary goal of “price stability” – a steady inflation rate of around 2%. Its primary tool for achieving this is the adjustment of interest rates. When inflation is too high, the BoE will try to rein it in by raising interest rates, making it more expensive for people and businesses to access credit. This is generally positive for GBP, as higher interest rates make the UK a more attractive place for global investors to park their money. When inflation falls too low it is a sign economic growth is slowing. In this scenario, the BoE will consider lowering interest rates to cheapen credit so businesses will borrow more to invest in growth-generating projects.
Data releases gauge the health of the economy and can impact the value of the Pound Sterling. Indicators such as GDP, Manufacturing and Services PMIs, and employment can all influence the direction of the GBP. A strong economy is good for Sterling. Not only does it attract more foreign investment but it may encourage the BoE to put up interest rates, which will directly strengthen GBP. Otherwise, if economic data is weak, the Pound Sterling is likely to fall.
Another significant data release for the Pound Sterling is the Trade Balance. This indicator measures the difference between what a country earns from its exports and what it spends on imports over a given period. If a country produces highly sought-after exports, its currency will benefit purely from the extra demand created from foreign buyers seeking to purchase these goods. Therefore, a positive net Trade Balance strengthens a currency and vice versa for a negative balance.
-
00:10
NZD/USD softens to near 0.5600 amid China deflation pressure
- NZD/USD weakens to near 0.5600 in Friday’s early Asian session.
- The Fed plans to slow the pace of interest rate cuts this year, lifting the USD.
- Deflation risk in China weighs on the Kiwi.
The NZD/USD pair remains weak to around 0.5600 during the early Asian session on Friday. The firmer Greenback and deflation concerns in China weigh on the New Zealand Dollar (NZD). The US December employment data will be the highlights later on Friday, including Nonfarm Payrolls (NFP), Unemployment Rate and Average Hourly Earnings.
The US Federal Reserve (Fed) officials adopted a cautious stance this year due to inflation risks and uncertainty under the incoming Trump administration, which supports the US Dollar (USD). Several Fed policymakers suggested that the US central bank will move more slowly on rate cuts this year, after cutting at each of its last three meetings in 2024.
The US Bureau of Labor Statistics (BLS) will publish the employment report for December later in the day. Economists expect 160,000 new jobs for December, while the unemployment rate is expected to remain at 4.2% during the same report period. The Average Hourly Earnings are projected to rise by 0.3% MoM in December. Any signs of a strong labor market, steady job growth, and rising incomes could boost the USD and act as a headwind for NZD/USD.
Deflationary pressures in China came despite months of effort by policymakers to stimulate demand. The country’s Consumer Price Index (CPI) increased 0.1% YoY in December, while the Producer Price Index (PPI) declined 2.3% YoY during the same period, sliding for the 27th straight month. This, in turn, exerts some selling pressure on the Kiwi, as China is a major trading partner to New Zealand.
New Zealand Dollar FAQs
The New Zealand Dollar (NZD), also known as the Kiwi, is a well-known traded currency among investors. Its value is broadly determined by the health of the New Zealand economy and the country’s central bank policy. Still, there are some unique particularities that also can make NZD move. The performance of the Chinese economy tends to move the Kiwi because China is New Zealand’s biggest trading partner. Bad news for the Chinese economy likely means less New Zealand exports to the country, hitting the economy and thus its currency. Another factor moving NZD is dairy prices as the dairy industry is New Zealand’s main export. High dairy prices boost export income, contributing positively to the economy and thus to the NZD.
The Reserve Bank of New Zealand (RBNZ) aims to achieve and maintain an inflation rate between 1% and 3% over the medium term, with a focus to keep it near the 2% mid-point. To this end, the bank sets an appropriate level of interest rates. When inflation is too high, the RBNZ will increase interest rates to cool the economy, but the move will also make bond yields higher, increasing investors’ appeal to invest in the country and thus boosting NZD. On the contrary, lower interest rates tend to weaken NZD. The so-called rate differential, or how rates in New Zealand are or are expected to be compared to the ones set by the US Federal Reserve, can also play a key role in moving the NZD/USD pair.
Macroeconomic data releases in New Zealand are key to assess the state of the economy and can impact the New Zealand Dollar’s (NZD) valuation. A strong economy, based on high economic growth, low unemployment and high confidence is good for NZD. High economic growth attracts foreign investment and may encourage the Reserve Bank of New Zealand to increase interest rates, if this economic strength comes together with elevated inflation. Conversely, if economic data is weak, NZD is likely to depreciate.
The New Zealand Dollar (NZD) tends to strengthen during risk-on periods, or when investors perceive that broader market risks are low and are optimistic about growth. This tends to lead to a more favorable outlook for commodities and so-called ‘commodity currencies’ such as the Kiwi. Conversely, NZD tends to weaken at times of market turbulence or economic uncertainty as investors tend to sell higher-risk assets and flee to the more-stable safe havens.
-
00:03
Colombia Consumer Price Index (MoM) above forecasts (0.41%) in December: Actual (0.46%)
-
00:03
Colombia Consumer Price Index (YoY) came in at 5.25%, above expectations (5.16%) in December
-
