Noticias del mercado
-
23:07
South Korea Export Price Growth (YoY): 10.7% (December) vs 7%
-
22:49
NZD/USD Price Analysis: mild bounce overshadowed by multi-year lows
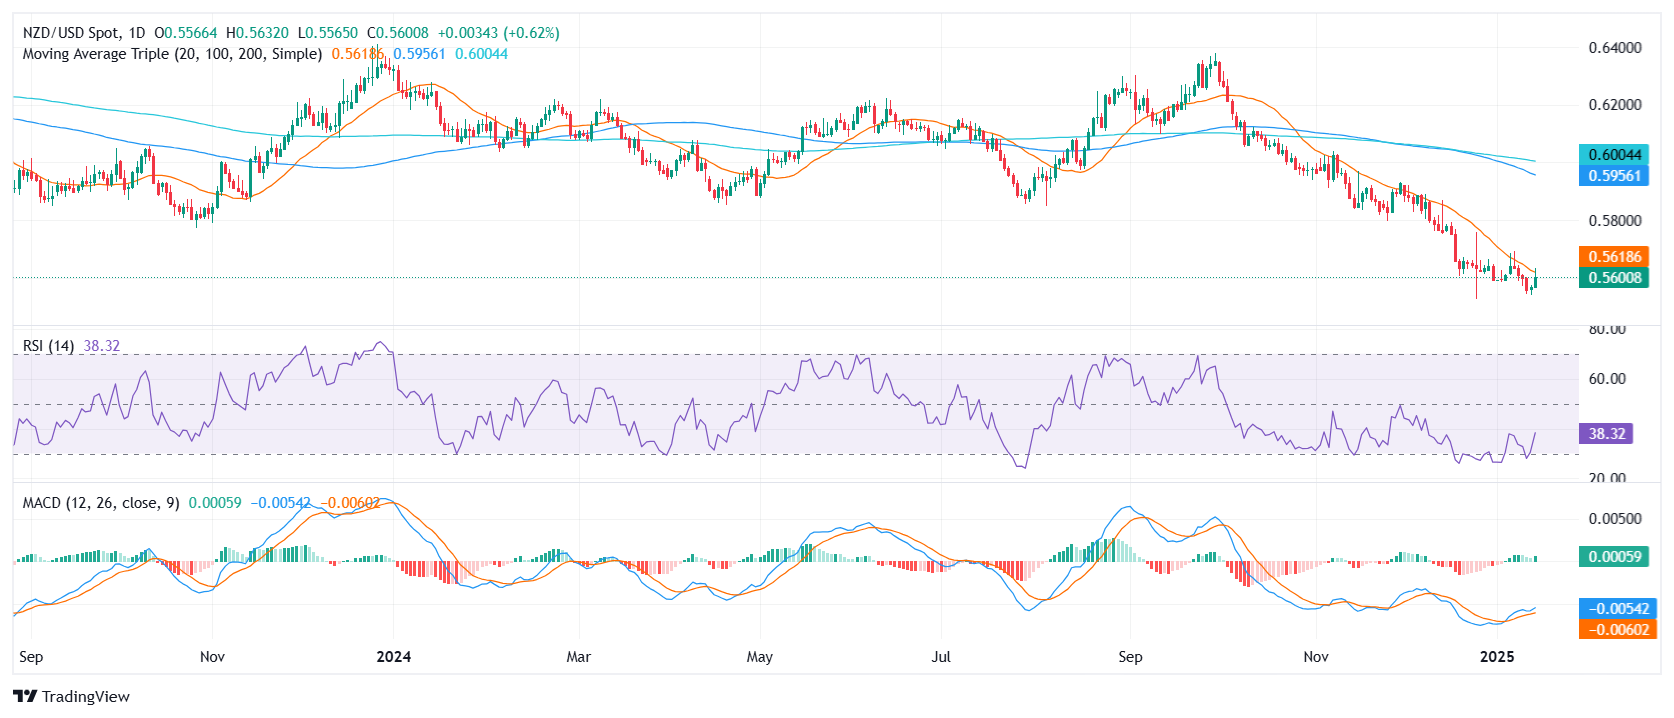
- NZD/USD edges up 0.11% on Tuesday, hovering near 0.5600 after a brief recovery attempt.
- MACD histogram shows decreasing green bars, pointing to limited follow-through despite the rebound.
The NZD/USD pair gained modestly on Tuesday, inching up to approximately 0.5600 following a prolonged slump to levels unseen since October 2022. Although this slight uptick provides temporary relief from the recent selling streak, the overarching bias remains tilted to the downside.
From a technical perspective, the Relative Strength Index (RSI) has climbed to 43, an indication of some stabilizing momentum while still embedded in negative territory. Meanwhile, the Moving Average Convergence Divergence (MACD) histogram is printing fewer green bars, suggesting that any ongoing recovery could be fragile without additional bullish impetus.
On the downside, should the pair fail to hold above 0.5570, sellers may seize control once more, potentially targeting the 0.5530 mark. Conversely, a rally beyond the 0.5620 region could set the stage for a test of 0.5650, though any extended move higher would likely hinge on a more decisive shift in market sentiment.
NZD/USD daily chart
-
22:38
United States API Weekly Crude Oil Stock came in at -2.6M, above expectations (-3.5M) in January 10
-
22:21
Gold price climb on investors renewed Fed easing hopes
- Gold rebounds from weekly low, fueled by hopes for looser Fed policy after weak PPI.
- Focus on upcoming CPI; cooler report could boost chances for rate cuts.
- Potential Trump tariffs pose a risk to inflation, impacting Gold and market sentiment.
Gold prices edged higher on Tuesday after data from the United States (US) showed that prices paid by producers cooled off. This kept traders hopeful for additional monetary policy easing by the US Federal Reserve (Fed). At the time of writing, the XAU/USD trades at $2,675, up 0.46%.
The yellow metal recovered after beginning the week on the back foot, down over 1%. The US Bureau of Labor Statistics (BLS) revealed that the Producer Price Index (PPI) increased but missed estimates for a higher print. This exacerbated Gold’s jump as traders grew optimistic that if the Consumer Price Index (CPI) report on Wednesday comes cooler than foreseen, it could increase the Fed’s chances of easing policy during the year.
Market participants are eyeing the CPI release on Wednesday. If December prints are below the prior month’s 2.7% number, it could indicate that the disinflation process continues. Inflation has risen since October to 2.6%, following September’s 2.4% YoY increase.
Traders had priced in 29.4 basis points of easing by the Federal Reserve in 2025. But a cool CPI report could bolster bullion prices.
Earlier, Kansas City Fed President Jeffrey Schmid stated that the Fed would act if Trump’s tariffs threw inflation or jobs off course.
In six days, US President-elect Donald Trump will take office. He has threatened to impose universal tariffs, though focused mainly on China, Canada and Mexico. If he goes ahead with this, analysts have mentioned that a trade war could reignite inflation.
Bullion prices are also taking a hit amid good news of a possible deal that could end Gaza's war, according to Reuters, which cited an official briefed on the matter.
In the US, key data releases include consumer inflation figures, Retail Sales and jobless claims for the week ending January 11.
Daily digest market movers: Gold price advances on steady US yields
- Gold price shrugs off higher US real yields, which remain at around 2.34%.
- The US Dollar retreated after the data, with the US Dollar Index (DXY) hitting 109.21, down 0.26%.
- The US 10-year Treasury bond yield remains unchanged at 4.794%.
- The US PPI in December rose 3.3% YoY, below forecasts of 3.4%. Excluding volatile items, the so-called Core PPI expanded by 3.5% YoY, up from November’s figures but beneath 3.8% expectations.
XAU/USD technical outlook: Gold price soars above $2,650 as bulls stepped in
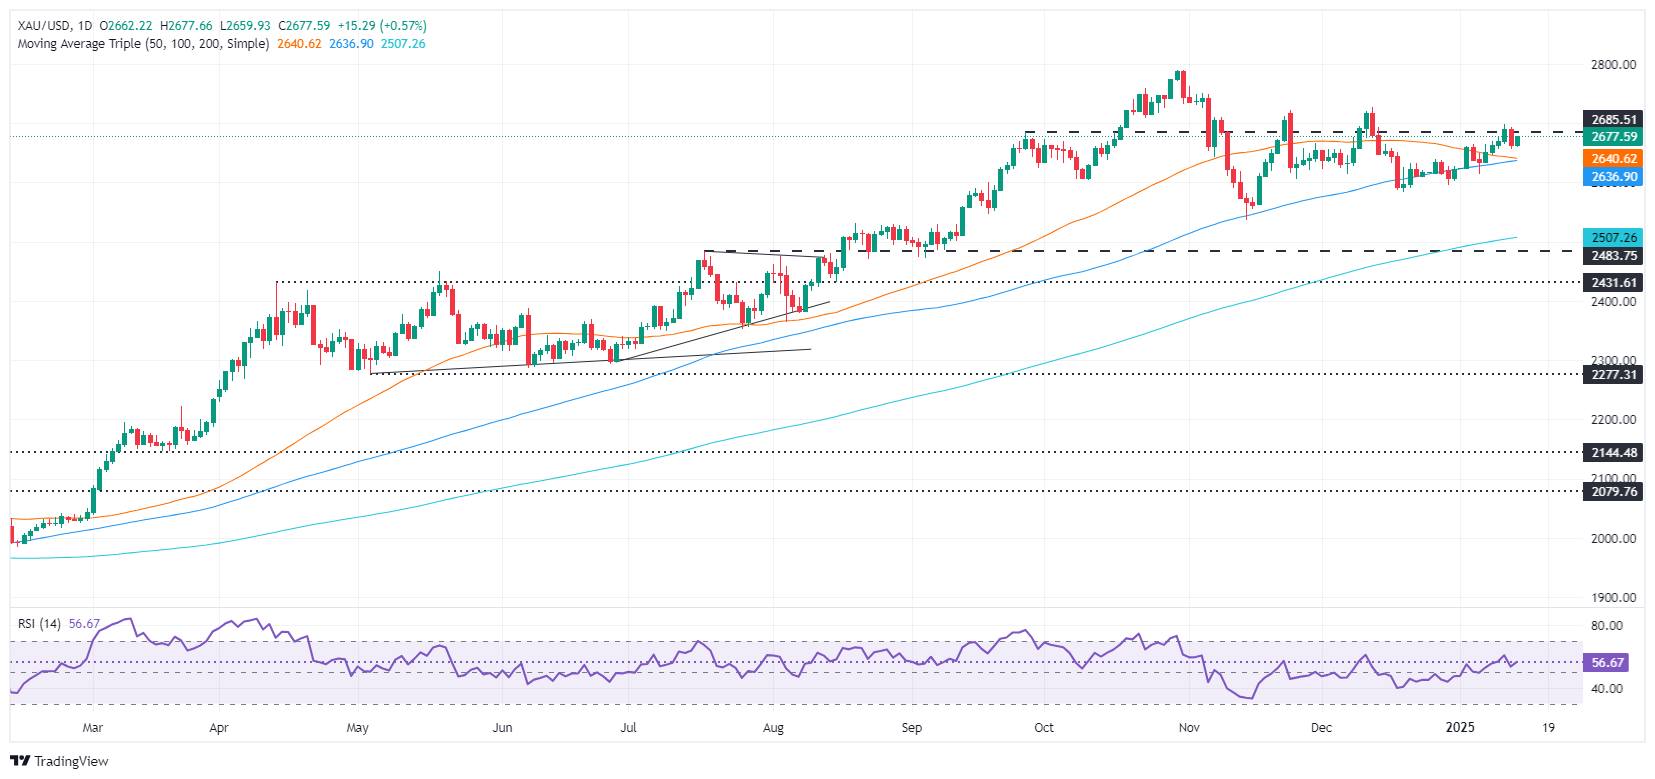
Gold price uptrend resumed after a ‘bearish engulfing’ chart pattern formed, inviting buyers to step in and increase prices. If Bullion clears $2,700, the next resistance would be the December 12 peak of $2,726, followed by the record high at $2,790.
Conversely, if XAU/USD drops below $2,650, the next support would be the 50-day Simple Moving Average (SMA) at $2,643, followed by the 100-day SMA at $2,633.
Gold FAQs
Gold has played a key role in human’s history as it has been widely used as a store of value and medium of exchange. Currently, apart from its shine and usage for jewelry, the precious metal is widely seen as a safe-haven asset, meaning that it is considered a good investment during turbulent times. Gold is also widely seen as a hedge against inflation and against depreciating currencies as it doesn’t rely on any specific issuer or government.
Central banks are the biggest Gold holders. In their aim to support their currencies in turbulent times, central banks tend to diversify their reserves and buy Gold to improve the perceived strength of the economy and the currency. High Gold reserves can be a source of trust for a country’s solvency. Central banks added 1,136 tonnes of Gold worth around $70 billion to their reserves in 2022, according to data from the World Gold Council. This is the highest yearly purchase since records began. Central banks from emerging economies such as China, India and Turkey are quickly increasing their Gold reserves.
Gold has an inverse correlation with the US Dollar and US Treasuries, which are both major reserve and safe-haven assets. When the Dollar depreciates, Gold tends to rise, enabling investors and central banks to diversify their assets in turbulent times. Gold is also inversely correlated with risk assets. A rally in the stock market tends to weaken Gold price, while sell-offs in riskier markets tend to favor the precious metal.
The price can move due to a wide range of factors. Geopolitical instability or fears of a deep recession can quickly make Gold price escalate due to its safe-haven status. As a yield-less asset, Gold tends to rise with lower interest rates, while higher cost of money usually weighs down on the yellow metal. Still, most moves depend on how the US Dollar (USD) behaves as the asset is priced in dollars (XAU/USD). A strong Dollar tends to keep the price of Gold controlled, whereas a weaker Dollar is likely to push Gold prices up.
-
22:00
South Korea Import Price Growth (YoY) up to 7% in December from previous 3%
-
22:00
New Zealand NZIER Business Confidence (QoQ) up to 16% in 4Q from previous -1%
-
21:28
Australian Dollar rebounds from multi-year lows but upside remains limited
- AUD edges up to 0.6180 on Tuesday, off multi-year lows.
- Fed rate-hold expectations in January underpin the US Dollar.
- Soft Australian fundamentals, China slowdown cap Aussie recovery.
The Australian Dollar (AUD) rebounded from 0.6130, its lowest level since April 2020, to reach 0.6180 on Tuesday, buoyed by firm commodity prices and a slight improvement in market sentiment. Despite this partial comeback, the pair still remains vulnerable amid a dovish Reserve Bank of Australia (RBA) and an uncertain local economic outlook.
Daily digest market movers: Aussie sees some light after soft PPI data from the US
- The US Dollar Index (DXY) retreats after Monday’s gains but keeps an overall firm tone, supported by the Fed’s likely rate hold in January.
- Producer Price Index (PPI) data in the US rose 3.3% year-over-year for December, missing the 3.4% forecast; core PPI reached 3.5%, also below estimates.
- Following the data, US Treasury yields dropped, favouring the pair’s upside, but the USD’s outlook remains favourable.
- Consumer Price Index data on Wednesday will be key for the pair’s trajectory.
AUD/USD technical outlook: Bulls eye 20-day SMA as pair hovers near oversold territory
The Relative Strength Index (RSI) stands at 42, rising sharply but still in negative territory, while the Moving Average Convergence Divergence (MACD) histogram prints flat red bars, indicating only modest relief for bulls. While the Aussie has managed to halt its latest losing streak, the pair remains near April 2020 lows. Any sustained recovery may require a clear break above the 20-day Simple Moving Average (SMA), which is currently acting as a barrier to further upside.
Australian Dollar FAQs
One of the most significant factors for the Australian Dollar (AUD) is the level of interest rates set by the Reserve Bank of Australia (RBA). Because Australia is a resource-rich country another key driver is the price of its biggest export, Iron Ore. The health of the Chinese economy, its largest trading partner, is a factor, as well as inflation in Australia, its growth rate and Trade Balance. Market sentiment – whether investors are taking on more risky assets (risk-on) or seeking safe-havens (risk-off) – is also a factor, with risk-on positive for AUD.
The Reserve Bank of Australia (RBA) influences the Australian Dollar (AUD) by setting the level of interest rates that Australian banks can lend to each other. This influences the level of interest rates in the economy as a whole. The main goal of the RBA is to maintain a stable inflation rate of 2-3% by adjusting interest rates up or down. Relatively high interest rates compared to other major central banks support the AUD, and the opposite for relatively low. The RBA can also use quantitative easing and tightening to influence credit conditions, with the former AUD-negative and the latter AUD-positive.
China is Australia’s largest trading partner so the health of the Chinese economy is a major influence on the value of the Australian Dollar (AUD). When the Chinese economy is doing well it purchases more raw materials, goods and services from Australia, lifting demand for the AUD, and pushing up its value. The opposite is the case when the Chinese economy is not growing as fast as expected. Positive or negative surprises in Chinese growth data, therefore, often have a direct impact on the Australian Dollar and its pairs.
Iron Ore is Australia’s largest export, accounting for $118 billion a year according to data from 2021, with China as its primary destination. The price of Iron Ore, therefore, can be a driver of the Australian Dollar. Generally, if the price of Iron Ore rises, AUD also goes up, as aggregate demand for the currency increases. The opposite is the case if the price of Iron Ore falls. Higher Iron Ore prices also tend to result in a greater likelihood of a positive Trade Balance for Australia, which is also positive of the AUD.
The Trade Balance, which is the difference between what a country earns from its exports versus what it pays for its imports, is another factor that can influence the value of the Australian Dollar. If Australia produces highly sought after exports, then its currency will gain in value purely from the surplus demand created from foreign buyers seeking to purchase its exports versus what it spends to purchase imports. Therefore, a positive net Trade Balance strengthens the AUD, with the opposite effect if the Trade Balance is negative.
-
20:59
Canadian Dollar catches some relief as Greenback eases
- The Canadian Dollar gained a slim 0.3%, but remains mired in congestion.
- Canada remains absent from the data docket on Tuesday.
- Cooler-than-expected US PPI inflation figures calm market tensions.
The Canadian Dollar (CAD) caught a thin bid on Tuesday, bostlered by a general easing in US Dollar flows after US Producer Price Index (PPI) inflation accelerated at a slower pace than markets expected in December. Traders’ hopes that this week’s US Consumer Price Index (CPI) print will also come in below expectations have been reignited following the PPI print, although the figure is ultimately expected to rise over previous periods.
Canada remains almost entirely absent from the economic data release schedule this week, with only low-tier data on the offering. The Bank of Canada (BoC) is broadly expected to continue trimming rates while the Federal Reserve (Fed) is slated to hold off on any further rates cuts through the first half of 2025, which will widen the CAD’s rate differential against the Greenback.
Daily digest market movers: CAD gets a step up thanks to US data
- The Canadian Dollar is up, forcing the USD/CAD pair back down below the 1.400 handle, but market flows remain one-sided as the Loonie lacks intrinsic momentum.
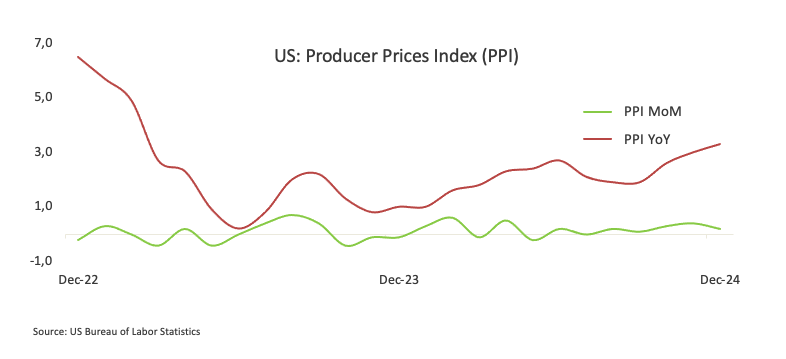
- PPI inflation figures eased broadly below expectations in December, with headline PPI printing at just 0.2% MoM.
- Investors were expecting a downtick to 0.3% from the previous 0.4%.
- Core PPI, excluding price increases in volatile food and energy prices, was flat in December versus the forecast of 0.3% and 0.2% last.
- headline PPI inflation rose to 3.3% YoY versus the previous figure of 3.0%, while core PPI accelerated to 3.5% YoY compared to the previous 3.4%.
Canadian Dollar price forecast: CAD set to continue rising as long as market holds off on USD bidding
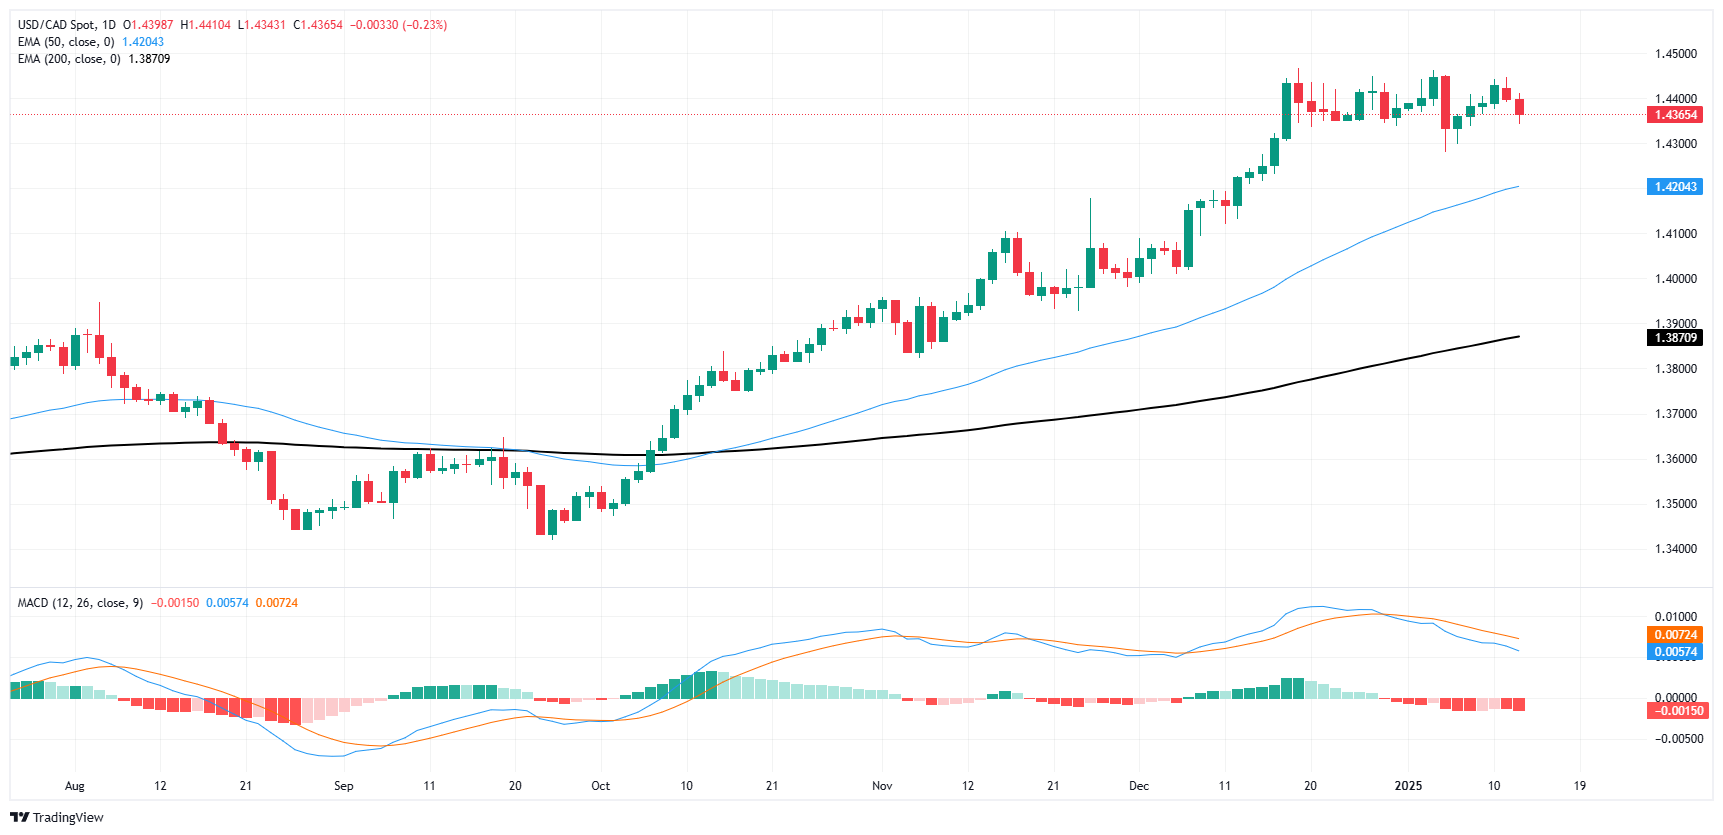
The Canadian Dollar’s gain on Tuesday amounted to one-third of one percent, a scant percentage with the Loonie parked near multi-year lows against the Greenback. Loonie bidders are struggling to push USD/CAD back into the latest swing low into the 1.4300 handle, but USD bulls continue to get wrapped up in a congestion zone around 1.4400, stamping in a tight consolidation range.
A lack of momentum is bleeding clear signals out of momentum oscillators, and long-run moving averages are beginning to catch up to bids, leaving candlesticks exposed to a difficult chart space looking forward.
USD/CAD daily chart
Canadian Dollar FAQs
The key factors driving the Canadian Dollar (CAD) are the level of interest rates set by the Bank of Canada (BoC), the price of Oil, Canada’s largest export, the health of its economy, inflation and the Trade Balance, which is the difference between the value of Canada’s exports versus its imports. Other factors include market sentiment – whether investors are taking on more risky assets (risk-on) or seeking safe-havens (risk-off) – with risk-on being CAD-positive. As its largest trading partner, the health of the US economy is also a key factor influencing the Canadian Dollar.
The Bank of Canada (BoC) has a significant influence on the Canadian Dollar by setting the level of interest rates that banks can lend to one another. This influences the level of interest rates for everyone. The main goal of the BoC is to maintain inflation at 1-3% by adjusting interest rates up or down. Relatively higher interest rates tend to be positive for the CAD. The Bank of Canada can also use quantitative easing and tightening to influence credit conditions, with the former CAD-negative and the latter CAD-positive.
The price of Oil is a key factor impacting the value of the Canadian Dollar. Petroleum is Canada’s biggest export, so Oil price tends to have an immediate impact on the CAD value. Generally, if Oil price rises CAD also goes up, as aggregate demand for the currency increases. The opposite is the case if the price of Oil falls. Higher Oil prices also tend to result in a greater likelihood of a positive Trade Balance, which is also supportive of the CAD.
While inflation had always traditionally been thought of as a negative factor for a currency since it lowers the value of money, the opposite has actually been the case in modern times with the relaxation of cross-border capital controls. Higher inflation tends to lead central banks to put up interest rates which attracts more capital inflows from global investors seeking a lucrative place to keep their money. This increases demand for the local currency, which in Canada’s case is the Canadian Dollar.
Macroeconomic data releases gauge the health of the economy and can have an impact on the Canadian Dollar. Indicators such as GDP, Manufacturing and Services PMIs, employment, and consumer sentiment surveys can all influence the direction of the CAD. A strong economy is good for the Canadian Dollar. Not only does it attract more foreign investment but it may encourage the Bank of Canada to put up interest rates, leading to a stronger currency. If economic data is weak, however, the CAD is likely to fall.
-
20:48
Forex Today: Investors shift their focus to US CPI data
The Greenback traded on the defensive once again on Tuesday, testing two-day lows and weighed down by another tariff story as well as disappointing US Producer Prices, while market participants got ready for the release of the more relevant CPI on Wednesday.
Here is what you need to know on Wednesday, January 15:
The US Dollar Index (DXY) retreated to the low-109.00 amid weaker yields and the generalised recovery in the risk-associated assets. The release of the CPI will take centre stage, seconded by usual MBA Mortgage Applications, the NY Empire State Manufacturing Index, and the Fed Beige Book. In addition, the Fed’s Barkin, Kashkari, Williams, and Goolsbee are all due to speak.
EUR/USD rebounded further from Monday’s fresh cycle lows near 1.0180 and traded at shouting distance from the 1.0300 hurdle. Wholesale Prices in Germany and the Full Year GDP Growth are expected along with the speech by the ECB’s Lane and De Guindos.
Following a brief drop to the sub-1.2100 region, GBP/USD regained some composure and revisited the 1.2250 zone. Key UK Inflation Rate will be at the centre of the debate, seconded by a 10-year Gilt auction.
USD/JPY reversed three consecutive daily pullbacks and advanced to two-day highs just above the 158.00 barrier. The Reuters Tankan Index and Machine Tool Orders are due.
Renewed selling pressure in the Greenback allowed AUD/USD to briefly trespass the 0.6200 hurdle and print three-day peaks on Tuesday. Next of relevance in Oz will be the publication of the jobs report on January 16.
WTI prices gave away part of the recent three-day strong climb and slipped back below the $78.00 mark per barrel.
Gold prices resumed their ascent and retested the vicinity of the $2,680 mark per troy ounce encouraged by the weaker Dollar and lower yields. Silver prices traded with decent gains although another move above the key $30.00 mark per ounce remained elusive.
-
20:06
Argentina Consumer Price Index (MoM): 2.7% (December) vs 2.4%
-
20:00
United States Monthly Budget Statement registered at $-87B, below expectations ($-75B) in November
-
19:39
Mexican Peso rallies as US PPI shows moderate rise
- Mexican Peso strengthens as December US PPI data suggests easing inflation, lessening Fed pressure.
- Gross Fixed Investment data and President Sheinbaum's nearshoring incentives may further Peso influence.
- US focus on CPI; upcoming retail sales and jobless claims to guide Fed decisions.
The Mexican Peso recovered some ground against the US Dollar on Tuesday after US inflation data suggested that prices paid by producers rose moderately but below economists’ estimates. Although it didn’t change traders' views that the US Federal Reserve (Fed) could lower rates just once in 2025, the Greenback remained on the back foot, a headwind for USD/MXN, which trades at 20.45, down 0.95%.
Mexico’s economic docket remains scarce, but Gross Fixed Investment for October will be released on January 15. Meanwhile, President Claudia Sheinbaum presented a plan to boost nearshoring incentives and reduce the country’s imports from China.
In the US, the December Producer Price Index (PPI) dipped less than estimates, indicating that inflation has resumed its downward trend. Nevertheless, traders are eyeing the release of the latest Consumer Price Index (CPI) for the same period, which is expected to remain around familiar levels.
The US economic schedule will feature the CPI, Fed speakers, Retail Sales data and jobless claims data for the week ending January 11.
Daily digest market movers: Mexican Peso counterattacks ahead of US CPI report
- The Mexican currency advanced on news that the upcoming Trump team is considering gradual tariff hikes of 2% to 5% on a monthly basis.
- Sheinbaum’s “Plan Mexico” would offer incentives for nearshoring, including tax deductions, and develop plans for individual sectors. The decree, which will be published on January 17, offers incentives to domestic and foreign companies.
- Former Deputy Finance Minister Alejandro Werner said in an article by El Economista that the Mexican economy would enter a recession this year and could lose its investment-grade status before 2027.
- The US PPI rose by 3.3% YoY below estimates of 3.4%, up from 3%. Core PPI expanded 3.5% YoY, missed forecasts for a 3.8% increase, up a tenth from 3.4%.
- Last week, Banco de Mexico (Banxico) revealed December's meeting minutes. The minutes showed that inflation continues to trend lower, suggesting that the easing cycle might continue. Banxico's Governing board stated that "larger downward adjustments could be considered in some meetings."
- Kansas City Fed President Jeffrey Schmid said that the Fed will act if Trump’s tariffs throw inflation or jobs off course.
- The Fed's latest Meeting Minutes showed that despite reducing rates, some policymakers supported keeping the fed funds rate unchanged as worries had grown that inflation risks were skewed to the upside.
- Consequently, they adopted a more gradual approach as Fed officials opened the door to slowing the pace of interest rate cuts.
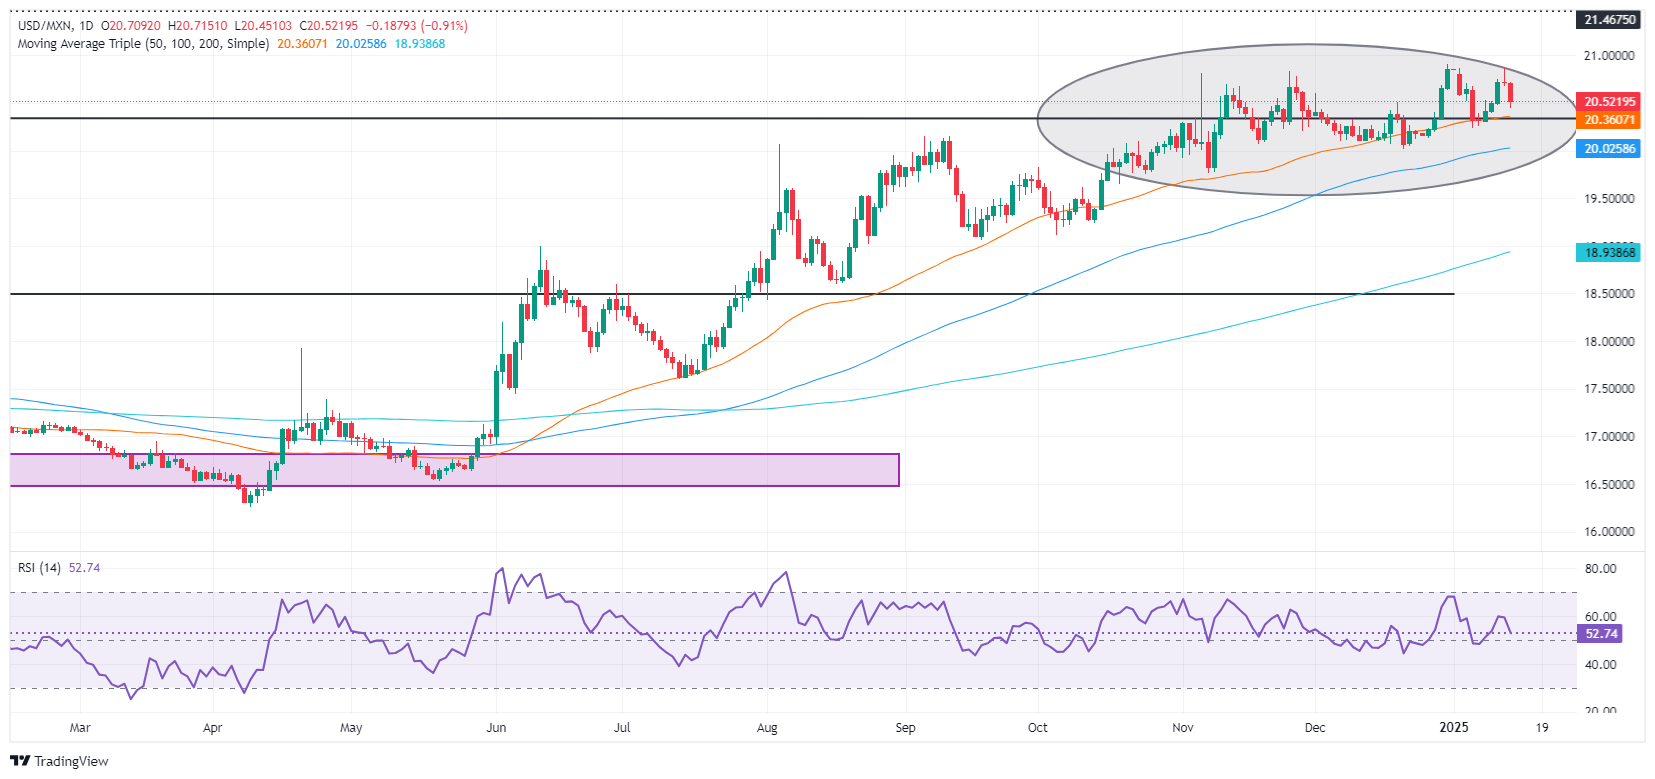
USD/MXN technical outlook: Mexican Peso recovers as USD/MXN falls below 20.50
The USD/MXN uptrend remains in place as long as buyers hold prices above the 50-day Simple Moving Average (SMA) of 20.32, but over the short-term momentum has shifted slightly bearish.
The Relative Strength Index (RSI) is bullish but aims down toward its neutral line, hinting that sellers are stepping in. Therefore, the USD/MXN first support will be the 50-day SMA, followed by the 20.00 figure. On further weakness, the 100-day SMA will be tested at 19.98.
Conversely, if USD/MXN rises past 20.50, the first resistance will be the year-to-date (YTD) peak of 20.90. If surpassed, the next stop would be the March 8, 2022 high of 21.46, ahead of 21.50 and the 22.00 psychological level.
Mexican Peso FAQs
The Mexican Peso (MXN) is the most traded currency among its Latin American peers. Its value is broadly determined by the performance of the Mexican economy, the country’s central bank’s policy, the amount of foreign investment in the country and even the levels of remittances sent by Mexicans who live abroad, particularly in the United States. Geopolitical trends can also move MXN: for example, the process of nearshoring – or the decision by some firms to relocate manufacturing capacity and supply chains closer to their home countries – is also seen as a catalyst for the Mexican currency as the country is considered a key manufacturing hub in the American continent. Another catalyst for MXN is Oil prices as Mexico is a key exporter of the commodity.
The main objective of Mexico’s central bank, also known as Banxico, is to maintain inflation at low and stable levels (at or close to its target of 3%, the midpoint in a tolerance band of between 2% and 4%). To this end, the bank sets an appropriate level of interest rates. When inflation is too high, Banxico will attempt to tame it by raising interest rates, making it more expensive for households and businesses to borrow money, thus cooling demand and the overall economy. Higher interest rates are generally positive for the Mexican Peso (MXN) as they lead to higher yields, making the country a more attractive place for investors. On the contrary, lower interest rates tend to weaken MXN.
Macroeconomic data releases are key to assess the state of the economy and can have an impact on the Mexican Peso (MXN) valuation. A strong Mexican economy, based on high economic growth, low unemployment and high confidence is good for MXN. Not only does it attract more foreign investment but it may encourage the Bank of Mexico (Banxico) to increase interest rates, particularly if this strength comes together with elevated inflation. However, if economic data is weak, MXN is likely to depreciate.
As an emerging-market currency, the Mexican Peso (MXN) tends to strive during risk-on periods, or when investors perceive that broader market risks are low and thus are eager to engage with investments that carry a higher risk. Conversely, MXN tends to weaken at times of market turbulence or economic uncertainty as investors tend to sell higher-risk assets and flee to the more-stable safe havens.
-
19:17
US Dollar dips as softer PPI data temper bullish momentum
- Traders exhibit caution following below-forecast US PPI figures that spark fresh inflation debates in global markets.
- President-elect Donald Trump’s potential remarks on tariffs and trade policies keep investors vigilant, unsure of the Dollar’s immediate trajectory.
- The Federal Reserve’s steady rate stance for January remains likely, but any inflation surprises could sway policy expectations again.
The US Dollar Index, which measures the value of the USD against a basket of currencies, is on the backfoot after the December Producer Price Index (PPI) was released. Traders are on edge over possible comments from President-elect Donald Trump on the above headline. The US Dollar Index (DXY) dips below 110.00 and looks for support to bounce back.
Daily digest market movers: USD eases on hot NFP report momentum as PPI disappoints
- December’s Producer Price Index (PPI) was softer than anticipated: core monthly PPI at 0.0% vs. 0.3% expected, headline at 0.2% vs. 0.3%, and yearly readings coming in below forecasts.
- The US Dollar weakened on this report, but analysts remain confident in the ongoing rally and view the tariff noise as short-lived.
- Inflation concerns persist, with sticky underlying price pressures suggesting the Federal Reserve (Fed) will retain its cautious easing pace into 2025.
- Yield softening sees the 10-year benchmark slip to around 4.80% from its 14-month high, reflecting market uncertainty post-PPI.
- CME FedWatch Tool shows that traders have already priced in the chance of unchanged rates at January’s meeting, underscoring the Fed’s data-dependent posture and potential Trump-driven volatility.
DXY technical outlook: Respite after softer data, but structure remains positive
The US Dollar Index witnessed a temporary dip below the 110.00 mark, pressured by profit-taking and underwhelming PPI numbers. Despite this pullback, the broader uptrend stays intact, hovering near multi-year highs. Indicators show a mild slowdown, hinting at a potential short-term consolidation phase. If profit-taking intensifies, the index may slip further, probably towards 107.00-108.00; however, strong fundamentals and robust Fed guidance suggest the Dollar could quickly find a bid, preserving its longer-term bullish bias.
US Dollar FAQs
The US Dollar (USD) is the official currency of the United States of America, and the ‘de facto’ currency of a significant number of other countries where it is found in circulation alongside local notes. It is the most heavily traded currency in the world, accounting for over 88% of all global foreign exchange turnover, or an average of $6.6 trillion in transactions per day, according to data from 2022. Following the second world war, the USD took over from the British Pound as the world’s reserve currency. For most of its history, the US Dollar was backed by Gold, until the Bretton Woods Agreement in 1971 when the Gold Standard went away.
The most important single factor impacting on the value of the US Dollar is monetary policy, which is shaped by the Federal Reserve (Fed). The Fed has two mandates: to achieve price stability (control inflation) and foster full employment. Its primary tool to achieve these two goals is by adjusting interest rates. When prices are rising too quickly and inflation is above the Fed’s 2% target, the Fed will raise rates, which helps the USD value. When inflation falls below 2% or the Unemployment Rate is too high, the Fed may lower interest rates, which weighs on the Greenback.
In extreme situations, the Federal Reserve can also print more Dollars and enact quantitative easing (QE). QE is the process by which the Fed substantially increases the flow of credit in a stuck financial system. It is a non-standard policy measure used when credit has dried up because banks will not lend to each other (out of the fear of counterparty default). It is a last resort when simply lowering interest rates is unlikely to achieve the necessary result. It was the Fed’s weapon of choice to combat the credit crunch that occurred during the Great Financial Crisis in 2008. It involves the Fed printing more Dollars and using them to buy US government bonds predominantly from financial institutions. QE usually leads to a weaker US Dollar.
Quantitative tightening (QT) is the reverse process whereby the Federal Reserve stops buying bonds from financial institutions and does not reinvest the principal from the bonds it holds maturing in new purchases. It is usually positive for the US Dollar.
-
18:26
Dow Jones Industrial Average churns post-PPI print
- The Dow Jones tested higher ground after US producer inflation chilled in December.
- Despite an uptick in investor sentiment, markets are still apprehensive.
- Investors await Wednesday’s key CPI inflation print before making decisions.
The Dow Jones Industrial Average (DJIA) lurched around 150 points higher on Tuesday after Producer Price Index (PPI) inflation printed below median market forecasts. Treasury yields ticked down and equities explored the higher end after cooling inflation pressures gave investors a reason to look forward to key Consumer Price Index (CPI) inflation figures due on Wednesday. The bid in equities was short-lived, and the Dow Jones is now sinking back below Tuesday’s opening bids and exploring the 42,200 handle once again.
PPI inflation figures eased broadly below expectations in December, with headline PPI printing at just 0.2% MoM. Investors were expecting a downtick to 0.3% from the previous 0.4%. Core PPI, excluding price increases in volatile food and energy prices, was flat in December versus the forecast of 0.3% and 0.2% last.
Annualized PPI inflation tells a slightly different story: headline PPI inflation rose to 3.3% YoY versus the previous figure of 3.0%, while core PPI accelerated to 3.5% YoY compared to the previous 3.4%. While both figures came in below expectations, the print wasn’t quite the boon to investor sentiment that many were hoping for as inflation pressures continue to simmer away in the background, albeit at a slightly lower boil than economists forecast. With inflation metrics still trending well above annualized Federal Reserve (Fed) targets, PPI figures printing below forecasts is a distinction without a difference when it comes to expectations of interest rate decreases.
Dow Jones news
Roughly half of the Dow Jones board is in the green on Tuesday, though steeper losses in key favorites are keeping the overall index slightly underwater for the day. Boeing (BA) backslid around 3%, falling to $165 per share after the aerospace manufacturer reported fewer customer deliveries than analysts expected. Boeing is slated to release its latest earnings report on January 28.
Salesforce (CRM) and Caterpillar (CAT) are two of the big winners on the Dow, rising around 1.5% apiece as investors continues to pivot out of tech favorites and bid up adjacent-industry familiars. CRM is knocking on $324 per share while CAT is trading into $368 per share.
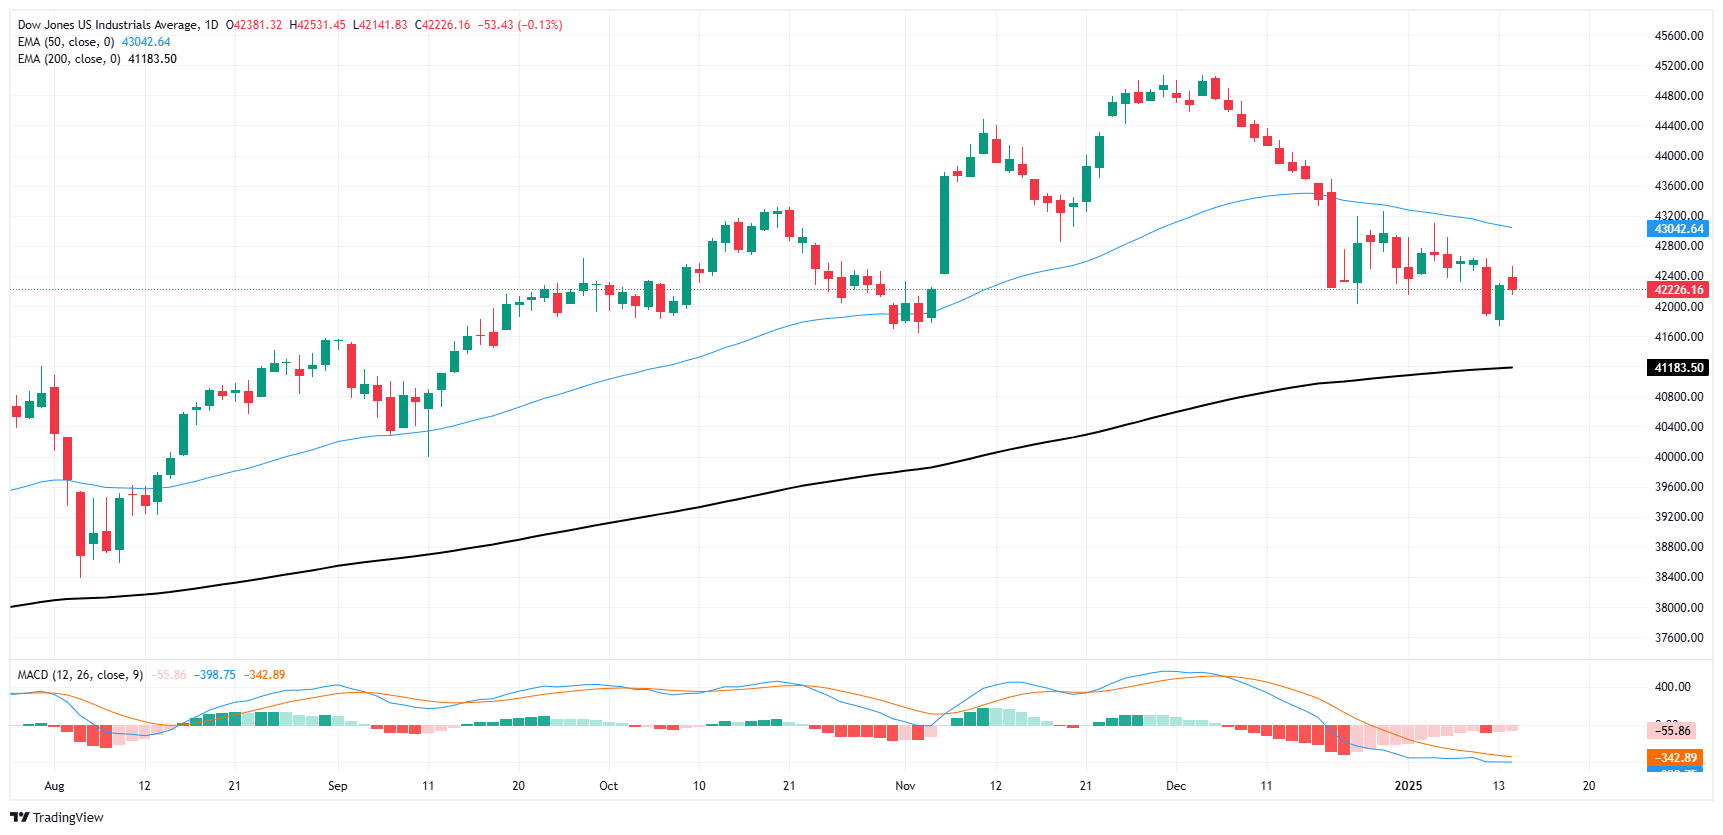
Dow Jones price forecast
The Dow Jones is discovering some chart churn as bidders look to dig in some footholds above the 42,000 major price handle. The major equity index has backslid 7.4% top-to-bottom from record bids near 45,070 set in late November. Bulls are struggling to catch the backslide as the 200-day Exponential Moving Average (EMA) comes into view, and price action is poised to tap the key long-term average for the first time since November of 2023.
The immediate barrier to a technical recovery will be the 50-day EMA falling into 43,040. A near-term technical floor appears to be firming up at 42,000, but a fresh push into the low end could see supports snap.
Dow Jones daily chart
Dow Jones FAQs
The Dow Jones Industrial Average, one of the oldest stock market indices in the world, is compiled of the 30 most traded stocks in the US. The index is price-weighted rather than weighted by capitalization. It is calculated by summing the prices of the constituent stocks and dividing them by a factor, currently 0.152. The index was founded by Charles Dow, who also founded the Wall Street Journal. In later years it has been criticized for not being broadly representative enough because it only tracks 30 conglomerates, unlike broader indices such as the S&P 500.
Many different factors drive the Dow Jones Industrial Average (DJIA). The aggregate performance of the component companies revealed in quarterly company earnings reports is the main one. US and global macroeconomic data also contributes as it impacts on investor sentiment. The level of interest rates, set by the Federal Reserve (Fed), also influences the DJIA as it affects the cost of credit, on which many corporations are heavily reliant. Therefore, inflation can be a major driver as well as other metrics which impact the Fed decisions.
Dow Theory is a method for identifying the primary trend of the stock market developed by Charles Dow. A key step is to compare the direction of the Dow Jones Industrial Average (DJIA) and the Dow Jones Transportation Average (DJTA) and only follow trends where both are moving in the same direction. Volume is a confirmatory criteria. The theory uses elements of peak and trough analysis. Dow’s theory posits three trend phases: accumulation, when smart money starts buying or selling; public participation, when the wider public joins in; and distribution, when the smart money exits.
There are a number of ways to trade the DJIA. One is to use ETFs which allow investors to trade the DJIA as a single security, rather than having to buy shares in all 30 constituent companies. A leading example is the SPDR Dow Jones Industrial Average ETF (DIA). DJIA futures contracts enable traders to speculate on the future value of the index and Options provide the right, but not the obligation, to buy or sell the index at a predetermined price in the future. Mutual funds enable investors to buy a share of a diversified portfolio of DJIA stocks thus providing exposure to the overall index.
-
16:42
EUR/USD Price Analysis: Pair attempts mild rebound but outlook remains negative
- EUR/USD slips marginally to 1.0270 on Tuesday, ending a five-day losing streak.
- RSI currently at 37, moving sharply higher despite remaining in negative territory.
The EUR/USD pair managed to eke out a modest recovery on Tuesday, edging down to 1.0270 yet avoiding a sixth consecutive day in the red. Despite this fragile bounce, the pair remains under pressure, underscoring the persistent headwinds that have characterized its performance over the past week.
Technical indicators offer a mixed perspective. While the Relative Strength Index (RSI) has ticked up to 37 and shows signs of life, it continues to reside in negative territory. Meanwhile, the Moving Average Convergence Divergence (MACD) histogram prints flat red bars, suggesting that the recent reprieve may lack the follow-through needed to spark a robust bullish reversal.
Looking ahead, immediate support stands near the 1.0250 handle, with any drop below that level potentially exposing the 1.0220 region. On the upside, overcoming resistance around 1.0300 would be essential to bolster the pair’s recovery attempt, opening the door for a possible retest of the 1.0350 zone if bullish momentum takes hold.
EUR/USD daily chart
-
16:09
United States RealClearMarkets/TIPP Economic Optimism (MoM) below forecasts (55.1) in January: Actual (51.9)
-
16:00
GBP/USD Price Forecast: Tumbles below 1.2200 after US PPI data
- GBP/USD extends downtrend, slipping below 1.2200 after US inflation release.
- Next GBP/USD support at 1.2136; potential drop to 1.2100 may hit a new year-to-date low.
- Recovery above 1.2200 needed to challenge the week’s high at 1.2249, further resistance up to 1.2351.
The GBP/USD plunged below 1.2200 during the North American session following the release of US producer price inflation data, which hinted that prices dipped slightly but close to Wall Street's estimates. At the time of writing, the pair trades at 1.2166, down by over 0.26%.
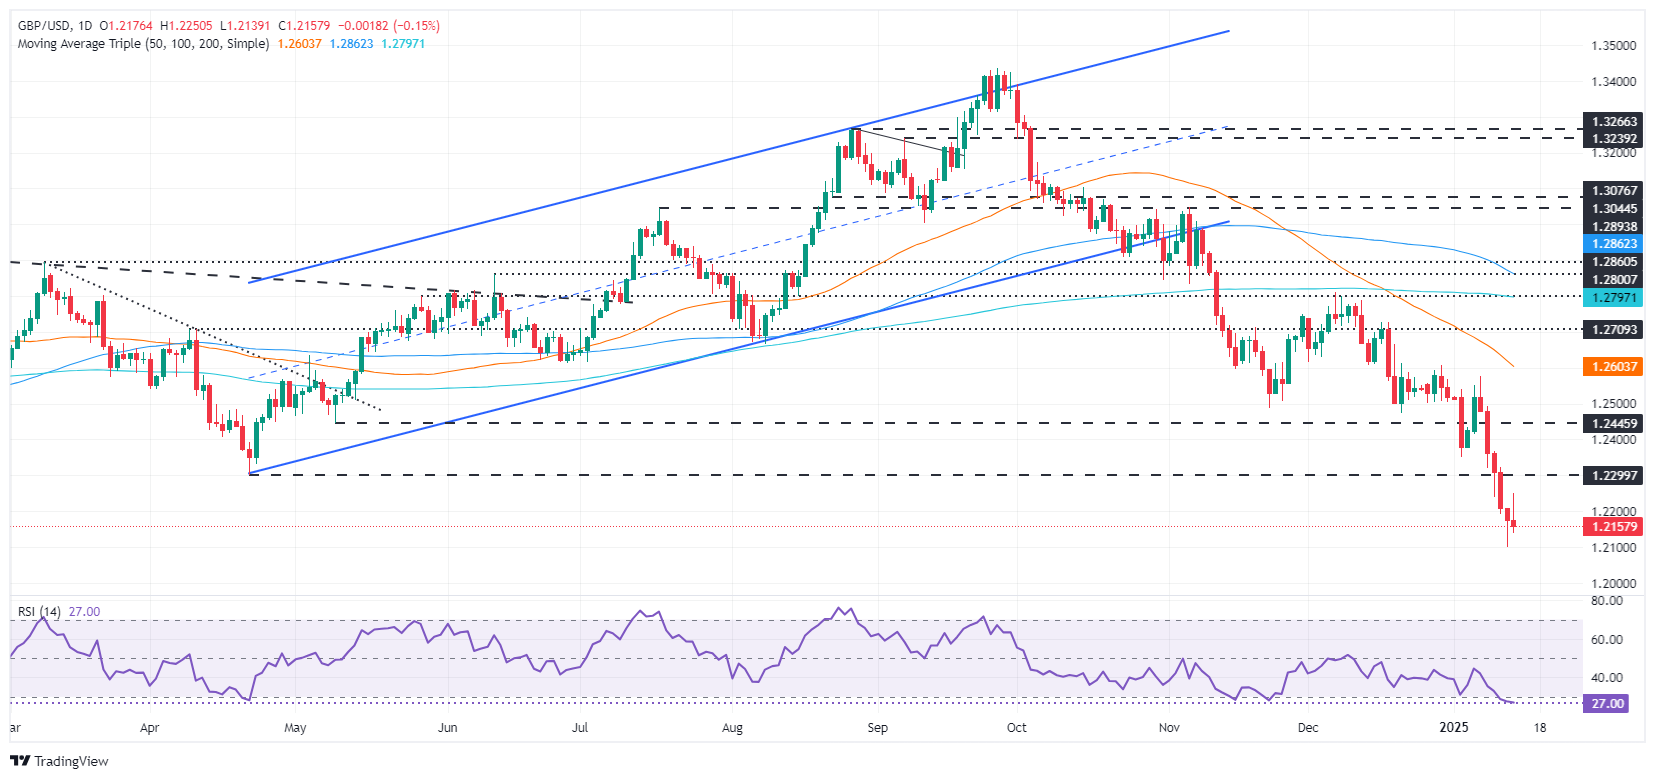
GBP/USD Price Forecast: Technical outlook
The downtrend remains intact even though buyers lifted the pair to an intraday high of 1.2249. However, sellers sold the rip driving the GBP/USD below 1.2200, extending its losses to current exchange rates.
If GBP/USD drops below 1.2150, the next support would be the day’s low of 1.2136. On further weakness, 1.2100 emerges as the next floor level, followed by the current year-to-date (YTD) low of 1.2099.
Meanwhile, GBP/USD must reclaim 1.2200 for a bullish resumption before testing the week’s peak of 1.2249. A breach of the latter will expose the April 2024 swing low of 1.2299, ahead of 1.2300. If surpassed, the next stop would be the January 2 daily low of 1.2351.
GBP/USD Price Chart - Daily
Pound Sterling FAQs
The Pound Sterling (GBP) is the oldest currency in the world (886 AD) and the official currency of the United Kingdom. It is the fourth most traded unit for foreign exchange (FX) in the world, accounting for 12% of all transactions, averaging $630 billion a day, according to 2022 data. Its key trading pairs are GBP/USD, also known as ‘Cable’, which accounts for 11% of FX, GBP/JPY, or the ‘Dragon’ as it is known by traders (3%), and EUR/GBP (2%). The Pound Sterling is issued by the Bank of England (BoE).
The single most important factor influencing the value of the Pound Sterling is monetary policy decided by the Bank of England. The BoE bases its decisions on whether it has achieved its primary goal of “price stability” – a steady inflation rate of around 2%. Its primary tool for achieving this is the adjustment of interest rates. When inflation is too high, the BoE will try to rein it in by raising interest rates, making it more expensive for people and businesses to access credit. This is generally positive for GBP, as higher interest rates make the UK a more attractive place for global investors to park their money. When inflation falls too low it is a sign economic growth is slowing. In this scenario, the BoE will consider lowering interest rates to cheapen credit so businesses will borrow more to invest in growth-generating projects.
Data releases gauge the health of the economy and can impact the value of the Pound Sterling. Indicators such as GDP, Manufacturing and Services PMIs, and employment can all influence the direction of the GBP. A strong economy is good for Sterling. Not only does it attract more foreign investment but it may encourage the BoE to put up interest rates, which will directly strengthen GBP. Otherwise, if economic data is weak, the Pound Sterling is likely to fall.
Another significant data release for the Pound Sterling is the Trade Balance. This indicator measures the difference between what a country earns from its exports and what it spends on imports over a given period. If a country produces highly sought-after exports, its currency will benefit purely from the extra demand created from foreign buyers seeking to purchase these goods. Therefore, a positive net Trade Balance strengthens a currency and vice versa for a negative balance.
-
14:55
United States Redbook Index (YoY) dipped from previous 6.8% to 4% in January 10
-
14:36
US: Headline Producer Prices rose below estimates 3.3% YoY in December
The latest data from the Bureau of Labor Statistics (BLS) shows that Producer Prices climbed 3.3% in December compared to a year earlier. This was below expectations of 3.4% and a decent uptick from November's 3.0% increase.
Excluding the often volatile food and energy categories, Producer Prices rose 3.5% over the last twelve months, again coming in short of the forecast of 3.8% and outpacing the 3.4% growth seen in the previous report.
On a monthly basis, the headline Producer Price Index (PPI) increased by 0.2%, while the core PPI (excluding food and energy) came in flat. Both figures disappointed market predictions.

Market reaction
The US Dollar treads water around 109.50 when tracked by the US Dollar Index (DXY) following Monday's knee-jerk and despite hitting a new cycle peak past the 110.00 barrier.
-
14:32
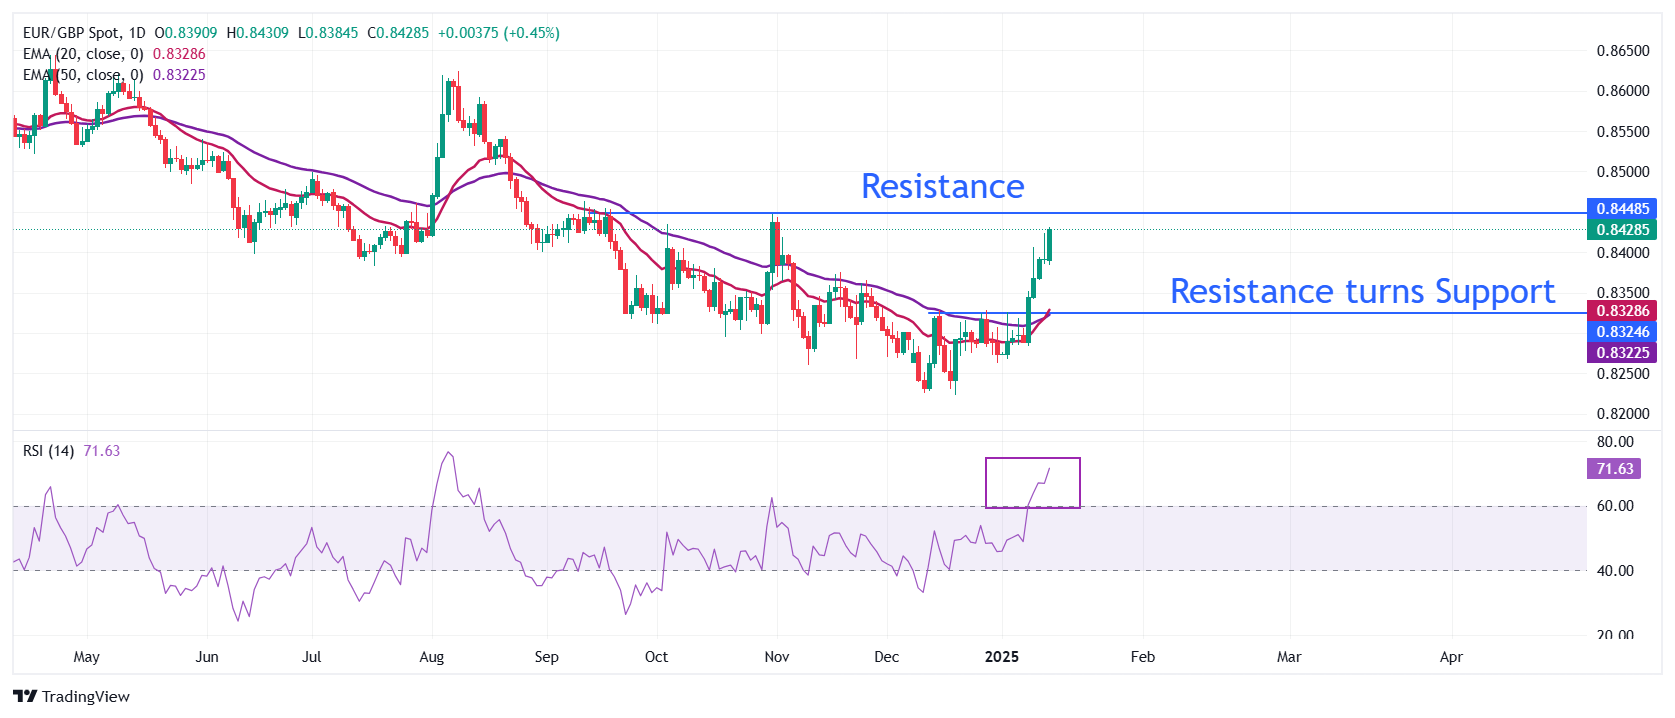
EUR/GBP Price Forecast: Aims to revisit four-month high of 0.8450
- EUR/GBP extends winning spree amid sheer weakness in the Pound Sterling.
- Surging borrowing costs for the UK government have weighed on their economic outlook.
- The Euro gains despite expectations for the ECB to reduce interest rates by 100 bps by the mid-summer.
The EUR/GBP pair extends its winning streak for the fifth trading day on Tuesday. The cross outperforms as the Pound Sterling (GBP) performs weakly across the board, given that the United Kingdom’s (UK) economic outlook has faltered due to rising yields on Britain’s gilt securities.
The 30-year yields on UK gilts have risen to 5.47%, the highest level seen in more than 26 years. The surge in the UK government’s borrowing cost is partly driven by the uncertainty over incoming trade policies by United States (US) President-elect Donald Trump and the nation’s heavy reliance on foreign financing.
Investors expect that higher borrowing costs could force Chancellor of the Exchequer Rachel Reeves to go against her fiscal rules as she vowed, in the autumn budget, to rely on foreign borrowing for funding investment and not on day-to-day spending.
Meanwhile, the Euro (EUR) performs strongly against its major peers on Tuesday even though the European Central Bank (ECB) is expected to continue reducing interest rates this year. The ECB cut its Deposit Facility rate by 100 basis points (bps) to 3% in 2024 and is expected to cut further by a similar size by the mid-summer.
Euro PRICE Today
The table below shows the percentage change of Euro (EUR) against listed major currencies today. Euro was the strongest against the British Pound.
USD EUR GBP JPY CAD AUD NZD CHF USD -0.26% 0.29% 0.16% -0.02% -0.10% -0.36% -0.11% EUR 0.26% 0.56% 0.39% 0.25% 0.16% -0.10% 0.15% GBP -0.29% -0.56% -0.13% -0.31% -0.37% -0.66% -0.40% JPY -0.16% -0.39% 0.13% -0.17% -0.24% -0.52% -0.26% CAD 0.02% -0.25% 0.31% 0.17% -0.08% -0.34% -0.08% AUD 0.10% -0.16% 0.37% 0.24% 0.08% -0.25% -0.01% NZD 0.36% 0.10% 0.66% 0.52% 0.34% 0.25% 0.25% CHF 0.11% -0.15% 0.40% 0.26% 0.08% 0.01% -0.25% The heat map shows percentage changes of major currencies against each other. The base currency is picked from the left column, while the quote currency is picked from the top row. For example, if you pick the Euro from the left column and move along the horizontal line to the US Dollar, the percentage change displayed in the box will represent EUR (base)/USD (quote).
EUR/GBP extends its weekly rally to near 0.8430. The cross strengthened after breaking above the December 27 high of 0.8329, which has become a support now. A fresh bull cross, suggested by the 20- and 50-day Exponential Moving Averages (EMAs) near 0.8330, indicates a strong uptrend.
The 14-day Relative Strength Index (RSI) rises sharply to near 70.00, suggesting a strong bullish momentum.
The cross would witness a fresh upside move to near the August 26 high of 0.8475 and the psychological resistance of 0.8500 after breaking above the October high of 0.8448.
Alternatively, a downside move below the January 14 low of 0.8384 would falter the upside move and drag the asset towards the October 24 high of 0.8350, followed by the December 27 high of 0.8329.
EUR/GBP daily chart
-
14:30
United States Producer Price Index ex Food & Energy (MoM) registered at 0%, below expectations (0.3%) in December
-
14:30
United States Producer Price Index (MoM) below forecasts (0.3%) in December: Actual (0.2%)
-
14:30
United States Producer Price Index (YoY) registered at 3.3%, below expectations (3.4%) in December
-
14:30
United States Producer Price Index ex Food & Energy (YoY) came in at 3.5%, below expectations (3.8%) in December
-
13:06
US Dollar softens after Trump administration tries to circumvent inflationary shock
- The US Dollar retraces after sources disclosed the Trump administration is considering a gradual tariff implementation.
- In early Tuesday trading, a knee-jerk reaction briefly pushed inflation and Fed policy concerns to the background.
- The US Dollar Index (DXY) dips below 110.00 and looks for support to bounce back.
The US Dollar Index (DXY), which tracks the Greenback’s value against six major currencies, edges lower and dips below 110.00 on Tuesday, extending the previous day’s retracement from an over-two-year high of 110.18. The main driver comes after sources in the upcoming President-elect Donald Trump administration disclosed that they are considering a very slow month-to-month implementation of tariffs to avoid an inflationary shock, Bloomberg reported. A second driver comes from headlines of a ceasefire deal brokered by the US between Hamas and Israel, which is supported by both the current US President Joe Biden and President-elect Donald Trump.
The US economic calendar picks up in importance on Tuesday, with the Producer Price Index (PPI) release as an appetizer for the more important Consumer Price Index (CPI) on Wednesday. Overall expectations are that the monthly gauges should soften or stay relatively stable while the year-on-year benchmarks will head higher compared to previous readings.
Daily digest market movers: Starting to thicken
- At 13:30 GMT, the Producer Price Index (PPI) for December is released:
- The monthly core PPI gauge is expected to increase 0.3% compared to 0.2% in November.
- The monthly headline PPI is expected to increase by 0.3%, coming from 0.4% in the previous month.
- The yearly headline PPI is expected to increase 3.4% from 3.0% in November, while the annual core PPI is expected to increase 3.8% from 3.4% in the previous month.
- At 15:00 GMT, Federal Reserve Bank of Kansas City President Jeff Schmid delivers a speech about the US economic and monetary policy outlook at an event organized by The Central Exchange.
- At 20:05 GMT, Federal Reserve Bank of New York President John Williams delivers open remarks at the "An Economy That Works for All: Housing Affordability" event organized by the New York Fed in New York.
- Chinese equities are rallying higher on the back of the rumors of gradual tariff implementation. European equities and US futures are taking over the positive sentiment, with all major indices in the green on the day.
- The CME FedWatch Tool projects a 97.3% chance that interest rates will be kept unchanged at current levels in the January meeting. Expectations are for the Federal Reserve (Fed) to remain data-dependent with uncertainties that could influence the inflation path once President-elect Donald Trump takes office on January 20.
- US yields are softening substantially. The 10-year benchmark trades around 4.753% at the time of writing on Tuesday, fading from its fresh 14-month high of 4.802% seen on Monday.
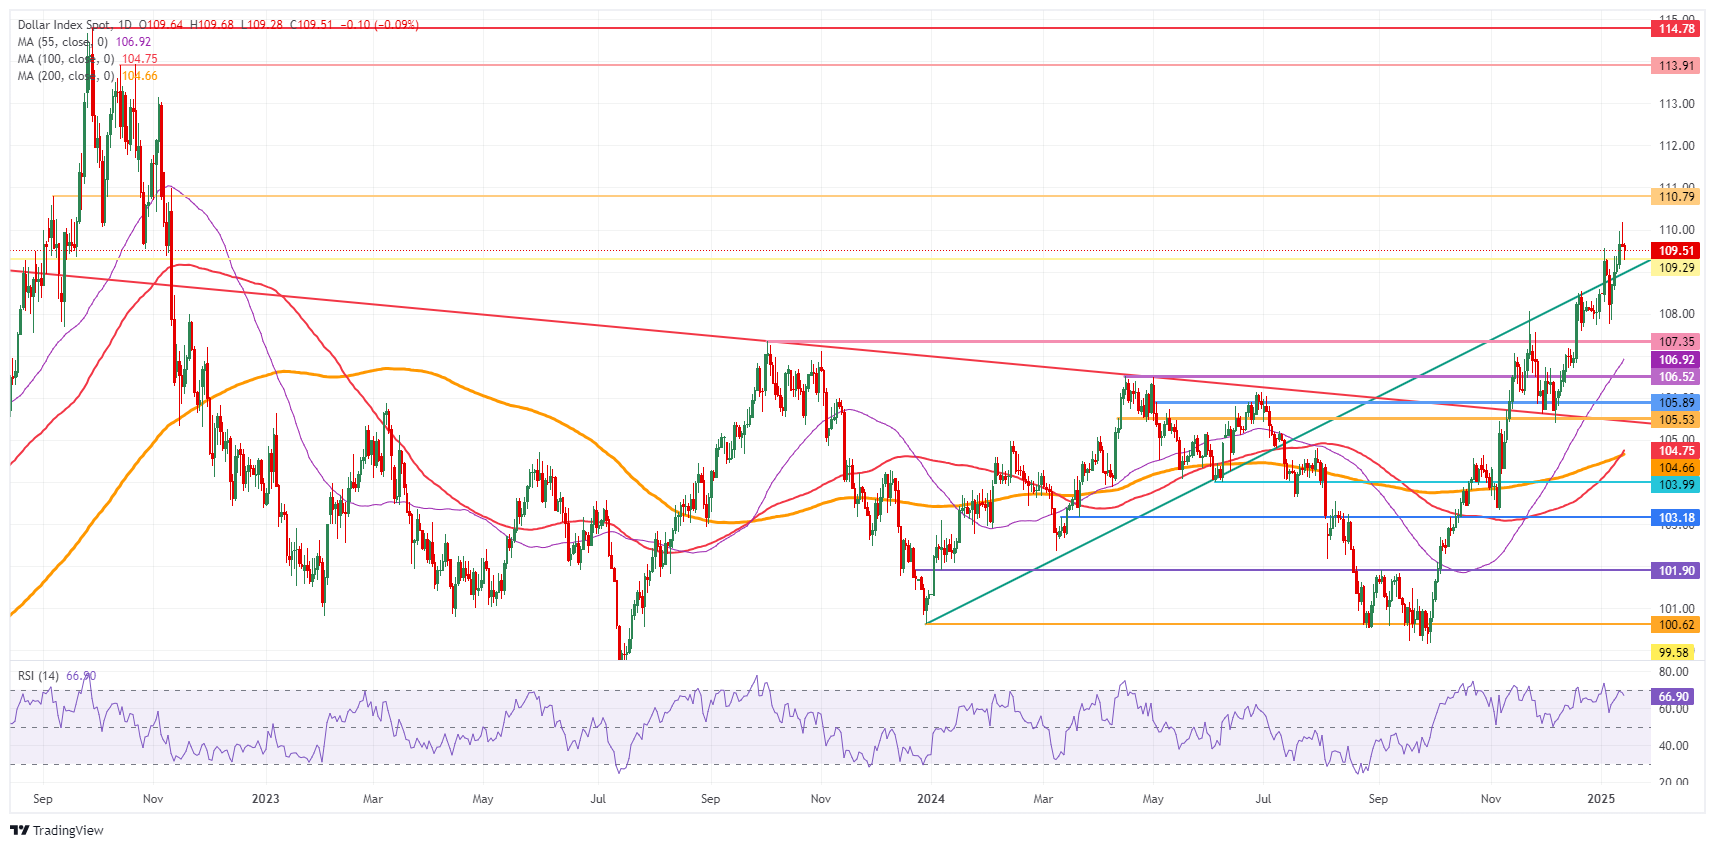
US Dollar Index Technical Analysis: This will be the new normal
The US Dollar Index (DXY) is set to see volatility pick up. The constant deliverance of statements from President-elect Donald Trump, followed by comments from sources inside his team, will deliver several knee-jerk moments and reactions. This means that sense of direction could get distorted and misty from now on.
On the upside, the 110.00 psychological level remains the key resistance to beat. Further up, the next big upside level to hit before advancing any further remains at 110.79. Once beyond there, it is quite a stretch to 113.91, the double top from October 2022.
Looking down, the DXY will look for a bounce off the green ascending trend line from December 2023, which currently comes in around 109.00 as nearby support. In case of more downside, the next support is 107.35. The next level that might halt any selling pressure is 106.52, with the 55-day Simple Moving Average (SMA) at 106.92 reinforcing ahead of this region of support.
US Dollar Index: Daily Chart
US Dollar FAQs
The US Dollar (USD) is the official currency of the United States of America, and the ‘de facto’ currency of a significant number of other countries where it is found in circulation alongside local notes. It is the most heavily traded currency in the world, accounting for over 88% of all global foreign exchange turnover, or an average of $6.6 trillion in transactions per day, according to data from 2022. Following the second world war, the USD took over from the British Pound as the world’s reserve currency. For most of its history, the US Dollar was backed by Gold, until the Bretton Woods Agreement in 1971 when the Gold Standard went away.
The most important single factor impacting on the value of the US Dollar is monetary policy, which is shaped by the Federal Reserve (Fed). The Fed has two mandates: to achieve price stability (control inflation) and foster full employment. Its primary tool to achieve these two goals is by adjusting interest rates. When prices are rising too quickly and inflation is above the Fed’s 2% target, the Fed will raise rates, which helps the USD value. When inflation falls below 2% or the Unemployment Rate is too high, the Fed may lower interest rates, which weighs on the Greenback.
In extreme situations, the Federal Reserve can also print more Dollars and enact quantitative easing (QE). QE is the process by which the Fed substantially increases the flow of credit in a stuck financial system. It is a non-standard policy measure used when credit has dried up because banks will not lend to each other (out of the fear of counterparty default). It is a last resort when simply lowering interest rates is unlikely to achieve the necessary result. It was the Fed’s weapon of choice to combat the credit crunch that occurred during the Great Financial Crisis in 2008. It involves the Fed printing more Dollars and using them to buy US government bonds predominantly from financial institutions. QE usually leads to a weaker US Dollar.
Quantitative tightening (QT) is the reverse process whereby the Federal Reserve stops buying bonds from financial institutions and does not reinvest the principal from the bonds it holds maturing in new purchases. It is usually positive for the US Dollar.
-
12:07
Germany 5-y Note Auction up to 2.42% from previous 2.04%
-
12:06
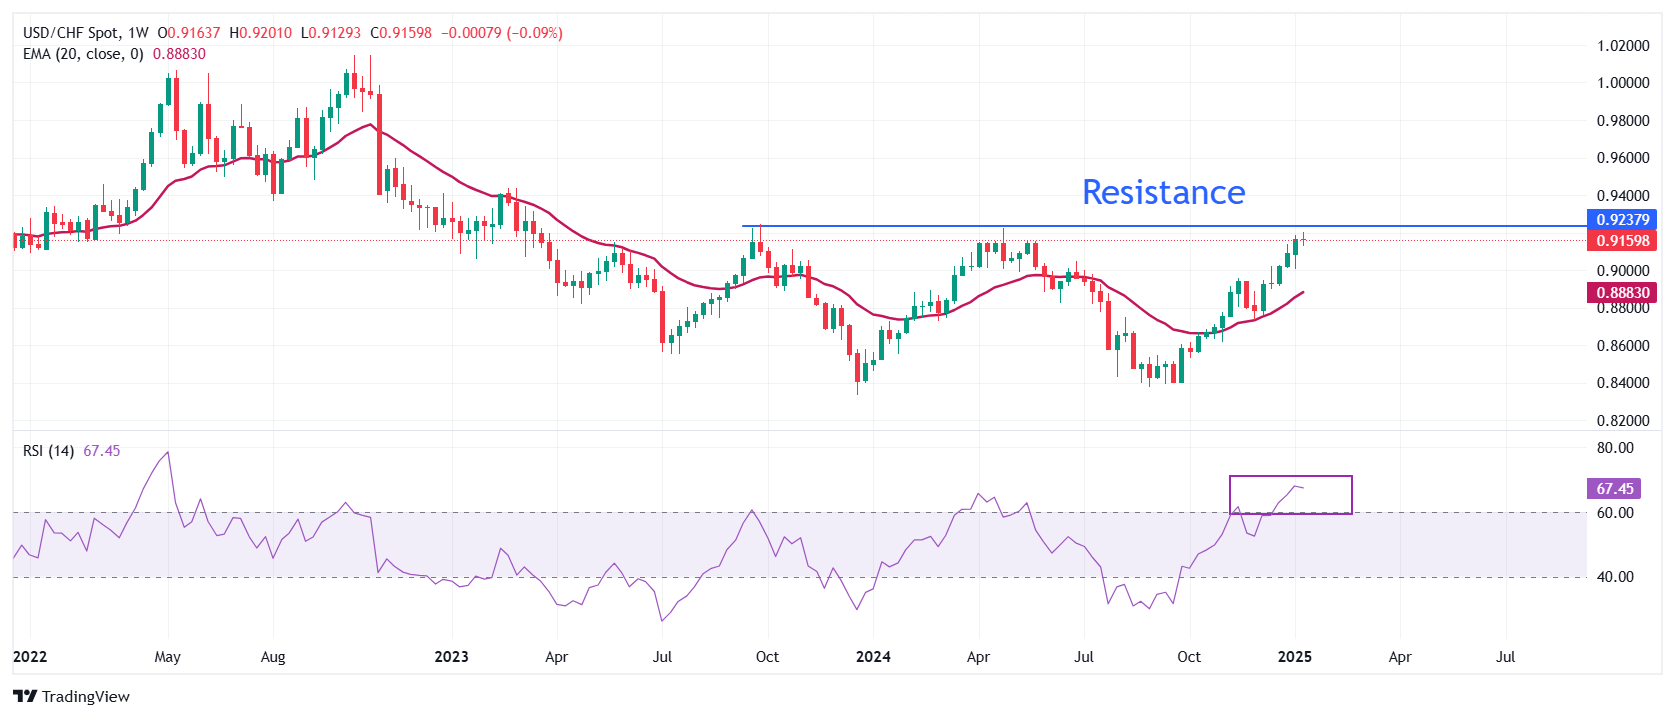
USD/CHF Price Forecast: Needs to break above 0.9250 for fresh upside
- USD/CHF recovers intraday losses as the outlook of the US Dollar remains firm.
- Investors await the US inflation data as it will influence the Fed’s interest rate outlook.
- The SNB is expected to cut interest rates further to fuel inflationary pressures.
The USD/CHF pair recovers its intraday losses and flattens to near 0.9160 in Tuesday’s European session. The Swiss Franc pair bounces back as investors turn cautious ahead of the United States (US) Consumer Price Index (CPI) data for December, which will be released on December.
Investors will pay close attention to US inflation data, which will influence market speculation about the Federal Reserve’s (Fed) interest rate outlook. Year-on-year headline inflation is expected to have accelerated to 2.8% from 2.7% in November, with core readings growing steadily by 3.3%.
According to the CME FedWatch tool, traders roughly price in a 69% chance that the central bank will reduce interest rates once this year.
Meanwhile, the Swiss Franc (CHF) has been underperforming against the US dollar for the past few months. The Swiss National Bank (SNB) is expected to continue reducing interest rates further to boost inflationary pressures. The SNB has already reduced its key borrowing rates to 0.5%.
USD/CHF trades close to its 15-month high around 0.9200. The outlook of the Swiss Franc pair remains firm as the 20-week Exponential Moving Average (EMA) near 0.8883 is sloping higher.
The 14-week Relative Strength Index (RSI) oscillates in the bullish range of 60.00-80.00, suggesting a strong upside momentum.
For a fresh upside toward the round-level resistance of 0.9300 and the 16 March 2023 high of 0.9342, the asset needs to break decisively above the October 2023 high of 0.9244.
On the flip side, a downside move below the psychological support of 0.9000 would drag the asset towards the November 22 high of 0.8958, followed by the December 16 low of 0.8900.
USD/CHF weekly chart
US Dollar FAQs
The US Dollar (USD) is the official currency of the United States of America, and the ‘de facto’ currency of a significant number of other countries where it is found in circulation alongside local notes. It is the most heavily traded currency in the world, accounting for over 88% of all global foreign exchange turnover, or an average of $6.6 trillion in transactions per day, according to data from 2022. Following the second world war, the USD took over from the British Pound as the world’s reserve currency. For most of its history, the US Dollar was backed by Gold, until the Bretton Woods Agreement in 1971 when the Gold Standard went away.
The most important single factor impacting on the value of the US Dollar is monetary policy, which is shaped by the Federal Reserve (Fed). The Fed has two mandates: to achieve price stability (control inflation) and foster full employment. Its primary tool to achieve these two goals is by adjusting interest rates. When prices are rising too quickly and inflation is above the Fed’s 2% target, the Fed will raise rates, which helps the USD value. When inflation falls below 2% or the Unemployment Rate is too high, the Fed may lower interest rates, which weighs on the Greenback.
In extreme situations, the Federal Reserve can also print more Dollars and enact quantitative easing (QE). QE is the process by which the Fed substantially increases the flow of credit in a stuck financial system. It is a non-standard policy measure used when credit has dried up because banks will not lend to each other (out of the fear of counterparty default). It is a last resort when simply lowering interest rates is unlikely to achieve the necessary result. It was the Fed’s weapon of choice to combat the credit crunch that occurred during the Great Financial Crisis in 2008. It involves the Fed printing more Dollars and using them to buy US government bonds predominantly from financial institutions. QE usually leads to a weaker US Dollar.
Quantitative tightening (QT) is the reverse process whereby the Federal Reserve stops buying bonds from financial institutions and does not reinvest the principal from the bonds it holds maturing in new purchases. It is usually positive for the US Dollar.
-
12:00
United States NFIB Business Optimism Index above forecasts (100.8) in December: Actual (105.1)
-
11:21
USD/JPY rises sharply to near 158.00 Yen’s safe-haven appeal falters
- USD/JPY gains to near 158.00 as the safe-haven demand of the Japanese Yen has eased.
- Investors await the US inflation data for fresh guidance on interest rates.
- Fed dovish bets have lately trimmed on upbeat US labor market data for December.
The USD/JPY pair moves sharply higher to near 158.00 in Tuesday’s European session. The asset gains firmly as the safe-haven appeal of the Japanese Yen (JPY) has faltered amid recovery in demand for risk-sensitive assets.
The Yen performed strongly in last three trading days against the US Dollar (USD) despite the latter rallied to a fresh more-than-two-year high. However, the Yen appears to be losing heat, with investors focusing on the United States (US) Consumer Price Index (CPI) data for December, which will be published on Wednesday.
Analysts at Bank of America (BofA) expect, "If US CPI surprises to the upside this week, upward pressure for USDJPY spot is likely to resume, due to the pair's high sensitivity to CPI surprises."
According to market expectations, annual headline inflation is estimated to have grown by 2.8%, faster than 2.7% in November. In the same period, the core CPI – which excludes volatile food and energy prices – rose steadily by 3.3%.
Signs of price pressures remaining stubborn would further weigh on Federal Reserve (Fed) dovish bets. Lately, Fed dovish prospects trimmed significantly after the release of the surprisingly stronger US Nonfarm Payrolls (NFP) data for December.
On the domestic front, the Japanese Yen will be influenced by the market speculation for the Bank of Japan’s (BoJ) likely interest rate action in the policy meeting on January 24. BoJ Deputy Governor Ryozo Himino said on Tuesday that the board will discuss whether to “raise interest rates next week and reach a decision”, based on the economic and price projections laid out in our quarterly outlook report."
Japanese Yen FAQs
The Japanese Yen (JPY) is one of the world’s most traded currencies. Its value is broadly determined by the performance of the Japanese economy, but more specifically by the Bank of Japan’s policy, the differential between Japanese and US bond yields, or risk sentiment among traders, among other factors.
One of the Bank of Japan’s mandates is currency control, so its moves are key for the Yen. The BoJ has directly intervened in currency markets sometimes, generally to lower the value of the Yen, although it refrains from doing it often due to political concerns of its main trading partners. The BoJ ultra-loose monetary policy between 2013 and 2024 caused the Yen to depreciate against its main currency peers due to an increasing policy divergence between the Bank of Japan and other main central banks. More recently, the gradually unwinding of this ultra-loose policy has given some support to the Yen.
Over the last decade, the BoJ’s stance of sticking to ultra-loose monetary policy has led to a widening policy divergence with other central banks, particularly with the US Federal Reserve. This supported a widening of the differential between the 10-year US and Japanese bonds, which favored the US Dollar against the Japanese Yen. The BoJ decision in 2024 to gradually abandon the ultra-loose policy, coupled with interest-rate cuts in other major central banks, is narrowing this differential.
The Japanese Yen is often seen as a safe-haven investment. This means that in times of market stress, investors are more likely to put their money in the Japanese currency due to its supposed reliability and stability. Turbulent times are likely to strengthen the Yen’s value against other currencies seen as more risky to invest in.
-
11:14
Spain 9-Month Letras Auction: 2.485% vs 2.366%
-
11:14
Spain 3-Month Letras Auction declined to 2.493% from previous 2.567%
-
11:08
EUR/USD rebounds as US Dollar ticks lower ahead of US inflation data
- EUR/USD recovers to near 1.0270 as the US Dollar performs subduedly as investors focus on the US PPI data for December.
- President-elect Donald Trump’s policies are expected to boost US inflation and growth.
- ECB’s Rehn sees monetary policy restrictions concluding by mid-summer.
EUR/USD extends its recovery from Monday’s over-two-year low of 1.0175 and trades near 1.0270 in Tuesday’s European session. The major currency pair rebounds as the US Dollar (USD) witnesses a marginal correction, with the US Dollar Index (DXY), which tracks the Greenback’s value against six major currencies, trading subduedly around 109.50.
However, the strong near-term trend in the US Dollar remains intact. According to the CME FedWatch tool, the 30-Day Fed Funds futures prices signal higher probabilities for only one interest rate cut from the Federal Reserve (Fed) this year, compared to two rate cuts shown by the dot plot at the latest Fed Summary of Economic Projections (SEP).
Traders have trimmed Fed dovish bets on the back of robust labor demand, as shown by the latest United States (US) Nonfarm Payrolls (NFP) data released on Friday, which signifies a strong economic outlook. Also, market participants expect inflationary pressures to remain stubborn under President-elect Donald Trump’s administration as incoming policies, such as immigration controls, tariff hikes, and lower taxes, will boost aggregate demand and growth.
For fresh cues on the current status of inflation, investors will focus on the US Consumer Price Index (CPI) data for December, which will be released on Wednesday.
In Tuesday’s session, investors will focus on the US Producer Price Index (PPI) data for December, which will be published at 13:30 GMT. Annual headline PPI is estimated to have accelerated to 3.4% from 3% in November. In the same period, the core PPI – which excludes volatile food and energy items – is expected to have grown by 3.7%, faster than the previous release of 3.4%.
Daily digest market movers: EUR/USD gains at US Dollar’s expense
- EUR/USD rebounds at the expense of the US Dollar. The outlook of the Euro (EUR) remains weak as European Central Bank (ECB) officials continue to support market expectations of further policy-easing, which have stemmed from a weak Eurozone economic outlook amid fears that US President-elect Donald Trump could slap hefty tariff hikes on the old continent, a scenario that could weaken the export sector.
- ECB policymaker and Bank of Finland Governor Olli Rehn said in a conference on Monday that he expects the monetary policy to leave the restrictive territory in the coming months, at the latest by “midsummer”. However, Rehn’s comments indicated he is not worried about the Trump trade. Rehn argued that firms would find ways to “circumvent” them and even a recent decline in direct trade between China and the US was masking such a trend, Reuters reported.
- Market participants expect the ECB to cut interest rates in each of their next four policy meetings, suggesting that the Deposit Facility rate will come down to 2%. Analysts at Barclays expect the Eurozone to start 2025 on a weak note, notably due to a “significant sluggishness“ in Germany’s manufacturing sector.
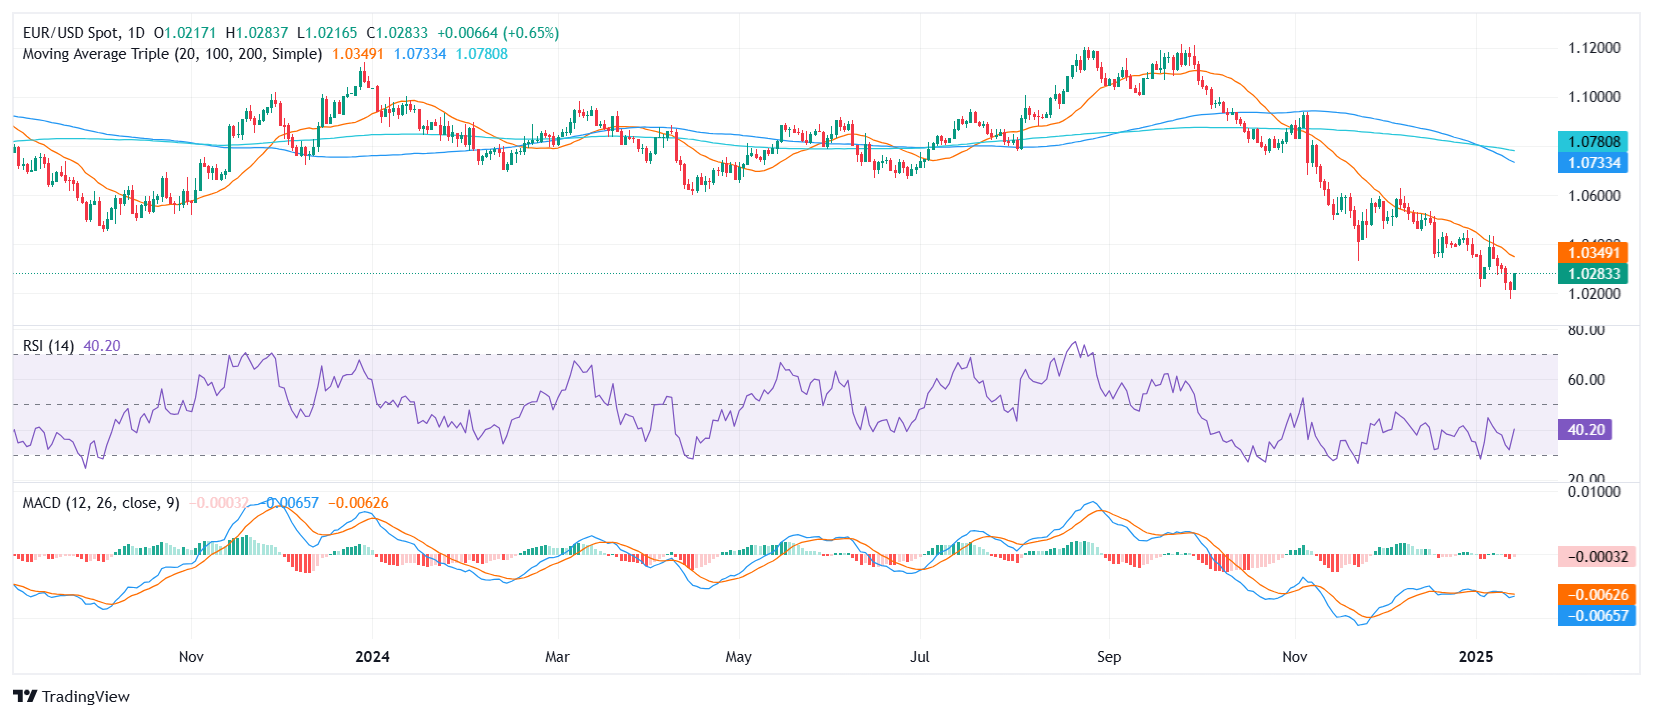
Technical Analysis: EUR/USD rebounds from a two-year low of 1.0175
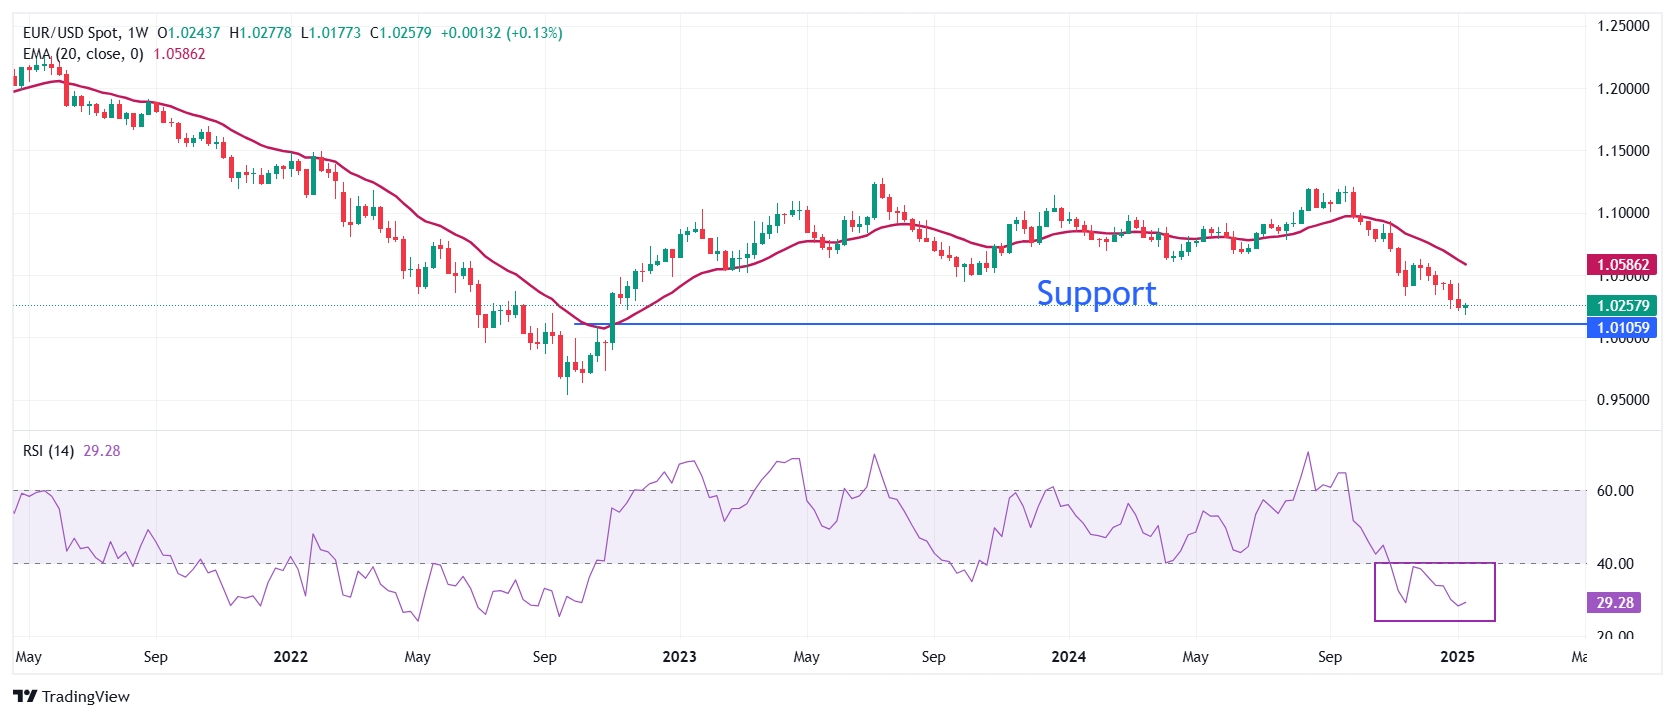
EUR/USD bounces to near 1.0270 in Tuesday’s European session after refreshing its more-than-two-year low around 1.0175 on Monday. However, the outlook for the major currency pair is broadly bearish as the 20-week Exponential Moving Average (EMA) at 1.0585 is declining.
The 14-week Relative Strength Index (RSI) slides below 30.00, indicating a strong downside momentum.
Looking down, the pair could find support near the October 2022 high near 1.0100. Conversely, the January 6 high of 1.0437 will be the key barrier for the Euro bulls.
Euro FAQs
The Euro is the currency for the 19 European Union countries that belong to the Eurozone. It is the second most heavily traded currency in the world behind the US Dollar. In 2022, it accounted for 31% of all foreign exchange transactions, with an average daily turnover of over $2.2 trillion a day. EUR/USD is the most heavily traded currency pair in the world, accounting for an estimated 30% off all transactions, followed by EUR/JPY (4%), EUR/GBP (3%) and EUR/AUD (2%).
The European Central Bank (ECB) in Frankfurt, Germany, is the reserve bank for the Eurozone. The ECB sets interest rates and manages monetary policy. The ECB’s primary mandate is to maintain price stability, which means either controlling inflation or stimulating growth. Its primary tool is the raising or lowering of interest rates. Relatively high interest rates – or the expectation of higher rates – will usually benefit the Euro and vice versa. The ECB Governing Council makes monetary policy decisions at meetings held eight times a year. Decisions are made by heads of the Eurozone national banks and six permanent members, including the President of the ECB, Christine Lagarde.
Eurozone inflation data, measured by the Harmonized Index of Consumer Prices (HICP), is an important econometric for the Euro. If inflation rises more than expected, especially if above the ECB’s 2% target, it obliges the ECB to raise interest rates to bring it back under control. Relatively high interest rates compared to its counterparts will usually benefit the Euro, as it makes the region more attractive as a place for global investors to park their money.
Data releases gauge the health of the economy and can impact on the Euro. Indicators such as GDP, Manufacturing and Services PMIs, employment, and consumer sentiment surveys can all influence the direction of the single currency. A strong economy is good for the Euro. Not only does it attract more foreign investment but it may encourage the ECB to put up interest rates, which will directly strengthen the Euro. Otherwise, if economic data is weak, the Euro is likely to fall. Economic data for the four largest economies in the euro area (Germany, France, Italy and Spain) are especially significant, as they account for 75% of the Eurozone’s economy.
Another significant data release for the Euro is the Trade Balance. This indicator measures the difference between what a country earns from its exports and what it spends on imports over a given period. If a country produces highly sought after exports then its currency will gain in value purely from the extra demand created from foreign buyers seeking to purchase these goods. Therefore, a positive net Trade Balance strengthens a currency and vice versa for a negative balance.
-
11:01
Gold slightly recovers after gradual tariff plans leaked
- Gold price halts Monday’s decline and ties up again with gains on Tuesday.
- Sources in the Trump administration disclosed that a gradual tariff introduction is being considered to avoid an inflation shock.
- Gold is testing the upside barrier in a broader-term pennant formation.
Gold’s price (XAU/USD) halts its poor Monday performance when Federal Reserve (Fed) policy rate concerns took over sentiment, recovering slightly and trading near $2,670 at the time of writing on Tuesday. That sentiment is now changing again into a sigh of relief on headlines that the President-elect Donald Trump administration is considering a very gradual implementation of its tariff plans. Sources close to the matter disclosed that the Trump administration is very much concerned about an inflation shock and wants to avoid it at all costs.
On the economic data front, some cautionary warnings need to be issued. In the runup to the US Consumer Price Index (CPI) on Wednesday, the Producer Price Index (PPI) will be released this Tuesday. Traders will need to watch out for some knee-jerk reactions in yields, as a surprise upside beat in PPI numbers could spill over into expectations for a hot CPI release.
A hot PPI and CPI print would cause US yields to surge again and offset the reaction seen this Tuesday on the gradual tariff implementation news. For the Fed policy rate projections, this would mean the chances of any rate cut in 2025 would diminish further and might even head to nil.
Daily digest market movers: Trump administration is worried
- Sources at President-elect Donald Trump’s administration are discussing slowly ramping up tariffs in a gradual approach trying to avoid a spike in inflation, according to people familiar with the matter, Bloomberg reports.
- The US 10-year benchmark rate falls to 4.753% at the time of writing on Tuesday, fading from its fresh 14-month high of 4.802% seen on Monday.
- The CME (Chicago Mercantile Exchange) Fedwatch tool currently shows that the Federal Reserve will keep rate expectations steady until its meeting on June 18, when odds of keeping rates unchanged at current levels stand at 47.2%, compared to 52.8% for lower rates.
- The Commodity Futures Trading Commission (CFTC) released the Gold NC Net Positions on Monday. The current position came in positive at $254,900, compared to the previous at $247,300. This means a surge in long-positioning from speculative traders. The report provides information on the size and direction of the positions taken across all maturities, participants primarily based in Chicago and New York futures markets. Forex traders focus on "non-commercial" or speculative positions to determine whether a trend remains healthy or not, as well as market sentiment towards a certain asset.
Technical Analysis: Risk of slipping away
Gold has slipped back into the broader pennant chart formation in which it has been trading since November. The risk now is that the upside pennant border becomes a resistance again. A firm rejection from here could set off another downward move, towards $2,650 and lower.
On the downside, the 55-day Simple Moving Average (SMA) at $2,650 is the first support. Further down, the 100-day SMA at $2,635 is the next in line. Ultimately, the ascending trend line at the lower boundary of the pennant should contain the price action from falling, standing at $2,615 for now.
On the upside, the October 23 low at $2,708 is the next pivotal level to look out for. Once that level is cleared, though still quite far off, the all-time high of $2,790 is the key upside level.

XAU/USD: Daily Chart
US Dollar FAQs
The US Dollar (USD) is the official currency of the United States of America, and the ‘de facto’ currency of a significant number of other countries where it is found in circulation alongside local notes. It is the most heavily traded currency in the world, accounting for over 88% of all global foreign exchange turnover, or an average of $6.6 trillion in transactions per day, according to data from 2022. Following the second world war, the USD took over from the British Pound as the world’s reserve currency. For most of its history, the US Dollar was backed by Gold, until the Bretton Woods Agreement in 1971 when the Gold Standard went away.
The most important single factor impacting on the value of the US Dollar is monetary policy, which is shaped by the Federal Reserve (Fed). The Fed has two mandates: to achieve price stability (control inflation) and foster full employment. Its primary tool to achieve these two goals is by adjusting interest rates. When prices are rising too quickly and inflation is above the Fed’s 2% target, the Fed will raise rates, which helps the USD value. When inflation falls below 2% or the Unemployment Rate is too high, the Fed may lower interest rates, which weighs on the Greenback.
In extreme situations, the Federal Reserve can also print more Dollars and enact quantitative easing (QE). QE is the process by which the Fed substantially increases the flow of credit in a stuck financial system. It is a non-standard policy measure used when credit has dried up because banks will not lend to each other (out of the fear of counterparty default). It is a last resort when simply lowering interest rates is unlikely to achieve the necessary result. It was the Fed’s weapon of choice to combat the credit crunch that occurred during the Great Financial Crisis in 2008. It involves the Fed printing more Dollars and using them to buy US government bonds predominantly from financial institutions. QE usually leads to a weaker US Dollar.
Quantitative tightening (QT) is the reverse process whereby the Federal Reserve stops buying bonds from financial institutions and does not reinvest the principal from the bonds it holds maturing in new purchases. It is usually positive for the US Dollar.
-
10:30
Silver price today: Silver rises, according to FXStreet data
Silver prices (XAG/USD) rose on Tuesday, according to FXStreet data. Silver trades at $29.74 per troy ounce, up 0.45% from the $29.61 it cost on Monday.
Silver prices have increased by 2.92% since the beginning of the year.
Unit measure Silver Price Today in USD Troy Ounce 29.74 1 Gram 0.96
The Gold/Silver ratio, which shows the number of ounces of Silver needed to equal the value of one ounce of Gold, stood at 89.80 on Tuesday, down from 89.93 on Monday.
Silver FAQs
Silver is a precious metal highly traded among investors. It has been historically used as a store of value and a medium of exchange. Although less popular than Gold, traders may turn to Silver to diversify their investment portfolio, for its intrinsic value or as a potential hedge during high-inflation periods. Investors can buy physical Silver, in coins or in bars, or trade it through vehicles such as Exchange Traded Funds, which track its price on international markets.
Silver prices can move due to a wide range of factors. Geopolitical instability or fears of a deep recession can make Silver price escalate due to its safe-haven status, although to a lesser extent than Gold's. As a yieldless asset, Silver tends to rise with lower interest rates. Its moves also depend on how the US Dollar (USD) behaves as the asset is priced in dollars (XAG/USD). A strong Dollar tends to keep the price of Silver at bay, whereas a weaker Dollar is likely to propel prices up. Other factors such as investment demand, mining supply – Silver is much more abundant than Gold – and recycling rates can also affect prices.
Silver is widely used in industry, particularly in sectors such as electronics or solar energy, as it has one of the highest electric conductivity of all metals – more than Copper and Gold. A surge in demand can increase prices, while a decline tends to lower them. Dynamics in the US, Chinese and Indian economies can also contribute to price swings: for the US and particularly China, their big industrial sectors use Silver in various processes; in India, consumers’ demand for the precious metal for jewellery also plays a key role in setting prices.
Silver prices tend to follow Gold's moves. When Gold prices rise, Silver typically follows suit, as their status as safe-haven assets is similar. The Gold/Silver ratio, which shows the number of ounces of Silver needed to equal the value of one ounce of Gold, may help to determine the relative valuation between both metals. Some investors may consider a high ratio as an indicator that Silver is undervalued, or Gold is overvalued. On the contrary, a low ratio might suggest that Gold is undervalued relative to Silver.
(An automation tool was used in creating this post.)
-
10:04
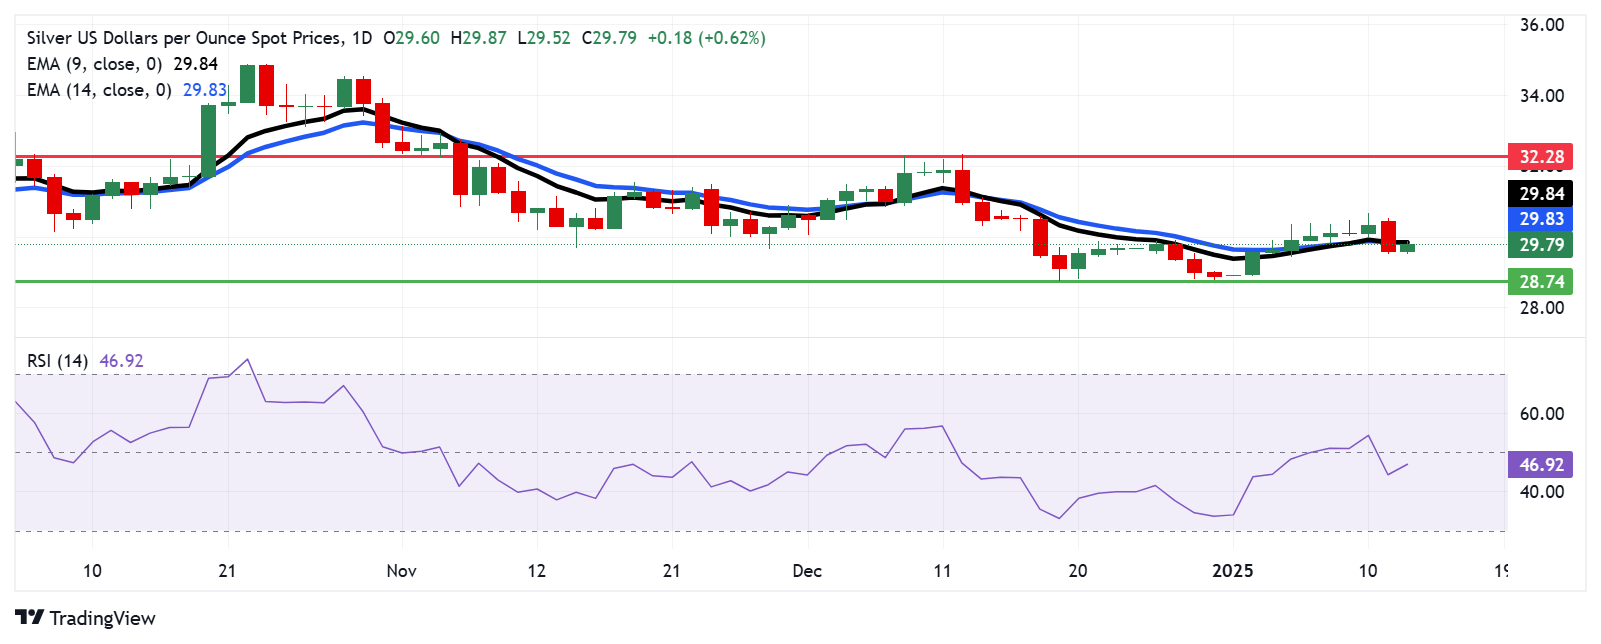
Silver Price Forecast: XAG/USD tests 14-day EMA near $30.00
- Silver price tests immediate resistance at the 14-day EMA of $29.83 level.
- The 14-day RSI consolidates around the 50 level, indicating a neutral market outlook.
- The pair may test initial support at the four-month low of $28.74, recorded on December 19.
Silver price (XAG/USD) recovers some of their recent losses from the previous session, trading near $29.80 per troy ounce during European trading hours on Tuesday. Analyzing the daily chart suggests that short-term price momentum appears neutral, with the XAG/USD pair positioned around the nine-day and 14-day Exponential Moving Averages (EMAs). A breakout in either direction could signal a clearer trend.
Moreover, the 14-day Relative Strength Index (RSI) hovers near the 50 level, suggesting a neutral outlook. This suggests the market is evenly balanced, with no clear indication of overbought or oversold conditions, reflecting equilibrium between bullish and bearish momentum.
Silver price currently tests resistance at the immediate 14-day EMA of $29.83, followed closely by the nine-day EMA at $29.84. A breakout above these levels could boost market sentiment and drive the XAG/USD pair toward the key psychological level of $30.00. A sustained move beyond this threshold may strengthen bullish momentum, potentially setting the stage for the grey metal to target its two-month high of $32.28, last achieved on December 9.
On the downside, initial support is located at the four-month low of $28.74, recorded on December 19, followed by the critical psychological level of $28.00. A break below these levels could intensify bearish momentum and signal further downside potential for Silver price.
XAG/USD: Daily Chart
Silver FAQs
Silver is a precious metal highly traded among investors. It has been historically used as a store of value and a medium of exchange. Although less popular than Gold, traders may turn to Silver to diversify their investment portfolio, for its intrinsic value or as a potential hedge during high-inflation periods. Investors can buy physical Silver, in coins or in bars, or trade it through vehicles such as Exchange Traded Funds, which track its price on international markets.
Silver prices can move due to a wide range of factors. Geopolitical instability or fears of a deep recession can make Silver price escalate due to its safe-haven status, although to a lesser extent than Gold's. As a yieldless asset, Silver tends to rise with lower interest rates. Its moves also depend on how the US Dollar (USD) behaves as the asset is priced in dollars (XAG/USD). A strong Dollar tends to keep the price of Silver at bay, whereas a weaker Dollar is likely to propel prices up. Other factors such as investment demand, mining supply – Silver is much more abundant than Gold – and recycling rates can also affect prices.
Silver is widely used in industry, particularly in sectors such as electronics or solar energy, as it has one of the highest electric conductivity of all metals – more than Copper and Gold. A surge in demand can increase prices, while a decline tends to lower them. Dynamics in the US, Chinese and Indian economies can also contribute to price swings: for the US and particularly China, their big industrial sectors use Silver in various processes; in India, consumers’ demand for the precious metal for jewellery also plays a key role in setting prices.
Silver prices tend to follow Gold's moves. When Gold prices rise, Silver typically follows suit, as their status as safe-haven assets is similar. The Gold/Silver ratio, which shows the number of ounces of Silver needed to equal the value of one ounce of Gold, may help to determine the relative valuation between both metals. Some investors may consider a high ratio as an indicator that Silver is undervalued, or Gold is overvalued. On the contrary, a low ratio might suggest that Gold is undervalued relative to Silver.
-
10:03
EUR/JPY Price Forecast: Seems poised to test 162.20-162.25 confluence hurdle
- EUR/JPY gains some follow-through traction and recovers further from a near one-month low.
- BoJ rate hike uncertainty and the risk-on mood undermine the JPY and support spot prices.
- The ECB’s dovish bias might hold back the Euro bulls from placing fresh bets and cap gains.
The EUR/JPY cross builds on the overnight recovery from the 160.00 psychological mark, or a nearly one-month low and attracts some follow-through buyers on Tuesday. Spot prices stick to positive bias through the first half of the European session and currently trade around the 161.75-161.80 region, up nearly 0.45% for the day.
Against the backdrop of the uncertainty surrounding the likely timing of the next rate hike by the Bank of Japan (BoJ), the risk-on mood undermines the safe-haven Japanese Yen (JPY) and lends support to the EUR/JPY cross. Apart from this, a modest US Dollar (USD) downtick benefits the shared currency and contributes to the intraday move up. That said, the European Central Bank's (ECB) dovish bias might cap the Euro and the currency pair.
From a technical perspective, strength beyond the 50-hour Simple Moving Average (SMA) and the 38.2% Fibonacci retracement level of the downfall witnessed over the past week or so favors bullish traders. Moreover, positive oscillators on the 1-hour chart support prospects for additional intraday gains. Hence, a move beyond the 162.00 mark, towards testing the 100-hour SMA and the 50% Fibo. level confluence near the 162.25 area, looks like a distinct possibility.
On the flip side, weakness below the 161.50 area, or the 50-hour SMA, could be seen as a buying opportunity and remain limited near the 161.00 round-figure mark (23.6% Fibo. level). A convincing break below the latter could make the EUR/JPY cross vulnerable to accelerate the slide back towards the 160.00 mark, with some intermediate support near the 160.60-160.55 region. The downfall could extend further towards the 159.50 support zone.
EUR/JPY 1-hour chart
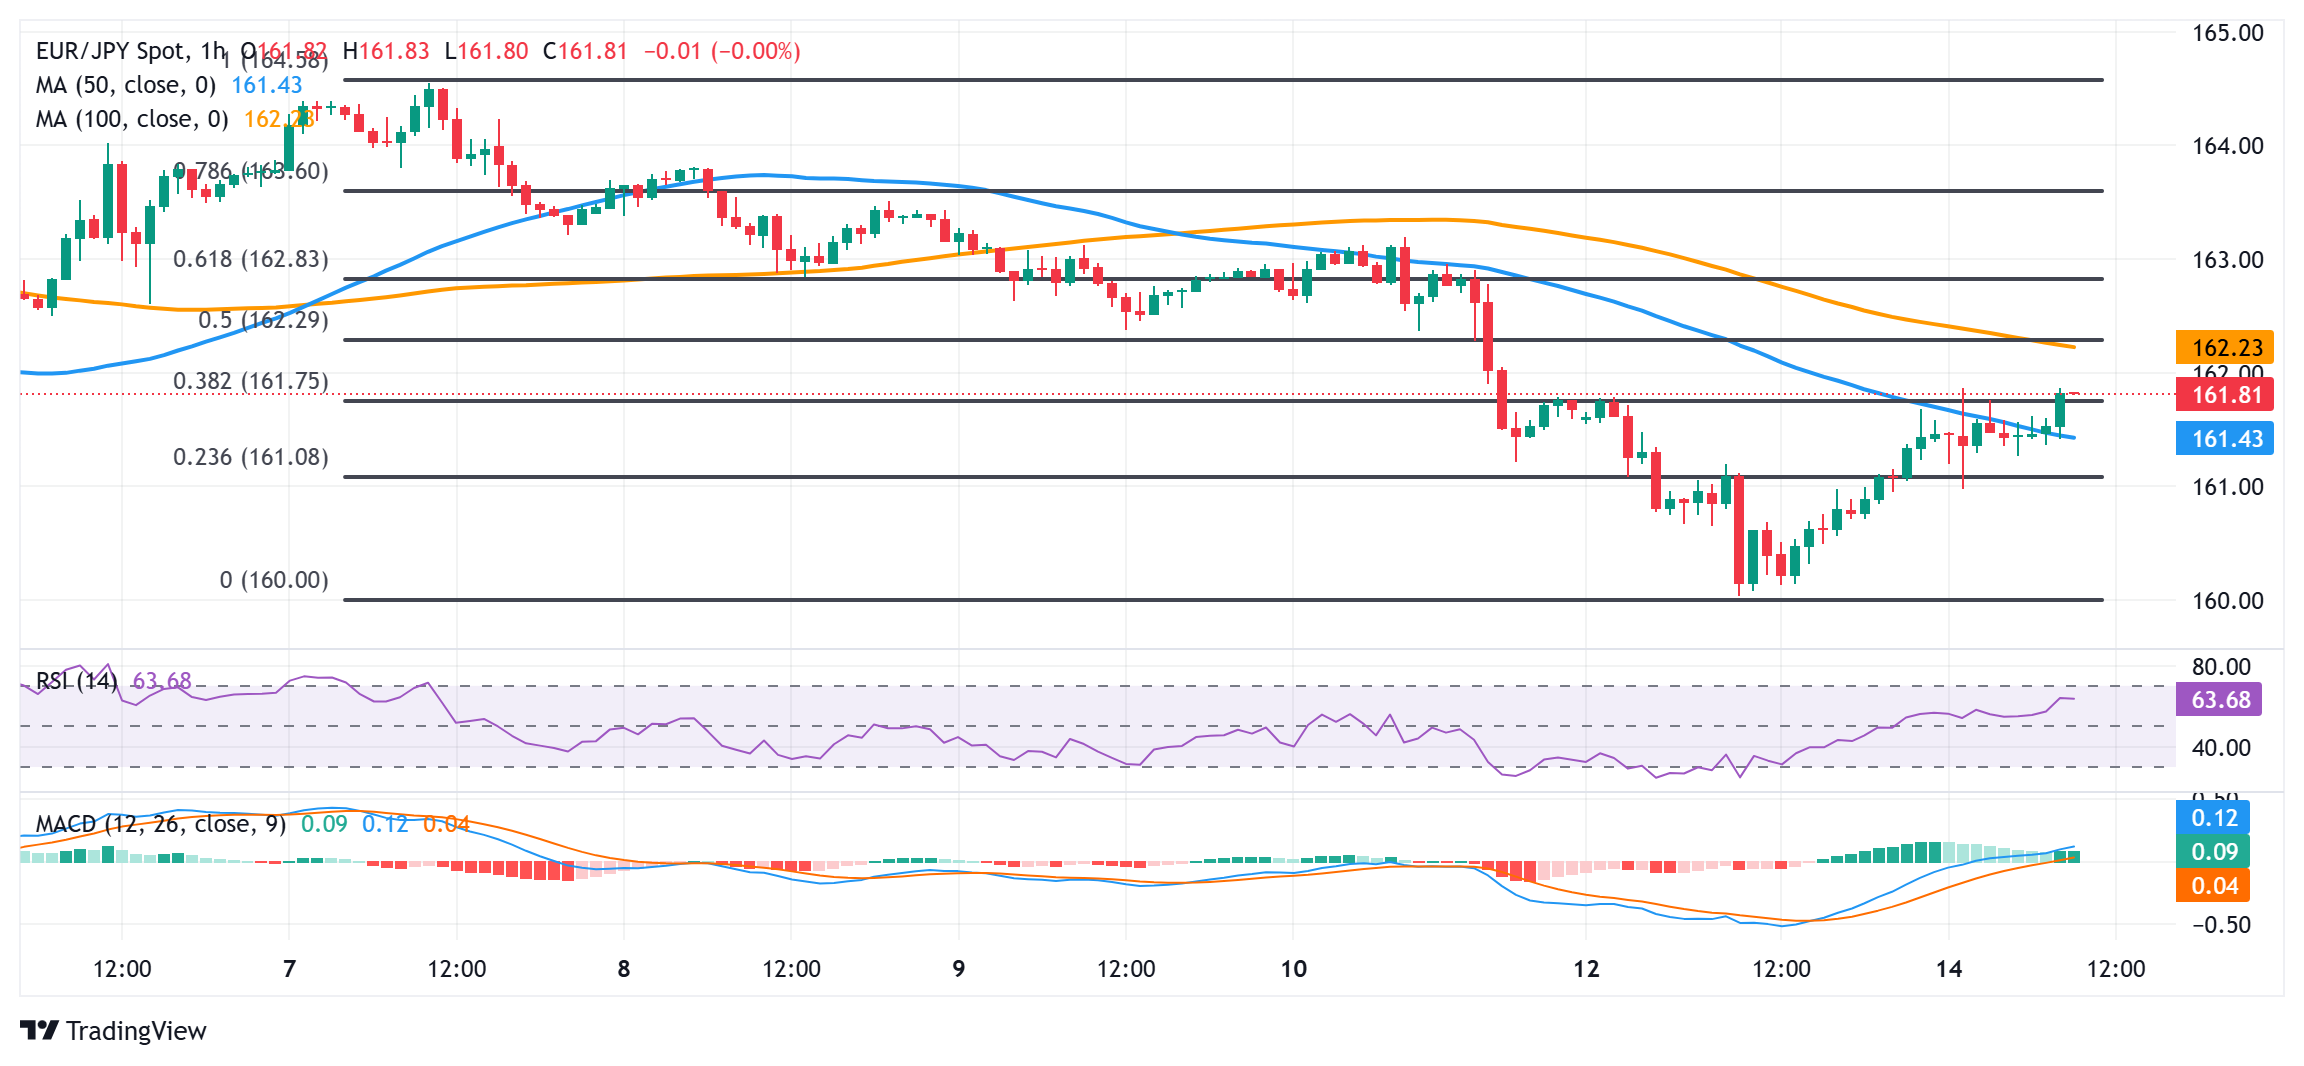
Japanese Yen FAQs
The Japanese Yen (JPY) is one of the world’s most traded currencies. Its value is broadly determined by the performance of the Japanese economy, but more specifically by the Bank of Japan’s policy, the differential between Japanese and US bond yields, or risk sentiment among traders, among other factors.
One of the Bank of Japan’s mandates is currency control, so its moves are key for the Yen. The BoJ has directly intervened in currency markets sometimes, generally to lower the value of the Yen, although it refrains from doing it often due to political concerns of its main trading partners. The BoJ ultra-loose monetary policy between 2013 and 2024 caused the Yen to depreciate against its main currency peers due to an increasing policy divergence between the Bank of Japan and other main central banks. More recently, the gradually unwinding of this ultra-loose policy has given some support to the Yen.
Over the last decade, the BoJ’s stance of sticking to ultra-loose monetary policy has led to a widening policy divergence with other central banks, particularly with the US Federal Reserve. This supported a widening of the differential between the 10-year US and Japanese bonds, which favored the US Dollar against the Japanese Yen. The BoJ decision in 2024 to gradually abandon the ultra-loose policy, coupled with interest-rate cuts in other major central banks, is narrowing this differential.
The Japanese Yen is often seen as a safe-haven investment. This means that in times of market stress, investors are more likely to put their money in the Japanese currency due to its supposed reliability and stability. Turbulent times are likely to strengthen the Yen’s value against other currencies seen as more risky to invest in.
-
10:01
Italy Industrial Output w.d.a (YoY) rose from previous -3.6% to -1.5% in November
-
10:01
Italy Industrial Output s.a. (MoM) meets forecasts (0.3%) in November
-
09:30
ECB’s Holzmann: We hope to meet the 2% inflation target by year-end
European Central Bank (ECB) policymaker Robert Holzmann commented on the inflation outlook in his appearance on Tuesday.
Holzmann noted: “We hope to meet the 2% inflation target by year-end.”
Market reaction
EUR/USD was last seen trading 0.22% higher on the day at 1.0266, little affected by these comments.
ECB FAQs
The European Central Bank (ECB) in Frankfurt, Germany, is the reserve bank for the Eurozone. The ECB sets interest rates and manages monetary policy for the region. The ECB primary mandate is to maintain price stability, which means keeping inflation at around 2%. Its primary tool for achieving this is by raising or lowering interest rates. Relatively high interest rates will usually result in a stronger Euro and vice versa. The ECB Governing Council makes monetary policy decisions at meetings held eight times a year. Decisions are made by heads of the Eurozone national banks and six permanent members, including the President of the ECB, Christine Lagarde.
In extreme situations, the European Central Bank can enact a policy tool called Quantitative Easing. QE is the process by which the ECB prints Euros and uses them to buy assets – usually government or corporate bonds – from banks and other financial institutions. QE usually results in a weaker Euro. QE is a last resort when simply lowering interest rates is unlikely to achieve the objective of price stability. The ECB used it during the Great Financial Crisis in 2009-11, in 2015 when inflation remained stubbornly low, as well as during the covid pandemic.
Quantitative tightening (QT) is the reverse of QE. It is undertaken after QE when an economic recovery is underway and inflation starts rising. Whilst in QE the European Central Bank (ECB) purchases government and corporate bonds from financial institutions to provide them with liquidity, in QT the ECB stops buying more bonds, and stops reinvesting the principal maturing on the bonds it already holds. It is usually positive (or bullish) for the Euro.
-
09:18
AUD/JPY moves above 97.50 due to strong commodity prices, improved market sentiment
- AUD/JPY rises as the Australian Dollar receives support from strong commodity prices.
- The ASX 200 Index rose by 0.48% to around 8,230 on Tuesday due to improved mining and energy stocks.
- Traders speculate that the BoJ might postpone raising rates until April, as it seeks sustained wage growth before taking action.
AUD/JPY gains ground for the second successive day, trading around 97.60 during the European hours on Tuesday. The upside of the AUD/JPY cross is attributed to the improved Australian Dollar (AUD) amid strong commodity prices.
The S&P/ASX 200 Index also increased by 0.48% to around 8,230 on Tuesday, snapping a three-day losing streak. Mining and energy stocks led the recovery, while Australian shares followed overnight gains on Wall Street, where investors shifted focus from megacap tech stocks to other sectors.
Additionally, the AUD/JPY cross appreciates as the risk-sensitive AUD receives support from risk-on sentiment following reports about US President-elect Donald Trump's economic team considering a gradual increase in import tariffs boosted investor confidence.
According to Bloomberg, Trump's incoming administration is evaluating a phased approach to implementing tariffs, aiming to prevent a sharp rise in inflation while managing trade policy adjustments.
Moreover, the Japanese Yen (JPY) faces pressure amid uncertainty over the timing of the Bank of Japan's (BoJ) next rate hike. Market participants speculate that the BoJ may delay raising rates until April, awaiting confirmation of sustained wage growth during the spring negotiations.
Bank of Japan Deputy Governor Ryozo Himino stated on Tuesday that he would not directly link President Trump's inauguration address to the BoJ's decision on whether to raise rates in January. Himino emphasized that when the right time comes, the BoJ must adjust its policy without delay.
Regarding Trump's address, Himino expressed the intention to closely analyze the schedule and balance of the new US administration's policy measures and to see if any new information not previously communicated would emerge.
Risk sentiment FAQs
In the world of financial jargon the two widely used terms “risk-on” and “risk off'' refer to the level of risk that investors are willing to stomach during the period referenced. In a “risk-on” market, investors are optimistic about the future and more willing to buy risky assets. In a “risk-off” market investors start to ‘play it safe’ because they are worried about the future, and therefore buy less risky assets that are more certain of bringing a return, even if it is relatively modest.
Typically, during periods of “risk-on”, stock markets will rise, most commodities – except Gold – will also gain in value, since they benefit from a positive growth outlook. The currencies of nations that are heavy commodity exporters strengthen because of increased demand, and Cryptocurrencies rise. In a “risk-off” market, Bonds go up – especially major government Bonds – Gold shines, and safe-haven currencies such as the Japanese Yen, Swiss Franc and US Dollar all benefit.
The Australian Dollar (AUD), the Canadian Dollar (CAD), the New Zealand Dollar (NZD) and minor FX like the Ruble (RUB) and the South African Rand (ZAR), all tend to rise in markets that are “risk-on”. This is because the economies of these currencies are heavily reliant on commodity exports for growth, and commodities tend to rise in price during risk-on periods. This is because investors foresee greater demand for raw materials in the future due to heightened economic activity.
The major currencies that tend to rise during periods of “risk-off” are the US Dollar (USD), the Japanese Yen (JPY) and the Swiss Franc (CHF). The US Dollar, because it is the world’s reserve currency, and because in times of crisis investors buy US government debt, which is seen as safe because the largest economy in the world is unlikely to default. The Yen, from increased demand for Japanese government bonds, because a high proportion are held by domestic investors who are unlikely to dump them – even in a crisis. The Swiss Franc, because strict Swiss banking laws offer investors enhanced capital protection.
-
09:12
Pound Sterling finds support while higher UK gilt yields keep downside intact
- The Pound Sterling recovers slightly after facing a sharp sell-off in the last few trading days, with investors focusing on the UK CPI data for December on Wednesday.
- The weak outlook of the British currency stays afloat amid higher UK gilt yields.
- Investors await the US inflation data, which will influence expectations for the Fed’s policy outlook.
The Pound Sterling (GBP) finds temporary support on Tuesday after facing a sharp sell-off in the last few trading days due to rising yields on the United Kingdom (UK) gilts. The 30-year UK gilt yields have risen to near 5.47%, the highest since 1998, due to multiple tailwinds, such as higher uncertainty about incoming trade policies under the administration of United States (US) President-elect Donald Trump, persistent inflationary pressures and slower growth expectations in Britain.
A healthy rise in UK gilt yields has resulted in a discomforting situation for UK Chancellor of the Exchequer Rachel Reeves, who was already facing backlash from employers for raising their contribution to National Insurance (NI) and leaving little fiscal headroom if the situation turns upside down.
Market participants expect the UK government to turn to foreign financing to fund routine spending to avoid rising domestic borrowing costs. However, the British finance ministry maintains its non-negotiable promise to rely on borrowing only for investment, not for addressing day-to-day spending.
Meanwhile, investors shift their focus to the UK Consumer Price Index (CPI) data for December, which will be released on Wednesday. Investors will pay close attention to the UK inflation data as it will drive market expectations for the Bank of England’s (BoE) likely interest rate action in the February policy meeting.
Analysts at UBS expect the BoE to cut interest rates next month, with more reductions remaining in the pipeline later this year. UBS said that higher borrowing costs, which are flowing into the real economy, are “tightening financial conditions”. The Swiss bank added, “Inflationary pressures are present but fading, so a cut in February, with more later this year, remains the base case.”
Daily digest market movers: Pound Sterling bounces back against US Dollar
- The Pound Sterling moves higher to near 1.2250 against the US Dollar (USD) in Tuesday’s European session after rebounding from a fresh yearly low of 1.2100 on Monday. However, the outlook of the GBP/USD pair remains weak amid firm expectations that the Federal Reserve (Fed) will deliver less interest rate cuts this year. The US Dollar Index (DXY), which tracks the Greenback’s value against six major currencies, ticks lower to near 109.60 at the time of writing. The USD Index corrects slightly after posting a fresh more-than-two-year high above 110.00 on Monday.
- Strategists at Barclays have revised down their expectations for the number of interest rate cuts by the Fed this year. The bank expects the Fed to deliver only one cut this year, compared to two previously, based on stronger-than-expected US labor market data and persistent inflation expectations.
- Meanwhile, investors await the US CPI data for December, which will be released on Wednesday. Year-on-year headline inflation is expected to have accelerated to 2.8% from 2.7% in November, with core reading growing steadily by 3.3%.
- Signs of stubborn price pressures could accelerate expectations that the Fed will avoid cutting interest rates this year. However, a slowdown in inflationary pressures is unlikely to boost the Fed’s dovish bets, as investors expect incoming policies under Trump’s administration, such as immigration controls, tax cuts, and tariff hikes, to fuel the growth rate.
Technical Analysis: Pound Sterling rebounds slightly as RSI turns oversold

The Pound Sterling rebounds slightly to near 1.2250 against the US Dollar in Tuesday’s European session after refreshing its more-than-a-year low to near 1.2100 on Monday. However, the outlook for Cable remains weak as the vertically declining 20-day Exponential Moving Average (EMA) near 1.2430 suggests that the near-term trend is extremely bearish.
The 14-day Relative Strength Index (RSI) rebounds slightly after diving below 30.00 as the momentum oscillator turned oversold. However, the broader scenario remains bearish until it recovers inside the 20.00-40.00 range.
Looking down, the pair is expected to find support near the October 2023 low of 1.2050. On the upside, the 20-day EMA will act as key resistance.
Pound Sterling FAQs
The Pound Sterling (GBP) is the oldest currency in the world (886 AD) and the official currency of the United Kingdom. It is the fourth most traded unit for foreign exchange (FX) in the world, accounting for 12% of all transactions, averaging $630 billion a day, according to 2022 data. Its key trading pairs are GBP/USD, also known as ‘Cable’, which accounts for 11% of FX, GBP/JPY, or the ‘Dragon’ as it is known by traders (3%), and EUR/GBP (2%). The Pound Sterling is issued by the Bank of England (BoE).
The single most important factor influencing the value of the Pound Sterling is monetary policy decided by the Bank of England. The BoE bases its decisions on whether it has achieved its primary goal of “price stability” – a steady inflation rate of around 2%. Its primary tool for achieving this is the adjustment of interest rates. When inflation is too high, the BoE will try to rein it in by raising interest rates, making it more expensive for people and businesses to access credit. This is generally positive for GBP, as higher interest rates make the UK a more attractive place for global investors to park their money. When inflation falls too low it is a sign economic growth is slowing. In this scenario, the BoE will consider lowering interest rates to cheapen credit so businesses will borrow more to invest in growth-generating projects.
Data releases gauge the health of the economy and can impact the value of the Pound Sterling. Indicators such as GDP, Manufacturing and Services PMIs, and employment can all influence the direction of the GBP. A strong economy is good for Sterling. Not only does it attract more foreign investment but it may encourage the BoE to put up interest rates, which will directly strengthen GBP. Otherwise, if economic data is weak, the Pound Sterling is likely to fall.
Another significant data release for the Pound Sterling is the Trade Balance. This indicator measures the difference between what a country earns from its exports and what it spends on imports over a given period. If a country produces highly sought-after exports, its currency will benefit purely from the extra demand created from foreign buyers seeking to purchase these goods. Therefore, a positive net Trade Balance strengthens a currency and vice versa for a negative balance.
-
08:49
NZD/USD rises above 0.5600 due to risk-on sentiment, China’s stimulus measures
- NZD/USD appreciates as the NZD receives support from China's recent stimulus measures.
- PBOC Governor Pan Gongsheng emphasized that China will continue to be a driving force for the global economy.
- Market sentiment improves following reports of the incoming Trump administration considering a gradual increase in import tariffs.
NZD/USD extends its gains for the second successive day, trading around 0.5610 during the early European hours on Tuesday. The upside of the NZD/USD pair could be attributed to China's recent stimulus measures, given the close trading relationship between New Zealand and China, any changes in China's economic conditions could significantly influence antipodean markets.
People's Bank of China (PBOC) Governor Pan Gongsheng stated on Monday that "interest rate and reserve requirement ratio (RRR) tools will be utilized to maintain ample liquidity." Gongsheng reaffirmed China's plans to increase the fiscal deficit and emphasized that China will continue to be a driving force for the global economy.
Xuan Changneng, Deputy Governor of the People’s Bank of China (PBOC), stated on Tuesday that the central bank will "continue implementing measures to maintain the Yuan exchange rate at a reasonable and balanced level." Changneng emphasized plans to enhance counter-cyclical policy adjustments and prevent excessive fluctuations in the exchange rate to ensure the Yuan's stability.
Additionally, the NZD/USD pair appreciates as the risk-sensitive New Zealand Dollar (NZD) gains ground amid risk-on sentiment following reports about US President-elect Donald Trump's economic team considering a gradual increase in import tariffs boosted investor confidence. According to Bloomberg, Trump's incoming administration is evaluating a phased approach to implementing tariffs, aiming to prevent a sharp rise in inflation while managing trade policy adjustments.
The US Dollar Index (DXY), which measures the US Dollar’s performance against six major currencies, corrects downwards after reaching its highest level at 110.18 since November 2022. At the time of writing, the DXY maintains its position near 109.50. The USD appreciates as the recent US labor market figures for December, which is expected to support the US Federal Reserve’s (Fed) decision to maintain interest rates at current levels in January.
Additionally, the reinforced hawkish sentiment surrounding the Fed’s policy outlook sparked a rise in US Treasury yields, with the 2-year yield reaching 4.42% and the 10-year yield rising to 4.80% as of Monday. The higher yields are helping the Greenback stay near recent highs. The US Producer Price Index (PPI) for December will take center stage later on Tuesday.
New Zealand Dollar FAQs
The New Zealand Dollar (NZD), also known as the Kiwi, is a well-known traded currency among investors. Its value is broadly determined by the health of the New Zealand economy and the country’s central bank policy. Still, there are some unique particularities that also can make NZD move. The performance of the Chinese economy tends to move the Kiwi because China is New Zealand’s biggest trading partner. Bad news for the Chinese economy likely means less New Zealand exports to the country, hitting the economy and thus its currency. Another factor moving NZD is dairy prices as the dairy industry is New Zealand’s main export. High dairy prices boost export income, contributing positively to the economy and thus to the NZD.
The Reserve Bank of New Zealand (RBNZ) aims to achieve and maintain an inflation rate between 1% and 3% over the medium term, with a focus to keep it near the 2% mid-point. To this end, the bank sets an appropriate level of interest rates. When inflation is too high, the RBNZ will increase interest rates to cool the economy, but the move will also make bond yields higher, increasing investors’ appeal to invest in the country and thus boosting NZD. On the contrary, lower interest rates tend to weaken NZD. The so-called rate differential, or how rates in New Zealand are or are expected to be compared to the ones set by the US Federal Reserve, can also play a key role in moving the NZD/USD pair.
Macroeconomic data releases in New Zealand are key to assess the state of the economy and can impact the New Zealand Dollar’s (NZD) valuation. A strong economy, based on high economic growth, low unemployment and high confidence is good for NZD. High economic growth attracts foreign investment and may encourage the Reserve Bank of New Zealand to increase interest rates, if this economic strength comes together with elevated inflation. Conversely, if economic data is weak, NZD is likely to depreciate.
The New Zealand Dollar (NZD) tends to strengthen during risk-on periods, or when investors perceive that broader market risks are low and are optimistic about growth. This tends to lead to a more favorable outlook for commodities and so-called ‘commodity currencies’ such as the Kiwi. Conversely, NZD tends to weaken at times of market turbulence or economic uncertainty as investors tend to sell higher-risk assets and flee to the more-stable safe havens.
-
08:45
France Budget Balance fell from previous €-157.39B to €-172.486B in November
-
08:43
Forex Today: Dollar takes a breather ahead of US PPI data, Fedspeak
Here is what you need to know on Tuesday, January 14:
Following a mixed close on Wall Street overnight, markets witnessed a sluggish performance in Asian indices as Japanese markets reopened on a negative note.
However, risk sentiment shifted in favor of optimists after Chinese stocks rebounded the most in over two months, eyeing a press conference jointly hosted by the People's Bank of China (PBoC) and the State Administration of Foreign Exchange (SAFE) this Tuesday to see if Beijing will step up efforts to shore up the economy and defend its currency.
The risk recovery is fuelling a fresh leg lower in the safe-haven US Dollar (USD) in the early European trading hours, boosting forex majors' recovery paths. The Greenback lost ground late Monday after Bloomberg reported, citing people familiar with the matter, that advisors on US President-elect Donald Trump’s incoming economic team are considering gradually implementation of tariffs, hiking them incrementally each month by 2% to 5%.
Markets are also resorting to profit-taking on the USD long positions ahead of the top-tier US Producer Price Index (PPI) inflation data and speeches from Fed policymakers John Williams and Jeffery Schmid for fresh cues on the world’s most powerful central bank’s interest rate path. Traders are pricing in 29 basis points (bps) of easing this year, less than the 50 bps the Fed projected in December, according to the CME Group’s FedWatch Tool.
The benchmark US 10-year Treasury bond yield extends correction from its highest level since November 2023, adding to the downside in the Greenback.
US Dollar PRICE Today
The table below shows the percentage change of US Dollar (USD) against listed major currencies today. US Dollar was the weakest against the New Zealand Dollar.
USD EUR GBP JPY CAD AUD NZD CHF USD -0.35% -0.27% -0.11% -0.12% -0.50% -0.85% -0.27% EUR 0.35% 0.07% 0.21% 0.22% -0.16% -0.50% 0.08% GBP 0.27% -0.07% 0.15% 0.15% -0.23% -0.57% 0.01% JPY 0.11% -0.21% -0.15% -0.01% -0.39% -0.74% -0.16% CAD 0.12% -0.22% -0.15% 0.01% -0.38% -0.72% -0.14% AUD 0.50% 0.16% 0.23% 0.39% 0.38% -0.33% 0.24% NZD 0.85% 0.50% 0.57% 0.74% 0.72% 0.33% 0.59% CHF 0.27% -0.08% -0.01% 0.16% 0.14% -0.24% -0.59% The heat map shows percentage changes of major currencies against each other. The base currency is picked from the left column, while the quote currency is picked from the top row. For example, if you pick the US Dollar from the left column and move along the horizontal line to the Japanese Yen, the percentage change displayed in the box will represent USD (base)/JPY (quote).
Across the FX board, USD/JPY remains on the back foot near 157.50 after witnessing sharp moves in Asia in the wake of Bank of Japan (BoJ) Deputy Governor Ryozo Himino’s commentary. Himino said the central bank will debate whether to raise rates next week as prospects of sustained wage gains heighten.
AUD/USD clings to recovery gains at around 0.6200 amid risk-rally in Chinese stocks on stimulus hopes. However, the divergent policy outlook between the Fed and the Reserve Bank of Australia (RBA) and looming US-Sino trade risks keep the upside limited.
EUR/USD holds firm above 1.0250, recovering from 26-month lows of 1.0773 set on Monday. Broad US Dollar pullback and retreating US Treasury bond yields offset the recent dovish ECB-speak, boding well for the pair amid a risk-on mood. T
The Pound Sterling rejoices some gains above 1.2200 against the US Dollar correction. GBP/USD hit a 15-month low of 1.2100 on Monday, undermined by the UK’s fiscal health and increased inflationary concerns under the Trump 2.0 era.
USD/CAD is off the low but remains below 1.4400 even as Oil prices retrace from three-month highs. WTI oil price is down 0.50% on the day, trading near $77 as of writing.
Gold price attempts another run to recapture the $2,700 in the European session on Tuesday, looking to resume the upside fuelled by the symmetrical triangle breakout on the daily chart.
-
08:27
PBOC’s Xuan: Will continue to take measures to keep Yuan basically stable at reasonable and balanced levels
Xuan Changneng, People’s Bank of China (PBOC) Deputy Governor, said on Tuesday that the central bank “will continue to take measures to keep the Yuan exchange rate basically stable at reasonable and balanced levels.”
Additional quotes
Will step up counter-cyclical policy adjustment.
Will prevent overshooting risks in exchange rate, to keep the Yuan stable.
-
08:14
WTI trades with negative bias around $77.00, snaps three-day winning streak to multi-month top
- WTI retreats from over a three-month high, though the downside seems cushioned.
- US sanctions on Russia fuel worries about tightening global supply and lend support.
- The recent breakout through the very important 200-day SMA favors bullish traders.
West Texas Intermediate (WTI) US Crude Oil prices edge lower on Tuesday and for now, seem to have snapped a three-day winning streak to the highest level since October 8 touched the previous day. The commodity trades with a negative bias around the $77.00 mark during the early part of the European session, though the fundamental backdrop warrants some caution before positioning for deeper losses.
The US Treasury Department on Friday imposed tougher sanctions against Russia's oil industry, targeting nearly 200 vessels of the so-called shadow fleet of tankers. The latest development threatens to tighten global supplies. Adding to this, speculations that US President-elect Donald Trump's administration may tighten sanctions against flows from Iran in the coming months should continue to support Oil prices and validate the positive outlook for the commodity.
Meanwhile, the incoming US macro data pointed to a resilient economy. Furthermore, expectations that Trump's expansionary policies will boost fuel demand support prospects for a further appreciating move for Crude Oil prices. Apart from this, the ongoing US Dollar (USD) profit-taking slide, prompted by retreating US Treasury bond yields and easing fears about Trump's disruptive trade tariffs, suggests that the path of least resistance for the black liquid is to the upside.
Even from a technical perspective, last Friday's breakout and acceptance above the very important 20-day Simple Moving Average (SMA) adds credence to the constructive outlook. Hence, any subsequent slide could be seen as a buying opportunity and is more likely to remain cushioned. Traders now look forward to the release of the US Producer Price Index (PPI), which will influence the USD and provide some meaningful impetus to USD-denominated Crude Oil prices.
WTI Oil FAQs
WTI Oil is a type of Crude Oil sold on international markets. The WTI stands for West Texas Intermediate, one of three major types including Brent and Dubai Crude. WTI is also referred to as “light” and “sweet” because of its relatively low gravity and sulfur content respectively. It is considered a high quality Oil that is easily refined. It is sourced in the United States and distributed via the Cushing hub, which is considered “The Pipeline Crossroads of the World”. It is a benchmark for the Oil market and WTI price is frequently quoted in the media.
Like all assets, supply and demand are the key drivers of WTI Oil price. As such, global growth can be a driver of increased demand and vice versa for weak global growth. Political instability, wars, and sanctions can disrupt supply and impact prices. The decisions of OPEC, a group of major Oil-producing countries, is another key driver of price. The value of the US Dollar influences the price of WTI Crude Oil, since Oil is predominantly traded in US Dollars, thus a weaker US Dollar can make Oil more affordable and vice versa.
The weekly Oil inventory reports published by the American Petroleum Institute (API) and the Energy Information Agency (EIA) impact the price of WTI Oil. Changes in inventories reflect fluctuating supply and demand. If the data shows a drop in inventories it can indicate increased demand, pushing up Oil price. Higher inventories can reflect increased supply, pushing down prices. API’s report is published every Tuesday and EIA’s the day after. Their results are usually similar, falling within 1% of each other 75% of the time. The EIA data is considered more reliable, since it is a government agency.
OPEC (Organization of the Petroleum Exporting Countries) is a group of 12 Oil-producing nations who collectively decide production quotas for member countries at twice-yearly meetings. Their decisions often impact WTI Oil prices. When OPEC decides to lower quotas, it can tighten supply, pushing up Oil prices. When OPEC increases production, it has the opposite effect. OPEC+ refers to an expanded group that includes ten extra non-OPEC members, the most notable of which is Russia.
-
08:11
China New Loans registered at 990B above expectations (760B) in December
-
08:11
China M2 Money Supply (YoY) meets forecasts (7.3%) in December
-
07:32
USD/CAD holds below 1.4400 on rising oil prices, US PPI data looms
- USD/CAD trades in negative territory near 1.4380 in Tuesday’s early European session.
- A rise in crude oil prices and stronger Canadian job reports support the CAD.
- Investors dial back bets on Fed rate cuts in 2025.
The USD/CAD pair remains weak around 1.4380 during the early European trading hours on Tuesday. The stronger-than-expected Canadian December labor market data and a surge in crude oil prices underpin the Canadian Dollar (CAD) against the Greenback. Traders will take more cues from the US December Producer Price Index (PPI), which will be released later on Tuesday.
Traders have become slightly less confident the Bank of Canada (BoC) will continue cutting interest rates in the January meeting after data on Friday showed that the Canadian economy added more jobs than expected in December. The possibility of an interest rate cut from the BoC on January 29 declined to 61%, down from 70% before the labor market data, according to Reuters.
Furthermore, higher crude oil prices amid wider United States (US) sanctions on Russian oil boost the commodity-linked Loonie, as Canada is the largest oil exporter to the US.
On the US front, the Bureau of Labor Statistics indicated on Friday that Nonfarm Payrolls (NFP) increased by 256,000 jobs in December, the most since March, while the Unemployment Rate fell to 4.1% during the same report period. This reading could reinforce bets that the US central bank will maintain a hawkish stance through most of the year, which might lift the USD. The markets are discounting the chances at 2.7% for a 25 basis points (bps) rate cut at the January 28-29 FOMC meeting, according to the CME FedWatch tool.Canadian Dollar FAQs
The key factors driving the Canadian Dollar (CAD) are the level of interest rates set by the Bank of Canada (BoC), the price of Oil, Canada’s largest export, the health of its economy, inflation and the Trade Balance, which is the difference between the value of Canada’s exports versus its imports. Other factors include market sentiment – whether investors are taking on more risky assets (risk-on) or seeking safe-havens (risk-off) – with risk-on being CAD-positive. As its largest trading partner, the health of the US economy is also a key factor influencing the Canadian Dollar.
The Bank of Canada (BoC) has a significant influence on the Canadian Dollar by setting the level of interest rates that banks can lend to one another. This influences the level of interest rates for everyone. The main goal of the BoC is to maintain inflation at 1-3% by adjusting interest rates up or down. Relatively higher interest rates tend to be positive for the CAD. The Bank of Canada can also use quantitative easing and tightening to influence credit conditions, with the former CAD-negative and the latter CAD-positive.
The price of Oil is a key factor impacting the value of the Canadian Dollar. Petroleum is Canada’s biggest export, so Oil price tends to have an immediate impact on the CAD value. Generally, if Oil price rises CAD also goes up, as aggregate demand for the currency increases. The opposite is the case if the price of Oil falls. Higher Oil prices also tend to result in a greater likelihood of a positive Trade Balance, which is also supportive of the CAD.
While inflation had always traditionally been thought of as a negative factor for a currency since it lowers the value of money, the opposite has actually been the case in modern times with the relaxation of cross-border capital controls. Higher inflation tends to lead central banks to put up interest rates which attracts more capital inflows from global investors seeking a lucrative place to keep their money. This increases demand for the local currency, which in Canada’s case is the Canadian Dollar.
Macroeconomic data releases gauge the health of the economy and can have an impact on the Canadian Dollar. Indicators such as GDP, Manufacturing and Services PMIs, employment, and consumer sentiment surveys can all influence the direction of the CAD. A strong economy is good for the Canadian Dollar. Not only does it attract more foreign investment but it may encourage the Bank of Canada to put up interest rates, leading to a stronger currency. If economic data is weak, however, the CAD is likely to fall.
-
07:31
India WPI Inflation registered at 2.37% above expectations (2.3%) in December
-
07:15
EUR/GBP hovers around 0.8400, remains below over two-month high set on Monday
- EUR/GBP turns positive for the fifth straight day on Tuesday, though it lacks follow-through.
- Stagflation fears and UK fiscal concerns continue to weigh on the GBP and support the cross.
- Traders look forward to a scheduled speech by BoE’s Breeden for short-term opportunities.
The EUR/GBP cross attracts some dip-buyers on Tuesday and stalls the previous day's modest pullback from the vicinity of the 200-day Simple Moving Average (SMA), or a two-and-half-month top. Spot prices turn positive for the fifth successive day heading into the European session, with bulls looking to build on the intraday move-up beyond the 0.8400 mark.
The British Pound (GBP) continues with its relative underperformance in the wake of the risk of stagflation – a combination of high inflation and weak economic growth. Furthermore, concerns over the UK’s fiscal situation, amid a surge in UK borrowing costs, contribute to denting sentiment surrounding the GBP and turn out to be a key factor acting as a tailwind for the EUR/GBP cross.
The shared currency, on the other hand, struggles to gain any meaningful positive traction on the back of the European Central Bank's (ECB) dovish bias and concerns about the faltering Eurozone economy. In fact, the ECB cut interest rates for the fourth time in December and left the door open to further easing in 2025. This, in turn, is holding back bulls from placing fresh bets around the EUR/GBP cross.
Moving ahead, there isn't any relevant market-moving economic data due for release from the UK or the Eurozone on Tuesday. Hence, the focus will remain glued to the Bank of England (BoE) Deputy Governor Sarah Breeden's scheduled speech, which will influence the GBP and provide some meaningful impetus to the EUR/GBP cross ahead of the UK consumer inflation figures on Wednesday.
Pound Sterling FAQs
The Pound Sterling (GBP) is the oldest currency in the world (886 AD) and the official currency of the United Kingdom. It is the fourth most traded unit for foreign exchange (FX) in the world, accounting for 12% of all transactions, averaging $630 billion a day, according to 2022 data. Its key trading pairs are GBP/USD, also known as ‘Cable’, which accounts for 11% of FX, GBP/JPY, or the ‘Dragon’ as it is known by traders (3%), and EUR/GBP (2%). The Pound Sterling is issued by the Bank of England (BoE).
The single most important factor influencing the value of the Pound Sterling is monetary policy decided by the Bank of England. The BoE bases its decisions on whether it has achieved its primary goal of “price stability” – a steady inflation rate of around 2%. Its primary tool for achieving this is the adjustment of interest rates. When inflation is too high, the BoE will try to rein it in by raising interest rates, making it more expensive for people and businesses to access credit. This is generally positive for GBP, as higher interest rates make the UK a more attractive place for global investors to park their money. When inflation falls too low it is a sign economic growth is slowing. In this scenario, the BoE will consider lowering interest rates to cheapen credit so businesses will borrow more to invest in growth-generating projects.
Data releases gauge the health of the economy and can impact the value of the Pound Sterling. Indicators such as GDP, Manufacturing and Services PMIs, and employment can all influence the direction of the GBP. A strong economy is good for Sterling. Not only does it attract more foreign investment but it may encourage the BoE to put up interest rates, which will directly strengthen GBP. Otherwise, if economic data is weak, the Pound Sterling is likely to fall.
Another significant data release for the Pound Sterling is the Trade Balance. This indicator measures the difference between what a country earns from its exports and what it spends on imports over a given period. If a country produces highly sought-after exports, its currency will benefit purely from the extra demand created from foreign buyers seeking to purchase these goods. Therefore, a positive net Trade Balance strengthens a currency and vice versa for a negative balance.
-
07:02
GBP/JPY remains above 192.00 as receives support from risk-on sentiment
- GBP/JPY appreciates as market sentiment improves following reports of incoming Trump administration considering a gradual increase in import tariffs.
- The Japanese Yen struggles due to ongoing uncertainty regarding the timing of the BoJ’s next rate hike.
- The Pound Sterling could face challenges due to concerns over stagflation in the United Kingdom.
GBP/JPY breaks its five-day losing streak as the Pound Sterling (GBP) strengthens, driven by improved investor confidence following reports that US President-elect Donald Trump's economic team is considering a gradual increase in import tariffs. This prospect weakens the safe-haven Japanese Yen (JPY), providing support for the risk-sensitive Pound. As a result, the GBP/JPY cross appreciates, trading around 192.30 during the Asian session on Tuesday.
On Monday, a Bloomberg report highlighted that Trump's incoming administration is evaluating a phased approach to implementing tariffs, aiming to prevent a sharp rise in inflation while managing trade policy adjustments.
Additionally, the GBP/JPY cross appreciates as the Japanese Yen (JPY) faces pressure amid uncertainty over the timing of the Bank of Japan's (BoJ) next rate hike. Market participants speculate that the BoJ may delay raising rates until April, awaiting confirmation of sustained wage growth during the spring negotiations.
Bank of Japan Deputy Governor Ryozo Himino stated on Tuesday that he would not directly link President Trump's inauguration address to the BoJ's decision on whether to raise rates in January. Himino emphasized that when the right time comes, the BoJ must adjust its policy without delay.
Regarding Trump's address, Himino expressed the intention to closely analyze the schedule and balance of the new US administration's policy measures and to see if any new information not previously communicated would emerge.
However, the upside of the GBP/JPY cross could be restrained as the Pound Sterling (GBP) may struggle due to concerns over stagflation in the United Kingdom (UK) amid persistent inflation and stagnant economic growth.
Additionally, a recent surge in UK government bond yields has sparked worries about the country's fiscal health. Investors have been offloading UK gilts, driven by fears of mounting debt, sluggish growth, and inflation risks. These concerns contribute to the GBP’s relative weakness.
Pound Sterling FAQs
The Pound Sterling (GBP) is the oldest currency in the world (886 AD) and the official currency of the United Kingdom. It is the fourth most traded unit for foreign exchange (FX) in the world, accounting for 12% of all transactions, averaging $630 billion a day, according to 2022 data. Its key trading pairs are GBP/USD, also known as ‘Cable’, which accounts for 11% of FX, GBP/JPY, or the ‘Dragon’ as it is known by traders (3%), and EUR/GBP (2%). The Pound Sterling is issued by the Bank of England (BoE).
The single most important factor influencing the value of the Pound Sterling is monetary policy decided by the Bank of England. The BoE bases its decisions on whether it has achieved its primary goal of “price stability” – a steady inflation rate of around 2%. Its primary tool for achieving this is the adjustment of interest rates. When inflation is too high, the BoE will try to rein it in by raising interest rates, making it more expensive for people and businesses to access credit. This is generally positive for GBP, as higher interest rates make the UK a more attractive place for global investors to park their money. When inflation falls too low it is a sign economic growth is slowing. In this scenario, the BoE will consider lowering interest rates to cheapen credit so businesses will borrow more to invest in growth-generating projects.
Data releases gauge the health of the economy and can impact the value of the Pound Sterling. Indicators such as GDP, Manufacturing and Services PMIs, and employment can all influence the direction of the GBP. A strong economy is good for Sterling. Not only does it attract more foreign investment but it may encourage the BoE to put up interest rates, which will directly strengthen GBP. Otherwise, if economic data is weak, the Pound Sterling is likely to fall.
Another significant data release for the Pound Sterling is the Trade Balance. This indicator measures the difference between what a country earns from its exports and what it spends on imports over a given period. If a country produces highly sought-after exports, its currency will benefit purely from the extra demand created from foreign buyers seeking to purchase these goods. Therefore, a positive net Trade Balance strengthens a currency and vice versa for a negative balance.
-
06:32
FX option expiries for Jan 14 NY cut
FX option expiries for Jan 14 NY cut at 10:00 Eastern Time via DTCC can be found below.
EUR/USD: EUR amounts
- 1.0125 637m
- 1.0200 3.6b
- 1.0275 620m
- 1.0400 1b
GBP/USD: GBP amounts
- 1.2375 1.2b
USD/JPY: USD amounts
- 155.80 596m
- 156.50 800m
- 157.00 475m
- 159.00 591m
USD/CHF: USD amounts
- 0.9050 641m
AUD/USD: AUD amounts
- 0.6410 440m
USD/CAD: USD amounts
- 1.4300 518m
-
06:30
Netherlands, The Consumer Price Index n.s.a (YoY) in line with expectations (4.1%) in December
-
06:18
BoJ’s Himino: Won't tie Trump's inauguration address directly to decision on whether to hike rates in January
Bank of Japan (BoJ) Deputy Governor Ryozo Himino is back on the wires early Tuesday, shedding more light on the inflation and monetary policy outlook.
Additional comments
In Trump's address, hope to scrutinize schedule and balance of new US administration's policy measures, and whether anything not communicated so far would come out.
On a Yen-denominated basis, recent year-on-year rise in import prices is quite high.
Hard to say whether risk to inflation skewed to upside or downside.
Don't have something like a 'check list' in deciding whether to hike rates or not in January.
When right timing comes, the BoJ must change policy without delay.
Likelihood of economy, prices moving in line with our forecast is gradually heightening.
Daily, one-week moves in long-term interest rates won't serve as a basis for our policy decision, when asked about recent rise in global yields.
-
06:12
USD/CHF declines to near 0.9150 as traders brace for US PPI data
- USD/CHF drifts lower to near 0.9160 in Tuesday’s early European session.
- Markets lower Fed rate cut expectations this year after the stronger-than-expected US December NFP report.
- The uncertainty and geopolitical risks could support a safe-haven currency like the Swiss Franc.
The USD/CHF pair softens to around 0.9160, snapping the five-day winning streak during the early European session on Tuesday. The pair edges lower on the back of the decline in the US Dollar (USD). However, the expectations that the US Federal Reserve (Fed) will approach interest rate cuts cautiously this year might cap the pair’s downside.
Meanwhile, the US Dollar index (DXY), which measures the USD against a basket of currencies, currently trades near 109.55 after retreating from 110.17, its highest level since November 2022. The downside for the pair might be limited amid the concerns about rising inflation and limited prospects for further Fed rate cuts. Markets are now pricing in one rate reduction from the Fed by year-end, down from roughly two quarter-point cuts priced at the start of the year.
Traders will keep an eye on the US December Producer Price Index (PPI), which is due later on Tuesday. On Wednesday, the US December Consumer Price Index (CPI) inflation data will be the highlight. Any upside surprise could further close the door on future easing, which might lift the Greenback. A slew of Fed officials are also due to speak later this week.
Investors will closely watch the developments surrounding the geopolitical tensions in the Middle East. The United States has indicated that a ceasefire deal is “on the brink” of success, while Hamas said talks are progressing well, according to a statement issued after a meeting with Qatar’s emir. However, any sign of escalating geopolitical risks could boost the safe-haven flows, benefiting the Swiss Franc (CHF).Swiss Franc FAQs
The Swiss Franc (CHF) is Switzerland’s official currency. It is among the top ten most traded currencies globally, reaching volumes that well exceed the size of the Swiss economy. Its value is determined by the broad market sentiment, the country’s economic health or action taken by the Swiss National Bank (SNB), among other factors. Between 2011 and 2015, the Swiss Franc was pegged to the Euro (EUR). The peg was abruptly removed, resulting in a more than 20% increase in the Franc’s value, causing a turmoil in markets. Even though the peg isn’t in force anymore, CHF fortunes tend to be highly correlated with the Euro ones due to the high dependency of the Swiss economy on the neighboring Eurozone.
The Swiss Franc (CHF) is considered a safe-haven asset, or a currency that investors tend to buy in times of market stress. This is due to the perceived status of Switzerland in the world: a stable economy, a strong export sector, big central bank reserves or a longstanding political stance towards neutrality in global conflicts make the country’s currency a good choice for investors fleeing from risks. Turbulent times are likely to strengthen CHF value against other currencies that are seen as more risky to invest in.
The Swiss National Bank (SNB) meets four times a year – once every quarter, less than other major central banks – to decide on monetary policy. The bank aims for an annual inflation rate of less than 2%. When inflation is above target or forecasted to be above target in the foreseeable future, the bank will attempt to tame price growth by raising its policy rate. Higher interest rates are generally positive for the Swiss Franc (CHF) as they lead to higher yields, making the country a more attractive place for investors. On the contrary, lower interest rates tend to weaken CHF.
Macroeconomic data releases in Switzerland are key to assessing the state of the economy and can impact the Swiss Franc’s (CHF) valuation. The Swiss economy is broadly stable, but any sudden change in economic growth, inflation, current account or the central bank’s currency reserves have the potential to trigger moves in CHF. Generally, high economic growth, low unemployment and high confidence are good for CHF. Conversely, if economic data points to weakening momentum, CHF is likely to depreciate.
As a small and open economy, Switzerland is heavily dependent on the health of the neighboring Eurozone economies. The broader European Union is Switzerland’s main economic partner and a key political ally, so macroeconomic and monetary policy stability in the Eurozone is essential for Switzerland and, thus, for the Swiss Franc (CHF). With such dependency, some models suggest that the correlation between the fortunes of the Euro (EUR) and the CHF is more than 90%, or close to perfect.
-
06:09
EUR/USD Price Analysis: Trades around 1.0250 after rebounding from 26-month lows
- EUR/USD may struggle as it is confined within a descending channel pattern.
- The 14-day RSI moves above the 30 level, suggesting a recovery from oversold territory.
- The immediate resistance appears at a nine-day EMA of 1.0290 level.
The EUR/USD pair halts its five-day losing streak, trading around 1.0250 during Tuesday's Asian session. A closer look at the daily chart suggests a continued bearish trend, with the pair moving lower within a descending channel pattern.
The 14-day Relative Strength Index (RSI), a key momentum indicator, has risen above the 30 level, suggesting a recovery from oversold conditions. However, the EUR/USD pair remains below both the nine- and 14-day Exponential Moving Averages (EMAs), pointing to weaker short-term momentum and reinforcing the overall bearish outlook.
On the downside, the EUR/USD pair may revisit its 26-month low at 1.0177, recorded on January 14. A break below this level would lead the pair to test the psychological support level at 1.0000, followed by the lower boundary of the descending channel at 0.9890. A decisive break below this level could strengthen the bearish bias, potentially pushing the pair lower to 0.9730, the lowest point since November 2022.
The EUR/USD pair could encounter primary resistance near the nine-day Exponential Moving Average (EMA) at 1.0290, followed by the 14-day EMA at 1.0318. A breakout above these levels could target the upper boundary of the descending channel at 1.0400, with further gains possibly reaching the two-month high of 1.0630, seen on December 6.
EUR/USD: Daily Chart
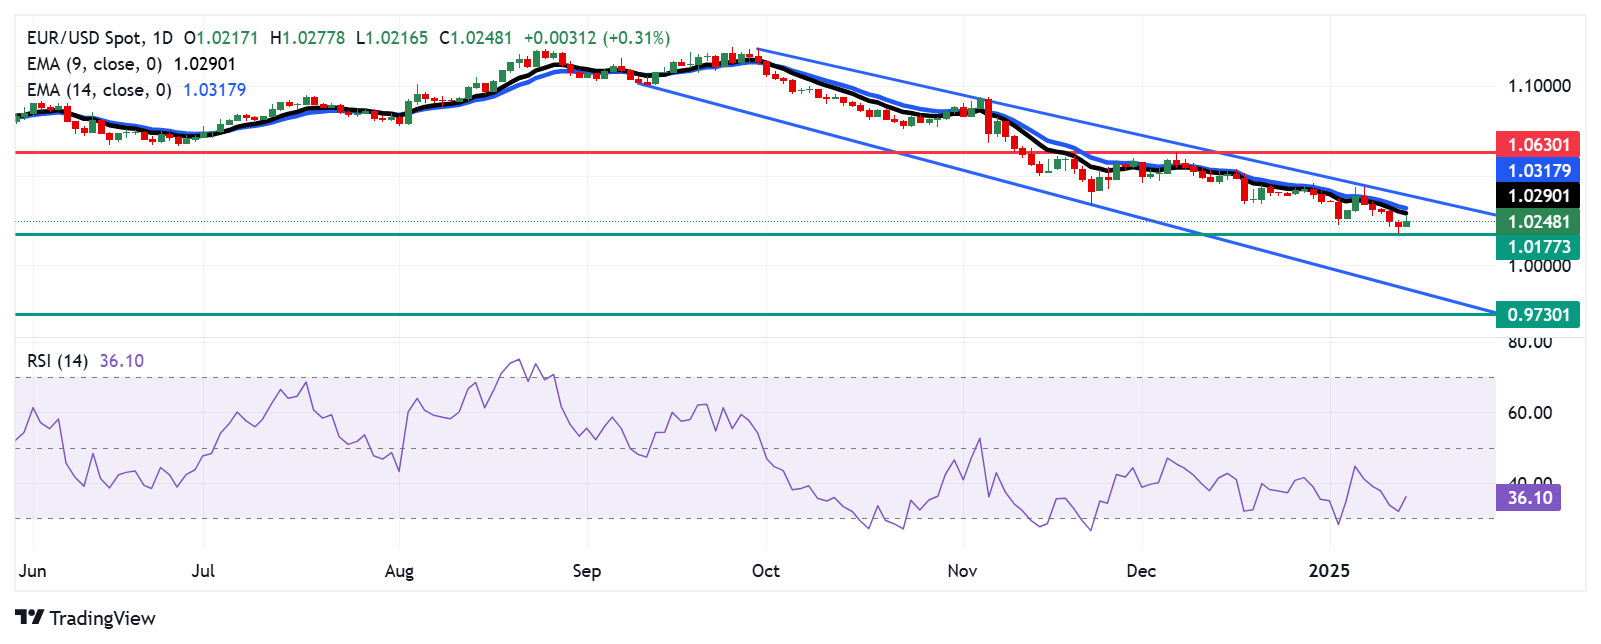
Euro PRICE Today
The table below shows the percentage change of Euro (EUR) against listed major currencies today. Euro was the strongest against the US Dollar.
USD EUR GBP JPY CAD AUD NZD CHF USD -0.30% -0.24% -0.02% -0.13% -0.39% -0.71% -0.24% EUR 0.30% 0.06% 0.26% 0.18% -0.09% -0.40% 0.07% GBP 0.24% -0.06% 0.21% 0.12% -0.15% -0.46% 0.01% JPY 0.02% -0.26% -0.21% -0.10% -0.37% -0.70% -0.22% CAD 0.13% -0.18% -0.12% 0.10% -0.27% -0.58% -0.11% AUD 0.39% 0.09% 0.15% 0.37% 0.27% -0.31% 0.13% NZD 0.71% 0.40% 0.46% 0.70% 0.58% 0.31% 0.48% CHF 0.24% -0.07% -0.01% 0.22% 0.11% -0.13% -0.48% The heat map shows percentage changes of major currencies against each other. The base currency is picked from the left column, while the quote currency is picked from the top row. For example, if you pick the Euro from the left column and move along the horizontal line to the US Dollar, the percentage change displayed in the box will represent EUR (base)/USD (quote).
-
05:35
India Gold price today: Gold rises, according to FXStreet data
Gold prices rose in India on Tuesday, according to data compiled by FXStreet.
The price for Gold stood at 7,428.31 Indian Rupees (INR) per gram, up compared with the INR 7,407.06 it cost on Monday.
The price for Gold increased to INR 86,642.36 per tola from INR 86,394.44 per tola a day earlier.
Unit measure Gold Price in INR 1 Gram 7,428.31 10 Grams 74,283.11 Tola 86,642.36 Troy Ounce 231,046.50 FXStreet calculates Gold prices in India by adapting international prices (USD/INR) to the local currency and measurement units. Prices are updated daily based on the market rates taken at the time of publication. Prices are just for reference and local rates could diverge slightly.
Gold FAQs
Gold has played a key role in human’s history as it has been widely used as a store of value and medium of exchange. Currently, apart from its shine and usage for jewelry, the precious metal is widely seen as a safe-haven asset, meaning that it is considered a good investment during turbulent times. Gold is also widely seen as a hedge against inflation and against depreciating currencies as it doesn’t rely on any specific issuer or government.
Central banks are the biggest Gold holders. In their aim to support their currencies in turbulent times, central banks tend to diversify their reserves and buy Gold to improve the perceived strength of the economy and the currency. High Gold reserves can be a source of trust for a country’s solvency. Central banks added 1,136 tonnes of Gold worth around $70 billion to their reserves in 2022, according to data from the World Gold Council. This is the highest yearly purchase since records began. Central banks from emerging economies such as China, India and Turkey are quickly increasing their Gold reserves.
Gold has an inverse correlation with the US Dollar and US Treasuries, which are both major reserve and safe-haven assets. When the Dollar depreciates, Gold tends to rise, enabling investors and central banks to diversify their assets in turbulent times. Gold is also inversely correlated with risk assets. A rally in the stock market tends to weaken Gold price, while sell-offs in riskier markets tend to favor the precious metal.
The price can move due to a wide range of factors. Geopolitical instability or fears of a deep recession can quickly make Gold price escalate due to its safe-haven status. As a yield-less asset, Gold tends to rise with lower interest rates, while higher cost of money usually weighs down on the yellow metal. Still, most moves depend on how the US Dollar (USD) behaves as the asset is priced in dollars (XAU/USD). A strong Dollar tends to keep the price of Gold controlled, whereas a weaker Dollar is likely to push Gold prices up.
(An automation tool was used in creating this post.)
-
05:25
Silver Price Forecast: XAG/USD struggles near $29.65 area, seems poised to weaken further
- Silver struggles to gain any meaningful traction and seems vulnerable to sliding further.
- The overnight failure near the 100-day EMA supports prospects for additional losses.
- A sustained strength beyond the $30.50-$30.55 area will negate the negative outlook.
Silver (XAG/USD) ticks higher during the Asian session on Tuesday, though it lacks bullish conviction and seems vulnerable to extending the previous day's retracement slide from the vicinity of a four-week top. The white metal currently trades around the $29.65 region, up 0.15% for the day.
From a technical perspective, Monday's failure near the 100-day Exponential Moving Average (EMA) suggests that the recent recovery from the $28.80-$28.75 region has run out of steam and validates the negative outlook. That said, mixed oscillators on the daily chart warrant some caution before placing fresh bearish bets around the XAG/USD and positioning for deeper losses.
In the meantime, the $30.00 psychological mark now seems to act as an immediate hurdle ahead of the $30.50-$30.55 region (100-day EMA). A sustained move beyond the latter might shift the near-term bias in favor of bullish traders and lift the XAG/USD beyond an intermediate resistance near the $31.00 round figure, towards the next relevant barrier near the $31.35-$31.40 zone.
On the flip side, weakness below the mid-$29.00s will reaffirm the bearish outlook and make the XAG/USD vulnerable to retest the $29.00 mark before eventually dropping to the $28.80-$28.70 region, or a three-month low touched in December. The downward trajectory could extend further towards the $28.45-$28.40 area en route to the $28.00 mark and the $27.70-$27.65 support.
XAG/USD daily chart
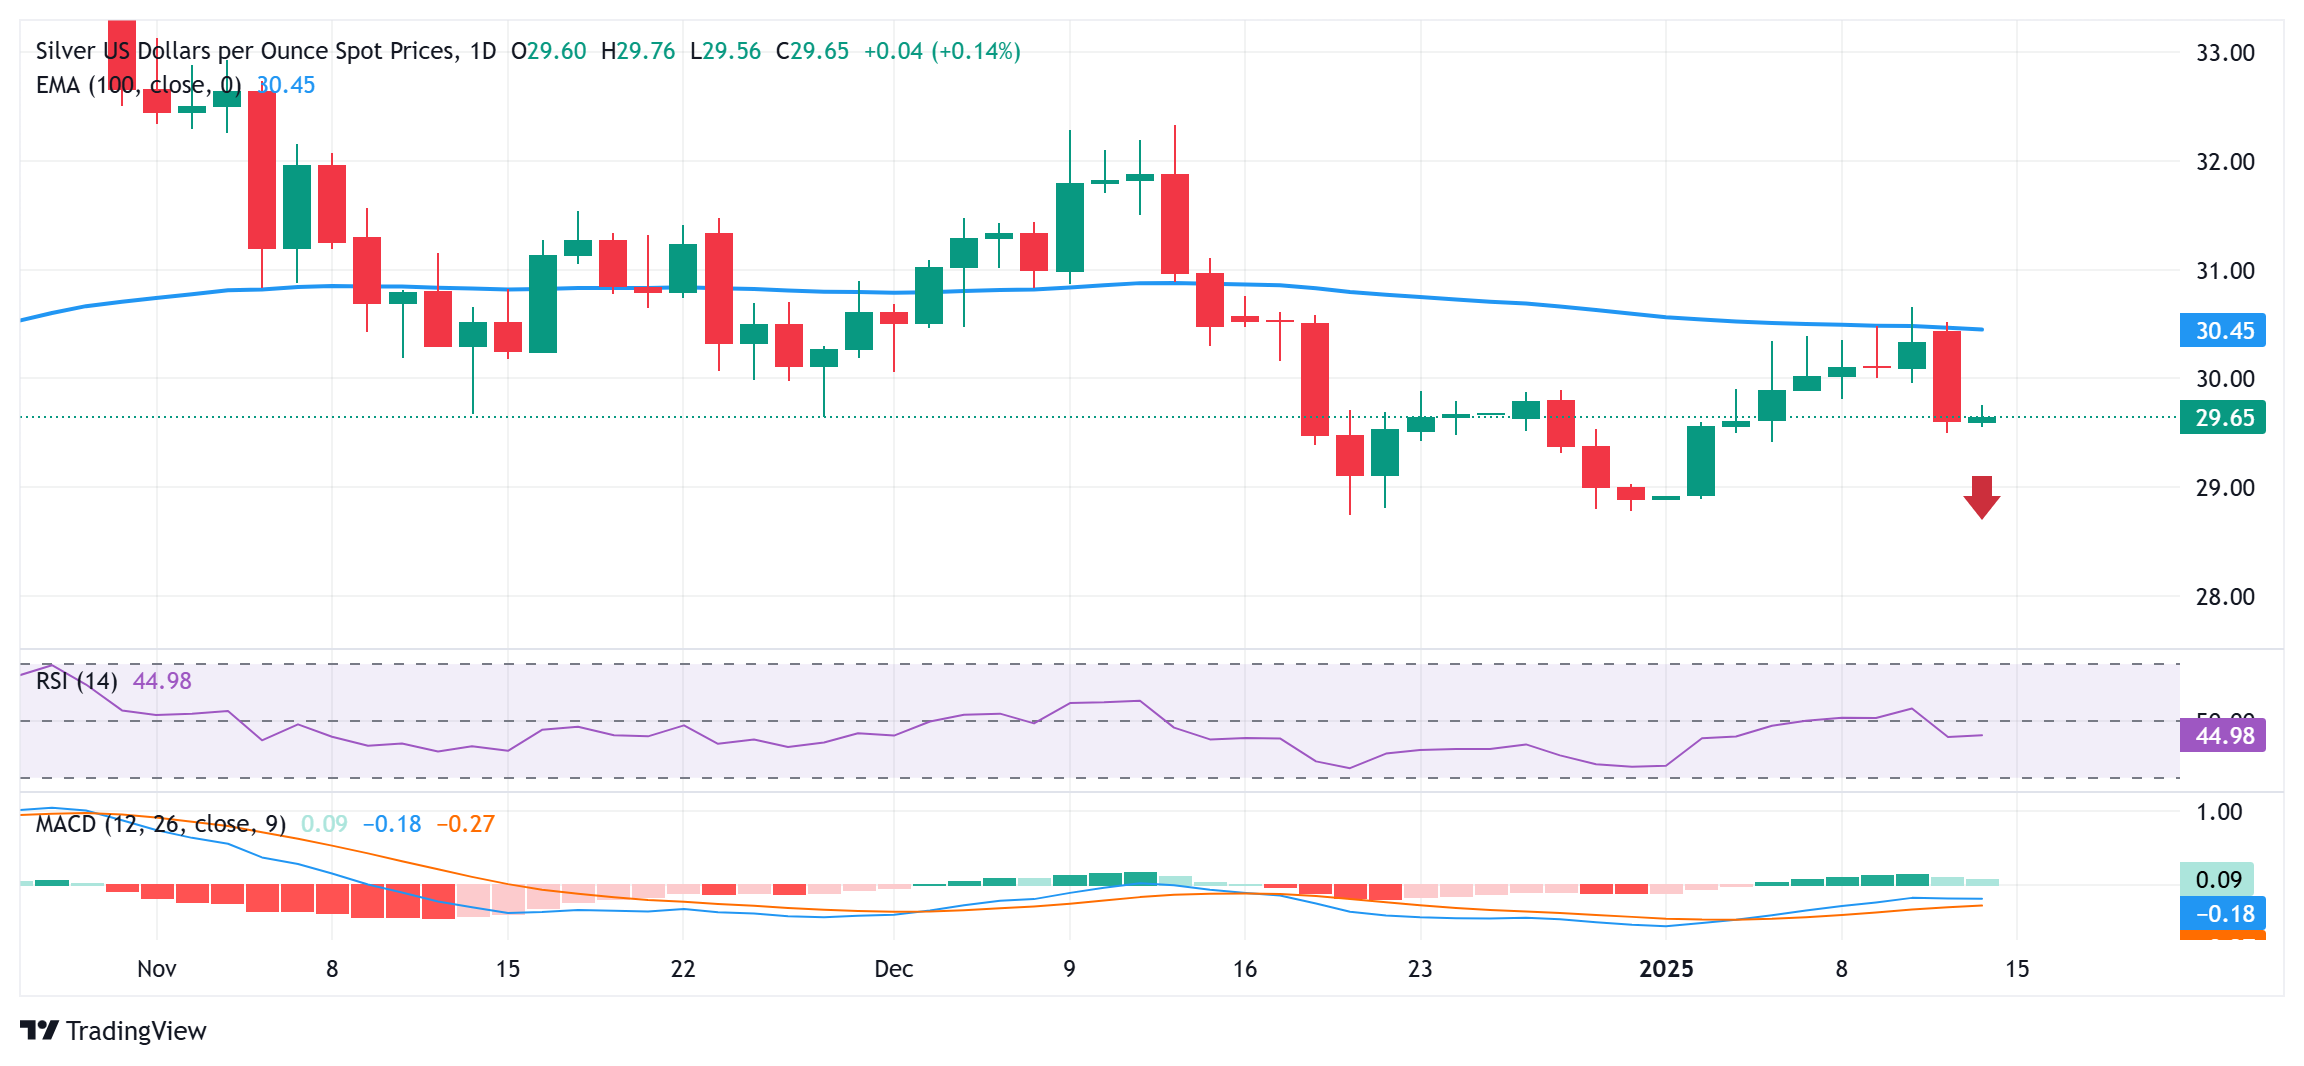
Silver FAQs
Silver is a precious metal highly traded among investors. It has been historically used as a store of value and a medium of exchange. Although less popular than Gold, traders may turn to Silver to diversify their investment portfolio, for its intrinsic value or as a potential hedge during high-inflation periods. Investors can buy physical Silver, in coins or in bars, or trade it through vehicles such as Exchange Traded Funds, which track its price on international markets.
Silver prices can move due to a wide range of factors. Geopolitical instability or fears of a deep recession can make Silver price escalate due to its safe-haven status, although to a lesser extent than Gold's. As a yieldless asset, Silver tends to rise with lower interest rates. Its moves also depend on how the US Dollar (USD) behaves as the asset is priced in dollars (XAG/USD). A strong Dollar tends to keep the price of Silver at bay, whereas a weaker Dollar is likely to propel prices up. Other factors such as investment demand, mining supply – Silver is much more abundant than Gold – and recycling rates can also affect prices.
Silver is widely used in industry, particularly in sectors such as electronics or solar energy, as it has one of the highest electric conductivity of all metals – more than Copper and Gold. A surge in demand can increase prices, while a decline tends to lower them. Dynamics in the US, Chinese and Indian economies can also contribute to price swings: for the US and particularly China, their big industrial sectors use Silver in various processes; in India, consumers’ demand for the precious metal for jewellery also plays a key role in setting prices.
Silver prices tend to follow Gold's moves. When Gold prices rise, Silver typically follows suit, as their status as safe-haven assets is similar. The Gold/Silver ratio, which shows the number of ounces of Silver needed to equal the value of one ounce of Gold, may help to determine the relative valuation between both metals. Some investors may consider a high ratio as an indicator that Silver is undervalued, or Gold is overvalued. On the contrary, a low ratio might suggest that Gold is undervalued relative to Silver.
-
05:11
GBP/USD rises above 1.2200 as Trump's team considers a gradual increase in tariffs
- GBP/USD strengthens as US President-elect Donald Trump's economic team considering a gradual increase in import tariffs boosted investor confidence.
- Trump's incoming administration evaluates a phased approach to implementing tariffs to avoid a sharp inflationary spike.
- The US Dollar Index pulls back from 110.18, the highest level since November 2022.
GBP/USD breaks its five-day losing streak, rebounding from its 15-month low of 1.2099, recorded on Monday. The GBP/USD pair remains above 1.2200 during the Asian trading hours on Tuesday as the Pound Sterling (GBP) gains ground amid improved investor confidence.
The increased investor confidence is attributed to reports about US President-elect Donald Trump's economic team considering a gradual increase in import tariffs boosted investor confidence. According to Bloomberg, Trump's incoming administration is evaluating a phased approach to implementing tariffs, aiming to prevent a sharp rise in inflation while managing trade policy adjustments.
However, the upside of the Pound Sterling could be limited due to concerns over stagflation in the United Kingdom (UK) amid persistent inflation and stagnant economic growth. Additionally, a recent surge in UK government bond yields has sparked worries about the country's fiscal health. Investors have been offloading UK gilts, driven by fears of mounting debt, sluggish growth, and inflation risks. These concerns contribute to the GBP’s relative weakness.
The US Dollar Index (DXY), which measures the US Dollar’s performance against six major currencies, corrects downwards after reaching its highest level at 110.18 since November 2022. At the time of writing, the DXY maintains its position near 109.60. The USD gained strength following robust US labor market data for December, which is expected to support the US Federal Reserve’s (Fed) decision to maintain interest rates at current levels in January.
Additionally, the reinforced hawkish sentiment surrounding the Fed’s policy outlook sparked a rise in US Treasury yields, with the 2-year yield reaching 4.42% and the 10-year yield rising to 4.80% as of Monday. The higher yields are helping the Greenback stay near recent highs. The US Producer Price Index (PPI) for December will take center stage due later on Tuesday.
Pound Sterling FAQs
The Pound Sterling (GBP) is the oldest currency in the world (886 AD) and the official currency of the United Kingdom. It is the fourth most traded unit for foreign exchange (FX) in the world, accounting for 12% of all transactions, averaging $630 billion a day, according to 2022 data. Its key trading pairs are GBP/USD, also known as ‘Cable’, which accounts for 11% of FX, GBP/JPY, or the ‘Dragon’ as it is known by traders (3%), and EUR/GBP (2%). The Pound Sterling is issued by the Bank of England (BoE).
The single most important factor influencing the value of the Pound Sterling is monetary policy decided by the Bank of England. The BoE bases its decisions on whether it has achieved its primary goal of “price stability” – a steady inflation rate of around 2%. Its primary tool for achieving this is the adjustment of interest rates. When inflation is too high, the BoE will try to rein it in by raising interest rates, making it more expensive for people and businesses to access credit. This is generally positive for GBP, as higher interest rates make the UK a more attractive place for global investors to park their money. When inflation falls too low it is a sign economic growth is slowing. In this scenario, the BoE will consider lowering interest rates to cheapen credit so businesses will borrow more to invest in growth-generating projects.
Data releases gauge the health of the economy and can impact the value of the Pound Sterling. Indicators such as GDP, Manufacturing and Services PMIs, and employment can all influence the direction of the GBP. A strong economy is good for Sterling. Not only does it attract more foreign investment but it may encourage the BoE to put up interest rates, which will directly strengthen GBP. Otherwise, if economic data is weak, the Pound Sterling is likely to fall.
Another significant data release for the Pound Sterling is the Trade Balance. This indicator measures the difference between what a country earns from its exports and what it spends on imports over a given period. If a country produces highly sought-after exports, its currency will benefit purely from the extra demand created from foreign buyers seeking to purchase these goods. Therefore, a positive net Trade Balance strengthens a currency and vice versa for a negative balance.
-
05:08
Gold price trades with positive bias amid retreating US bond yields
- Gold price regains positive traction amid a modest pullback in the US bond yields.
- Hawkish Fed expectations favor the USD bulls and should cap the precious metal.
- The risk-on impulse might further contribute to keeping a lid on the XAU/USD pair.
Gold price (XAU/USD) attracts some dip-buyers during the Asian session on Tuesday and reverses a part of the previous day's retracement slide from the vicinity of a one-month top touched last week. Reports that US President-elect Donald Trump's top economic advisers are mulling a slow ramp-up in tariffs to prevent a sudden spike in inflation trigger a modest pullback in the US Treasury bond yields and benefit the non-yielding yellow metal. Apart from this, the uptick lacks any obvious catalyst and is likely to remain capped amid hawkish Federal Reserve (Fed) expectations.
The upbeat US Nonfarm Payrolls (NFP) report released on Friday reinforced bets for a slower pace of interest rate cuts by the US central bank this year. This, in turn, assists the US Dollar (USD) to stall its profit-taking slide from over a two-year peak touched on Monday and should act as a tailwind for the US bond yields. Meanwhile, easing fears about disruptive trade tariffs under Trump 2.0 boost investors' confidence, which further warrants some caution before placing fresh bullish bets around the Gold price. Traders now look to the US Producer Price Index (PPI) for a fresh impetus.
Gold price draws support from retreating US bond yields; upside seems limited amid hawkish Fed expectations
- Bloomberg, citing people familiar with the matter, reported on Monday that President-elect Donald Trump's economic advisers are considering a program to gradually increase tariffs month by month.
- The approach, aimed at boosting negotiating leverage and helping avoid a sudden spike in inflation, triggers a modest pullback in the US Treasury bond yields and revives demand for the Gold price.
- The sizzling US job report cemented expectations the Federal Reserve will proceed with caution while cutting rates this year, which helps the US Dollar to stall Monday's pullback from over a two-year high.
- The Fed's hawkish outlook should also limit the benchmark 10-year US Treasury bond yields' corrective slide from a 14-month high and keep a lid on any further gains for the non-yielding yellow metal.
- US President-elect Donald Trump has repeatedly promised to end the conflict in Ukraine and said that he will meet Russian President Vladimir Putin “very quickly” after he takes office next week.
- The US indicated that a ceasefire deal is on the brink of success while Hamas said talks are progressing well. Two Israeli officials said that Hamas will release 33 hostages in the first phase of the ceasefire agreement.
- Investors now look forward to key inflation prints – starting with the Producer Price Index later today, followed by the US consumer inflation figures on Wednesday – for some meaningful impetus.
Gold price bulls have the upper hand while above the 100-day EMA and trend line confluence support, near $2,610
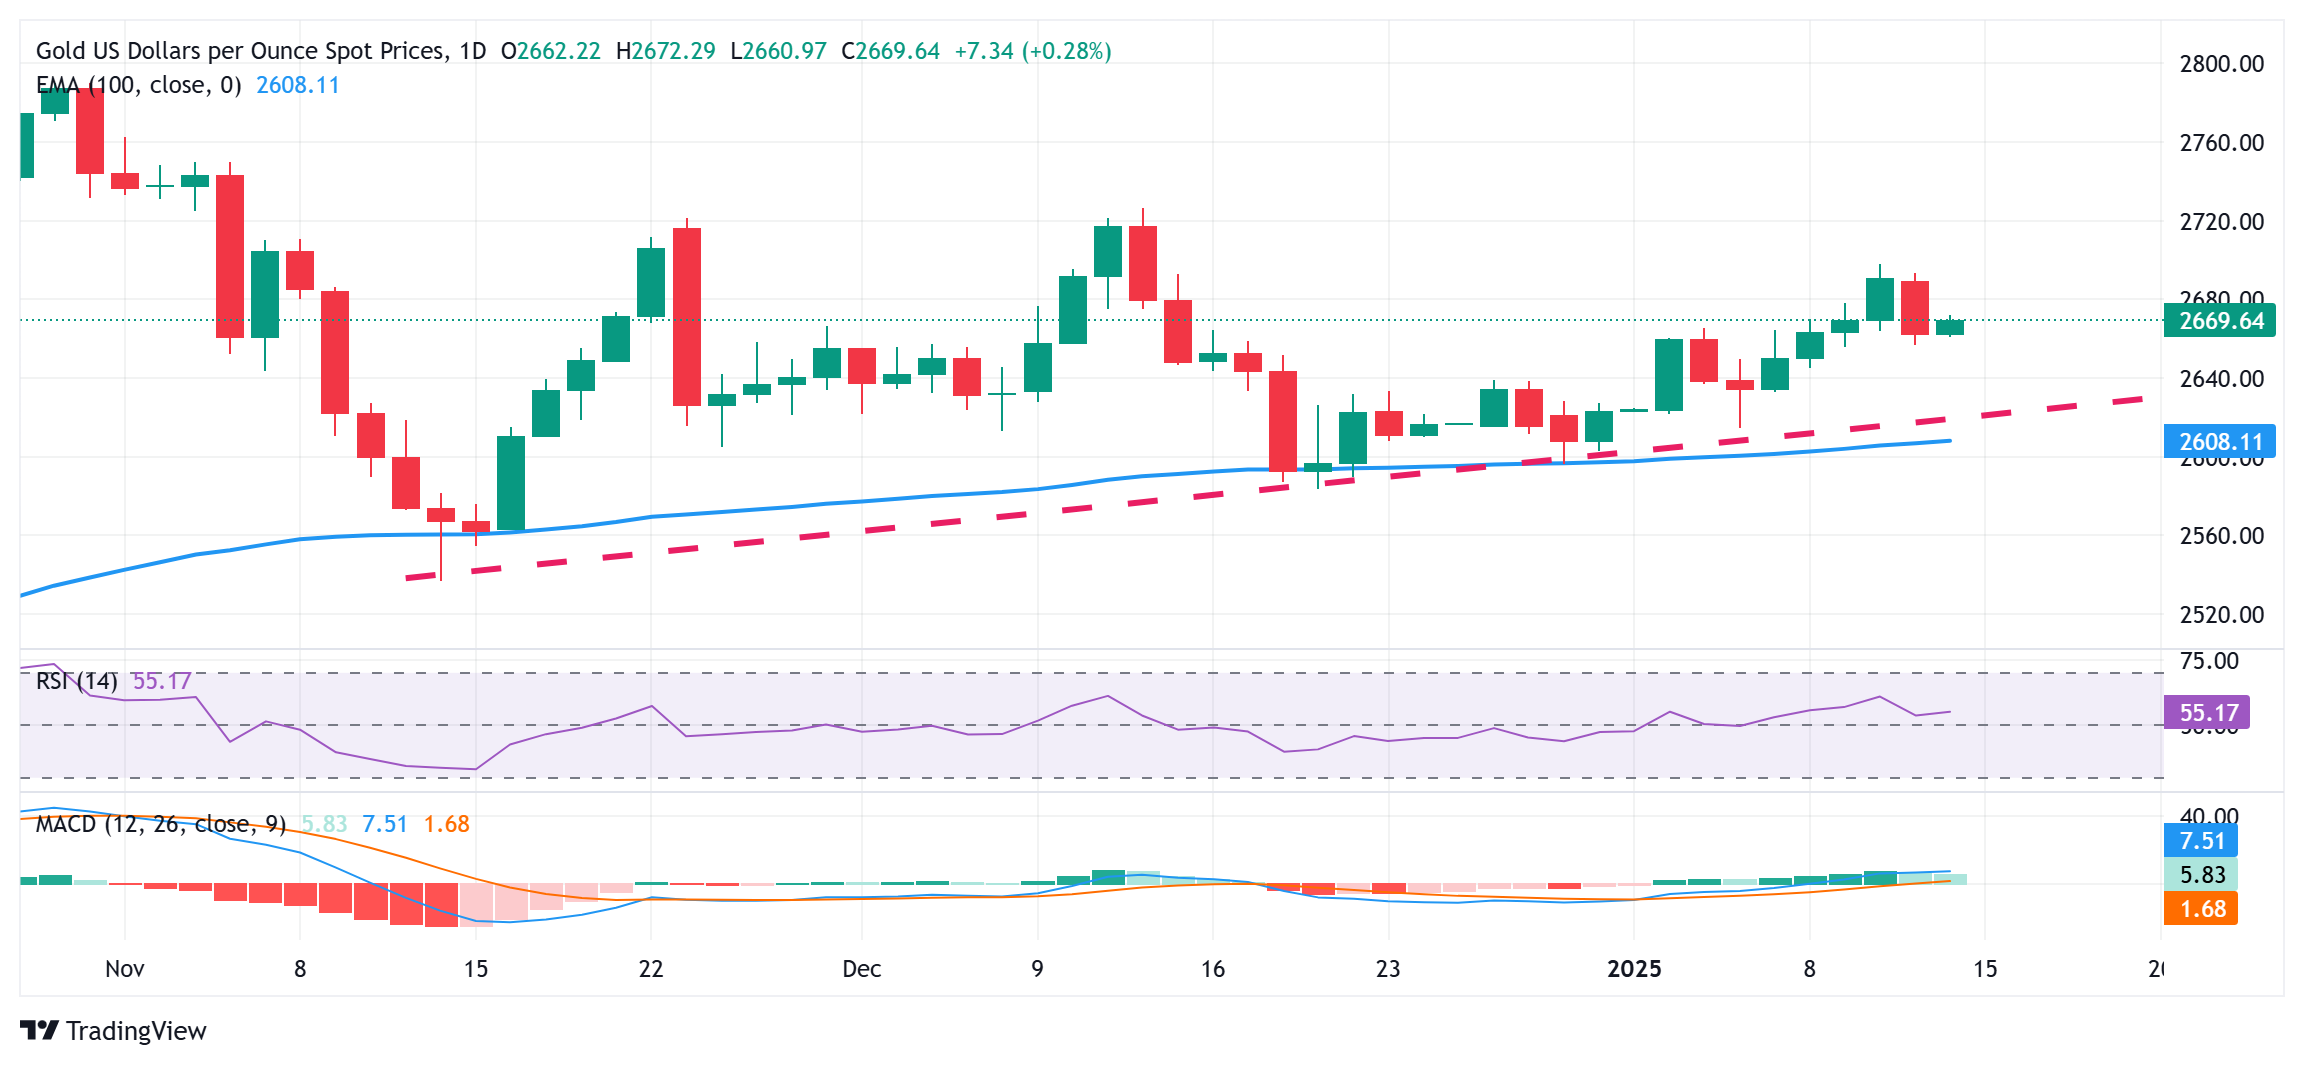
From a technical perspective, any subsequent strength beyond the $2,676-2,677 area is likely to confront some resistance near the $2,690 zone ahead of the $2,700 mark. Some follow-through buying beyond the latter will set the stage for an extension of over a three-week-old uptrend and lift the Gold price to the $2,716-2,717 hurdle en route to the December monthly swing high, around the $2,726 region.
On the flip side, the $2,657-2,656 area, Monday's low, might continue to protect the immediate downside. A convincing break below, however, could make the Gold price vulnerable to accelerate the downfall towards the $2,635 region. The downward trajectory could extend further towards the $2,610 confluence, comprising the 100-day Exponential Moving Average (SMA) and a multi-week-old ascending trend line.
Gold FAQs
Gold has played a key role in human’s history as it has been widely used as a store of value and medium of exchange. Currently, apart from its shine and usage for jewelry, the precious metal is widely seen as a safe-haven asset, meaning that it is considered a good investment during turbulent times. Gold is also widely seen as a hedge against inflation and against depreciating currencies as it doesn’t rely on any specific issuer or government.
Central banks are the biggest Gold holders. In their aim to support their currencies in turbulent times, central banks tend to diversify their reserves and buy Gold to improve the perceived strength of the economy and the currency. High Gold reserves can be a source of trust for a country’s solvency. Central banks added 1,136 tonnes of Gold worth around $70 billion to their reserves in 2022, according to data from the World Gold Council. This is the highest yearly purchase since records began. Central banks from emerging economies such as China, India and Turkey are quickly increasing their Gold reserves.
Gold has an inverse correlation with the US Dollar and US Treasuries, which are both major reserve and safe-haven assets. When the Dollar depreciates, Gold tends to rise, enabling investors and central banks to diversify their assets in turbulent times. Gold is also inversely correlated with risk assets. A rally in the stock market tends to weaken Gold price, while sell-offs in riskier markets tend to favor the precious metal.
The price can move due to a wide range of factors. Geopolitical instability or fears of a deep recession can quickly make Gold price escalate due to its safe-haven status. As a yield-less asset, Gold tends to rise with lower interest rates, while higher cost of money usually weighs down on the yellow metal. Still, most moves depend on how the US Dollar (USD) behaves as the asset is priced in dollars (XAU/USD). A strong Dollar tends to keep the price of Gold controlled, whereas a weaker Dollar is likely to push Gold prices up.
-
04:44
Japan’s Akazawa: BoJ's rate hike consideration and government's aim to exit deflation are not contradictory
Japan's Economy Minister Ryosei Akazawa noted on Tuesday that ”the Bank of Japan’s (BoJ) consideration of a rate hike and the government's (govt) aim to exit deflation are not contradictory.”
“The BoJ and govt are cooperating well,” he added.
Market reaction
USD/JPY is holding modest gains just above 157.50 following these above comments.
Japanese Yen PRICE Today
The table below shows the percentage change of Japanese Yen (JPY) against listed major currencies today. Japanese Yen was the weakest against the New Zealand Dollar.
USD EUR GBP JPY CAD AUD NZD CHF USD -0.34% -0.33% -0.05% -0.16% -0.48% -0.79% -0.25% EUR 0.34% 0.01% 0.29% 0.19% -0.14% -0.44% 0.10% GBP 0.33% -0.01% 0.29% 0.17% -0.15% -0.46% 0.09% JPY 0.05% -0.29% -0.29% -0.11% -0.42% -0.74% -0.19% CAD 0.16% -0.19% -0.17% 0.11% -0.32% -0.63% -0.08% AUD 0.48% 0.14% 0.15% 0.42% 0.32% -0.30% 0.24% NZD 0.79% 0.44% 0.46% 0.74% 0.63% 0.30% 0.55% CHF 0.25% -0.10% -0.09% 0.19% 0.08% -0.24% -0.55% The heat map shows percentage changes of major currencies against each other. The base currency is picked from the left column, while the quote currency is picked from the top row. For example, if you pick the Japanese Yen from the left column and move along the horizontal line to the US Dollar, the percentage change displayed in the box will represent JPY (base)/USD (quote).
-
04:15
EUR/JPY advances to near 161.50 due to improved market sentiment
- EUR/JPY strengthens as US President-elect Donald Trump's economic team considering a gradual increase in import tariffs boosted investor confidence.
- The Japanese Yen faces challenges as traders anticipate the BoJ may postpone rate hikes until April.
- The Euro could struggle due to the increased likelihood of further monetary easing by the ECB.
EUR/JPY pair pauses its three-day winning streak, trading around 161.50 during the Asian session on Tuesday. The pair gains support as the Japanese Yen (JPY) faces pressure amid uncertainty over the timing of the Bank of Japan's (BoJ) next rate hike. Market participants speculate that the BoJ may delay raising rates until April, awaiting confirmation of sustained wage growth during the spring negotiations.
Bank of Japan Deputy Governor Ryozo Himino stated on Tuesday that while the central bank’s policy direction favors further rate hikes, it must carefully assess both upside and downside risks domestically and internationally. Himino emphasized the need to monitor short-term economic activity, prices, and financial conditions before taking further action.
Additionally, reports about US President-elect Donald Trump's economic team considering a gradual increase in import tariffs boosted investor confidence, weakening the safe-haven JPY. This, in turn, supported the risk-sensitive Euro, contributing to the EUR/JPY cross’s appreciation.
A Bloomberg report on Monday highlighted that Trump's incoming administration is evaluating a phased approach to implementing tariffs, aiming to prevent a sharp rise in inflation while managing trade policy adjustments.
Increasing expectations of further monetary easing by the European Central Bank (ECB) are putting downward pressure on the Euro. Speaking at the Asian Financial Forum (AFF) 2025 on Monday, ECB Chief Economist Philip Lane stated that additional interest rate cuts are likely as the central bank aims to prevent the economy from slowing down excessively.
ECB Governing Council member and Bank of France Governor François Villeroy de Galhau stated on Monday that although the French economy is "slowing down," he does not anticipate a recession. Villeroy added that French economic growth could rebound in 2026 and 2027, following a period of stagnation, with GDP growth estimated at 0% in the fourth quarter of 2024.
Euro FAQs
The Euro is the currency for the 19 European Union countries that belong to the Eurozone. It is the second most heavily traded currency in the world behind the US Dollar. In 2022, it accounted for 31% of all foreign exchange transactions, with an average daily turnover of over $2.2 trillion a day. EUR/USD is the most heavily traded currency pair in the world, accounting for an estimated 30% off all transactions, followed by EUR/JPY (4%), EUR/GBP (3%) and EUR/AUD (2%).
The European Central Bank (ECB) in Frankfurt, Germany, is the reserve bank for the Eurozone. The ECB sets interest rates and manages monetary policy. The ECB’s primary mandate is to maintain price stability, which means either controlling inflation or stimulating growth. Its primary tool is the raising or lowering of interest rates. Relatively high interest rates – or the expectation of higher rates – will usually benefit the Euro and vice versa. The ECB Governing Council makes monetary policy decisions at meetings held eight times a year. Decisions are made by heads of the Eurozone national banks and six permanent members, including the President of the ECB, Christine Lagarde.
Eurozone inflation data, measured by the Harmonized Index of Consumer Prices (HICP), is an important econometric for the Euro. If inflation rises more than expected, especially if above the ECB’s 2% target, it obliges the ECB to raise interest rates to bring it back under control. Relatively high interest rates compared to its counterparts will usually benefit the Euro, as it makes the region more attractive as a place for global investors to park their money.
Data releases gauge the health of the economy and can impact on the Euro. Indicators such as GDP, Manufacturing and Services PMIs, employment, and consumer sentiment surveys can all influence the direction of the single currency. A strong economy is good for the Euro. Not only does it attract more foreign investment but it may encourage the ECB to put up interest rates, which will directly strengthen the Euro. Otherwise, if economic data is weak, the Euro is likely to fall. Economic data for the four largest economies in the euro area (Germany, France, Italy and Spain) are especially significant, as they account for 75% of the Eurozone’s economy.
Another significant data release for the Euro is the Trade Balance. This indicator measures the difference between what a country earns from its exports and what it spends on imports over a given period. If a country produces highly sought after exports then its currency will gain in value purely from the extra demand created from foreign buyers seeking to purchase these goods. Therefore, a positive net Trade Balance strengthens a currency and vice versa for a negative balance.
-
04:04
USD/INR weakens ahead of Indian WPI inflation release
- The Indian Rupee rebounds in Tuesday’s early Asian session.
- A surge in oil prices, continued outflows from foreign investors, and a rally in USD might weigh on INR.
- India’s WPI inflation data and US PPI reports will be in the spotlight later on Tuesday.
The Indian Rupee (INR) recovers some lost ground on Tuesday after reaching a fresh all-time low in the previous session. The Reserve Bank of India (RBI) is likely to intervene to slow down the INR's depreciation, selling the USD in the spot and the forward markets. However, the local currency remains fragile amid a rise in crude oil prices and a massive withdrawal of foreign capital from Indian equities. Additionally, a stronger US Dollar (USD) after upbeat US employment data led to an expectation that the US Federal Reserve (Fed) will go for fewer interest rate cuts this year, dragging the INR lower.
Looking ahead, traders will monitor India’s Wholesale Price Index (WPI) inflation data, which is due later on Tuesday. On the US docket, the Producer Price Index (PPI) for December will be released. Also, the Fed Kansas City President Jeff Schmid is set to speak later in the day.Indian Rupee remains vulnerable amid multiple headwinds
- India’s retail inflation rate, measured by the Consumer Price Index (CPI), eased to 5.22% YoY in December from 5.48% in November, according to the Ministry of Statistics and Programme Implementation on Monday. This reading came in softer than the expectation of 5.3%.
- India’s Consumer Food Price Index (CFPI), which measures food inflation, recorded a year-on-year increase of 8.39% for December 2024.
- "RBI will allow the weakness as demand keeps moving up and supplies dwindle," said Anil Kumar Bhansali, Head of Treasury and Executive Director, Finrex Treasury Advisors LLP.
- The Indian central bank on Friday noted that the country's forex reserves in the week ended January 3 declined by USD 5.693 billion to USD 634.585 billion.
- Global funds have pulled about $2 billion from local shares so far this year and sold a net $705.5 million of fixed-income securities on January 8.
- Markets are now pricing in one rate cut from the Fed in 2025, down from roughly two quarter-point cuts priced at the start of the year.
USD/INR maintains the positive picture, overbought RSI warrants caution for bulls in the near term
The Indian Rupee trades firmer on the day. The bullish outlook of the USD/INR pair remains intact as the price has formed higher highs and higher lows while holding above the key 100-day Exponential Moving Average (EMA) on the daily chart. Nonetheless, further consolidation cannot be ruled out as the 14-day Relative Strength Index (RSI) moves beyond the 70.00 mark, indicating the overbought condition.
The first upside target to watch is an all-time high of 86.69. A decisive bullish breakout above this level could pave the way to the 87.00 psychological level.
On the other hand, the initial support level for the pair emerges at 85.85, the low of January 10. A move back below the mentioned level could see a drop to 85.65, the low of January 7, followed by 85.00, a round figure.Indian Rupee FAQs
The Indian Rupee (INR) is one of the most sensitive currencies to external factors. The price of Crude Oil (the country is highly dependent on imported Oil), the value of the US Dollar – most trade is conducted in USD – and the level of foreign investment, are all influential. Direct intervention by the Reserve Bank of India (RBI) in FX markets to keep the exchange rate stable, as well as the level of interest rates set by the RBI, are further major influencing factors on the Rupee.
The Reserve Bank of India (RBI) actively intervenes in forex markets to maintain a stable exchange rate, to help facilitate trade. In addition, the RBI tries to maintain the inflation rate at its 4% target by adjusting interest rates. Higher interest rates usually strengthen the Rupee. This is due to the role of the ‘carry trade’ in which investors borrow in countries with lower interest rates so as to place their money in countries’ offering relatively higher interest rates and profit from the difference.
Macroeconomic factors that influence the value of the Rupee include inflation, interest rates, the economic growth rate (GDP), the balance of trade, and inflows from foreign investment. A higher growth rate can lead to more overseas investment, pushing up demand for the Rupee. A less negative balance of trade will eventually lead to a stronger Rupee. Higher interest rates, especially real rates (interest rates less inflation) are also positive for the Rupee. A risk-on environment can lead to greater inflows of Foreign Direct and Indirect Investment (FDI and FII), which also benefit the Rupee.
Higher inflation, particularly, if it is comparatively higher than India’s peers, is generally negative for the currency as it reflects devaluation through oversupply. Inflation also increases the cost of exports, leading to more Rupees being sold to purchase foreign imports, which is Rupee-negative. At the same time, higher inflation usually leads to the Reserve Bank of India (RBI) raising interest rates and this can be positive for the Rupee, due to increased demand from international investors. The opposite effect is true of lower inflation.
-
04:00
South Korea Money Supply Growth dipped from previous 6.1% to 5.6% in November
-
03:38
Japanese Yen drifts lower amid BoJ uncertainty; USD/JPY rebounds from one-week low
- The Japanese Yen attracts fresh sellers on Tuesday amid wavering BoJ rate hike expectations.
- Easing fears about Trump's tariff plans boosts the risk sentiment and also undermines the JPY.
- Hawkish Fed-inspired elevated US bond yields favor the USD bulls and lend support to USD/JPY.
The Japanese Yen (JPY) struggles to capitalize on gains registered against its American counterpart over the past three days and attracts fresh sellers during the Asian session on Tuesday. Investors remain uncertain about the likely timing of when the uncertainty surrounding the likely timing of when the Bank of Japan (BoJ) will hike rates again. Furthermore, reports that US President-elect Donald Trump's top economic advisers are mulling a slow ramp-up in tariffs boost investors' confidence and undermine the safe-haven JPY.
Moreover, the Federal Reserve's (Fed) hawkish shift dashed hopes for an immediate narrowing of the US-Japan yield differential and is seen as another factor acting as a headwind for the JPY. This, in turn, assists the USD/JPY pair to stall its retracement slide from a multi-month peak touched last Friday. Meanwhile, easing fears about disruptive trade tariffs under Trump 2.0 triggers a modest pullback in the US Treasury bond yields, which keeps the US Dollar (USD) below a two-year top and might cap the pair ahead of the US Producer Price Index (PPI).
Japanese Yen bears have the upper hand amid BoJ rate hike uncertainty
- Bank of Japan Deputy Governor Ryozo Himino said on Tuesday that while the direction is for further rate hikes, the central bank must carefully watch various upside and downside risks at home and abroad.
- Moreover, some investors are betting that the BoJ may wait until April to seek confirmation that strong wage momentum will carry over into the spring negotiations before raising interest rates again.
- According to a Bloomberg report on Monday, US President-elect Donald Trump’s incoming economic team is considering a program of gradual increases in import tariffs over the coming months.
- The proposal aimed at preventing a sudden increase in inflation triggers a modest pullback in the US Treasury bond yields and prompts some US Dollar profit-taking from over a two-year peak.
- Against the backdrop of the Federal Reserve's hawkish outlook, Friday's upbeat US Nonfarm Payrolls report raised doubts about the likelihood of rate cuts in 2025 and should support the USD.
- The yield on the benchmark 10-year US government bond retreats from a 14-month high as investors look forward to key inflation prints, starting with the Producer Price Index later today.
USD/JPY needs to find acceptance above 158.00 for bulls to regain control
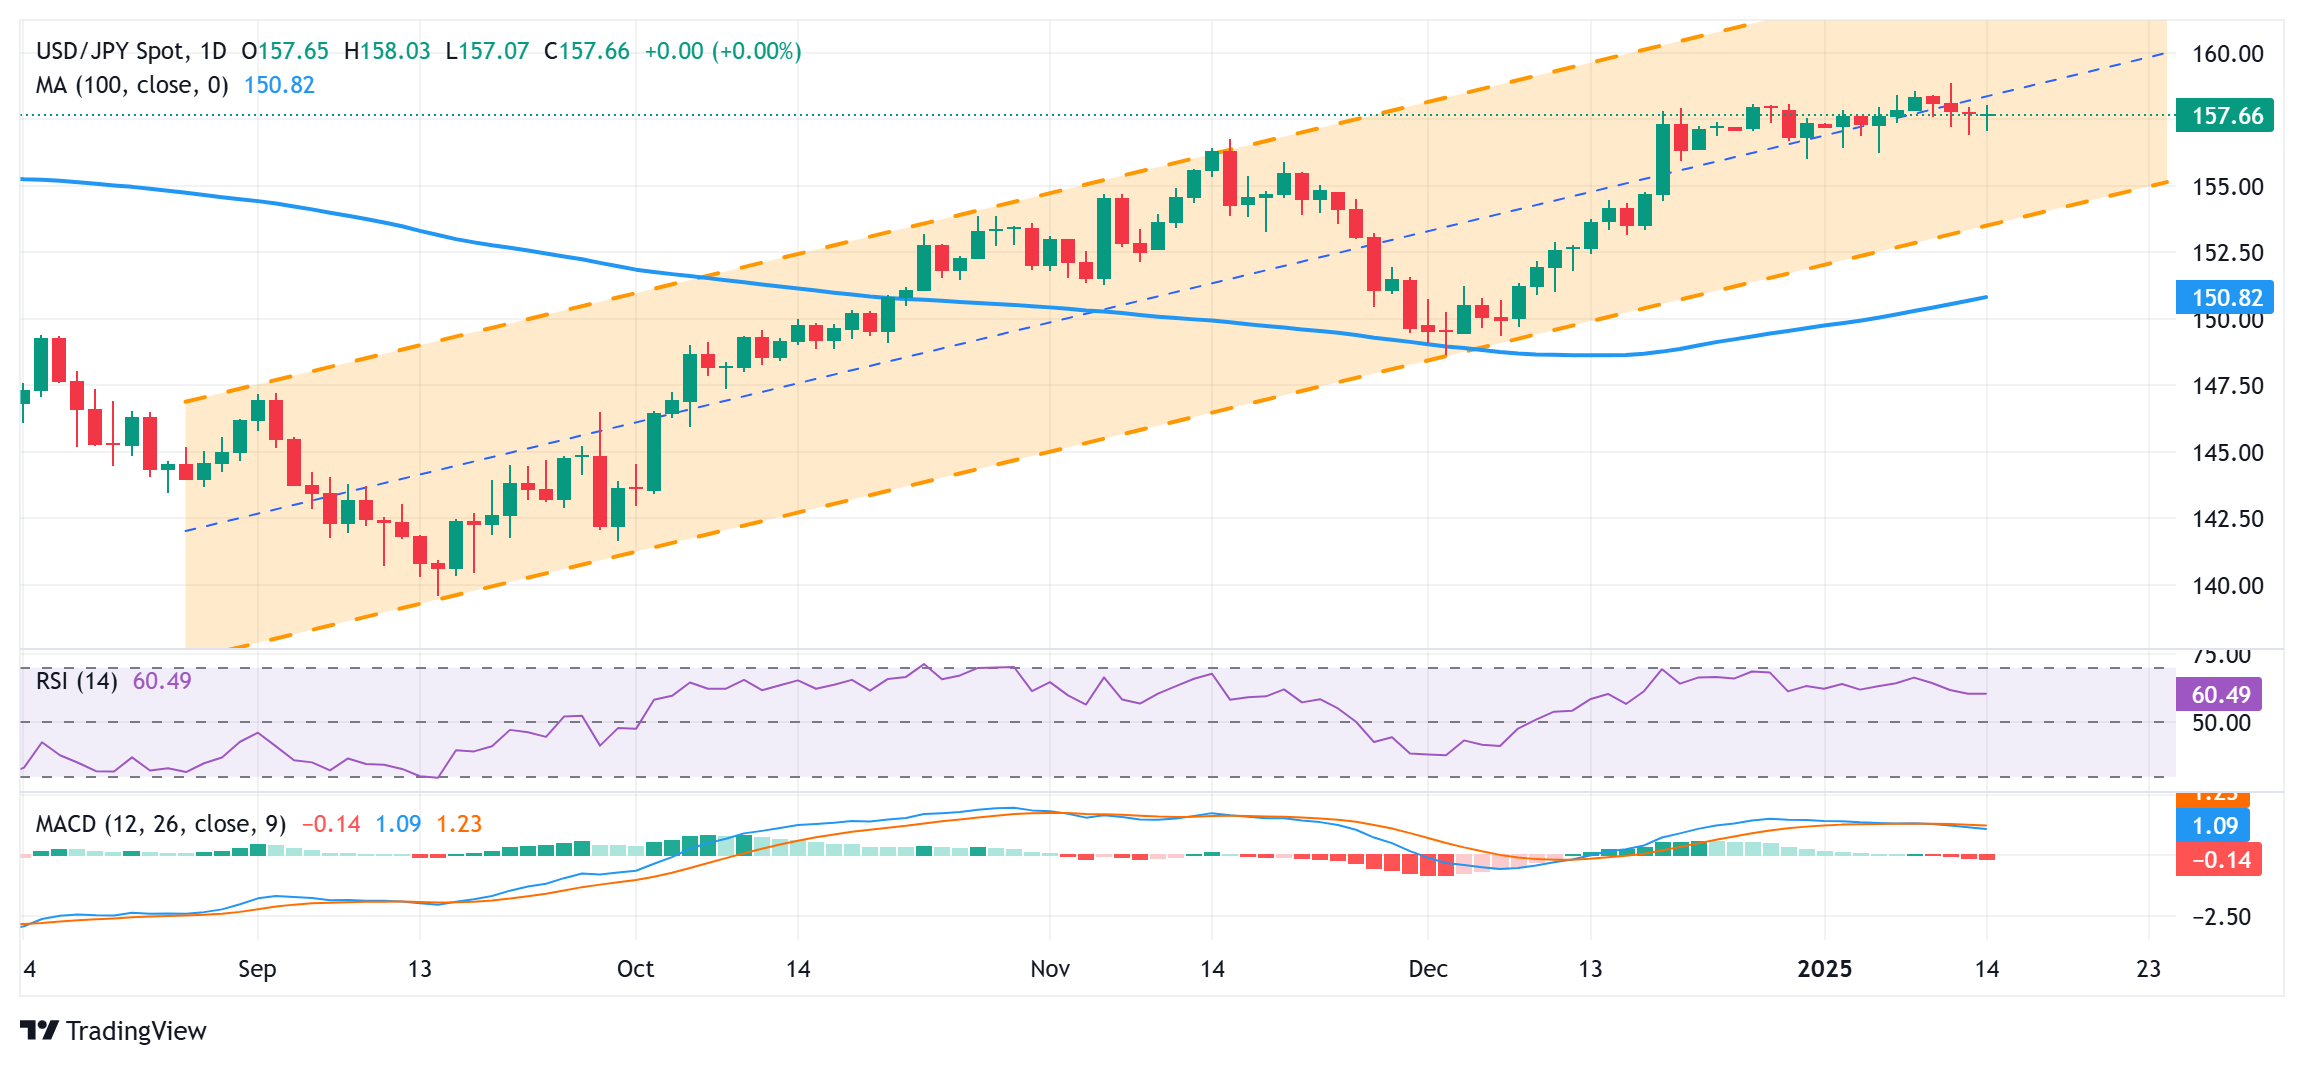
From a technical perspective, the overnight resilience below the 157.00 mark and the subsequent move up, along with positive oscillators on the daily chart, favor bullish traders. That said, intraday failure near the 158.00 round figure marks it prudent to wait for a sustained strength beyond the said handle before positioning for additional gains. The USD/JPY pair might then accelerate the momentum towards the 158.55 intermediate hurdle en route to the multi-month top, around the 158.85-158.90 zone. Some follow-through buying above the 159.00 mark will set the stage for further gains towards the next relevant hurdle near the mid-159.00s before spot prices aim to reclaim the 160.00 psychological mark.
On the flip side, the 157.00-156.90 area might continue to protect the immediate downside. Any further slide could be seen as a buying opportunity around the 156.25-156.20 area, or last week's swing low. This should help limit the downside for the USD/JPY pair near the 156.00 mark, which if broken decisively might shift the near-term bias in favor of bearish traders and pave the way for some meaningful corrective decline.
Japanese Yen FAQs
The Japanese Yen (JPY) is one of the world’s most traded currencies. Its value is broadly determined by the performance of the Japanese economy, but more specifically by the Bank of Japan’s policy, the differential between Japanese and US bond yields, or risk sentiment among traders, among other factors.
One of the Bank of Japan’s mandates is currency control, so its moves are key for the Yen. The BoJ has directly intervened in currency markets sometimes, generally to lower the value of the Yen, although it refrains from doing it often due to political concerns of its main trading partners. The BoJ ultra-loose monetary policy between 2013 and 2024 caused the Yen to depreciate against its main currency peers due to an increasing policy divergence between the Bank of Japan and other main central banks. More recently, the gradually unwinding of this ultra-loose policy has given some support to the Yen.
Over the last decade, the BoJ’s stance of sticking to ultra-loose monetary policy has led to a widening policy divergence with other central banks, particularly with the US Federal Reserve. This supported a widening of the differential between the 10-year US and Japanese bonds, which favored the US Dollar against the Japanese Yen. The BoJ decision in 2024 to gradually abandon the ultra-loose policy, coupled with interest-rate cuts in other major central banks, is narrowing this differential.
The Japanese Yen is often seen as a safe-haven investment. This means that in times of market stress, investors are more likely to put their money in the Japanese currency due to its supposed reliability and stability. Turbulent times are likely to strengthen the Yen’s value against other currencies seen as more risky to invest in.
-
03:30
Commodities. Daily history for Monday, January 13, 2025
Raw materials Closed Change, % Silver 29.604 -2.7 Gold 2663.4 -0.98 Palladium 940.09 -1.18 -
03:30
Australian Dollar rises amid strong commodity prices
- The Australian Dollar has rebounded from 0.6131, its lowest level since April 2020.
- The AUD receives support from strong commodity prices.
- The US Dollar receives support from rising odds of the Fed maintaining rates in January.
The Australian Dollar (AUD) extends its gains against the US Dollar (USD) for a second consecutive day on Tuesday, rebounding from 0.6131, its lowest level since April 2020. The AUD/USD pair strengthened as the AUD benefitted from robust commodity prices.
The S&P/ASX 200 Index also increased by 0.2% to around 8,210 on Tuesday, snapping a three-day losing streak. Mining and energy stocks led the recovery, while Australian shares followed overnight gains on Wall Street, where investors shifted focus from megacap tech stocks to other sectors.
Traders analyzed data showing a second consecutive monthly drop in consumer confidence. Australia's Westpac Consumer Confidence Index fell by 0.7% to 92.1 points in January 2025, highlighting persistent pessimism among consumers.
The AUD/USD pair faces downward pressure as markets price in a 75% probability of a rate cut by the Reserve Bank of Australia (RBA) next month. Investors are expected to closely monitor Australian employment data, set to be released later this week, for additional clarity on the RBA's policy outlook.
The AUD also found some support from China's recent stimulus measures, given the close trading relationship between Australia and China, any changes in China's economic conditions could significantly influence Australian markets.
Australian Dollar could struggle due to hawkish sentiment surrounding Fed’s policy outlook
- The US Dollar Index (DXY), which measures the US Dollar’s performance against six major currencies, trades near 109.60, its highest level since November 2022. The USD gained strength following robust US labor market data for December, which is expected to support the US Federal Reserve’s (Fed) decision to maintain interest rates at current levels in January.
- US labor market data fueled a rise in US Treasury yields, with the 2-year yield climbing to 4.42% and the 10-year yield reaching 4.80% as of Monday.
- Data from the US Bureau of Labor Statistics (BLS), released on Friday, reported that Nonfarm Payrolls (NFP) increased by 256K in December, significantly exceeding market expectations of 160K and surpassing the revised November figure of 212K (previously reported as 227K).
- Federal Reserve Board of Governors member Michelle Bowman added her voice to a chorus of Fed speakers last week as policymakers work double-duty to try and smooth over market reactions to a much tighter pace of rate cuts in 2025 than many market participants had previously anticipated.
- Kansas Fed President Jeffrey Schmid made headlines on Thursday, stating that most of the Federal Reserve's mandated targets have recently been achieved. Schmid emphasized the need to reduce the Fed's balance sheet, suggesting that interest rate policy is approaching its long-term equilibrium. He noted that any future rate cuts should be gradual and guided by economic data.
- On Monday, the China Foreign Exchange Committee (CFXC) pledged to support the Chinese Yuan during a meeting in Beijing on Monday, held under the guidance of the People’s Bank of China (PBOC). Separately, the PBOC and the State Administration of Foreign Exchange (SAFE), China’s FX regulator, announced an increase in the macro-prudential adjustment parameter for cross-border financing from 1.5 to 1.75, effective January 13, 2025.
- TD-MI Inflation Gauge climbed by 0.6% month-over-month in December, a significant acceleration from the 0.2% increase in November, reaching its highest level since December 2023. On an annual basis, the Inflation Gauge rose by 2.6%, down from the previous 2.9% increase.
- People's Bank of China (PBOC) Governor Pan Gongsheng stated on Monday that "interest rate and reserve requirement ratio (RRR) tools will be utilized to maintain ample liquidity." Gongsheng reaffirmed China's plans to increase the fiscal deficit and emphasized that China will continue to be a driving force for the global economy.
Technical Analysis: Australian Dollar advances to near nine-day EMA, 0.6200
The AUD/USD pair trades around 0.6190 on Tuesday, maintaining its bearish outlook as it remains within a descending channel on the daily chart. The 14-day Relative Strength Index (RSI) has climbed above the 30 level, indicating a recovery from oversold conditions.
The pair faces immediate resistance at the nine-day Exponential Moving Average (EMA) at 0.6193, followed by the 14-day EMA at 0.6210. A more significant resistance level lies near the upper boundary of the descending channel, around 0.6230.
On the downside, the AUD/USD pair may test support at the lower boundary of the descending channel, close to the 0.5940 level.
AUD/USD: Daily Chart
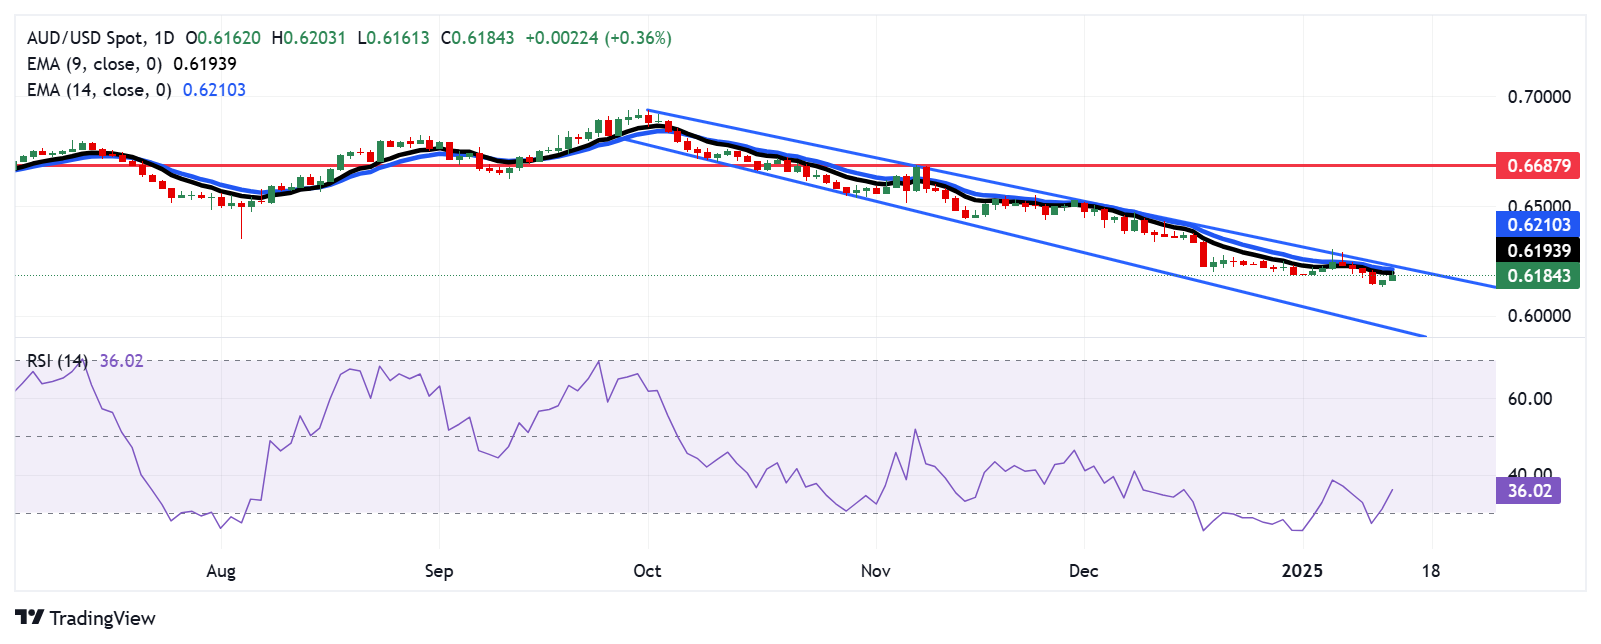
Australian Dollar PRICE Today
The table below shows the percentage change of Australian Dollar (AUD) against listed major currencies today. Australian Dollar was the strongest against the US Dollar.
USD EUR GBP JPY CAD AUD NZD CHF USD -0.27% -0.20% -0.05% -0.11% -0.35% -0.66% -0.17% EUR 0.27% 0.06% 0.21% 0.16% -0.07% -0.39% 0.10% GBP 0.20% -0.06% 0.13% 0.09% -0.15% -0.46% 0.04% JPY 0.05% -0.21% -0.13% -0.06% -0.30% -0.62% -0.11% CAD 0.11% -0.16% -0.09% 0.06% -0.24% -0.55% -0.05% AUD 0.35% 0.07% 0.15% 0.30% 0.24% -0.30% 0.19% NZD 0.66% 0.39% 0.46% 0.62% 0.55% 0.30% 0.50% CHF 0.17% -0.10% -0.04% 0.11% 0.05% -0.19% -0.50% The heat map shows percentage changes of major currencies against each other. The base currency is picked from the left column, while the quote currency is picked from the top row. For example, if you pick the Australian Dollar from the left column and move along the horizontal line to the US Dollar, the percentage change displayed in the box will represent AUD (base)/USD (quote).
Australian Dollar FAQs
One of the most significant factors for the Australian Dollar (AUD) is the level of interest rates set by the Reserve Bank of Australia (RBA). Because Australia is a resource-rich country another key driver is the price of its biggest export, Iron Ore. The health of the Chinese economy, its largest trading partner, is a factor, as well as inflation in Australia, its growth rate and Trade Balance. Market sentiment – whether investors are taking on more risky assets (risk-on) or seeking safe-havens (risk-off) – is also a factor, with risk-on positive for AUD.
The Reserve Bank of Australia (RBA) influences the Australian Dollar (AUD) by setting the level of interest rates that Australian banks can lend to each other. This influences the level of interest rates in the economy as a whole. The main goal of the RBA is to maintain a stable inflation rate of 2-3% by adjusting interest rates up or down. Relatively high interest rates compared to other major central banks support the AUD, and the opposite for relatively low. The RBA can also use quantitative easing and tightening to influence credit conditions, with the former AUD-negative and the latter AUD-positive.
China is Australia’s largest trading partner so the health of the Chinese economy is a major influence on the value of the Australian Dollar (AUD). When the Chinese economy is doing well it purchases more raw materials, goods and services from Australia, lifting demand for the AUD, and pushing up its value. The opposite is the case when the Chinese economy is not growing as fast as expected. Positive or negative surprises in Chinese growth data, therefore, often have a direct impact on the Australian Dollar and its pairs.
Iron Ore is Australia’s largest export, accounting for $118 billion a year according to data from 2021, with China as its primary destination. The price of Iron Ore, therefore, can be a driver of the Australian Dollar. Generally, if the price of Iron Ore rises, AUD also goes up, as aggregate demand for the currency increases. The opposite is the case if the price of Iron Ore falls. Higher Iron Ore prices also tend to result in a greater likelihood of a positive Trade Balance for Australia, which is also positive of the AUD.
The Trade Balance, which is the difference between what a country earns from its exports versus what it pays for its imports, is another factor that can influence the value of the Australian Dollar. If Australia produces highly sought after exports, then its currency will gain in value purely from the surplus demand created from foreign buyers seeking to purchase its exports versus what it spends to purchase imports. Therefore, a positive net Trade Balance strengthens the AUD, with the opposite effect if the Trade Balance is negative.
-
03:20
NZD/USD attracts some buyers to near 0.5600, investors await US PPI inflation data
- NZD/USD gains momentum to near 0.5600 in Tuesday’s Asian session, adding 0.60% on the day.
- The stronger-than-expected United States employment report might boost the USD and cap the pair’s downside.
- China exports accelerated in December, beating the estimation.
The NZD/USD pair recovers from a two-year low to around 0.5600 during the early Asian session on Tuesday. The modest decline of the Greenback and encouraging Chinese economic data provide some support to the pair. Traders await the US Producer Price Index (PPI) for December, which is due later on Tuesday.
The US Dollar Index (DXY), which tracks the USD currency against a basket of its peers, currently trades near 109.60 after retreating from 110.17, its highest level since November 2022. Meanwhile, the 10-year US Treasury bond yield reached 4.8%, its highest level since late 2023.
The strong US December Nonfarm Payrolls (NFP) report on Friday led traders to slash expectations for interest rate cuts by the US Federal Reserve (Fed) this year, which might lift the US Dollar (USD). Swaps markets now expect just one quarter-point cut in 2025, with some analysts anticipating the easing cycle has finished.
On the Kiwi front, China’s exports grew at a faster pace than expected in December, rising 10.7% from a year earlier, the official customs data showed Monday. Additionally, China's Trade Surplus grew to $104.84 billion in December, up from $97.44 billion in November. The recovery in the Chinese economy might underpin the New Zealand Dollar (NZD), as China is a major trading partner for New Zealand.
However, U.S. President-elect Donald Trump is set to return to the White House on January 20. This could spark fears of a renewed trade war between the US and China, weighing on the China-proxy Kiwi.New Zealand Dollar FAQs
The New Zealand Dollar (NZD), also known as the Kiwi, is a well-known traded currency among investors. Its value is broadly determined by the health of the New Zealand economy and the country’s central bank policy. Still, there are some unique particularities that also can make NZD move. The performance of the Chinese economy tends to move the Kiwi because China is New Zealand’s biggest trading partner. Bad news for the Chinese economy likely means less New Zealand exports to the country, hitting the economy and thus its currency. Another factor moving NZD is dairy prices as the dairy industry is New Zealand’s main export. High dairy prices boost export income, contributing positively to the economy and thus to the NZD.
The Reserve Bank of New Zealand (RBNZ) aims to achieve and maintain an inflation rate between 1% and 3% over the medium term, with a focus to keep it near the 2% mid-point. To this end, the bank sets an appropriate level of interest rates. When inflation is too high, the RBNZ will increase interest rates to cool the economy, but the move will also make bond yields higher, increasing investors’ appeal to invest in the country and thus boosting NZD. On the contrary, lower interest rates tend to weaken NZD. The so-called rate differential, or how rates in New Zealand are or are expected to be compared to the ones set by the US Federal Reserve, can also play a key role in moving the NZD/USD pair.
Macroeconomic data releases in New Zealand are key to assess the state of the economy and can impact the New Zealand Dollar’s (NZD) valuation. A strong economy, based on high economic growth, low unemployment and high confidence is good for NZD. High economic growth attracts foreign investment and may encourage the Reserve Bank of New Zealand to increase interest rates, if this economic strength comes together with elevated inflation. Conversely, if economic data is weak, NZD is likely to depreciate.
The New Zealand Dollar (NZD) tends to strengthen during risk-on periods, or when investors perceive that broader market risks are low and are optimistic about growth. This tends to lead to a more favorable outlook for commodities and so-called ‘commodity currencies’ such as the Kiwi. Conversely, NZD tends to weaken at times of market turbulence or economic uncertainty as investors tend to sell higher-risk assets and flee to the more-stable safe havens.
-
02:48
BoJ’s Himino: At next week's policy meeting, board will likely to debate whether to hike rates
Bank of Japan (BoJ) Deputy Governor Ryozo Himino said on Tuesday that “at next week's policy meeting, board will likely to debate whether to hike rates and make a decision.”
Additional comments
In conducting monetary policy, it is necessary to pay close attention to short-term developments in economic activity, prices, and financial conditions.
Inflation expectation has risen from below one percent to around one and half.
BoJ aims to achieve the price stability target of 2 percent in a sustainable and stable manner.
This target cannot be achieved unless actual inflation rate declines as envisioned.
If inflation expectation does not rise toward 2%, the actual inflation rate will eventually fall below 2%, and it would therefore not be possible to achieve target in sustainable and stable manner.
So far, developments in prices and inflation expectation seem to have been largely on path.
If this outlook will continue to be realised, BoJ will raise the policy interest rate accordingly and adjust degree of monetary easing.
There are risk factors at home and abroad, both upside and downside.
Domestically, close attention needed on outlook for wage increases in FY2025.
Raising wages would by no means be a simple matter.
Currently updating outlook for Japan's economic activity and prices for this year onward by scrutinizing the latest data available and other information.
Outlook to be presented in BoJ’s outlook report next week.
In guiding policy, determining timing of policy change is difficult and important.
It is not normal state for real rates to stay negative for prolonged period once shock, deflationary factors dissipate.
We can foresee future where japan emerges from state where real rates are in deeply negative territory.
As for near-term policy guidance, we need to look closely at short-term economic, price and financial developments.
Japan's inflation expectations have gradually heightened, now around 1.5%.
Japan's economy is roughly moving in line with our scenario projecting underlying inflation, inflation expectations to both move around 2%.
Undesirable for central banks to intentionally cause surprise in guiding monetary policy, except for when there is a crisis.
We don't side with the view central banks must communicate in a way that allows markets to fully price in outcome of our policy meeting in advance.
Not possible to telegraph monetary policy decision as outcome of policy meeting depends on discussions at meeting.
Acknowledge there is room for improvement in communication with markets.
Market reaction
The Japanese Yen came under renewed selling pressure on these comments, driving USD/JPY back to test 158.00 before reversing sharply to near 157.50, where it now wavers.
-
02:15
PBOC sets USD/CNY reference rate at 7.1878 vs. 7.1885 previous
The People’s Bank of China (PBoC) set the USD/CNY central rate for the trading session ahead on Tuesday at 7.1878 as compared to the previous day's fix of 7.1885 and 7.3161 Reuters estimates.
-
01:45
ECB's Villeroy: We don't see recession in France
European Central Bank (ECB) Governing Council member and Bank of France Governor Francois Villeroy de Galhau said on Monday that while the French economy is "slowing down, he doesn't see a recession.
Key quotes
French growth could pick up in 2026 and 2027, while it is believed that it was at 0% in the fourth quarter of 2024.
France's annual consumer inflation came in at 1.3% in December, unchanged from the November figure.
Financial markets will assess France's credibility.
France is not a risk of not being able to finance itself; the question is, at what cost.Market reaction
At the time of writing, EUR/USD is trading 0.32% higher on the day to trade at 1.0249.
ECB FAQs
The European Central Bank (ECB) in Frankfurt, Germany, is the reserve bank for the Eurozone. The ECB sets interest rates and manages monetary policy for the region. The ECB primary mandate is to maintain price stability, which means keeping inflation at around 2%. Its primary tool for achieving this is by raising or lowering interest rates. Relatively high interest rates will usually result in a stronger Euro and vice versa. The ECB Governing Council makes monetary policy decisions at meetings held eight times a year. Decisions are made by heads of the Eurozone national banks and six permanent members, including the President of the ECB, Christine Lagarde.
In extreme situations, the European Central Bank can enact a policy tool called Quantitative Easing. QE is the process by which the ECB prints Euros and uses them to buy assets – usually government or corporate bonds – from banks and other financial institutions. QE usually results in a weaker Euro. QE is a last resort when simply lowering interest rates is unlikely to achieve the objective of price stability. The ECB used it during the Great Financial Crisis in 2009-11, in 2015 when inflation remained stubbornly low, as well as during the covid pandemic.
Quantitative tightening (QT) is the reverse of QE. It is undertaken after QE when an economic recovery is underway and inflation starts rising. Whilst in QE the European Central Bank (ECB) purchases government and corporate bonds from financial institutions to provide them with liquidity, in QT the ECB stops buying more bonds, and stops reinvesting the principal maturing on the bonds it already holds. It is usually positive (or bullish) for the Euro.
-
01:30
Stocks. Daily history for Monday, January 13, 2025
Index Change, points Closed Change, % Hang Seng -190.15 18874.14 -1 KOSPI -26.22 2489.56 -1.04 ASX 200 -102.2 8191.9 -1.23 DAX -81.94 20132.85 -0.41 CAC 40 -22.4 7408.64 -0.3 Dow Jones 358.67 42297.12 0.86 S&P 500 9.18 5836.22 0.16 NASDAQ Composite -73.53 19088.1 -0.38 -
01:28
WTI climbs above $77.00 as US sanctions trigger global supply fears
- WTI price edges higher to $77.25 in Tuesday’s early Asian session.
- The US increased sanctions against Russian energy, boosting the WTI price.
- The prospect of fewer Fed rate cuts this year might cap the downside for the black gold.
West Texas Intermediate (WTI), the US crude oil benchmark, is trading around $77.25 on Tuesday. The WTI price climbs to the highest level since October 8 as the US sanctions on Russian oil threaten to tighten global supplies.
US President Joe Biden’s administration imposed new sanctions on Russian oil giants Gazprom and Surgutneftegaz, as well as 183 oil tankers, often referred to as Russia’s ‘Shadow Fleet.’ The mounting concerns over supply disruptions could support the black gold in the near term.
“Supply is the key near-term driver, with Biden’s fresh sanctions on Russia’s two main oil producers and Russian tankers further complicating the logistical challenges Russia now faces,” said Chris Weston, Head of Research at Pepperstone.
China’s Exports and Imports in December both beat expectations by a wide margin, according to the National Bureau Statistics of China on Monday. Additionally, China’s Trade Surplus reached a new all-time high of $990 billion. The encouraging Chinese economic data could underpin the WTI price, as China is the world's second-largest consumer of oil and gas.
On the other hand, the upbeat US December employment report reinforced expectations that the US Federal Reserve (Fed) might not cut interest rates as aggressively this year. A firmer Greenback could reduce demand for energy by making USD-priced commodities like oil more expensive for buyers using other currencies.WTI Oil FAQs
WTI Oil is a type of Crude Oil sold on international markets. The WTI stands for West Texas Intermediate, one of three major types including Brent and Dubai Crude. WTI is also referred to as “light” and “sweet” because of its relatively low gravity and sulfur content respectively. It is considered a high quality Oil that is easily refined. It is sourced in the United States and distributed via the Cushing hub, which is considered “The Pipeline Crossroads of the World”. It is a benchmark for the Oil market and WTI price is frequently quoted in the media.
Like all assets, supply and demand are the key drivers of WTI Oil price. As such, global growth can be a driver of increased demand and vice versa for weak global growth. Political instability, wars, and sanctions can disrupt supply and impact prices. The decisions of OPEC, a group of major Oil-producing countries, is another key driver of price. The value of the US Dollar influences the price of WTI Crude Oil, since Oil is predominantly traded in US Dollars, thus a weaker US Dollar can make Oil more affordable and vice versa.
The weekly Oil inventory reports published by the American Petroleum Institute (API) and the Energy Information Agency (EIA) impact the price of WTI Oil. Changes in inventories reflect fluctuating supply and demand. If the data shows a drop in inventories it can indicate increased demand, pushing up Oil price. Higher inventories can reflect increased supply, pushing down prices. API’s report is published every Tuesday and EIA’s the day after. Their results are usually similar, falling within 1% of each other 75% of the time. The EIA data is considered more reliable, since it is a government agency.
OPEC (Organization of the Petroleum Exporting Countries) is a group of 12 Oil-producing nations who collectively decide production quotas for member countries at twice-yearly meetings. Their decisions often impact WTI Oil prices. When OPEC decides to lower quotas, it can tighten supply, pushing up Oil prices. When OPEC increases production, it has the opposite effect. OPEC+ refers to an expanded group that includes ten extra non-OPEC members, the most notable of which is Russia.
-
01:15
Currencies. Daily history for Monday, January 13, 2025
Pare Closed Change, % AUDUSD 0.61731 0.44 EURJPY 161.278 -0.07 EURUSD 1.02376 0.04 GBPJPY 192.179 -0.04 GBPUSD 1.21996 0.02 NZDUSD 0.55798 0.53 USDCAD 1.43774 -0.29 USDCHF 0.91731 0.12 USDJPY 157.528 -0.1 -
01:01
EUR/USD scrambles to recover ground after fresh test of two-year lows
- EUR/USD tapped the 1.0200 handle for the first time in over two years on Monday.
- European final inflation figures are due this week, but are unlikely to move the needle.
- It’s the Greenback’s ballgame to lose this week with key US inflation figures on the data docket.
EUR/USD continued to explore the bearish side of the charts on Monday, declining into the 1.0200 handle for the first time since late 2022, etching in a fresh 26-month low before staging half-hearted recovery later in the day.
European economic data remains tepid throughout the trading week. The European Central Bank (ECB) is set to continue reducing interest rates, further widening the Euro’s interest rate differential against the US Dollar. Pan-ERU and German final inflation due through the midweek sessions are not expected to deviate significantly from their preliminary prints.
US Producer Price Index (PPI) figures kick the week’s meaningful data docket off on Tuesday, which is expected to rise to 3.7% YoY in December versus the previous 3.4%. US CPI inflation, also due on Wednesday, is forecast to tick higher to 2.8% from 2.7%, and US Retail Sales activity is slated for Thursday.
EUR/USD price forecast
EUR/USD continues to plumb the depths of recent bearish momentum, and Fiber is on pace to chalk in a fourth consecutive losing month. The pair has tested the 1.0200 handle for the first time in a little over two years, but the one-sided nature of price action on EUR/USD leaves downside breaks as a sign of continued bearish momentum rather than firm signs of a potential turnaround.
EUR/USD daily chart
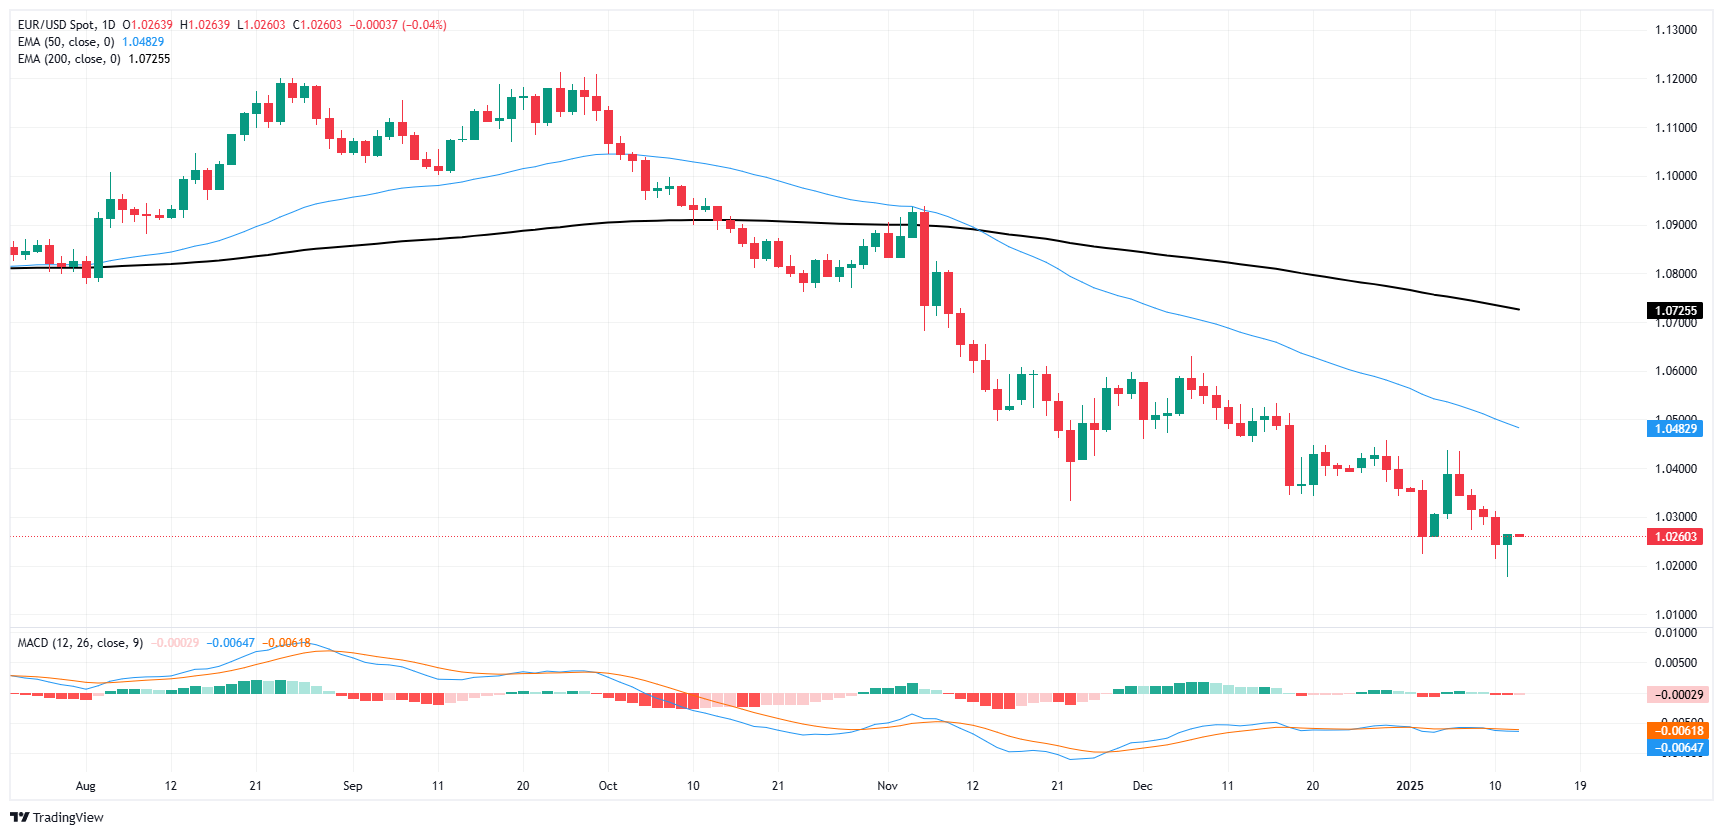
Euro FAQs
The Euro is the currency for the 19 European Union countries that belong to the Eurozone. It is the second most heavily traded currency in the world behind the US Dollar. In 2022, it accounted for 31% of all foreign exchange transactions, with an average daily turnover of over $2.2 trillion a day. EUR/USD is the most heavily traded currency pair in the world, accounting for an estimated 30% off all transactions, followed by EUR/JPY (4%), EUR/GBP (3%) and EUR/AUD (2%).
The European Central Bank (ECB) in Frankfurt, Germany, is the reserve bank for the Eurozone. The ECB sets interest rates and manages monetary policy. The ECB’s primary mandate is to maintain price stability, which means either controlling inflation or stimulating growth. Its primary tool is the raising or lowering of interest rates. Relatively high interest rates – or the expectation of higher rates – will usually benefit the Euro and vice versa. The ECB Governing Council makes monetary policy decisions at meetings held eight times a year. Decisions are made by heads of the Eurozone national banks and six permanent members, including the President of the ECB, Christine Lagarde.
Eurozone inflation data, measured by the Harmonized Index of Consumer Prices (HICP), is an important econometric for the Euro. If inflation rises more than expected, especially if above the ECB’s 2% target, it obliges the ECB to raise interest rates to bring it back under control. Relatively high interest rates compared to its counterparts will usually benefit the Euro, as it makes the region more attractive as a place for global investors to park their money.
Data releases gauge the health of the economy and can impact on the Euro. Indicators such as GDP, Manufacturing and Services PMIs, employment, and consumer sentiment surveys can all influence the direction of the single currency. A strong economy is good for the Euro. Not only does it attract more foreign investment but it may encourage the ECB to put up interest rates, which will directly strengthen the Euro. Otherwise, if economic data is weak, the Euro is likely to fall. Economic data for the four largest economies in the euro area (Germany, France, Italy and Spain) are especially significant, as they account for 75% of the Eurozone’s economy.
Another significant data release for the Euro is the Trade Balance. This indicator measures the difference between what a country earns from its exports and what it spends on imports over a given period. If a country produces highly sought after exports then its currency will gain in value purely from the extra demand created from foreign buyers seeking to purchase these goods. Therefore, a positive net Trade Balance strengthens a currency and vice versa for a negative balance.
-
00:51
Japan Trade Balance - BOP Basis climbed from previous ¥-155.7B to ¥97.9B in November
-
00:50
Japan Bank Lending (YoY) meets forecasts (3.1%) in December
-
00:50
Japan Current Account n.s.a. registered at ¥3352.5B above expectations (¥2691B) in November
-
00:35
Australia Westpac Consumer Confidence up to -0.7% in January from previous -2%
-
00:33
Australia Westpac Consumer Confidence: 92.1% (January) vs -2%
-
00:32
Trump team studies gradual tariff hikes for leverage, inflation control
President-elect Donald Trump's economic advisers are discussing slowly ramping up tariffs month by month, a gradual approach aimed at boosting negotiating leverage while mitigating the upside inflation risk, according to people familiar with the matter.
One idea suggests implementing a series of escalating tariffs, increasing by about 2% to 5% a month, and would rely on executive authorities under the International Emergency Economic Powers Act, Bloomberg reported, citing people familiar with the matter.Market reaction
The US Dollar Index (DXY) is trading 0.23% lower on the day at 109.36 as of writing.
US Dollar FAQs
The US Dollar (USD) is the official currency of the United States of America, and the ‘de facto’ currency of a significant number of other countries where it is found in circulation alongside local notes. It is the most heavily traded currency in the world, accounting for over 88% of all global foreign exchange turnover, or an average of $6.6 trillion in transactions per day, according to data from 2022. Following the second world war, the USD took over from the British Pound as the world’s reserve currency. For most of its history, the US Dollar was backed by Gold, until the Bretton Woods Agreement in 1971 when the Gold Standard went away.
The most important single factor impacting on the value of the US Dollar is monetary policy, which is shaped by the Federal Reserve (Fed). The Fed has two mandates: to achieve price stability (control inflation) and foster full employment. Its primary tool to achieve these two goals is by adjusting interest rates. When prices are rising too quickly and inflation is above the Fed’s 2% target, the Fed will raise rates, which helps the USD value. When inflation falls below 2% or the Unemployment Rate is too high, the Fed may lower interest rates, which weighs on the Greenback.
In extreme situations, the Federal Reserve can also print more Dollars and enact quantitative easing (QE). QE is the process by which the Fed substantially increases the flow of credit in a stuck financial system. It is a non-standard policy measure used when credit has dried up because banks will not lend to each other (out of the fear of counterparty default). It is a last resort when simply lowering interest rates is unlikely to achieve the necessary result. It was the Fed’s weapon of choice to combat the credit crunch that occurred during the Great Financial Crisis in 2008. It involves the Fed printing more Dollars and using them to buy US government bonds predominantly from financial institutions. QE usually leads to a weaker US Dollar.
Quantitative tightening (QT) is the reverse process whereby the Federal Reserve stops buying bonds from financial institutions and does not reinvest the principal from the bonds it holds maturing in new purchases. It is usually positive for the US Dollar.
-
00:08
USD/CAD attracts some sellers to near 1.4350 ahead of US PPI release
- USD/CAD edges lower to around 1.4355 in Tuesday’s early Asian session.
- A rise in crude oil prices boosts the commodity-linked Loonie.
- The stronger-than-expected US December NFP dampened the outlook for Fed rate cuts, which might lift the USD.
The USD/CAD pair weakens to near 1.4355 during the early Asian session on Tuesday. A rise in crude oil prices amid further US sanctions to Russian oil underpins the commodity-linked Canadian Dollar (CAD) against the Greenback. Later on Tuesday, the US Producer Price Index (PPI) for December will take center stage.
Crude oil prices extend the rally to the highest in four months following the introduction of a fresh package of sanctions against Russia by the Biden administration. This, in turn, provides some support to the Loonie and acts as a headwind for the pair. It's worth noting that Canada is the largest oil exporter to the United States (US), and higher crude oil prices tend to have a positive impact on the CAD value.
On the other hand, the prospect of fewer interest rate cuts by the US Federal Reserve (Fed) this year might boost the Greenback. Friday’s data showed US job growth unexpectedly accelerated in December and the Unemployment Rate fell to 4.1%, supporting the case for delaying the easing cycle this year. Markets are now pricing in one rate cut from the Fed in 2025, down from roughly two quarter-point cuts priced at the start of the year.Canadian Dollar FAQs
The key factors driving the Canadian Dollar (CAD) are the level of interest rates set by the Bank of Canada (BoC), the price of Oil, Canada’s largest export, the health of its economy, inflation and the Trade Balance, which is the difference between the value of Canada’s exports versus its imports. Other factors include market sentiment – whether investors are taking on more risky assets (risk-on) or seeking safe-havens (risk-off) – with risk-on being CAD-positive. As its largest trading partner, the health of the US economy is also a key factor influencing the Canadian Dollar.
The Bank of Canada (BoC) has a significant influence on the Canadian Dollar by setting the level of interest rates that banks can lend to one another. This influences the level of interest rates for everyone. The main goal of the BoC is to maintain inflation at 1-3% by adjusting interest rates up or down. Relatively higher interest rates tend to be positive for the CAD. The Bank of Canada can also use quantitative easing and tightening to influence credit conditions, with the former CAD-negative and the latter CAD-positive.
The price of Oil is a key factor impacting the value of the Canadian Dollar. Petroleum is Canada’s biggest export, so Oil price tends to have an immediate impact on the CAD value. Generally, if Oil price rises CAD also goes up, as aggregate demand for the currency increases. The opposite is the case if the price of Oil falls. Higher Oil prices also tend to result in a greater likelihood of a positive Trade Balance, which is also supportive of the CAD.
While inflation had always traditionally been thought of as a negative factor for a currency since it lowers the value of money, the opposite has actually been the case in modern times with the relaxation of cross-border capital controls. Higher inflation tends to lead central banks to put up interest rates which attracts more capital inflows from global investors seeking a lucrative place to keep their money. This increases demand for the local currency, which in Canada’s case is the Canadian Dollar.
Macroeconomic data releases gauge the health of the economy and can have an impact on the Canadian Dollar. Indicators such as GDP, Manufacturing and Services PMIs, employment, and consumer sentiment surveys can all influence the direction of the CAD. A strong economy is good for the Canadian Dollar. Not only does it attract more foreign investment but it may encourage the Bank of Canada to put up interest rates, leading to a stronger currency. If economic data is weak, however, the CAD is likely to fall.
-