Noticias del mercado
-
22:58
NZD/JPY Price Analysis: Fresh sell-off signals deeper downside potential
- NZD/JPY slipped to around 87.00 in a renewed wave of selling.
- RSI plunges, reinforcing the pair’s tilt toward sustained bearish momentum.
- MACD histogram prints rising red bars, hinting that sellers may remain in control for now.
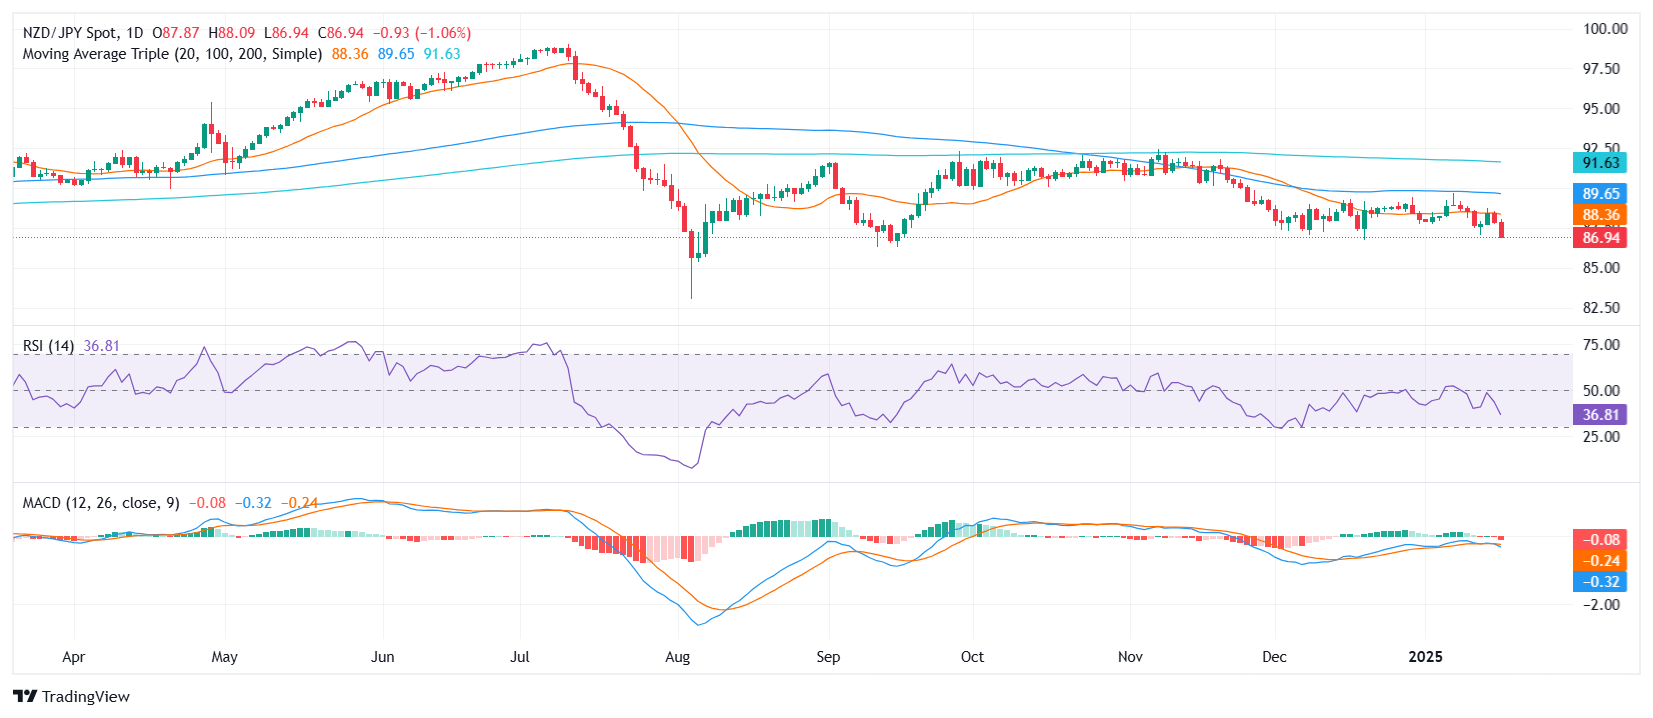
The NZD/JPY cross found itself under renewed pressure on Thursday, sliding 0.84% to around 87.05. Persistent selling has kept the pair pinned to lower levels, erasing gains from earlier this week. The swift downside move suggests that market participants remain inclined to sell on any short-lived rebounds, effectively tilting the near-term tone toward negativity.
In terms of technical indicators, the Relative Strength Index (RSI) has declined sharply to 37, emphasizing building downside momentum. Meanwhile, the Moving Average Convergence Divergence (MACD) histogram shows rising red bars, underscoring that sellers are retaining their grip. Combined, these signals point to a cautious backdrop where buyers may hesitate to reenter aggressively.
Looking ahead, immediate support appears near the 86.80–87.00 region, with a break below this zone potentially opening the door toward 86.50 or lower. On the flip side, if bulls manage to drive NZD/JPY above the 87.70 pivot, it could spark a modest recovery, though the overall bias would likely stay negative unless the pair can reclaim the 88.00 handle with conviction.
NZD/JPY daily chart
-
22:54
USD/CHF Price Forecast: Pulls-back from eight-month high of 0.9200
- USD/CHF retreats 0.18% from peak, unable to hold gains despite positive U.S. economic reports.
- Technical analysis: resistance at 0.9135; further gains possible if surpassed.
- Support levels at 0.9098 and 0.9077; critical support at January low of 0.9007.
The USD/CHF retreats after hitting an eight-month peak at 0.9200 and drops towards the 0.9100 mark, registering losses of over 0.18%. Upbeat data from the United States (US) failed to bolster the Greenback, which extended its losses following dovish remarks from Fed Governor Christopher Waller.
USD/CHF Price Forecast: Technical outlook
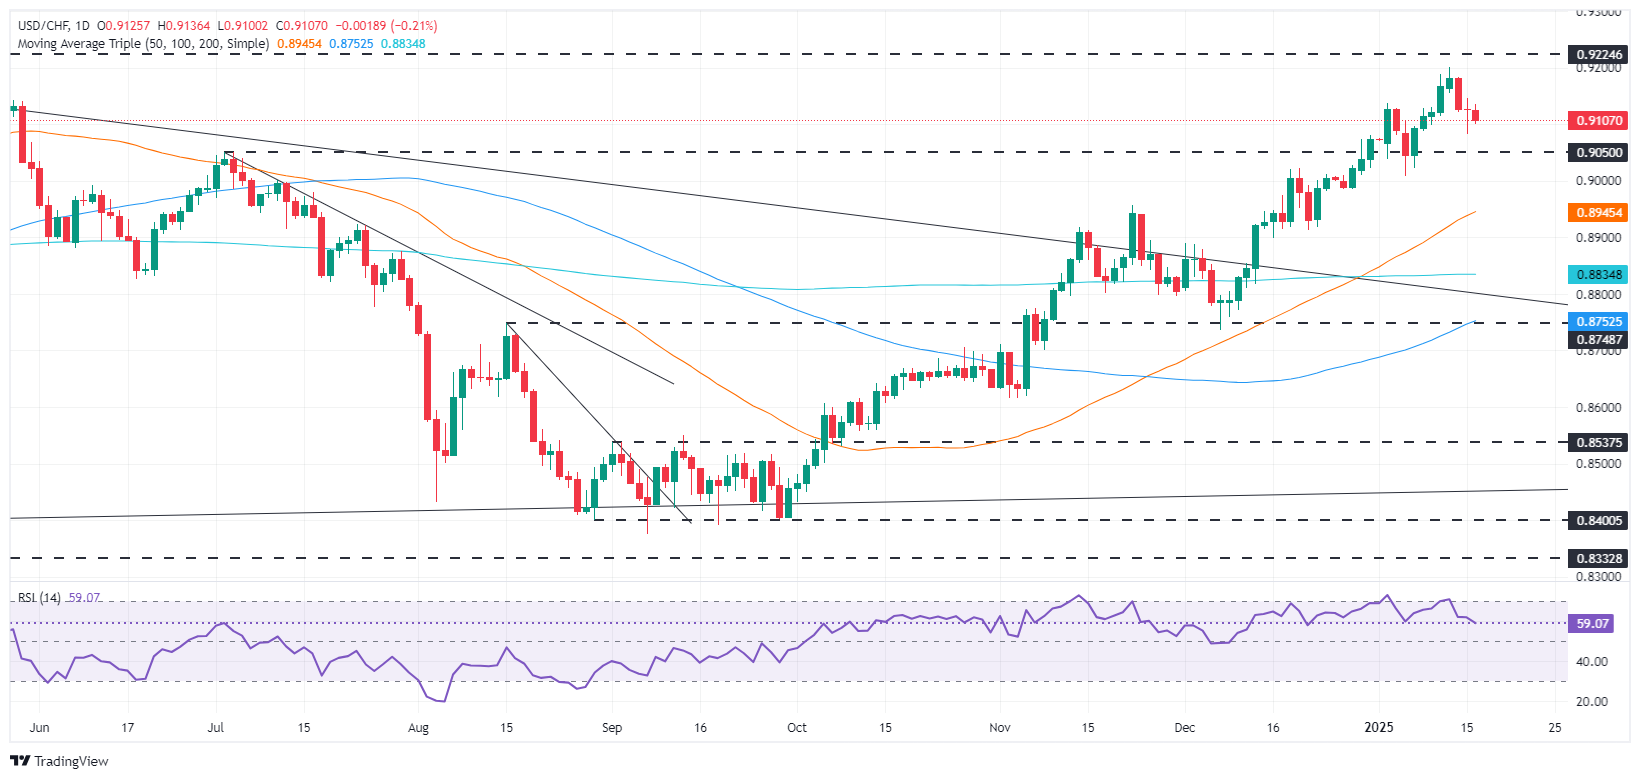
Since October of last year, the USD/CHF enjoyed a healthy uptrend, with the Greenback appreciating over 9% against the Swiss Franc. However, buyers failed to prolong the trend, as the pair tumbled to a six-day low on Wednesday at 0.9077 before recovering some ground.
Although the pair is set to end Thursday’s session with losses, further upside is seen after achieving a higher low, with prices finding acceptance near the 0.9098-0.9135 range.
If buyers clear 0.9135, the next resistance will be the January 13 daily high at 0.9200, the top of a ‘shooting star.’ If broken, the next ceiling level will be the April 2024 peak at 0.9224.
Conversely, if USD/CHF remains below 0.9100, the first support would be 0.9098 and 0.9077. If those levels are taken out, look for a possible bounce at 0.9007, the January 6 swing low.
USD/CHF Price Chart - Daily
Swiss Franc PRICE Today
The table below shows the percentage change of Swiss Franc (CHF) against listed major currencies today. Swiss Franc was the strongest against the US Dollar.
USD EUR GBP JPY CAD AUD NZD CHF USD -0.03% -0.06% -0.05% -0.04% -0.04% -0.02% -0.05% EUR 0.03% -0.04% 0.00% -0.02% -0.03% 0.02% -0.03% GBP 0.06% 0.04% 0.02% 0.03% 0.03% 0.05% 0.02% JPY 0.05% 0.00% -0.02% 0.03% 0.02% 0.04% 0.00% CAD 0.04% 0.02% -0.03% -0.03% 0.00% 0.04% -0.01% AUD 0.04% 0.03% -0.03% -0.02% -0.00% 0.02% -0.02% NZD 0.02% -0.02% -0.05% -0.04% -0.04% -0.02% -0.03% CHF 0.05% 0.03% -0.02% -0.00% 0.01% 0.02% 0.03% The heat map shows percentage changes of major currencies against each other. The base currency is picked from the left column, while the quote currency is picked from the top row. For example, if you pick the Swiss Franc from the left column and move along the horizontal line to the US Dollar, the percentage change displayed in the box will represent CHF (base)/USD (quote).
-
22:46
NZD/USD Price Analysis: Dip challenges support at the 20-day SMA
- NZD/USD eases on Thursday, hovering near 0.5610 in a cautious market mood.
- MACD histogram shows rising green bars, hinting at subdued but ongoing buyer interest.
- RSI sits at 45, slipping slightly yet staying within a mild negative zone.
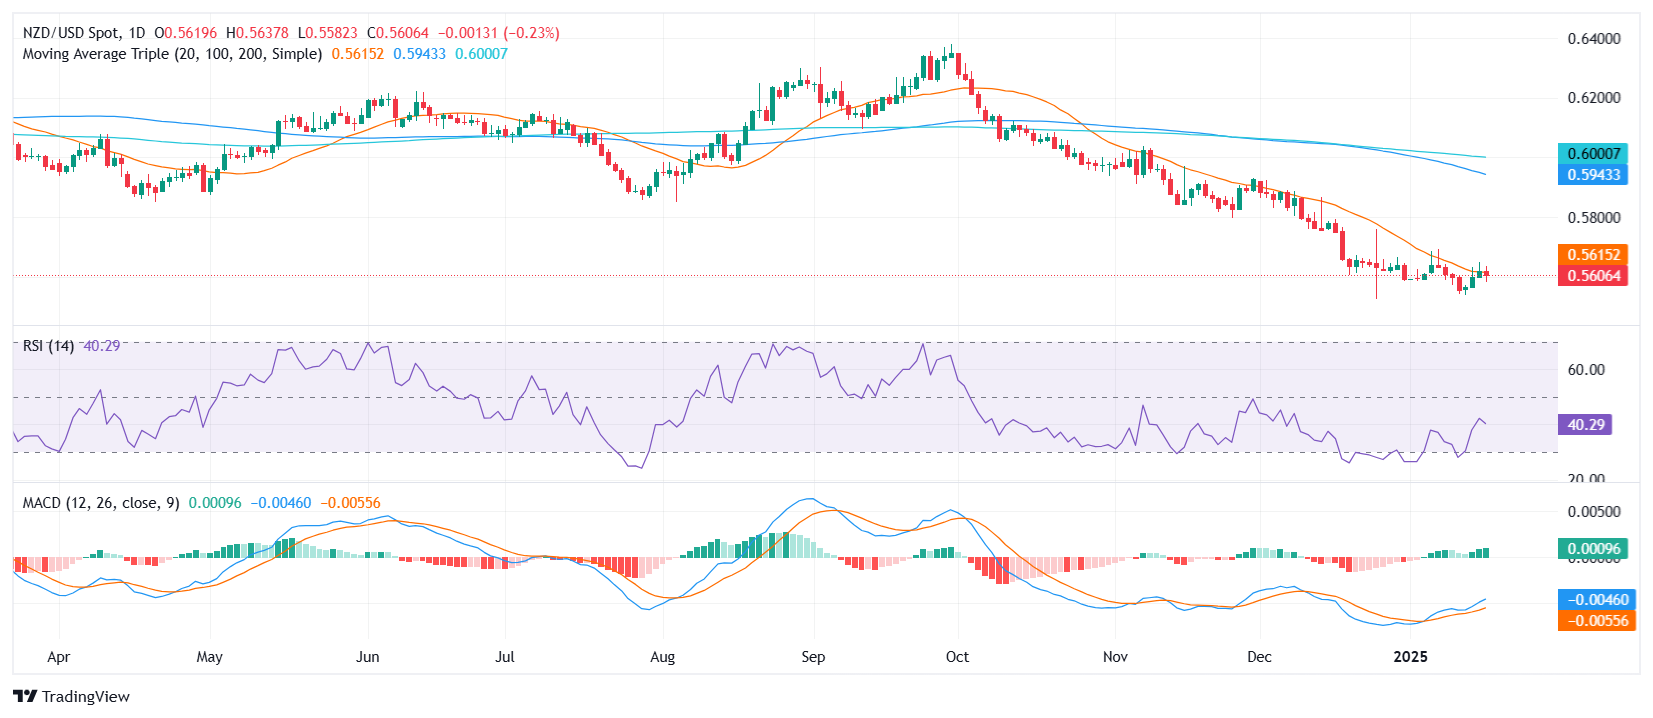
The NZD/USD pair encountered modest pressure on Thursday, drifting 0.16% lower to roughly 0.5610. Despite this pullback, the exchange rate has managed to hold close to its 20-day Simple Moving Average (SMA), a signal that buyers could be attempting to build a floor under recent price action. While momentum remains tepid, the pair’s resilience at this critical threshold indicates a measured appetite for higher levels.
Technically, the Moving Average Convergence Divergence (MACD) histogram continues to print rising green bars, suggesting that, although not overwhelming, there is a degree of underlying demand. Meanwhile, the Relative Strength Index (RSI) has edged down to 45, reflecting a slight decline in bullish conviction without totally ceding ground to sellers. This delicate balance between optimism and caution leaves NZD/USD in a precarious spot.
Going forward, a sustained hold above the 20-day SMA near 0.5600 would underline the possibility of further gains, potentially guiding the pair toward the 0.5650 region. Conversely, a break beneath the immediate support could target 0.5580, with a deeper slide exposing 0.5550 if sentiment takes another negative turn.
NZD/USD daily chart
-
22:30
New Zealand Business NZ PMI rose from previous 45.5 to 45.9 in December
-
21:48
Australian Dollar retreats from weekly highs despite upbeat job figures
- Pair slips to 0.6230 on Thursday by nearly 0.30%.
- Early gains fade after strong Australian employment data.
- Diminished tariff risks and risk-on mood cushion the downside.
AUD/USD faced rejection near 0.6250 and fell to 0.6230 in Thursday trading, paring initial gains spurred by Australia’s mixed labor report. A more optimistic market mood helped by reduced anxiety over potential tariff disruptions limits deeper losses. Still, the pair remains under scrutiny as investors monitor the Reserve Bank of Australia’s (RBA) policy direction and the US Dollar’s movements, which trades weak after mid-tier data.
Daily digest market movers: Aussie rotates lower as traders assess fresh local labor data
- The Australian Bureau of Statistics revealed a 53.6K employment increase in December, handily beating the 15K forecast and the prior 28.2K.
- The Unemployment Rate edged up to 4.0%, matching estimates, from 3.9%.
- Markets now see a 67% chance the RBA will slash its Official Cash Rate by 25 basis points to 4.10% in February, with further easing likely by April.
- The US Dollar remains range-bound as investors weigh near-term catalysts, including potential shifts in fiscal and trade policies under President-elect Trump.
- On the data front, Retail Sales for December posted a 0.4% monthly advance, missing the 0.6% forecast and below the prior 0.7% (revised to 0.8%).
- Initial Jobless Claims rose to 217K for the week ending January 10, while the prior 201K reading was revised to 203K.
- The CME FedWatch Tool shows that markets are pricing in that the Federal Reserve will keep rates steady in January with inflation uncertainties tied to the incoming Trump administration.
AUD/USD technical outlook: Pair slips below 0.6250, testing 20-day moving average
The AUD/USD declined 0.30% to 0.6230 on Thursday, retreating from a one-week peak. The Relative Strength Index (RSI) sits near 48, gradually easing in negative territory. The Moving Average Convergence Divergence (MACD) histogram shows rising green bars, hinting at lingering bullish attempts.
Although the pair backed off after briefly trading above its 20-day Simple Moving Average (SMA), the ability to hold near this key threshold could signal emerging support.
Australian Dollar FAQs
One of the most significant factors for the Australian Dollar (AUD) is the level of interest rates set by the Reserve Bank of Australia (RBA). Because Australia is a resource-rich country another key driver is the price of its biggest export, Iron Ore. The health of the Chinese economy, its largest trading partner, is a factor, as well as inflation in Australia, its growth rate and Trade Balance. Market sentiment – whether investors are taking on more risky assets (risk-on) or seeking safe-havens (risk-off) – is also a factor, with risk-on positive for AUD.
The Reserve Bank of Australia (RBA) influences the Australian Dollar (AUD) by setting the level of interest rates that Australian banks can lend to each other. This influences the level of interest rates in the economy as a whole. The main goal of the RBA is to maintain a stable inflation rate of 2-3% by adjusting interest rates up or down. Relatively high interest rates compared to other major central banks support the AUD, and the opposite for relatively low. The RBA can also use quantitative easing and tightening to influence credit conditions, with the former AUD-negative and the latter AUD-positive.
China is Australia’s largest trading partner so the health of the Chinese economy is a major influence on the value of the Australian Dollar (AUD). When the Chinese economy is doing well it purchases more raw materials, goods and services from Australia, lifting demand for the AUD, and pushing up its value. The opposite is the case when the Chinese economy is not growing as fast as expected. Positive or negative surprises in Chinese growth data, therefore, often have a direct impact on the Australian Dollar and its pairs.
Iron Ore is Australia’s largest export, accounting for $118 billion a year according to data from 2021, with China as its primary destination. The price of Iron Ore, therefore, can be a driver of the Australian Dollar. Generally, if the price of Iron Ore rises, AUD also goes up, as aggregate demand for the currency increases. The opposite is the case if the price of Iron Ore falls. Higher Iron Ore prices also tend to result in a greater likelihood of a positive Trade Balance for Australia, which is also positive of the AUD.
The Trade Balance, which is the difference between what a country earns from its exports versus what it pays for its imports, is another factor that can influence the value of the Australian Dollar. If Australia produces highly sought after exports, then its currency will gain in value purely from the surplus demand created from foreign buyers seeking to purchase its exports versus what it spends to purchase imports. Therefore, a positive net Trade Balance strengthens the AUD, with the opposite effect if the Trade Balance is negative.
-
21:45
Gold price soars above $2,700 amid weak US Dollar, falling US yields
- Gold rallies as US retail sales miss, offset by prior strong consumer spending.
- An unexpected rise in US jobless claims pressures the US Dollar and boosts Gold.
- Fed Governor Waller's dovish remarks hint at possible rate cuts in March.
Gold price surged above the $2,700 mark on Thursday as the Greenback trimmed some of its earlier gains. Data from the United States (US) revealed that the economy remains solid after the release of consumer spending figures and jobs data. US bond yields fell as traders expect further easing by the Federal Reserve (Fed). At the time of writing, the XAU/USD trades at $2,715, up 0.72%.
Bullion extended its gains as market participants prepare for US President-elect Donald Trump's inauguration. The US Census Bureau revealed that Retail Sales fell short of estimates in December. However, November’s data was upwardly revised, indicating consumer strength.
Other data showed that the number of Americans filing for unemployment insurance jumped for the first time since December 7, 2024, and weighed on the Greenback.
The US Dollar Index (DXY), which tracks the performance of the USD against a basket of six peers, slips 0.14%, down below the 109.00 figure.
Fed Governor Christopher Waller crossed the wires and was dovish, stating that the US Central Bank could lower borrowing costs sooner and faster if the disinflation process evolves.
The US economic docket will remain empty throughout the rest of the day and traders will eye housing data, particularly Building Permits and Housing Starts.
Daily digest market movers: Gold price bolstered by dovish comments, falling US yields
- Gold extended its gains as real yields dropped. Measured by the 10-year Treasury Inflation-Protected Securities (TIPS) yield, extended its losses for the second straight day, down five and a half basis points (bps) from 2.234% to 2.18%.
- The US 10-year Treasury bond yield slumps five bps, at 4.604%, a tailwind for the golden metal.
- US Retail Sales increased by 0.4% MoM in December, below estimates of 0.6%. Although the data missed the mark, an upward revision to November’s figures from 0.7% to 0.8%, showed the economy’s resilience.
- Regarding labor market data, Initial Jobless Claims for the week ending January 10 rose by 217K from 201K the previous week, missing estimates of 210K.
- The latest inflation data and Fed Waller’s comments pressured the US dollar, as traders had grown confident the US Central Bank would cut rates sooner rather than later. Waller didn’t rule out a cut in the March meeting as inflation “is getting close to what our 2% inflation target would be.”
- Chicago’s Fed Austan Goolsbee, a 2025 voter, said he feels more comfortable that the labor market is stabilizing via The Wall Street Journal.
- Market participants are pricing in near-even odds that the Fed will cut rates twice by the end of 2025 and see the first reduction in June.
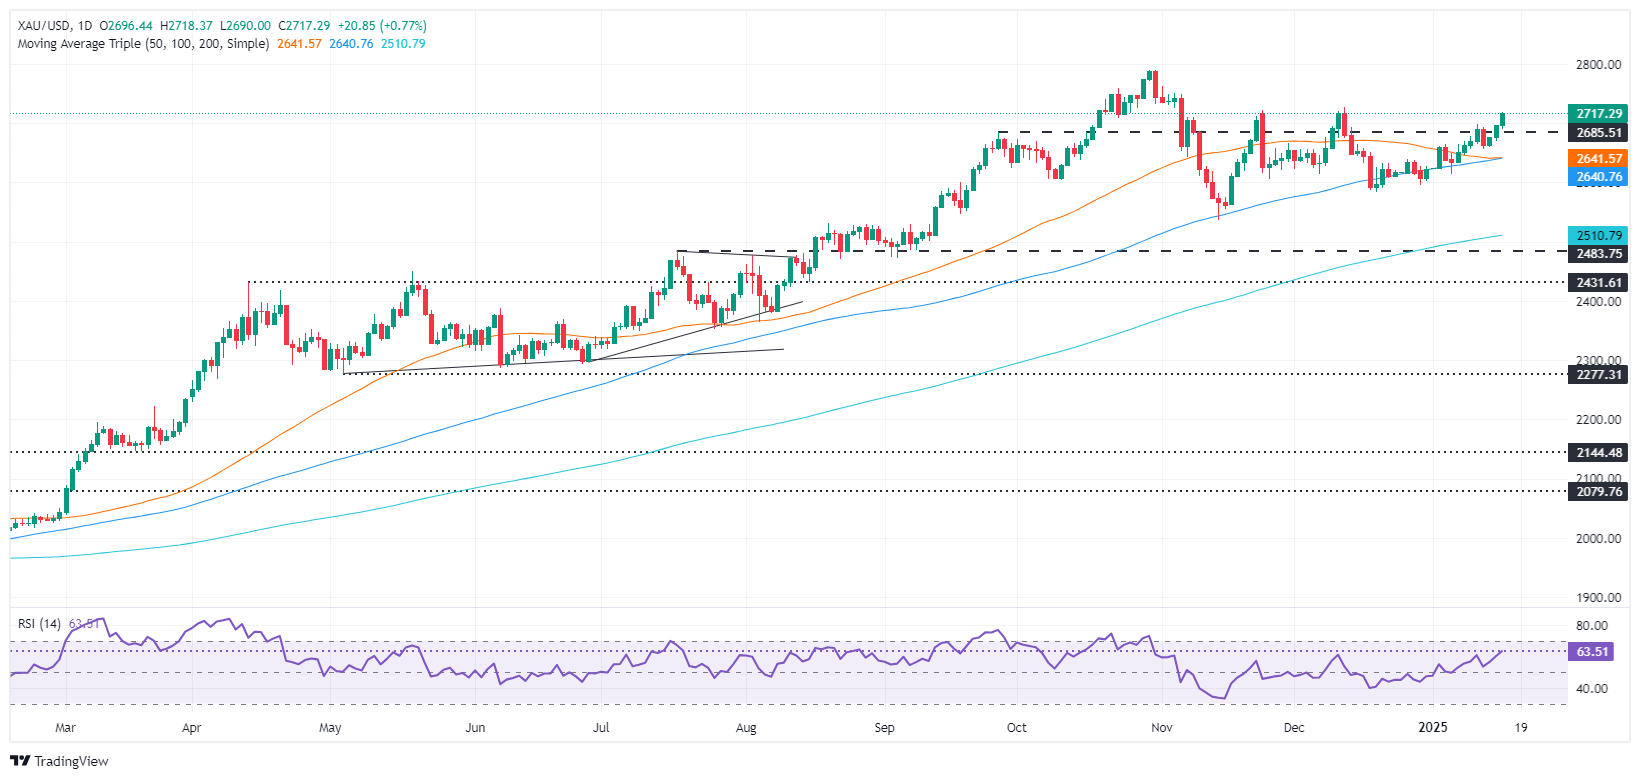
XAU/USD technical outlook: Gold buyers target $2,750 as crucial resistance ahead of ATH
Gold price uptrend extended for the third consecutive trading day, clearing key resistance at $2,700. Bullish momentum remains strong as the Relative Strength Index (RSI) depicts, giving a green light to buyers, to drive the non-yielding metal higher.
XAU/USD first resistance will be the December 12 high of $2,726. Once surpassed, the next stop would be $2,750, followed by the all-time high (ATH) at $2,790.
Conversely, XAU/USD’s drop below $2,700, would sponsor a test of the January 13 swing low of $2,656, followed by the confluence of the 50 and 100-day Simple Moving Averages (SMAs) at $2,639 - $2,642.

Gold FAQs
Gold has played a key role in human’s history as it has been widely used as a store of value and medium of exchange. Currently, apart from its shine and usage for jewelry, the precious metal is widely seen as a safe-haven asset, meaning that it is considered a good investment during turbulent times. Gold is also widely seen as a hedge against inflation and against depreciating currencies as it doesn’t rely on any specific issuer or government.
Central banks are the biggest Gold holders. In their aim to support their currencies in turbulent times, central banks tend to diversify their reserves and buy Gold to improve the perceived strength of the economy and the currency. High Gold reserves can be a source of trust for a country’s solvency. Central banks added 1,136 tonnes of Gold worth around $70 billion to their reserves in 2022, according to data from the World Gold Council. This is the highest yearly purchase since records began. Central banks from emerging economies such as China, India and Turkey are quickly increasing their Gold reserves.
Gold has an inverse correlation with the US Dollar and US Treasuries, which are both major reserve and safe-haven assets. When the Dollar depreciates, Gold tends to rise, enabling investors and central banks to diversify their assets in turbulent times. Gold is also inversely correlated with risk assets. A rally in the stock market tends to weaken Gold price, while sell-offs in riskier markets tend to favor the precious metal.
The price can move due to a wide range of factors. Geopolitical instability or fears of a deep recession can quickly make Gold price escalate due to its safe-haven status. As a yield-less asset, Gold tends to rise with lower interest rates, while higher cost of money usually weighs down on the yellow metal. Still, most moves depend on how the US Dollar (USD) behaves as the asset is priced in dollars (XAU/USD). A strong Dollar tends to keep the price of Gold controlled, whereas a weaker Dollar is likely to push Gold prices up.
-
20:45
Forex Today: Chinese data could lend support to the risk complex
The US Dollar maintained its bearish tone unchanged and extended its weekly corrective decline on the back of shrinking yields, while investors remained focused on fundamentals and the Fed’s decision in January.
Here is what you need to know on Friday, January 17:
The US Dollar Index (DXY) added to the ongoing multi-day retracement on Thursday, breaking below the 109.00 support zone once again amid further weakness in US yields across the curve. A busy docket on Friday will feature Housing Starts, Building Permits, Industrial and Manufacturing Production, as well as Net Long-term TIC Flows.
EUR/USD gave it a go to the 1.0300 region, although the move fizzled out soon afterwards, eventually ending the day with marginal gains. The EMU’s Current Account results and the final Inflation Rate will take centre stage along with the speech by the ECB’s Cipollone.
GBP/USD advanced for the fourth day in a row, managing well to keep business well above the 1.2200 yardstick. UK Retail Sales will be at the centre of the debate across the Channel at the end of the week.
Further repricing of rate hikes by the BoJ lent support to the Japanese yen and sparked a deeper retracement in USD/JPY, this time approaching the 155.00 mark. The weekly Foreign Bond Investment figures will be only due.
Surprisingly, AUD/USD traded on the defensive on Thursday, briefly breaking below the 0.6200 support despite the inconclusive Dollar and a solid jobs report in Oz. Focus should remain on the slew of Chinese data due on Friday.
Alleviating geopolitical concerns following the Israel-Hamas ceasefire weighed on crude oil prices and dragged prices of WTI to the vicinity of the $77.00 mark per barrel.
Gold prices extended further their uptick, regaining the $2,700 mark per troy ounce and beyond on the back of the Dollar’s irresolute price action and declining US yields across the board. Silver prices, in the meantime, rose to five-week highs in levels just shy of the $31.00 mark per ounce.
-
20:34
BoC's Gravelle: We expect to announce end of quantitative tightening in the first half of 2025
Bank of Canada (BoC) Deputy Governor Toni Gravelle noted on Thursday that although the BoC is expected to draw down its quantitative tightening program in 2025, the Canadian central bank won't be immediately pivoting into a similar quantitative easing structure like it has done in recent years.
Key highlights
We will need to restart our normal-course asset purchases gradually, and well before September.
We expect to announce end of quantitative tightening in the first half of 2025.
We will not be buying assets on an active basis to stimulate the economy like we did with QE during the pandemic.
We will not be ending QT out of any concern about functioning of repo markets; we think other factors are causing these pressures.
We will hold not only government of Canada bonds but also GOC T-bills and term repos; may not hit desired composition of assets till around 2030.
We will probably adjust our estimated range from time to time, possibly both up and down.
T-bill purchases will take place in the primary market and we expect them to resume in Q4 this year, initially with relatively small amounts.
While QT is almost finished, the composition of our asset holdings won't be back to normal for quite some time.
A Trump tariff on exports would have a big negative impact on economic growth.
There would likely be an inflation impact at the same time that we have a slowdown in the economy. So that puts a central bank in a very complicated space.
-
19:57
Canadian Dollar runs out of gas, falls back once more
- The Canadian Dollar backslid around 0.4% against the Greenback on Thursday.
- A lack of meaningful data from Canada leaves the Loonie in the lurch.
- USD/CAD continues to consolidate as markets await shifts in rate stances.
The Canadian Dollar fell back around four-tenths of one percent on Thursday, dipping against the Greenback and falling back into familiar congestion territory near multi-year lows. Canadian data remains impactful as Loonie traders await meaningful releases, and wobbly US data on Thursday kept market flows with one foot in the US Dollar.
Canada saw slightly fewer Housing Starts in December, and US Retail Sales also eased, causing US Business Inventories to rise slightly. US Initial Jobless Claims also came in slightly higher than expected, but still well within recent norms.
Daily digest market movers: CAD falls back into congestion as data fails to spark moves
- The Canadian Dollar lost 0.4% against the Greenback, pushing USD/CAD back toward the 1.4400 handle.
- Crude Oil prices fell on Thursday, driven down as Houthis are expected to suspend attacks on shipping containers soon.
- Declines in barrel prices could be pushing the Loonie lower as CAD markets struggle to find headlines to chew on.
- The trading week will end with a whimper rather than a bang, with no impactful American session data on the economic docket for the remainder of the week.
- Canadian Consumer Price Index (CPI) inflation figures loom ahead next week.
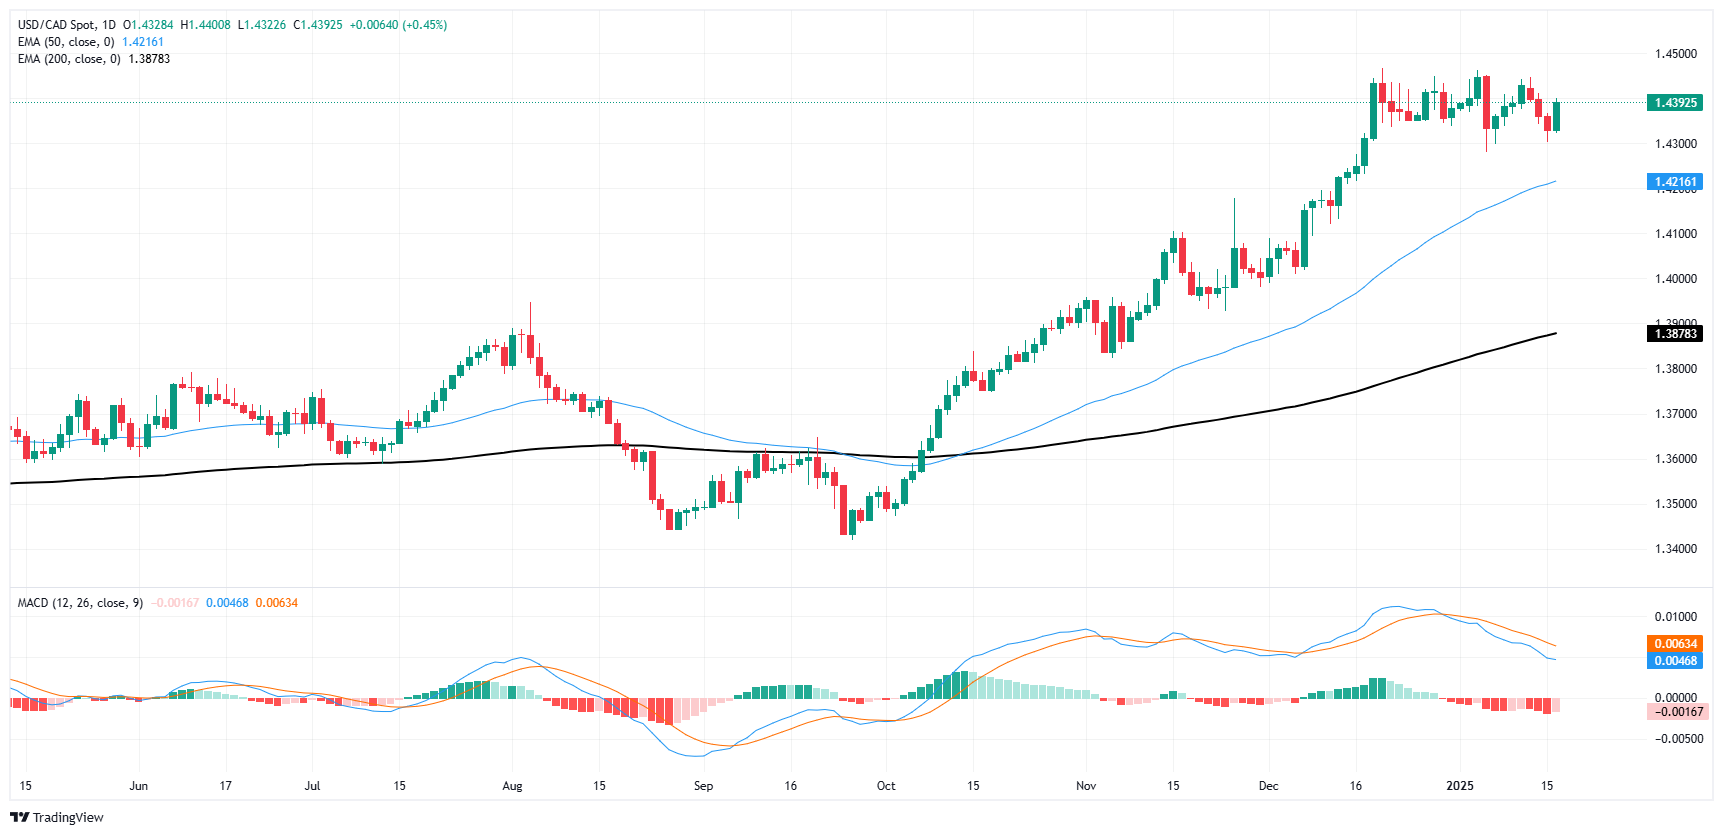
Canadian Dollar price forecast
USD/CAD continues to churn around the 1.4400 handle, as the Loonie remains unable to gather enough momentum and break out of a rough consolidation zone that has plagued the pair for the better part of a month. Excluding the pandemic era of global Greenback dominance, USD/CAD is trading into its highest bids since 2016.
USD/CAD daily chart
Canadian Dollar FAQs
The key factors driving the Canadian Dollar (CAD) are the level of interest rates set by the Bank of Canada (BoC), the price of Oil, Canada’s largest export, the health of its economy, inflation and the Trade Balance, which is the difference between the value of Canada’s exports versus its imports. Other factors include market sentiment – whether investors are taking on more risky assets (risk-on) or seeking safe-havens (risk-off) – with risk-on being CAD-positive. As its largest trading partner, the health of the US economy is also a key factor influencing the Canadian Dollar.
The Bank of Canada (BoC) has a significant influence on the Canadian Dollar by setting the level of interest rates that banks can lend to one another. This influences the level of interest rates for everyone. The main goal of the BoC is to maintain inflation at 1-3% by adjusting interest rates up or down. Relatively higher interest rates tend to be positive for the CAD. The Bank of Canada can also use quantitative easing and tightening to influence credit conditions, with the former CAD-negative and the latter CAD-positive.
The price of Oil is a key factor impacting the value of the Canadian Dollar. Petroleum is Canada’s biggest export, so Oil price tends to have an immediate impact on the CAD value. Generally, if Oil price rises CAD also goes up, as aggregate demand for the currency increases. The opposite is the case if the price of Oil falls. Higher Oil prices also tend to result in a greater likelihood of a positive Trade Balance, which is also supportive of the CAD.
While inflation had always traditionally been thought of as a negative factor for a currency since it lowers the value of money, the opposite has actually been the case in modern times with the relaxation of cross-border capital controls. Higher inflation tends to lead central banks to put up interest rates which attracts more capital inflows from global investors seeking a lucrative place to keep their money. This increases demand for the local currency, which in Canada’s case is the Canadian Dollar.
Macroeconomic data releases gauge the health of the economy and can have an impact on the Canadian Dollar. Indicators such as GDP, Manufacturing and Services PMIs, employment, and consumer sentiment surveys can all influence the direction of the CAD. A strong economy is good for the Canadian Dollar. Not only does it attract more foreign investment but it may encourage the Bank of Canada to put up interest rates, leading to a stronger currency. If economic data is weak, however, the CAD is likely to fall.
-
19:28
US Dollar lost ground after fresh data, yields continue their slide
- US Retail Sales from December underperformed, weekly Initial Jobless Claims rose.
- Traders monitor President-elect Trump’s policies and potential tariff shifts, adding uncertainty to the global economic picture.
- Mixed data releases prompt investors to reassess near-term rate expectations, but the Greenback’s longer-range trajectory remains constructive.
The US Dollar Index (DXY), which tracks the Greenback’s value against six major currencies, extended its correction around the 109.00 level on Thursday. This week’s subpar performance stems primarily from declining US Treasury yields, which undermined the Greenback’s appeal mainly due to soft data from December.
Daily digest market movers: USD remains soft after mid-tier data
- December Retail Sales underperformed slightly, rising just 0.4% instead of the anticipated 0.6%. Meanwhile, November’s result got revised from 0.7% to 0.8%.
- Weekly Initial Jobless Claims for mid-January came in at 217K, a marked increase relative to the prior revised 203K figure.
- Philadelphia Fed Manufacturing Survey surprised to the upside at 44.3, improving from the previous -16.4 (subsequently revised to -10.9), and well above the anticipated -5.0.
- NAHB Housing Market Index for January is projected at 45, slightly down from 46, signaling modest headwinds in the housing sector.
- Equity markets slipped on Thursday as traders locked in profits related to softer inflation plays from Wednesday.
- Fed expectations remain anchored by CME FedWatch Tool data, indicating a 97.3% likelihood of unchanged policy at this month’s meeting.
- Benchmark yields dipped with the 10-year Treasury note retreating to around 4.65%, down from its 4.80% peak on Tuesday.
DXY technical outlook: Brief respite but overall picture still leans bullish
The US Dollar Index remains under pressure below 109.00 after this week’s yield-driven retreat. Profit-taking has contributed to recent losses, but the longer-term outlook stays favorable as the DXY hovers near multi-year peaks.
Significantly, the 20-day Simple Moving Average (SMA) rejected deeper selling and stands as a robust support line for bullish traders. While near-term pullbacks are possible, especially if more US data surprises to the downside, the Greenback’s overarching uptrend could quickly reassert itself as markets weigh persistent inflation and the Fed’s gradual policy approach.
US Dollar FAQs
The US Dollar (USD) is the official currency of the United States of America, and the ‘de facto’ currency of a significant number of other countries where it is found in circulation alongside local notes. It is the most heavily traded currency in the world, accounting for over 88% of all global foreign exchange turnover, or an average of $6.6 trillion in transactions per day, according to data from 2022. Following the second world war, the USD took over from the British Pound as the world’s reserve currency. For most of its history, the US Dollar was backed by Gold, until the Bretton Woods Agreement in 1971 when the Gold Standard went away.
The most important single factor impacting on the value of the US Dollar is monetary policy, which is shaped by the Federal Reserve (Fed). The Fed has two mandates: to achieve price stability (control inflation) and foster full employment. Its primary tool to achieve these two goals is by adjusting interest rates. When prices are rising too quickly and inflation is above the Fed’s 2% target, the Fed will raise rates, which helps the USD value. When inflation falls below 2% or the Unemployment Rate is too high, the Fed may lower interest rates, which weighs on the Greenback.
In extreme situations, the Federal Reserve can also print more Dollars and enact quantitative easing (QE). QE is the process by which the Fed substantially increases the flow of credit in a stuck financial system. It is a non-standard policy measure used when credit has dried up because banks will not lend to each other (out of the fear of counterparty default). It is a last resort when simply lowering interest rates is unlikely to achieve the necessary result. It was the Fed’s weapon of choice to combat the credit crunch that occurred during the Great Financial Crisis in 2008. It involves the Fed printing more Dollars and using them to buy US government bonds predominantly from financial institutions. QE usually leads to a weaker US Dollar.
Quantitative tightening (QT) is the reverse process whereby the Federal Reserve stops buying bonds from financial institutions and does not reinvest the principal from the bonds it holds maturing in new purchases. It is usually positive for the US Dollar.
-
18:25
Mexican Peso plunges to three-day low ahead of Trump’s inauguration
- Mexican Peso weakens amid US economic data releases and upcoming political events.
- Mexico's Gross Fixed Investment shows a slight October improvement, still below past highs.
- Fed Governor Waller suggests more aggressive rate cuts may depend on future economic data.
The Mexican Peso (MXN) tumbled to a three-day low against the US Dollar (USD) as traders digested economic data released in the United States (US) and as financial markets prepared for US President-elect Donald Trump’s inauguration next week. The USD/MXN trades at 20.80, gaining over 1.30%.
Mexico’s economic docket in the week revealed that Gross Fixed Investment improved in October, coming at 0.1% MoM, up from a contraction of 0.7% in November’s data. Yet the figures reported by the Instituto Nacional de Estadistica Geografia e Informatica (INEGI) remained anemic against double-digit figures revealed in April 2024.
In the US, December Retail Sales revealed by the US Census Bureau remained solid despite missing projections, yet an upward revision to November figures indicates the economy remains healthy.
Meanwhile, Federal Reserve (Fed) Governor Christopher Waller was dovish during an interview with CNBC, stating that the US Central Bank may cut rates sooner and faster than projected if data warrants it.
Ahead this week, Mexico’s economic docket remains absent, with investors awaiting next week's inflation data alongside Retail Sales. In the US, the schedule will feature housing data.
Daily digest market movers: Mexican Peso pressured by speculation on Trump’s policies
- The Mexican Peso will remain pressured the closer we get to Trump’s inauguration, as there are fears that he will impose tariffs and a harsh immigration policy.
- Additionally, the divergence between the Banco de Mexico (Banxico) and the Fed favors further upside in the USD/MXN, as the interest rate differential would reduce by 150 bps.
- According to the latest Citi private economists survey, Banxico is expected to cut rates by 200 basis points in 2025. The Fed projected to cut 50 bps, according to the latest Summary of Economic Projections (SEP).
- US Retail Sales for December rose by 0.4% Month over Month, missing the mark. However, an upward revision of November figures to 0.8% showed the economy remains robust.
- Initial Jobless Claims for the week ending January 10 increased by 217K from 203K the previous week, missing estimates of 210K.
- Money market futures had priced in 40 bps of Fed rate cuts in 2025, according to CME FedWatch Tool data.
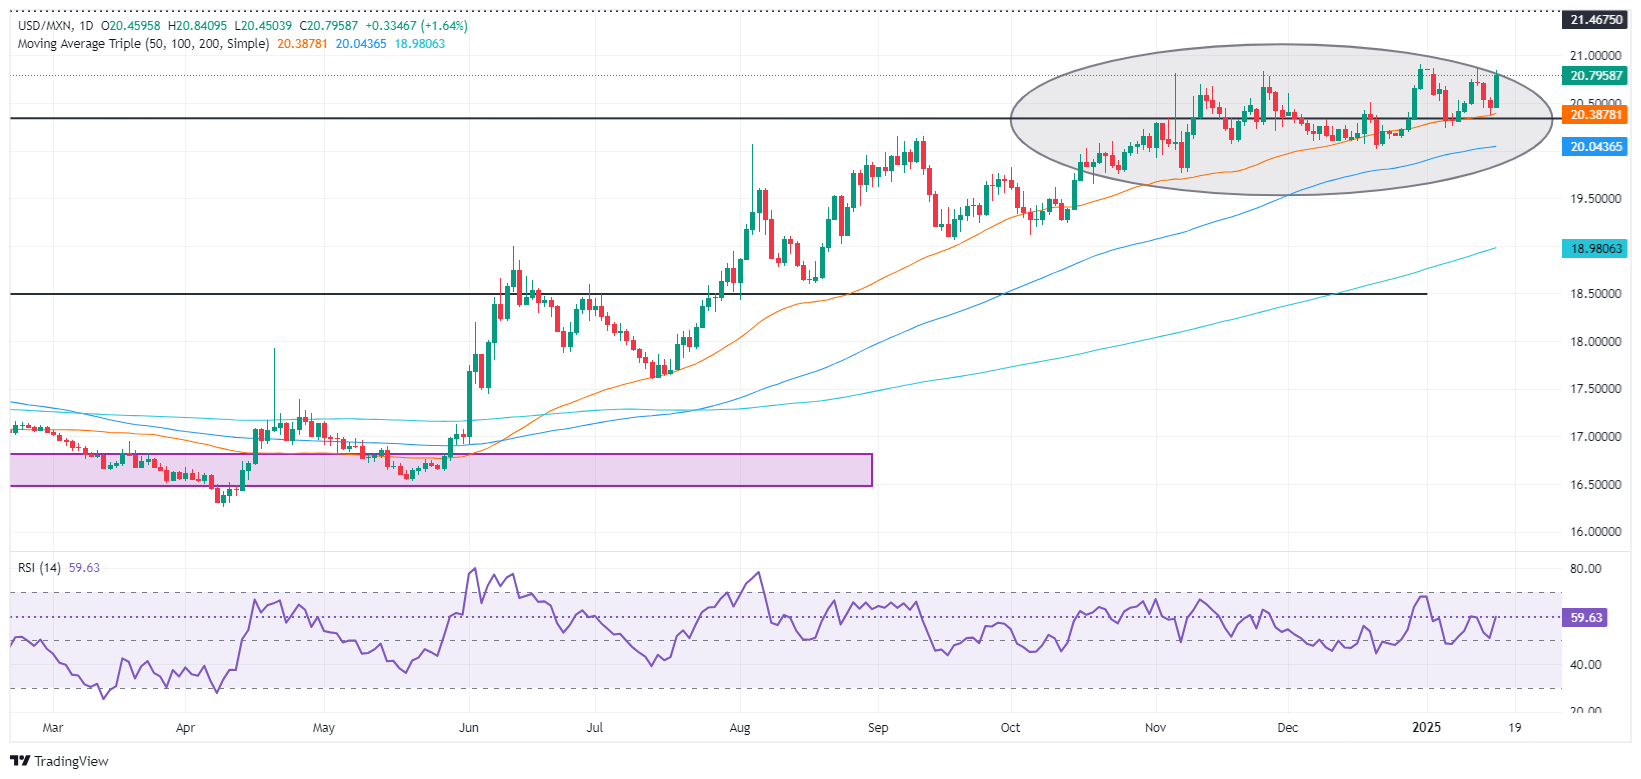
USD/MXN technical outlook: Mexican Peso plummets as USD/MXN climbs above 20.80
On Thursday, the exotic pair resumed its uptrend, with traders eyeing the year-to-date (YTD) peak at 20.90. At the time of writing, the USD/MXN faces strong resistance at 20.86, the January 13 high, ahead of the latter. An additional upside is seen, once those levels are cleared, with the next key resistance levels emerging at 21.46, the March 8, 2022 peak, followed by 21.50 and the 22.00 psychological level.
On the other hand, if USD/MXN clears the 50-day Simple Moving Average (SMA) at 20.34, this will expose the 100-day SMA at 20.00, followed by the October 18 swing low of 19.64.
Mexican Peso FAQs
The Mexican Peso (MXN) is the most traded currency among its Latin American peers. Its value is broadly determined by the performance of the Mexican economy, the country’s central bank’s policy, the amount of foreign investment in the country and even the levels of remittances sent by Mexicans who live abroad, particularly in the United States. Geopolitical trends can also move MXN: for example, the process of nearshoring – or the decision by some firms to relocate manufacturing capacity and supply chains closer to their home countries – is also seen as a catalyst for the Mexican currency as the country is considered a key manufacturing hub in the American continent. Another catalyst for MXN is Oil prices as Mexico is a key exporter of the commodity.
The main objective of Mexico’s central bank, also known as Banxico, is to maintain inflation at low and stable levels (at or close to its target of 3%, the midpoint in a tolerance band of between 2% and 4%). To this end, the bank sets an appropriate level of interest rates. When inflation is too high, Banxico will attempt to tame it by raising interest rates, making it more expensive for households and businesses to borrow money, thus cooling demand and the overall economy. Higher interest rates are generally positive for the Mexican Peso (MXN) as they lead to higher yields, making the country a more attractive place for investors. On the contrary, lower interest rates tend to weaken MXN.
Macroeconomic data releases are key to assess the state of the economy and can have an impact on the Mexican Peso (MXN) valuation. A strong Mexican economy, based on high economic growth, low unemployment and high confidence is good for MXN. Not only does it attract more foreign investment but it may encourage the Bank of Mexico (Banxico) to increase interest rates, particularly if this strength comes together with elevated inflation. However, if economic data is weak, MXN is likely to depreciate.
As an emerging-market currency, the Mexican Peso (MXN) tends to strive during risk-on periods, or when investors perceive that broader market risks are low and thus are eager to engage with investments that carry a higher risk. Conversely, MXN tends to weaken at times of market turbulence or economic uncertainty as investors tend to sell higher-risk assets and flee to the more-stable safe havens.
-
18:16
Dow Jones Industrial Average turns tepid on Thursday
- The Dow Jones is holding near key moving averages on Thursday.
- Markets were largely unimpressed with US Retail Sales figures.
- Investors continue to hinge their exposure on Fed rate cut expectations.
The Dow Jones Industrial Average (DJIA) struck a middling tone on Thursday, churning around the 43,200 handle. Price action is hung up on the 50-day Exponential Moving Average (EMA), and investors await any sign of data that could signal a faster pace of rate cuts from the Federal Reserve (Fed).
Retail Sales figures moderated in December, easing back to 0.4% MoM in the headline figure. Markets expected a tick down to 0.6% from the previous month’s revised 0.8%. Core Retail Sales excluding automotive expenditures rose to 0.4% MoM from 0.2%, meeting median analyst forecasts. The mixed figures failed to spark significant changes in investor sentiment in either direction, and bidding action is muddling through a largely non-starter of a day for equities.
Despite overall middling action in equity markets, things are moving behind the scenes as traders jostle for position based on Fed rate cut expectations. Treasuries pulled back sharply earlier this week, and according to the CME’s FedWatch Tool, rate markets are now pricing in slightly more than even odds of the Fed delivering another quarter-point rate cut on May 7, a step closer than the previous middle ground of June 18.
Dow Jones news
The Dow Jones is taking a bit of a breather after a three-day bull run that saw the major equity index recover nearly 4% after kicking off the trading week near its lowest bids since October. The majority of the Dow’s listed equities are testing into the green on Thursday, but concentrated losses in key stocks are hobbling the average’s overall performance.
UnitedHealth Group (UNH) tumbled 4.5%, falling below $520 per share after the major health sector player missed analyst revenue expectations, reporting fourth-quarter income of $100.8 billion dollars, growing by 6.8% YoY. Wall Street expected at least %101.6 billion in revenue in Q4.
Apple (AAPL) is also shedding weight on the day, falling 3% and declining to $230 per share after it was revealed the tech megagiant is losing market share in Asian consumer arenas as upstart competitors take advantage of localized government subsidies. Apple still remains the preeminent name to beat in the smartphone market, but it lost market share in mainland China for the first time since 2023 even as overall consumer demand in the region saw growth for the first time in two years.
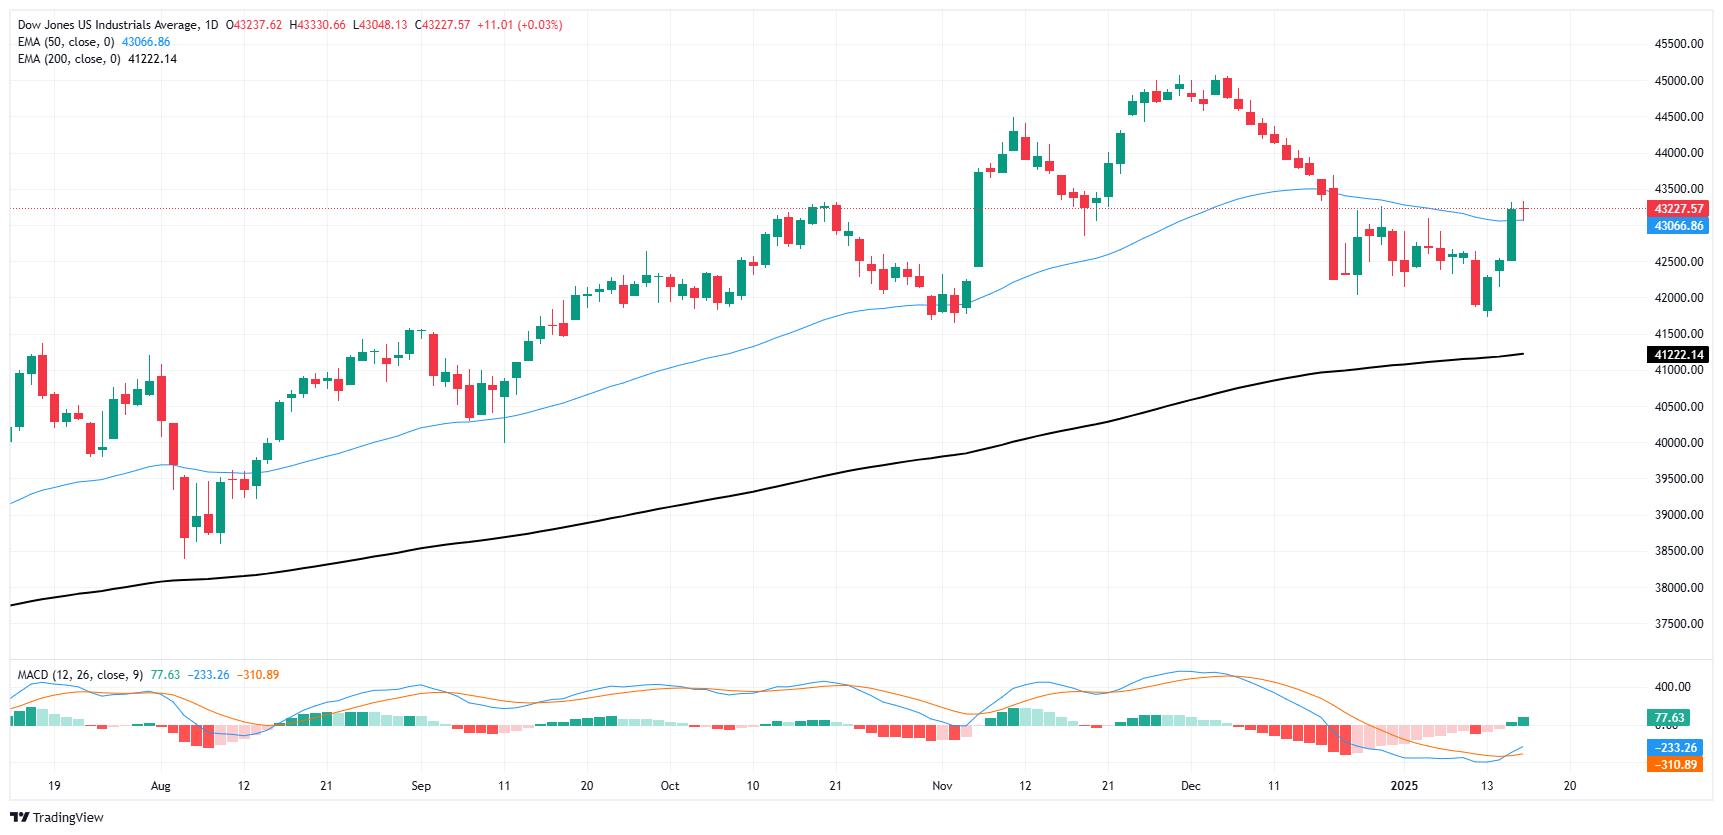
Dow Jones price forecast
Investors continue to bolster the Dow Jones back into the high end, determined to keep price action bolstered north of the 50-day EMA near 43,000. The Dow is testing the waters near 43,200 as major price levels rotate to provide technical support through intraday chart action.
Despite a near-term turnaround, bulls are showing some signs of exhaustion, and the Dow Jones remains down nearly 4% from record highs set back in November. DJIA is still running well north of its 200-day EMA which is climbing above 41,000, but a deepening pattern of swing lows may imply that the race could be coming to an end.
Dow Jones daily chart
Dow Jones FAQs
The Dow Jones Industrial Average, one of the oldest stock market indices in the world, is compiled of the 30 most traded stocks in the US. The index is price-weighted rather than weighted by capitalization. It is calculated by summing the prices of the constituent stocks and dividing them by a factor, currently 0.152. The index was founded by Charles Dow, who also founded the Wall Street Journal. In later years it has been criticized for not being broadly representative enough because it only tracks 30 conglomerates, unlike broader indices such as the S&P 500.
Many different factors drive the Dow Jones Industrial Average (DJIA). The aggregate performance of the component companies revealed in quarterly company earnings reports is the main one. US and global macroeconomic data also contributes as it impacts on investor sentiment. The level of interest rates, set by the Federal Reserve (Fed), also influences the DJIA as it affects the cost of credit, on which many corporations are heavily reliant. Therefore, inflation can be a major driver as well as other metrics which impact the Fed decisions.
Dow Theory is a method for identifying the primary trend of the stock market developed by Charles Dow. A key step is to compare the direction of the Dow Jones Industrial Average (DJIA) and the Dow Jones Transportation Average (DJTA) and only follow trends where both are moving in the same direction. Volume is a confirmatory criteria. The theory uses elements of peak and trough analysis. Dow’s theory posits three trend phases: accumulation, when smart money starts buying or selling; public participation, when the wider public joins in; and distribution, when the smart money exits.
There are a number of ways to trade the DJIA. One is to use ETFs which allow investors to trade the DJIA as a single security, rather than having to buy shares in all 30 constituent companies. A leading example is the SPDR Dow Jones Industrial Average ETF (DIA). DJIA futures contracts enable traders to speculate on the future value of the index and Options provide the right, but not the obligation, to buy or sell the index at a predetermined price in the future. Mutual funds enable investors to buy a share of a diversified portfolio of DJIA stocks thus providing exposure to the overall index.
-
17:32
United States 4-Week Bill Auction fell from previous 4.245% to 4.24%
-
17:15
EUR/USD Price Analysis: 20-day SMA failures weigh on upside attempts
- EUR/USD slips 0.23% on Thursday, trading near 1.0270 after losing momentum from a brief uptick.
- MACD histogram shows rising green bars, hinting at modest buyer interest despite broad headwinds.
- RSI stands at 43 in negative territory, suggesting only a mild rebound within a prevailing bearish environment.
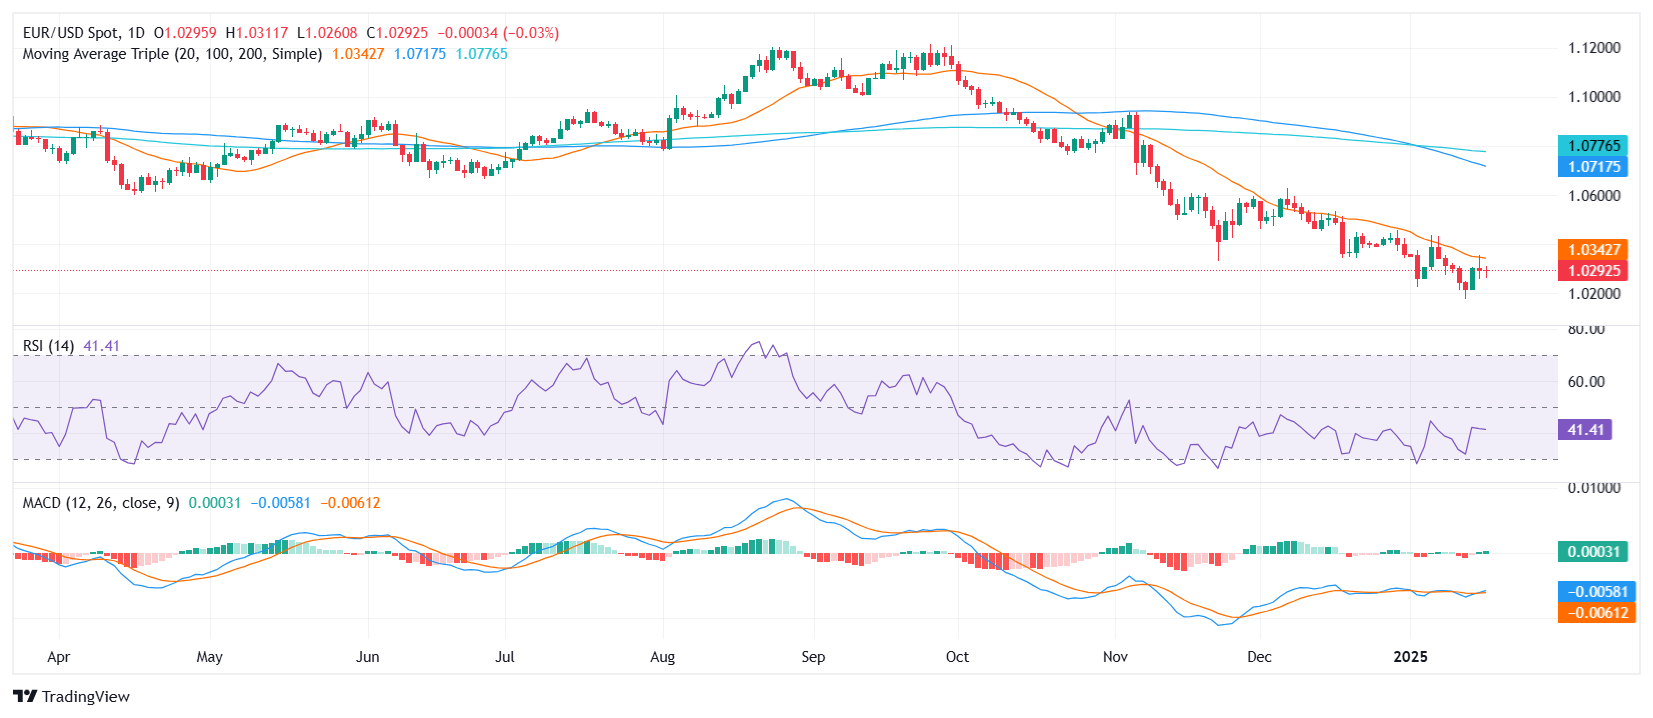
The EUR/USD pair found some footing on Thursday but still retreated by 0.23% to hover around 1.0270. Although buyers tried to push prices higher in early trade, their efforts were undermined by the failure to sustain a break above the 20-day Simple Moving Average (SMA). This inability to clear key technical barriers highlights the pair’s fragile recovery prospects.
On the technical side, the Moving Average Convergence Divergence (MACD) indicator continues to display rising green bars, indicating that buying pressure has not completely faded. Yet, the Relative Strength Index (RSI), currently at 43, remains in negative territory despite its recent climb, emphasizing the cautious tone surrounding the euro. Unless the pair can overcome persistent resistance around the 20-day SMA, bullish enthusiasm is likely to remain muted.
Looking toward possible inflection points, initial support appears near 1.0250, with a drop below that threshold opening the door to the 1.0220 region. Conversely, a decisive push above the 1.0300 handle would be required for buyers to gain meaningful momentum, potentially setting the stage for a challenge of the 1.0350 barrier if sentiment improves further.
EUR/USD daily chart
-
16:30
United States EIA Natural Gas Storage Change above expectations (-260B) in January 10: Actual (-258B)
-
16:00
United States Business Inventories meets forecasts (0.1%) in November
-
16:00
United States NAHB Housing Market Index above expectations (45) in January: Actual (47)
-
15:47
USD/CAD jumps to near 1.4400 as US Dollar rises ahead of Trump’s inauguration
- USD/CAD rises to near 1.4400 as the US Dollar gains amid uncertainty over US Trump’s return to the White House.
- The US Dollar rises despite weak US Retail Sales for December and a sharp growth in Initial Jobless Claims.
- Investors expect the BoC to slow down the pace of winding up policy restrictiveness.
The USD/CAD pair climbs to near the key resistance of 1.4400 in Thursday’s North American session. The Loonie pair strengthens as the US Dollar (USD) recovers Wednesday’s losses, with investors turning cautious ahead of President-elect Donald Trump’s swearing ceremony on January 20.
The US Dollar Index (DXY), which tracks the Greenback’s value against six major currencies, rises to near 109.25. The safe-haven appeal of the US Dollar has improved as investors expect that Trump will provide an updated tariff plan soon after returning to the White House. This scenario will boost economic growth and inflationary pressures in the United States (US), which would force the Federal Reserve (Fed) to follow a more gradual policy-easing approach.
Meanwhile, traders have accelerated Fed dovish bets after the release of the US Consumer Price Index (CPI) data for December. The data showed that the annual core reading grew at a slower pace of 3.2% than estimates and the prior release of 3.3%. Also, month-on-month core CPI rose expectedly by 0.2%, slower than the previous release of 0.3%.
In Thursday’s session, the US Initial Jobless Claims data for the week ending January 10 came in higher than projected. Individuals claiming jobless benefits for the first time came in higher at 217K than estimates of 210K and the former release of 203K. The US Retail Sales data for December grew moderately by 0.4%, compared to estimates of 0.6% and November's reading of 0.8%.
The Canadian Dollar (CAD) performs weakly as investors expect the Bank of Canada (BoC) to continue reducing interest rates. However, market participants expect the BoC to slow down the pace of dialing back policy restrictiveness as the recent labor market data for December remained upbeat. The Canadian economy added 90.9K workers in December, compared to 50.5K in November.
Canadian Dollar FAQs
The key factors driving the Canadian Dollar (CAD) are the level of interest rates set by the Bank of Canada (BoC), the price of Oil, Canada’s largest export, the health of its economy, inflation and the Trade Balance, which is the difference between the value of Canada’s exports versus its imports. Other factors include market sentiment – whether investors are taking on more risky assets (risk-on) or seeking safe-havens (risk-off) – with risk-on being CAD-positive. As its largest trading partner, the health of the US economy is also a key factor influencing the Canadian Dollar.
The Bank of Canada (BoC) has a significant influence on the Canadian Dollar by setting the level of interest rates that banks can lend to one another. This influences the level of interest rates for everyone. The main goal of the BoC is to maintain inflation at 1-3% by adjusting interest rates up or down. Relatively higher interest rates tend to be positive for the CAD. The Bank of Canada can also use quantitative easing and tightening to influence credit conditions, with the former CAD-negative and the latter CAD-positive.
The price of Oil is a key factor impacting the value of the Canadian Dollar. Petroleum is Canada’s biggest export, so Oil price tends to have an immediate impact on the CAD value. Generally, if Oil price rises CAD also goes up, as aggregate demand for the currency increases. The opposite is the case if the price of Oil falls. Higher Oil prices also tend to result in a greater likelihood of a positive Trade Balance, which is also supportive of the CAD.
While inflation had always traditionally been thought of as a negative factor for a currency since it lowers the value of money, the opposite has actually been the case in modern times with the relaxation of cross-border capital controls. Higher inflation tends to lead central banks to put up interest rates which attracts more capital inflows from global investors seeking a lucrative place to keep their money. This increases demand for the local currency, which in Canada’s case is the Canadian Dollar.
Macroeconomic data releases gauge the health of the economy and can have an impact on the Canadian Dollar. Indicators such as GDP, Manufacturing and Services PMIs, employment, and consumer sentiment surveys can all influence the direction of the CAD. A strong economy is good for the Canadian Dollar. Not only does it attract more foreign investment but it may encourage the Bank of Canada to put up interest rates, leading to a stronger currency. If economic data is weak, however, the CAD is likely to fall.
-
15:44
Gold Price Forecast: XAU/USD rallies to one-month peak above $2,700
- Gold rallies as U.S. Treasury yields dip after rising unemployment claims and strong consumer spending.
- Retail sales up 0.4% MoM in December, November's figures revised up to 0.8%.
- Expectations for 2025 Fed rate cuts grow, with two reductions anticipated by year-end.
Gold soared after economic data from the United States (US) showed that consumer spending remained solid, while the number of people filing for unemployment benefits rose. This weighed on US Treasury yields and boosted the precious metal, which traded above the $2,700 figure for the first time since December last year.
Gold ascends to new highs, surpassed $2,700 as trades eye further Fed rate cuts
The yellow metal and the Greenback are trending up after Retail Sales for December rose by 0.4% MoM, missing the mark, but an upward revision of November figures to 0.8% showed the economy remains robust. On the negative front, Initial Jobless Claims for the week ending January 11 increased by 217K from 201K in the previous week, missing estimates of 210K.
Even though Retail Sales were solid and the US Treasury yield remained firm, Bullion buyers remained in charge, driving prices higher. Wednesday’s US inflation figures increased the chances that the Federal Reserve (Fed) will further ease policy in 2025.
Market participants are pricing in near-even odds that the Fed would cut rates twice by the end of 2025 and see the first reduction in June.
Recent Fed speaking has shown that officials remained concerned about the upcoming Trump administration's policies, some of which, like applying tariffs, are inflation-prone.
Ahead this week the economic docket will feature housing data and the release of US Industrial Production data.
XAU/USD Price Forecast: Technical outlook
Gold’s uptrend is set to continue, but buyers will face key resistance at $2,726, the December 12 high. A breach of the latter will expose $2,750 and the record high of $2,790. Conversely, if XAU/USD slips below $2,700, a pullback is seen toward the January 13 swing low of $2,656.
Momentum favors further upside, as the Relative Strength Index (RSI) depicts.
Gold FAQs
Gold has played a key role in human’s history as it has been widely used as a store of value and medium of exchange. Currently, apart from its shine and usage for jewelry, the precious metal is widely seen as a safe-haven asset, meaning that it is considered a good investment during turbulent times. Gold is also widely seen as a hedge against inflation and against depreciating currencies as it doesn’t rely on any specific issuer or government.
Central banks are the biggest Gold holders. In their aim to support their currencies in turbulent times, central banks tend to diversify their reserves and buy Gold to improve the perceived strength of the economy and the currency. High Gold reserves can be a source of trust for a country’s solvency. Central banks added 1,136 tonnes of Gold worth around $70 billion to their reserves in 2022, according to data from the World Gold Council. This is the highest yearly purchase since records began. Central banks from emerging economies such as China, India and Turkey are quickly increasing their Gold reserves.
Gold has an inverse correlation with the US Dollar and US Treasuries, which are both major reserve and safe-haven assets. When the Dollar depreciates, Gold tends to rise, enabling investors and central banks to diversify their assets in turbulent times. Gold is also inversely correlated with risk assets. A rally in the stock market tends to weaken Gold price, while sell-offs in riskier markets tend to favor the precious metal.
The price can move due to a wide range of factors. Geopolitical instability or fears of a deep recession can quickly make Gold price escalate due to its safe-haven status. As a yield-less asset, Gold tends to rise with lower interest rates, while higher cost of money usually weighs down on the yellow metal. Still, most moves depend on how the US Dollar (USD) behaves as the asset is priced in dollars (XAU/USD). A strong Dollar tends to keep the price of Gold controlled, whereas a weaker Dollar is likely to push Gold prices up.
-
14:45
US: Initial Jobless Claims rose to 217K last week
- Initial Jobless Claims surpassed consensus and increased to 217K.
- Continuing Jobless Claims climbed to 1.859M in the week ending January 3.
US citizens filing new applications for unemployment insurance rose to 217K for the week ending January 10, as reported by the US Department of Labor (DoL) on Thursday. This print missed initial estimates and was higher than the previous week's tally of 203K (revised from 201K).
The report also highlighted a seasonally adjusted insured unemployment rate of 1.2%, while the four-week moving average retreated to 212.75K, marking a decrease of 750 from the prior week’s revised average.
Moreover, Continuing Jobless Claims went down by 18K to reach 1.859M for the week ending January 3.
Market reaction
The Greenback maintains the bullish bias in the low-109.00s when tracked by the US Dollar Index (DXY) amid the broad-based recovery in US yields.
-
14:41
US Retail Sales expanded 0.4% MoM in December
- US Retail Sales rose less than expected in the last month of 2024.
- The US Dollar reverses the weekly pullback and advances modestly.
US Retail Sales climbed by 0.4% in December, reaching $729.2 billion, according to the US Census Bureau's report on Thursday. This figure was lower than November’s 0.8% increase and came in short of market expectations of a 0.6% rise.
In addition, Retail Sales excluding Autos rose 0.4% during the same period, matching consensus and surpassing the previous 0.2% growth.
According to the report, “Total sales for the 12 months of 2024 were up 3.0% from 2023. Total sales for the October 2024 through December 2024 period were up 3.7% from the same period a year ago. The October 2024 to November 2024 percent change was revised from up 0.7% to up 0.8%.”
-
14:37
GBP eases after November GDP disappoints – Scotiabank
The Pound Sterling (GBP) quickly gave back yesterday’s gains made on the better-than expected CPI data and has slipped a bit more today after November GDP disappointed, rising 0.1% M/M, versus 0.2% expected, on weaker industrial activity, Scotiabank’s Chief FX Strategist Shaun Osborne notes, Scotiabank’s Chief FX Strategist Shaun Osborne notes.
Cable is testing minor support around 1.22
“Swaps reflect 23bps or so of easing anticipated for the February 6th policy decision now after BoE MPC member Taylor yesterday gave a little additional nudge to strengthening expectations of a cut by suggesting that the central bank may need to speed up easing this year in order to prevent a hard landing.”
“The GBP’s three-day rise from the 1.21 area has stalled and there is some risk that the rebound merely represented a mild correction in the downtrend ahead of renewed weakness. Cable is testing minor support around 1.22 as our session gets underway; weakness through here suggests a retest of 1.21—or lower—may follow. Resistance is 1.2310/20.”
-
14:33
EUR holds in tight, flat trading range – Scotiabank
The Euro (EUR) is little changed on the session, Scotiabank’s Chief FX Strategist Shaun Osborne notes.
Eurozone trade surplus grows
“The Eurozone’s November trade balance widened to EUR12.9bn in November, a larger surplus than forecast. Data showed a 1.6% increase in export growth to the US over the year and a near 7% drop in imports.”
“The bilateral surplus widened significantly (17%) from November 2023. These are trends that the incoming US president is likely to focus on.”
“The EUR has drifted sideways over the past few hours after peaking around 1.0350 yesterday. The solid, bull reversal from the 1.02 area noted earlier in the week remains intact but the rebound has stalled and the broader downtrend persists. A push above 1.0350 is needed to support a deeper rebound now. Support is 1.0180/00.”
-
14:31
United States Import Price Index (YoY) rose from previous 1.3% to 2.2% in December
-
14:30
United States Retail Sales (MoM) below forecasts (0.6%) in December: Actual (0.4%)
-
14:30
United States Export Price Index (YoY) rose from previous 0.8% to 1.8% in December
-
14:30
United States Continuing Jobless Claims came in at 1.859M below forecasts (1.87M) in January 3
-
14:30
United States Philadelphia Fed Manufacturing Survey above forecasts (-5) in January: Actual (44.3)
-
14:30
United States Retail Sales (YoY) up to 3.9% in December from previous 3.8%
-
14:30
United States Retail Sales Control Group up to 0.7% in December from previous 0.4%
-
14:30
United States Retail Sales ex Autos (MoM) meets expectations (0.4%) in December
-
14:30
United States Initial Jobless Claims 4-week average fell from previous 213K to 212.75K in January 10
-
14:30
United States Initial Jobless Claims registered at 217K above expectations (210K) in January 10
-
14:30
United States Import Price Index (MoM) meets forecasts (0.1%) in December
-
14:30
United States Export Price Index (MoM) came in at 0.3%, above forecasts (0.2%) in December
-
14:23
CAD can’t hold technical break versus the USD – Scotiabank
The CAD has eased back after probing the low 1.43 area yesterday, Scotiabank’s Chief FX Strategist Shaun Osborne notes.
CAD slips back after failing to hold technical break
“A positive risk backdrop and some meaningful narrowing in short-term US/Canada spreads would perhaps be enough to give the CAD a bit more of a lift in different times. Our fair value estimate for USD/CAD has dipped to 1.4219 this morning while the spot rate moves in the opposite direction.”
“Tariff concerns are keeping CAD sentiment on the defensive ahead of the presidential inauguration next week. Canada releases Housing Starts data at 8.30ET. BoC DG Gravelle is giving a speech on ‘Managing the Bank of Canada’s balance sheet’. Prepared comments drop at 12.30ET. There will be an audience Q&A but no remarks to the media after the event.”
“The CAD could not sustain—at least today, so far—the break under major USD trend support that started to develop yesterday. The USD is trading higher but spot is back in the sideways range that has held since midDecember. Resistance is 1.4450/75. Support is 1.4350 and 1.4300/05.”
-
14:20
USD/JPY recovers some intraday losses amid uncertainty of Trump’s return to White House
- USD/JPY recoups some intraday losses as the US Dollar gains ground with focus on Donald Trump’s inauguration.
- Traders have raised Fed dovish bets after soft US core CPI data for December.
- BoJ Ueda keeps the option of further rate hikes in January’s policy meeting on the table.
The USD/JPY pair bounces back from the intraday low of 155.20 and rises to near 156.00 but is still down around 0.25% in Thursday’s North American session. The asset recovers as the US Dollar (USD) gains ground after Wednesday’s sell-off that was driven by surprisingly lower core Consumer Price Index (CPI) reading for December.
The US Dollar Index (DXY), which tracks the Greenback’s value against six major currencies, rises to near 109.25.
The CPI report showed on Wednesday that the core inflation – which excludes volatile food and energy prices – grew at a slower pace of 3.2% from the estimates and the prior release of 3.3%. Soft core reading led to an uptick in Federal Reserve (Fed) dovish bets. As a result, traders are now pricing in two interest rate cuts from the Fed this year, with the first coming in September, according to the CME FedWatch tool.
Meanwhile, the next major trigger for the US Dollar is the President-elect Donald Trump’s inauguration ceremony on Monday. Market participants expect Trump will release updated tariff plan sooner that would lead to a global trade war. The impact will be favorable for growth and inflationary pressures in the United States (US).
In the Asia Pacific front, growing expectations of more interest rate hikes from the Bank of Japan (BoJ) keeps the Japanese Yen (JPY) on the frontfoot. Traders price in two interest rate hikes this year, Reuters reported. Market speculation for the BoJ to raise interest rates were stemmed from Governor Kazuo Ueda’s commentary on Wednesday in which he said that the central bank is currently “analysing data thoroughly” and will compile the findings in the quarterly outlook report, and on based on that the bank will discuss whether to “raise interest rates at next week's policy meeting”.
US Dollar FAQs
The US Dollar (USD) is the official currency of the United States of America, and the ‘de facto’ currency of a significant number of other countries where it is found in circulation alongside local notes. It is the most heavily traded currency in the world, accounting for over 88% of all global foreign exchange turnover, or an average of $6.6 trillion in transactions per day, according to data from 2022. Following the second world war, the USD took over from the British Pound as the world’s reserve currency. For most of its history, the US Dollar was backed by Gold, until the Bretton Woods Agreement in 1971 when the Gold Standard went away.
The most important single factor impacting on the value of the US Dollar is monetary policy, which is shaped by the Federal Reserve (Fed). The Fed has two mandates: to achieve price stability (control inflation) and foster full employment. Its primary tool to achieve these two goals is by adjusting interest rates. When prices are rising too quickly and inflation is above the Fed’s 2% target, the Fed will raise rates, which helps the USD value. When inflation falls below 2% or the Unemployment Rate is too high, the Fed may lower interest rates, which weighs on the Greenback.
In extreme situations, the Federal Reserve can also print more Dollars and enact quantitative easing (QE). QE is the process by which the Fed substantially increases the flow of credit in a stuck financial system. It is a non-standard policy measure used when credit has dried up because banks will not lend to each other (out of the fear of counterparty default). It is a last resort when simply lowering interest rates is unlikely to achieve the necessary result. It was the Fed’s weapon of choice to combat the credit crunch that occurred during the Great Financial Crisis in 2008. It involves the Fed printing more Dollars and using them to buy US government bonds predominantly from financial institutions. QE usually leads to a weaker US Dollar.
Quantitative tightening (QT) is the reverse process whereby the Federal Reserve stops buying bonds from financial institutions and does not reinvest the principal from the bonds it holds maturing in new purchases. It is usually positive for the US Dollar.
-
14:15
US Dollar stabilizes ahead of US Retail Sales data
- The US Dollar steadies ahead of US Retail Sales data for December on Thursday.
- Markets see yields collapse, with rate-cut expectations taking over.
- The US Dollar Index (DXY) holds around 109.00 but could dip further if US yields sink even more.
The US Dollar Index (DXY), which tracks the Greenback’s value against six major currencies, halts this week’s correction and stabilizes around the 109.00 level on Thursday. This week's poor performance is fully due to the decline in US yields. For example, the US 10-year benchmark fell 2.5% in just one trading day due to mixed US Consumer Price Index (CPI) numbers, which could have been seen as disinflationary. In case US yields surge again, the Greenback could head back to 110.00 and higher.
This Thursday's economic calendar is filled with interesting data points. First and foremost is the US Retail Sales number for December, followed by the weekly Initial Jobless Claims. Later in the day, the National Association of Home Builders (NAHB) Housing Market Index for January could also become interesting.
Daily digest market movers: Retail Sales to set the record straight?
- At 13:30 GMT, the US Retail Sales and the weekly Jobless Claims will be released:
- The monthly Retail Sales are expected to increase by 0.6% in December, compared to 0.7% the previous month. As always, the revisions will be more market-moving than the actual release.
- Initial Jobless Claims for the week ending January 10 are expected to tick up to 210,000 from 201,000 in the previous week.
- The Philadelphia Fed Manufacturing Survey for January is also due in that same time slot. Expectations are for a smaller contraction of -5 compared to the previous -16.4.
- At 15:00, the NAHB Housing Market Index for January will be released. The expectation is that it will tick down to 45, compared to 46 in the previous reading.
- Equities are holding up quite well for the second day in a row. Both European and US equities are trading positive on the day.
- The CME FedWatch Tool projects a 97.3% chance that interest rates will be kept unchanged at current levels in the January meeting. Expectations are for the Federal Reserve (Fed) to remain data-dependent with uncertainties that could influence the inflation path once President-elect Donald Trump takes office on January 20.
- The US 10-year yield is trading around 4.667%, over 2.5% lower than its peak performance this week on Tuesday at 4.807%.
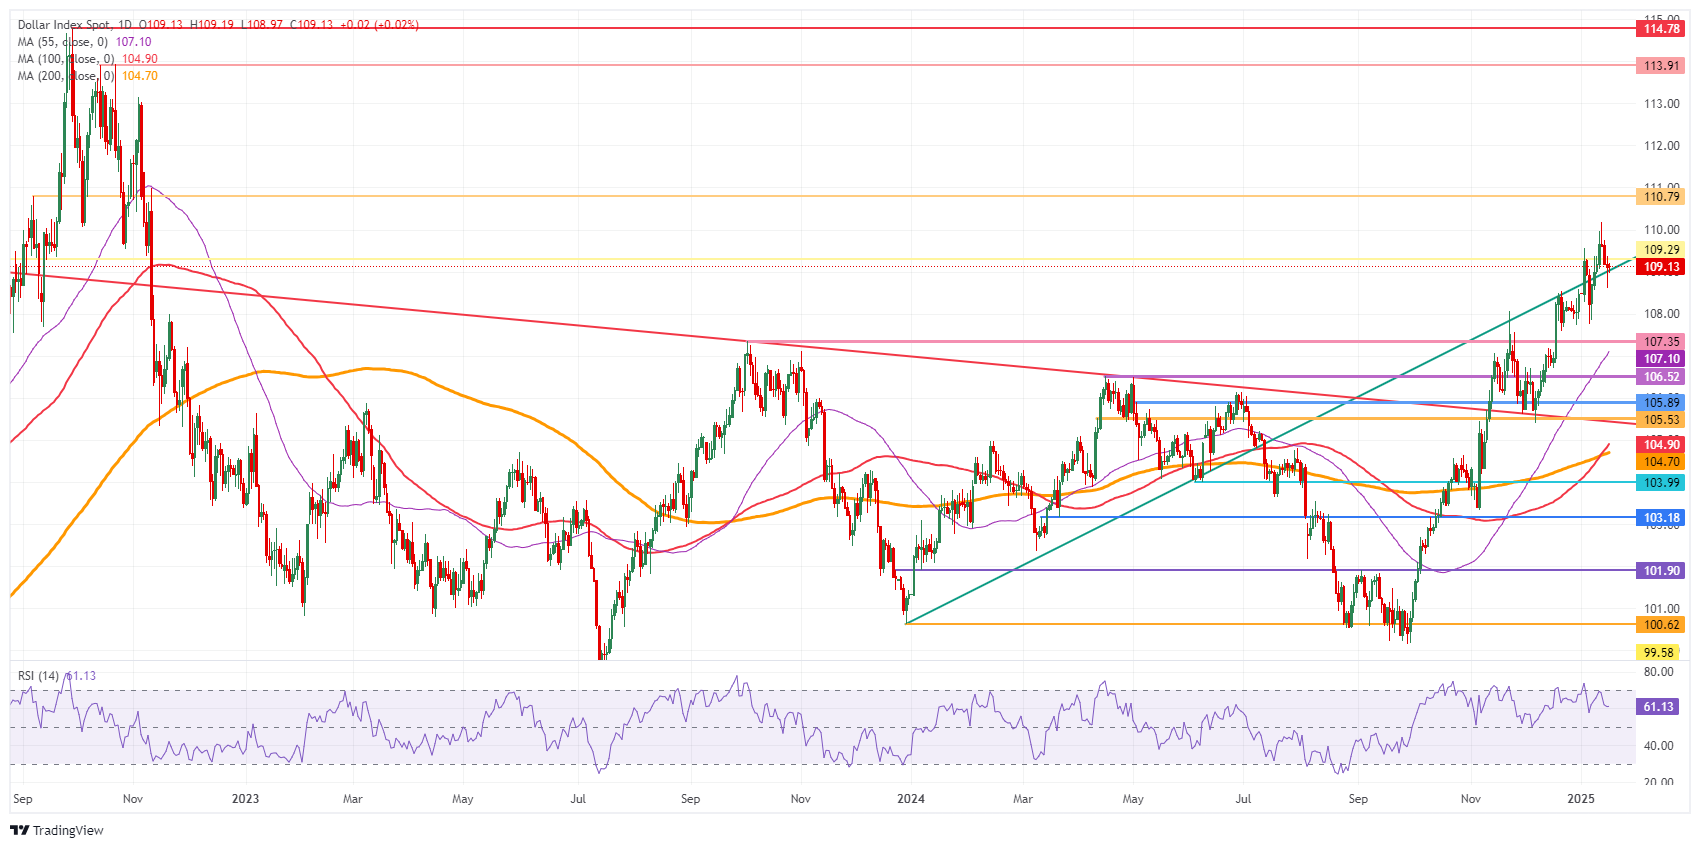
US Dollar Index Technical Analysis: Markets should not be happy
The US Dollar Index (DXY) takes a step back and is either on the verge of salvaging this rally or at risk of a harsh correction. Although markets might be rejoicing, mixed inflation data perceived as disinflationary will not have the Federal Reserve committing to anything at any time. Inflation might still elope and start turning hot and higher again, which would mean much more upside for the DXY, with markets being currently wrong-footed based on just one ‘mild’ disinflationary report at the start of the year.
On the upside, the 110.00 psychological level remains the key resistance to beat. Further up, the next big upside level to hit before advancing any further remains at 110.79. Once beyond there, it is quite a stretch to 113.91, the double top from October 2022.
On the downside, the DXY is testing the ascending trend line from December 2023, which currently comes in around 108.95 as nearby support. In case of more downside, the next support is 107.35. Further down, the next level that might halt any selling pressure is 106.52, with interim support at the 55-day Simple Moving Average (SMA) at 107.10.

US Dollar Index: Daily Chart
Employment FAQs
Labor market conditions are a key element to assess the health of an economy and thus a key driver for currency valuation. High employment, or low unemployment, has positive implications for consumer spending and thus economic growth, boosting the value of the local currency. Moreover, a very tight labor market – a situation in which there is a shortage of workers to fill open positions – can also have implications on inflation levels and thus monetary policy as low labor supply and high demand leads to higher wages.
The pace at which salaries are growing in an economy is key for policymakers. High wage growth means that households have more money to spend, usually leading to price increases in consumer goods. In contrast to more volatile sources of inflation such as energy prices, wage growth is seen as a key component of underlying and persisting inflation as salary increases are unlikely to be undone. Central banks around the world pay close attention to wage growth data when deciding on monetary policy.
The weight that each central bank assigns to labor market conditions depends on its objectives. Some central banks explicitly have mandates related to the labor market beyond controlling inflation levels. The US Federal Reserve (Fed), for example, has the dual mandate of promoting maximum employment and stable prices. Meanwhile, the European Central Bank’s (ECB) sole mandate is to keep inflation under control. Still, and despite whatever mandates they have, labor market conditions are an important factor for policymakers given its significance as a gauge of the health of the economy and their direct relationship to inflation.
-
14:15
Canada Housing Starts s.a (YoY) below forecasts (245K) in December: Actual (231.5K)
-
14:03
JPY outperforms on BoJ outlook – Scotiabank
The Japanese Yen (JPY) is firmer again this morning, notching up a 0.5% gain on the US Dollar (USD) behind a Bloomberg report that Bank of Japan (BoJ) officials think it is likely that they will raise the policy rate next week—barring a disruptive start to Trump’s presidency, Scotiabank’s Chief FX Strategist Shaun Osborne notes.
BoJ is likely to tighten rate policy next week
“Swaps reflect 20bps of tightening priced in for the January 24th meeting. US Treasury bond yields stabilizing around yesterday’s lows have also helped JPY sentiment improve. High beta/ EM FX is underperforming, with the MXN and NOK at the foot of the overnight performance table against a generally steady to slightly firmer USD.”
“The GBP softened and UK bond yields eased in response to weaker than expected UK growth data. The Fed’s Beige Book release yesterday noted the economic activity had increased ‘slightly to moderately’. On balance, contacts were more positive about the economic outlook but, in ‘several districts’ there were concerns that the impact of tariff and immigration policy under the incoming administration ‘could negatively affect the economy’.”
“Those concerns support the idea that policymakers are liable to take some time to asses the impact of president-elect Trump’s initiatives before their next rate decision. US data releases this morning include Retail Sales, the Philly Fed survey, Import Prices, weekly claims, Business Inventories, and the NAHB Housing Market Index. Consumers frontrunning tariffs are expected to help drive another healthy lift in sales. China releases, GDP, Industrial Production and Retail Sales data tonight.”
-
13:51
ECB Accounts: Further rate cuts remain on the cards
Policymakers at the European Central Bank (ECB) agreed last month that interest rate cuts should be approached cautiously and gradually, but they also indicated that more policy easing was likely on the horizon, all according to the publication of the bank’s Accounts of the December 11–12 gathering.
Highlights
Regarding the inflation outlook, members were increasingly confident that inflation would return to target in the first half of 2025.
If the baseline projection for inflation was confirmed over the next few months and quarters, a gradual dialling-back of policy restrictiveness was seen as appropriate.
The Governing Council should not let its guard down in the final stretch of disinflation.
There were still many upside and downside risks to the inflation outlook.
More check points had to be passed to ascertain whether disinflation remained on track and kept open the optionality to make adjustments along the way.
This cautious approach was still warranted in view of the prevailing uncertainties and the existence of a number of factors that could hamper a rapid decline in inflation to target.
Some members noted that a case could be made for a 50 basis point rate cut at the current meeting and would have favoured more consideration being given to the possibility of such a larger cut.
Gradual approach was needed to allow an assessment of whether policy rates had reached a broadly neutral level.
It was remarked that a 50 basis point cut could be perceived as the ECB having a more negative view of the state of the economy than was actually the case.
It was advisable to draw on a broad range of approaches to estimate or model the natural rate.
Case for adjusting interest rates by 50 basis points was not the same on the way down as it had been during the rate-hiking cycle.
Geopolitical and economic policy uncertainty had become more pronounced since the last Governing Council meeting.
Risks to inflation were broadly balanced.
-
12:22
Gold extends recovery on rate cut expectations
- Gold price extends recovery and rises above $2,700, looking for more upside.
- The mixed US CPI release on Wednesday fueled hopes for a Fed rate cut before the summer.
- Gold sprints higher and sets sail for the first important pivotal level at $2,708.
Gold’s price (XAU/USD) edges higher for the third day in a row and recovers initial weekly losses, rising above the $2,700 level at the time of writing on Thursday. The recovery comes in the run-up and release of the December US Consumer Price Index (CPI) data on Wednesday.
While headline CPI accelerated compared to the previous month, core inflation rose at a slower pace than in November, which increased the probability of a 25 basis point (bps) rate cut by the Federal Reserve (Fed) in June. According to the CME FedWatch tool, the odds of interest rates being lower than current levels after the June meeting stand at 63.8%, compared to 57.3% before the inflation data and 51.4% on Monday.
On the economic data front, the US Initial Jobless Claims for the week ending January 10 and US Import/Export and Retail Sales data for December are due on Thursday. Meanwhile, US Treasury yields are falling further, with the US 10-year benchmark trading below 4.70%.
Daily digest market movers: Where is the Fed when you need them?
- Despite several Federal Reserve speakers on Wednesday, officials did not communicate many market-moving comments about whether market expectations were wrong-footed or in line with the Fed’s policy.
- At 13:30 GMT, Retail Sales for December will be released with expectations for a 0.6% month-on-month increase compared to 0.7% in the previous month. As always, the revisions might be more impactful than the actual number.
- South African rescue workers retrieved 78 bodies from a disused gold mine where hundreds of illegal extractors have been involved in a months-long standoff with the authorities, Bloomberg reports.
- The US 10-year yield is trading around 4.667%, over 2.5% lower than its peak performance this week on Tuesday at 4.807%.
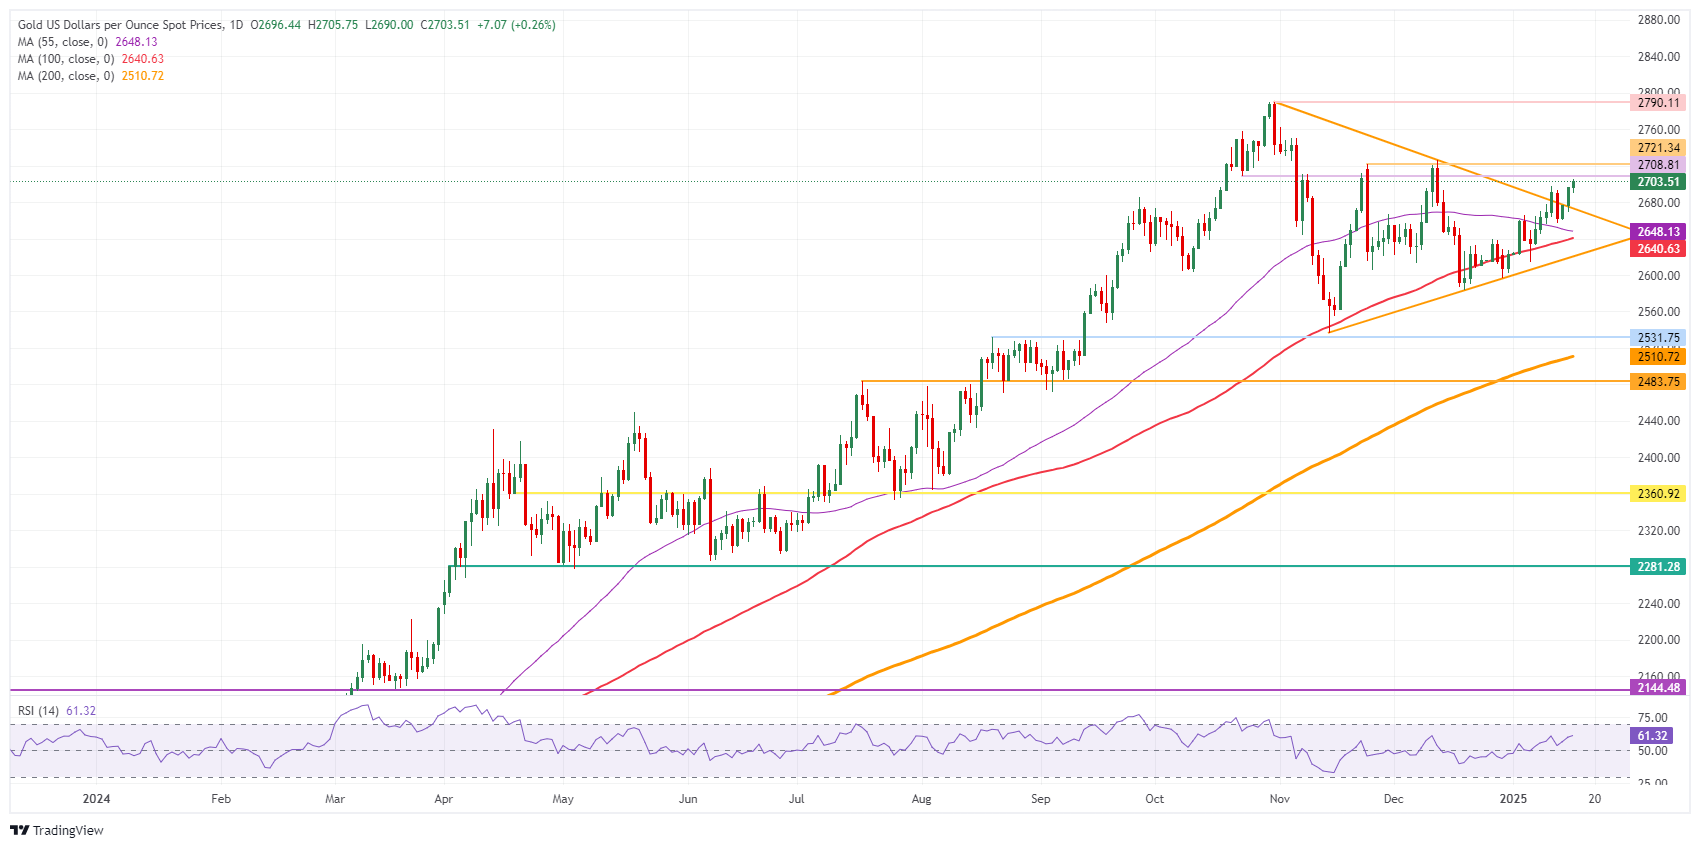
Technical Analysis: Here comes the hard part
Gold bulls face their first litmus test on the upside on Thursday, with some heavy resistance coming in around the pivotal level of $2,708, followed by $2,721. The Relative Strength Index (RSI) is steepening quite quickly in the daily chart. Risk of any overheating in the RSI momentum indicator by the time Bullion hits that $2,720 area could see a quick correction back to $2,680.
The first support is the descending trendline in the pennant chart formation, which has been discussed several times in the past few days. That level is currently around $2,671. In case more downside occurs, the 55-day Simple Moving Average (SMA) at $2,648 is the next support, followed by the 100-day SMA at $2,640.
On the upside, the October 23 low at $2,708 is the key pivotal level to watch. Once that level is cleared, $2,721, which is a sort of a double top in November and December last year, is rapidly approaching. In case Bullion powers through that level, the all-time high of $2,790 is the key upside barrier.
XAU/USD: Daily Chart
Gold FAQs
Gold has played a key role in human’s history as it has been widely used as a store of value and medium of exchange. Currently, apart from its shine and usage for jewelry, the precious metal is widely seen as a safe-haven asset, meaning that it is considered a good investment during turbulent times. Gold is also widely seen as a hedge against inflation and against depreciating currencies as it doesn’t rely on any specific issuer or government.
Central banks are the biggest Gold holders. In their aim to support their currencies in turbulent times, central banks tend to diversify their reserves and buy Gold to improve the perceived strength of the economy and the currency. High Gold reserves can be a source of trust for a country’s solvency. Central banks added 1,136 tonnes of Gold worth around $70 billion to their reserves in 2022, according to data from the World Gold Council. This is the highest yearly purchase since records began. Central banks from emerging economies such as China, India and Turkey are quickly increasing their Gold reserves.
Gold has an inverse correlation with the US Dollar and US Treasuries, which are both major reserve and safe-haven assets. When the Dollar depreciates, Gold tends to rise, enabling investors and central banks to diversify their assets in turbulent times. Gold is also inversely correlated with risk assets. A rally in the stock market tends to weaken Gold price, while sell-offs in riskier markets tend to favor the precious metal.
The price can move due to a wide range of factors. Geopolitical instability or fears of a deep recession can quickly make Gold price escalate due to its safe-haven status. As a yield-less asset, Gold tends to rise with lower interest rates, while higher cost of money usually weighs down on the yellow metal. Still, most moves depend on how the US Dollar (USD) behaves as the asset is priced in dollars (XAU/USD). A strong Dollar tends to keep the price of Gold controlled, whereas a weaker Dollar is likely to push Gold prices up.
-
12:13
AUD/USD fails to continue winning streak despite strong Aussie Employment data
- AUD/USD falls as three-day winning streak concludes despite upbeat Aussie labor market data.
- The Aussie economy added 53.6K workers in December, while the jobless rate accelerated.
- Investors await the US Initial Jobless Claims and the Retail Sales data.
The AUD/USD pair declines after failing to extend a three-day winning streak above the key resistance of 0.6245 in Thursday’s European session. The Aussie pair falls even though the Australian employment data for December has come in stronger than expected.
The Australian Bureau of Statistics (ABS) reported that the economy added 53.6K workers, surprisingly higher than 28.2K in November. Economists expected the labor demand to have remained weak and projected a fresh addition of 15K workers. The Unemployment Rate rises to 4.0%, as expected, from 3.9% in November.
Typically, signs of robust Australian labor demand remain unfavorable for the Reserve Bank of Australia’s (RBA) dovish bets. Currently, traders roughly price in a 67% chance that the RBA will lower its Official Cash Rate by 25 basis points (bps) to 4.10% in February, with a full rate cut expected by April.
Meanwhile, the US Dollar (USD) wobbles in a tight range with investors awaiting the United States (US) Initial Jobless Claims for the week ending January 10 and the Retail Sales data for December, which will be published at 13:30 GMT.
Investors expect individuals claiming jobless benefits for the first time were higher at 210K, compared to 201K in the week ending January 03. The Retail Sales data, a key measure of consumer spending, is estimated to have grown by 0.6%, slower than 0.7% in November.
The Retail Sales data will influence market expectations for the Federal Reserve’s (Fed) monetary policy outlook. Currently, traders expect the Fed to deliver 25-bps interest rate reduction in June, according to the CME FedWatch tool.
Australian Dollar FAQs
One of the most significant factors for the Australian Dollar (AUD) is the level of interest rates set by the Reserve Bank of Australia (RBA). Because Australia is a resource-rich country another key driver is the price of its biggest export, Iron Ore. The health of the Chinese economy, its largest trading partner, is a factor, as well as inflation in Australia, its growth rate and Trade Balance. Market sentiment – whether investors are taking on more risky assets (risk-on) or seeking safe-havens (risk-off) – is also a factor, with risk-on positive for AUD.
The Reserve Bank of Australia (RBA) influences the Australian Dollar (AUD) by setting the level of interest rates that Australian banks can lend to each other. This influences the level of interest rates in the economy as a whole. The main goal of the RBA is to maintain a stable inflation rate of 2-3% by adjusting interest rates up or down. Relatively high interest rates compared to other major central banks support the AUD, and the opposite for relatively low. The RBA can also use quantitative easing and tightening to influence credit conditions, with the former AUD-negative and the latter AUD-positive.
China is Australia’s largest trading partner so the health of the Chinese economy is a major influence on the value of the Australian Dollar (AUD). When the Chinese economy is doing well it purchases more raw materials, goods and services from Australia, lifting demand for the AUD, and pushing up its value. The opposite is the case when the Chinese economy is not growing as fast as expected. Positive or negative surprises in Chinese growth data, therefore, often have a direct impact on the Australian Dollar and its pairs.
Iron Ore is Australia’s largest export, accounting for $118 billion a year according to data from 2021, with China as its primary destination. The price of Iron Ore, therefore, can be a driver of the Australian Dollar. Generally, if the price of Iron Ore rises, AUD also goes up, as aggregate demand for the currency increases. The opposite is the case if the price of Iron Ore falls. Higher Iron Ore prices also tend to result in a greater likelihood of a positive Trade Balance for Australia, which is also positive of the AUD.
The Trade Balance, which is the difference between what a country earns from its exports versus what it pays for its imports, is another factor that can influence the value of the Australian Dollar. If Australia produces highly sought after exports, then its currency will gain in value purely from the surplus demand created from foreign buyers seeking to purchase its exports versus what it spends to purchase imports. Therefore, a positive net Trade Balance strengthens the AUD, with the opposite effect if the Trade Balance is negative.
-
12:06
IEA and OPEC oil market reports are out – ING
Yesterday both the IEA and OPEC released their monthly oil market report, ING’s commodity analyst Warren Patterson and Ewa Manthey note.
OPEC demand growth estimate for 2025 remains unchanged
“The IEA warned of potential supply disruptions following the latest US sanctions on the Russian energy sector, while the agency also revised higher its demand growth forecasts on the back of colder weather across the northern hemisphere. The IEA estimates that 2024 oil demand grew by 940k b/d, up by 90k b/d from its previous estimate. Meanwhile, 2025 demand is expected to grow by 1.05m b/d.”
“In its monthly report, OPEC decided to leave its demand growth estimate for 2025 unchanged at 1.45m b/d YoY, while in its first forecast for 2026, the group expects demand next year to grow by 1.43m b/d YoY. The group also left its supply growth estimates unchanged for non-OPEC+ members at 1.11m b/d for 2025, while for 2026, supply is expected to grow by a similar amount.”
“OPEC production saw marginal growth in December, increasing by 26k b/d MoM to 26.74m b/d. Meanwhile, total OPEC+ production fell by 14k b/d to 40.65m b/d – driven by lower output from Kazakhstan. OPEC numbers suggest that demand for OPEC+ crude in 2025 is 42.5m b/d and 42.7m b/d in 2026.”
-
12:03
Ireland Consumer Price Index (MoM) up to 0.9% in December from previous -0.5%
-
12:02
Ireland HICP (YoY) meets forecasts (1%) in December
-
12:02
Ireland HICP (MoM) meets expectations (0.9%) in December
-
12:02
Ireland Consumer Price Index (YoY) increased to 1.4% in December from previous 1%
-
12:02
Oil: US crude stocks fall – ING
Oil prices continued their move higher yesterday with ICE Brent breaking above US$82/bbl and trading to its highest level since August 2024, ING’s commodity analyst Warren Patterson and Ewa Manthey note.
Oil market continues to focus on the uncertainty around Russian oil
“This is despite Israel and Hamas appearing to have reached a ceasefire, although the Israeli Prime Minister’s office has said that details still need to be finalized. US CPI data would have been supportive for the oil market and risk assets in general. Core inflation for December came in lower than expected.”
“The oil market continues to be focused on the uncertainty around Russian oil supply following the announcement of stricter US sanctions against the Russian energy sector. In addition, tighter US crude oil stocks will be supportive. EIA data yesterday showed that US commercial crude oil inventories fell by 1.96m barrels, which leaves inventories at a little under 413m barrels, the lowest level since March 2022.”
“The decline over the last week was driven by crude oil imports falling 304k b/d WoW and exports rising by 1m b/d WoW. For refined products, despite refinery utilisation falling by 1.6pp over the week, gasoline and distillate stocks still increased by 5.85m barrels and 3.08m barrels respectively.”
-
11:49
USD/CNH: Above 7.3250 the 7.3700 level to come into view – UOB Group
US Dollar (USD) is expected to continue to trade in a range, most likely between 7.3350 and 7.3550. In the longer run, upward momentum is beginning to fade; a breach of 7.3250 would suggest that 7.3700 is not coming into view, UOB Group’s FX analysts Quek Ser Leang and Lee Sue Ann note.
Upward momentum is beginning to fade
24-HOUR VIEW: “USD traded in a quiet manner two days ago. Yesterday, we indicated that ‘momentum indicators are turning flat, suggesting further range trading today, probably in a range of 7.3380/7.3580.’ USD then traded between 7.3351 and 7.3511, closing largely unchanged at 7.3484 (+0.04%). Momentum indicators remain flat, and we continue to expect USD to trade in a range, most likely between 7.3350 and 7.3550.”
1-3 WEEKS VIEW: “We have held the view that ‘there is room for USD to retest the 7.3700’ since early last week. On Tuesday (14 Jan, spot at 7.3410), we noted that ‘upward momentum is beginning to fade, and a breach of 7.3250 (‘strong support’ level) would suggest that 7.3700 is not coming into view.’ While USD has not been able to make any headway on the upside, we will maintain our view for now.”
-
11:25
Aluminum gets a short boost – ING
LME aluminum prices touched their highest in nearly a month this Wednesday, topping $2,600/t following the news that the European Union is considering more sanctions on Russian aluminum products. Prices later gave up the gains, ING’s commodity analyst Ewa Manthey notes.
EU is expected to adopt the new measures next month
“The draft measures would be part of the EU’s 16th package of sanctions, marking the third anniversary of the war. Restrictions on aluminum would be gradual, with a timeframe and scope still to be determined, according to reports. The draft proposals are still being discussed between member states and could change before they are formally presented. The EU is expected to adopt the new measures next month.”
“The US and the UK banned the import of metals produced in Russia in 2024. The EU has so far banned aluminum products, including wire, tube, pipe and foil, which account for less than 15% of EU imports. Russia is the world’s largest aluminum producer outside China, accounting for about 5% of global aluminum production.”
-
11:22
USD/JPY: Likely to trade with a downward bias – UOB Group
US Dollar (USD) is likely to trade with a downward bias; any decline is viewed as part of a lower range of 155.80/157.00. In the longer run, rapid increase in momentum indicates further USD weakness, with a technical target at 154.90, UOB Group’s FX analysts Quek Ser Leang and Lee Sue Ann note.
Rapid increase in momentum indicates further USD weakness
24-HOUR VIEW: “The sharp drop in USD that sent it plunging to 155.93 was surprising (we were expecting range trading). The sharp and swift selloff seems to be excessive. However, the weakness does not appear to have stabilized just yet, and it is premature to expect a stabilization. Overall, USD is more likely to trade with a downward bias today. However, any weakness is viewed as part of a lower range of 155.80/157.00. To look at it another way, a sustained decline below 155.80 is unlikely today.”
1-3 WEEKS VIEW: “We indicated two days ago that (14 Jan, spot at 157.50) that ‘the current price movements are likely part of a consolidation phase, expected to be between 156.50 and 158.50.’ Yesterday, USD decisively broke below 156.50, reaching a low of 155.93. The rapid increase in momentum indicates further USD weakness. The technical target is near 154.90. To sustain the rapid buildup in momentum, USD must remain below the ‘strong resistance’ level, currently at 157.60.”
-
11:19
EU's imports of Russian metal have fallen – ING
Although the EU continues to import Russian aluminum, volumes have fallen over the past two years, with European buyers self-sanctioning since the invasion of Ukraine, ING’s commodity analysts Ewa Manthey notes.
More Russian metal has been shipped to China
“Russia now accounts for around 6% of European imports of primary aluminum, halving from the 2022 levels. The gap left by Russian supplies has mostly been filled by imports from the Middle East, India, and Southeast Asia, and this trend is likely to continue.”
“More Russian metal has been shipped to China, the world's biggest aluminum consumer. China imported 263,000 tons of primary aluminum from Russia in the first three quarters of 2024, accounting for 33% of the total imports from Russia last year. We expect this trend to continue in 2025.”
-
11:07
Silver Price Forecast: XAG/USD jumps to near $31 as traders raise Fed dovish bets
- Silver price climbs to near $31.00 as traders reassess Fed monetary policy outlook after mixed US inflation data.
- Traders expect the Fed to cut interest rates twice this year.
- Silver price attempts to break above the upward-sloping trendline around $30.85.
Silver price (XAG/USD) moves higher to near $31.00 in Thursday’s European session. The white metal gains as traders have raised bets supporting the Federal Reserve (Fed) to deliver more than one interest rate cut this year.
According to the CME FedWatch tool, traders are pricing in two interest rate cuts this year, the first coming in June instead of September, as forecasted before the December inflation data were released.
As measured by the Consumer Price Index (CPI), headline inflation accelerated to 2.9%, as expected; however, the core reading—which excludes volatile food and energy prices—surprisingly rose at a slower pace of 3.2%.
Typically, signs of acceleration in Fed dovish bets bode well for non-yielding assets, such as Silver.
Meanwhile, the US Dollar Index (DXY), which tracks the Greenback’s value against six major currencies, ticks higher to near 109.00 but has corrected from the two-year high of 110.00. 10-year US Treasury yields edge higher to near 4.66% but have come down from its yearly high of 4.80%.
Silver technical analysis
Silver price gathers strength to break above the upward-sloping trendline around $30.85, which is plotted from the 29 February 2024 low of $22.30 on a daily timeframe.
The white metal rebounded strongly after discovering strong buying interest near the 200-day Exponential Moving Average (EMA), which is around $29.45. It then climbed above the 20-day EMA, which is around $30.00, suggesting a bullish near-term trend.
The 14-day Relative Strength Index (RSI) jumps to near 60.00. A fresh bullish momentum would trigger if its manages to break above 60.00.
Silver daily chart
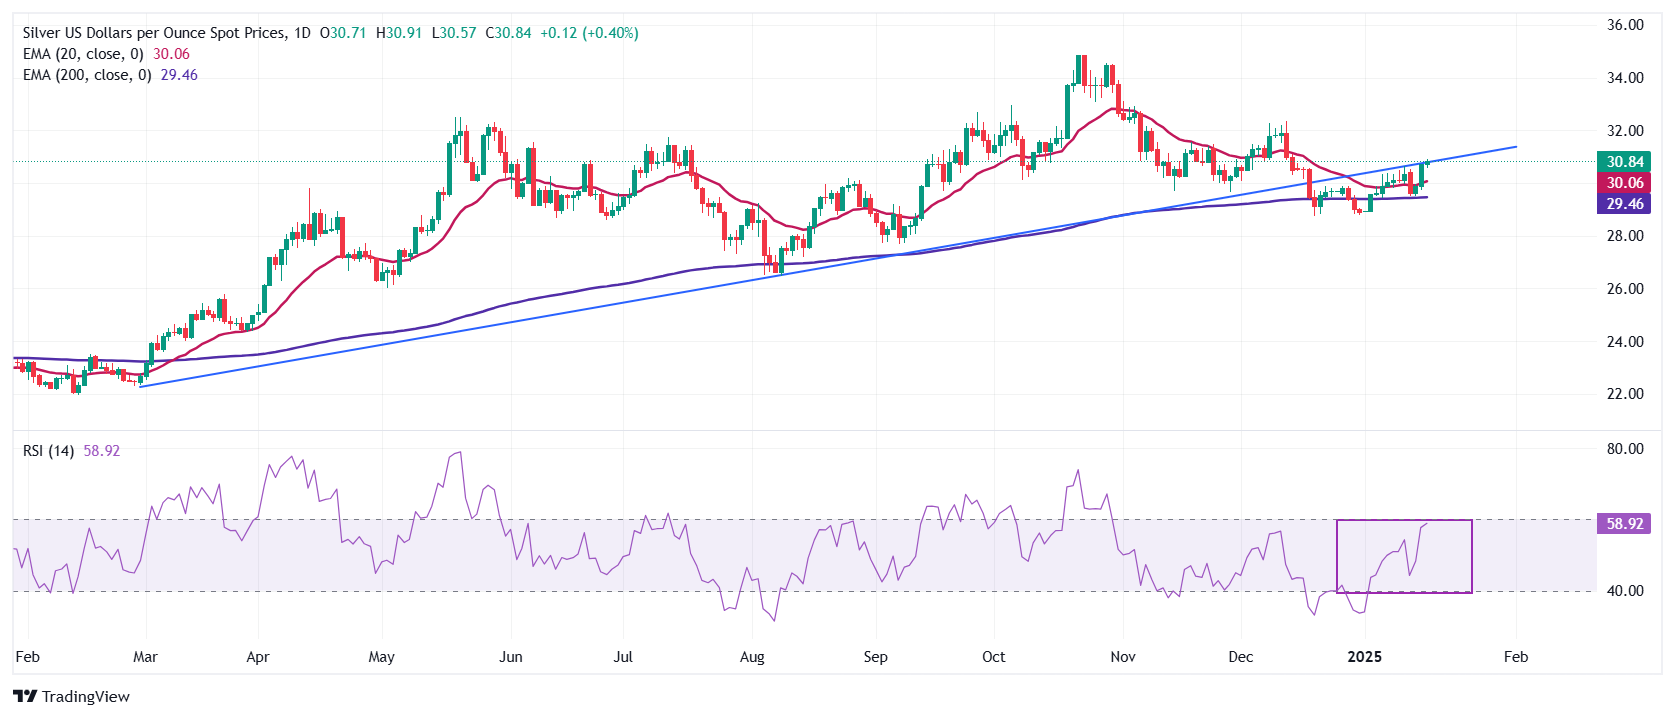
Silver FAQs
Silver is a precious metal highly traded among investors. It has been historically used as a store of value and a medium of exchange. Although less popular than Gold, traders may turn to Silver to diversify their investment portfolio, for its intrinsic value or as a potential hedge during high-inflation periods. Investors can buy physical Silver, in coins or in bars, or trade it through vehicles such as Exchange Traded Funds, which track its price on international markets.
Silver prices can move due to a wide range of factors. Geopolitical instability or fears of a deep recession can make Silver price escalate due to its safe-haven status, although to a lesser extent than Gold's. As a yieldless asset, Silver tends to rise with lower interest rates. Its moves also depend on how the US Dollar (USD) behaves as the asset is priced in dollars (XAG/USD). A strong Dollar tends to keep the price of Silver at bay, whereas a weaker Dollar is likely to propel prices up. Other factors such as investment demand, mining supply – Silver is much more abundant than Gold – and recycling rates can also affect prices.
Silver is widely used in industry, particularly in sectors such as electronics or solar energy, as it has one of the highest electric conductivity of all metals – more than Copper and Gold. A surge in demand can increase prices, while a decline tends to lower them. Dynamics in the US, Chinese and Indian economies can also contribute to price swings: for the US and particularly China, their big industrial sectors use Silver in various processes; in India, consumers’ demand for the precious metal for jewellery also plays a key role in setting prices.
Silver prices tend to follow Gold's moves. When Gold prices rise, Silver typically follows suit, as their status as safe-haven assets is similar. The Gold/Silver ratio, which shows the number of ounces of Silver needed to equal the value of one ounce of Gold, may help to determine the relative valuation between both metals. Some investors may consider a high ratio as an indicator that Silver is undervalued, or Gold is overvalued. On the contrary, a low ratio might suggest that Gold is undervalued relative to Silver.
-
11:02
Spain 5-y Bond Auction up to 2.763% from previous 2.372%
-
11:02
Italy Trade Balance EU: €-1.816B (November) vs previous €-0.66B
-
11:00
Italy Global Trade Balance below expectations (€4.5B) in November: Actual (€4.218B)
-
11:00
Eurozone Trade Balance s.a.: €12.9B (November) vs €6.1B
-
11:00
Eurozone Trade Balance n.s.a. came in at €16.4B, above forecasts (€8.5B) in November
-
10:57
USD/SGD: Mild pullback risk for now – OCBC
USD/SGD is a touch softer as US Dollar (USD) strength paused while risk sentiments found support. Pair was last seen at 1.3671, OCBC’s FX analysts Frances Cheung and Christopher Wong note.
Price action still shows a potential rising wedge pattern
“Daily momentum turned mild bearish while RSI fell. Price action still shows a potential rising wedge pattern in the making. This can be associated with a bearish reversal. Bearish divergence observed on RSI. Near term risks continued to suggest downside bias though conviction level is not strong. Support at 1.3645 (21 DMA). Resistance at 1.3760 levels, 1.38.”
“The focus next is on NODX (Fri), CPI (next Thu) and upcoming MAS MPC (no later than 31 Jan). We are looking for MAS to ease policy at the upcoming MPC by reducing the policy slope slightly but still maintain a mild appreciation stance.”
“Given that the disinflation journey has made good progress, we believe MAS now has optionality to ease especially if it takes on a pre-emptive stance in the face of policy transmission lag. S$NEER was last at 0.62% above model-implied mid.”
-
10:39
NZD/USD: Only above 0.5650 a move to 0.5695 is likely – UOB Group
New Zealand Dollar (NZD) is expected to trade in a sideways range of 0.5600/0.5650. In the longer run, NZD must break and remain above 0.5650 before a move to 0.5695 is likely, UOB Group’s FX analysts Quek Ser Leang and Lee Sue Ann note.
NZD is expected to trade in a sideways range
24-HOUR VIEW: “We expected NZD to ‘trade in a 0.5570/0.5635 range’ yesterday. Our view was incorrect, as NZD soared to 0.5651. However, the advance was brief, as NZD fell quickly from the high to close at 0.5616 (+0.21%). As there has been no significant increase in upward momentum, NZD is unlikely to advance much further. Today, we expect it to trade in a sideways range of 0.5600/0.5650.”
1-3 WEEKS VIEW: “Our latest narrative was from Tuesday (14 Jan, spot at 0.5590), wherein ‘the recent whippy price action has resulted in a mixed outlook.’ We indicated that ‘for the time being, NZD could trade in a sideways range of 0.5540/0.5650.’ Yesterday, NZD rose and tested the upper bound of our expected range, reaching a high of 0.5651. It then pulled back to close at 0.5616, up by 0.21% for the day. Although there has been a slight increase in momentum, NZD must break and remain above 0.5650 before a move to 0.5695 is likely. The likelihood of NZD breaking clearly will increase in the next few days, provided that it remains above 0.5580 (‘strong support’ level).”
-
10:30
Silver price today: Silver rises, according to FXStreet data
Silver prices (XAG/USD) rose on Thursday, according to FXStreet data. Silver trades at $30.90 per troy ounce, up 0.61% from the $30.71 it cost on Wednesday.
Silver prices have increased by 6.94% since the beginning of the year.
Unit measure Silver Price Today in USD Troy Ounce 30.90 1 Gram 0.99
The Gold/Silver ratio, which shows the number of ounces of Silver needed to equal the value of one ounce of Gold, stood at 87.55 on Thursday, down from 87.80 on Wednesday.
Silver FAQs
Silver is a precious metal highly traded among investors. It has been historically used as a store of value and a medium of exchange. Although less popular than Gold, traders may turn to Silver to diversify their investment portfolio, for its intrinsic value or as a potential hedge during high-inflation periods. Investors can buy physical Silver, in coins or in bars, or trade it through vehicles such as Exchange Traded Funds, which track its price on international markets.
Silver prices can move due to a wide range of factors. Geopolitical instability or fears of a deep recession can make Silver price escalate due to its safe-haven status, although to a lesser extent than Gold's. As a yieldless asset, Silver tends to rise with lower interest rates. Its moves also depend on how the US Dollar (USD) behaves as the asset is priced in dollars (XAG/USD). A strong Dollar tends to keep the price of Silver at bay, whereas a weaker Dollar is likely to propel prices up. Other factors such as investment demand, mining supply – Silver is much more abundant than Gold – and recycling rates can also affect prices.
Silver is widely used in industry, particularly in sectors such as electronics or solar energy, as it has one of the highest electric conductivity of all metals – more than Copper and Gold. A surge in demand can increase prices, while a decline tends to lower them. Dynamics in the US, Chinese and Indian economies can also contribute to price swings: for the US and particularly China, their big industrial sectors use Silver in various processes; in India, consumers’ demand for the precious metal for jewellery also plays a key role in setting prices.
Silver prices tend to follow Gold's moves. When Gold prices rise, Silver typically follows suit, as their status as safe-haven assets is similar. The Gold/Silver ratio, which shows the number of ounces of Silver needed to equal the value of one ounce of Gold, may help to determine the relative valuation between both metals. Some investors may consider a high ratio as an indicator that Silver is undervalued, or Gold is overvalued. On the contrary, a low ratio might suggest that Gold is undervalued relative to Silver.
(An automation tool was used in creating this post.)
-
10:23
USD/JPY: BoJ MPC is live – OCBC
USD/JPY fell in reaction to a volley of comments from BoJ officials, that seem to point to high likelihood of a hike at the upcoming MPC (24 Jan). Pair was last seen at 155.82 levels, OCBC’s FX analysts Frances Cheung and Christopher Wong note.
Wage growth pressure remains intact
“Most notable one was a report that said BoJ officials see good chance of an interest rate hike next week as long as Trump administration does not trigger too many negative surprises. Earlier this week, Governor Ueda spoke about making a decision on whether to raise rate at the upcoming BoJ meeting. He also shared there is positive views on wage hikes gathering momentum.”
“Deputy Governor Himino also said MPC will discuss next week whether to raise rate or not and to raise rate if economic outlook is realized. He also said ‘In conducting monetary policy, it is difficult but essential to judge the right timing’. We still look for a hike as data continues to support policy normalization. Wage growth pressure remains intact, alongside broadening services inflation.”
“Daily momentum is bearish while RSI fell. Risks remain skewed to the downside. Next support at 154.80 (50 DMA), 154.30 (23.6% fibo retracement of Sep low to Jan high) and 152.80 (200 DMA). Resistance at 156.40, 157.40 (21 DMA). Tactically, in our FX Weekly sent yesterday, we look for short SGD/JPY targeting a move lower towards 110. Entered at 115.10 with SL at 117.12. Cross was last at 114 levels.”
-
10:22
EUR/USD trades sideways as trades reassess Fed’s monetary policy outlook
- EUR/USD wobbles around 1.0300 as the US Dollar consolidates while traders re-evaluate the Fed’s likely interest rate outlook for the entire year.
- Traders see at least one interest rate cut this year after mixed US inflation data for December.
- ECB’s Villeroy sees the deposit facility rate sliding to 2% by the mid-year.
EUR/USD consolidates around 1.0300 in Thursday’s European session. The major currency pair trades sideways, following the US Dollar (USD) footprints, while the US Dollar Index (DXY) wobbles around 109.15. The USD Index strives to recover Wednesday’s losses that were driven by mixed United States (US) Consumer Price Index (CPI) data for December.
The US CPI report showed that price pressures were broadly mixed. On a yearly basis, headline inflation accelerated expectedly, while the core reading rose at a slower-than-projected pace. Signs of mixed inflationary pressures forced traders to reassess market expectations for the Federal Reserve’s (Fed) monetary policy outlook.
According to the CME FedWatch tool, traders anticipate more than one interest rate cut this year, similar to what officials projected in December’s Summary of Economic Projections (SEP). Before Wednesday’s inflation data, traders expected the Fed to cut interest rates only once this year.
However, Fed officials are still worried about the inflation outlook amid uncertainty over incoming policies under President-elect Donald Trump’s administration. New York Fed Bank President John Williams said in a speech at the CBIA Economic Summit on Wednesday that the disinflation process is “in train”; however, the economic outlook remains highly uncertain, especially around “potential fiscal, trade, immigration, and regulatory policies.”
In Thursday’s session, investors await the US Initial jobless Claims data for the week ending January 10 and the US Retail Sales data for December, which will be published at 13:30 GMT.
Daily digest market movers: EUR/USD consolidates while Euro’s outlook remains uncertain
- The sideways move in the EUR/USD pair is also driven by the Euro’s (EUR) mixed performance against its major peers on Thursday. However, the broader outlook of the Euro will remain bearish as investors expect the European Central Bank (ECB) to continue reducing interest rates gradually this year.
- According to a January 10-15 period Reuters poll, all 77 economists see the ECB reducing the Deposit Facility rate by 25 basis points (bps) to 2.75% in the January meeting, and 60% of them are confident about three additional 25 bps interest rate cuts by the mid-year.
- Meanwhile, ECB officials are also comfortable with expectations that the Deposit Rate will slide to 2% by mid-summer. ECB policymaker and Governor of the Bank of France François Villeroy de Galhau said, "It makes sense for interest rates to reach 2% by the summer," as we have practically won the "battle against inflation." Villeroy added that bringing down borrowing costs will bolster the “financing of the economy” and a “drop in the household savings rate.”
- The outlook of the Eurozone economy remains vulnerable as market participants worry that higher import tariffs by the US under Trump’s administration will weigh on the export sector significantly.
Technical Analysis: EUR/USD holds recovery to near 1.0300
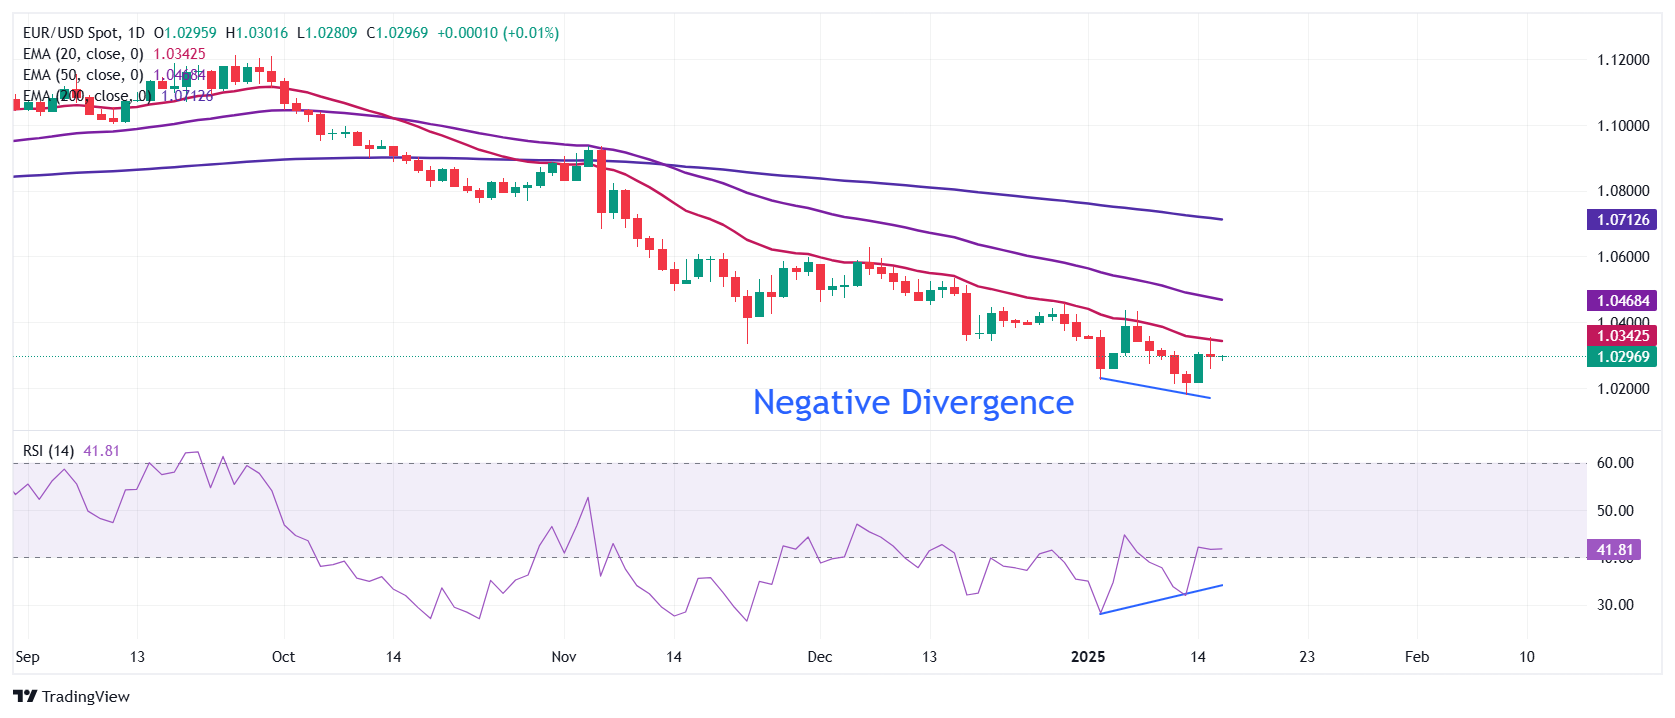
EUR/USD holds rebound to near 1.0300 after gaining ground from the over-two-year low of 1.0175 reached on Monday. The major currency pair bounces back on divergence in momentum and price action. The 14-day Relative Strength Index (RSI) formed a higher low near 35.00, while the pair made lower lows.
However, the outlook of the shared currency pair is still bearish as all short-to-long-term Exponential Moving Averages (EMAs) are sloping downwards.
Looking down, Monday’s low of 1.0175 will be the key support zone for the pair. Conversely, the January 6 high of 1.0437 will be the key barrier for the Euro bulls.
Euro FAQs
The Euro is the currency for the 19 European Union countries that belong to the Eurozone. It is the second most heavily traded currency in the world behind the US Dollar. In 2022, it accounted for 31% of all foreign exchange transactions, with an average daily turnover of over $2.2 trillion a day. EUR/USD is the most heavily traded currency pair in the world, accounting for an estimated 30% off all transactions, followed by EUR/JPY (4%), EUR/GBP (3%) and EUR/AUD (2%).
The European Central Bank (ECB) in Frankfurt, Germany, is the reserve bank for the Eurozone. The ECB sets interest rates and manages monetary policy. The ECB’s primary mandate is to maintain price stability, which means either controlling inflation or stimulating growth. Its primary tool is the raising or lowering of interest rates. Relatively high interest rates – or the expectation of higher rates – will usually benefit the Euro and vice versa. The ECB Governing Council makes monetary policy decisions at meetings held eight times a year. Decisions are made by heads of the Eurozone national banks and six permanent members, including the President of the ECB, Christine Lagarde.
Eurozone inflation data, measured by the Harmonized Index of Consumer Prices (HICP), is an important econometric for the Euro. If inflation rises more than expected, especially if above the ECB’s 2% target, it obliges the ECB to raise interest rates to bring it back under control. Relatively high interest rates compared to its counterparts will usually benefit the Euro, as it makes the region more attractive as a place for global investors to park their money.
Data releases gauge the health of the economy and can impact on the Euro. Indicators such as GDP, Manufacturing and Services PMIs, employment, and consumer sentiment surveys can all influence the direction of the single currency. A strong economy is good for the Euro. Not only does it attract more foreign investment but it may encourage the ECB to put up interest rates, which will directly strengthen the Euro. Otherwise, if economic data is weak, the Euro is likely to fall. Economic data for the four largest economies in the euro area (Germany, France, Italy and Spain) are especially significant, as they account for 75% of the Eurozone’s economy.
Another significant data release for the Euro is the Trade Balance. This indicator measures the difference between what a country earns from its exports and what it spends on imports over a given period. If a country produces highly sought after exports then its currency will gain in value purely from the extra demand created from foreign buyers seeking to purchase these goods. Therefore, a positive net Trade Balance strengthens a currency and vice versa for a negative balance.
-
10:15
AUD/USD: Seems to have enough momentum to retest the 0.6245 – UOB Group
Australian Dollar (AUD) seems to have enough momentum to retest the 0.6245 level; the chance of a sustained rise above this level is not high. In the longer run, upward momentum is building, but AUD must close above 0.6245 before a move to 0.6300 can be expected, UOB Group’s FX analysts Quek Ser Leang and Lee Sue Ann note.
Upward momentum is building for AUD/USD
24-HOUR VIEW: “Although we noted ‘a slight increase in upward momentum’ yesterday, we indicated that ‘this will likely lead to a higher trading range of 0.6170/0.6215 instead of a sustained advance.’ However, instead of trading in a range, AUD soared to 0.6247, pulling back to close higher by 0.52% at 0.6227. Despite the pullback, AUD seems to have enough momentum to retest the 0.6245 level. Given the overbought conditions, the chance of a sustained rise above this major resistance is not high. Note that there is another resistance level at 0.6265. On the downside, support levels are at 0.6205 and 0.6185.”
1-3 WEEKS VIEW: “Yesterday (15 Jan, spot at 0.6190), we revised our AUD view to neutral, indicating that it ‘is expected to trade in a range, probably between 0.6130 and 0.6240.’ We did not anticipate AUD to rise above the upper end of our expected range (high has been 0.6247). Upward momentum is building, but AUD must close above 0.6245 before a sustained rise is likely. The probability of AUD closing above 0.6245 will remain intact as long as the ‘strong support’ level, currently at 0.6170, is not breached. Looking ahead, the next level to watch above 0.6245 is at 0.6300.”
-
10:01
Italy Consumer Price Index (YoY) meets forecasts (1.3%) in December
-
10:01
Italy Consumer Price Index (MoM) in line with expectations (0.1%) in December
-
10:00
Italy Consumer Price Index (EU Norm) (YoY) meets expectations (1.4%) in December
-
10:00
Italy Consumer Price Index (EU Norm) (MoM) in line with forecasts (0.1%) in December
-
09:58
JPY: BoJ hike speculation continues to build – ING
Another day and another set of source stories ahead of next week's Bank of Japan meeting, ING’s FX analyst Chris Turner notes.
Dips may exhaust in the 153/155 area
“Today it was Bloomberg reporting that several officials felt a hike was likely. ING's economist covering Japan, Min Joo Kang, has been highlighting the risk of a January BoJ hike for a while – largely because the wage data has been coming in on the strong side. A 25bp hike in the policy rate to 0.50% is our call for next week.”
“Expectations of a BoJ hike (now priced at 80%) and perhaps fears of more FX intervention in the 158/160 area have helped the yen out-perform. Expect that to continue into next week's BoJ meeting.”
“However, dips may exhaust in the 153/155 area. Our rates team expect US Treasury yields to stay firm all year and the risk of 5%+ 10-year yields over coming months should support $/JPY.”
-
09:55
USD/CAD climbs to 1.4385 amid sliding Oil prices, modest USD strength ahead of US data
- USD/CAD regains positive traction on Thursday and draws support from a combination of factors.
- Retreating Oil prices undermines the Loonie and acts as a tailwind amid reviving USD demand.
- Traders now look to the US monthly Retail Sales and Jobless Claims data for short-term impetus.
The USD/CAD pair builds on the overnight bounce from the 1.4300 mark, over a one-week low and gains strong follow-through positive traction on Thursday. The intraday move up remains unabated through the first half of the European session and lifts spot prices to a fresh daily high, around the 1.4385 region in the last hour.
Crude Oil prices drift lower amid some profit-taking following the recent sharp rise to the highest level since July 2024, which is seen undermining the commodity-linked Loonie. Apart from this, the emergence of some US Dollar (USD) dip-buying, bolstered by growing acceptance that the Federal Reserve (Fed) will pause its rate-cutting cycle later this month, turn out to be a key factors acting as a tailwind for the USD/CAD pair.
Meanwhile, the US Producer Price Index and Consumer Price Index (CPI), released on Tuesday and Wednesday, respectively, pointed to signs of abating inflationary pressures. This, in turn, suggests that the Fed may not necessarily exclude the possibility of cutting rates further by the end of this year, which led to the overnight sharp decline in the US Treasury bond yields and might keep a lid on any further USD move up.
Furthermore, easing fears about US President-elect Donald Trump's disruptive trade tariffs remains supportive of the upbeat market mood. This might further hold back the USD bulls from placing aggressive bets and cap gains for the USD/CAD pair. Traders now look to the US economic docket – featuring monthly Retail Sales, the usual Weekly Initial Jobless Claims and the Philly Fed Manufacturing Index – for a fresh impetus.
Canadian Dollar FAQs
The key factors driving the Canadian Dollar (CAD) are the level of interest rates set by the Bank of Canada (BoC), the price of Oil, Canada’s largest export, the health of its economy, inflation and the Trade Balance, which is the difference between the value of Canada’s exports versus its imports. Other factors include market sentiment – whether investors are taking on more risky assets (risk-on) or seeking safe-havens (risk-off) – with risk-on being CAD-positive. As its largest trading partner, the health of the US economy is also a key factor influencing the Canadian Dollar.
The Bank of Canada (BoC) has a significant influence on the Canadian Dollar by setting the level of interest rates that banks can lend to one another. This influences the level of interest rates for everyone. The main goal of the BoC is to maintain inflation at 1-3% by adjusting interest rates up or down. Relatively higher interest rates tend to be positive for the CAD. The Bank of Canada can also use quantitative easing and tightening to influence credit conditions, with the former CAD-negative and the latter CAD-positive.
The price of Oil is a key factor impacting the value of the Canadian Dollar. Petroleum is Canada’s biggest export, so Oil price tends to have an immediate impact on the CAD value. Generally, if Oil price rises CAD also goes up, as aggregate demand for the currency increases. The opposite is the case if the price of Oil falls. Higher Oil prices also tend to result in a greater likelihood of a positive Trade Balance, which is also supportive of the CAD.
While inflation had always traditionally been thought of as a negative factor for a currency since it lowers the value of money, the opposite has actually been the case in modern times with the relaxation of cross-border capital controls. Higher inflation tends to lead central banks to put up interest rates which attracts more capital inflows from global investors seeking a lucrative place to keep their money. This increases demand for the local currency, which in Canada’s case is the Canadian Dollar.
Macroeconomic data releases gauge the health of the economy and can have an impact on the Canadian Dollar. Indicators such as GDP, Manufacturing and Services PMIs, employment, and consumer sentiment surveys can all influence the direction of the CAD. A strong economy is good for the Canadian Dollar. Not only does it attract more foreign investment but it may encourage the Bank of Canada to put up interest rates, leading to a stronger currency. If economic data is weak, however, the CAD is likely to fall.
-
09:52
DXY: Retail sales tonight – OCBC
US Dollar (USD) fell after core CPI underwhelmed expectations. But the pullback was also quickly retraced. DXY was last seen at 109.09, OCBC’s FX analysts Frances Cheung and Christopher Wong note.
Some risk of pullback not ruled out but
“Markets are likely cautious ahead of Trump inauguration (20 Jan), fearing that tariffs would be announced soon. On Truth social platform, President-elect Trump said that he will create an external revenue service to collect tariffs, duties and all revenue that come from foreign sources.”
“That said, tariff uncertainty remains in terms of timing, magnitude and scope of products. Recent report about the Trump team considering a schedule of gradual tariffs increasing by about 2% to 5% a month is one that may defuse some fears, temporarily.”
“Mild bullish momentum on daily chart faded while RSI eased. Bearish divergence observed on RSI. Some risk of pullback not ruled out but likely to be shallow ahead of event risk. Support at 108.60 (21 DMA), 107.25 (50DMA). Resistance at 110.10, 110.90 levels. Today brings retail sales, Philly fed business outlook.”
-
09:47
USD: Bessent should keep the strong dollar theme alive – ING
Global asset markets have enjoyed a positive 24 hours driven largely by the marginally sub-consensus US core CPI reading for December. US short-dated yields fell 10bp on the view that inflation is not getting any worse. However, sticky headline and core inflation near 3% YoY still cast doubt on the Fed's ability to cut this year and just 36bp of Fed easing is priced for 2025. Last night's release of the Fed's Beige book noted that most of the Fed's 12 districts reported strong holiday sales, which exceeded expectations. Some are also thinking that the weekly initial claims figures are very low. So far, so US Dollar (USD) positive, ING’s FX analyst Chris Turner notes.
DXY can bounce ahead of Trump's inauguration on Monday
“The highlight of the day, however, should be Scott Bessent's nomination hearing in front of the Senate Finance Committee. He's going to be grilled about his views on various key topics, including the USD, tariffs and fiscal sustainability to name a few. In pre-released remarks, he's said he wants to ensure the USD remains the dominant reserve currency and that the 2017 TCJA tax cut be made permanent so there isn't a $4tr increase in taxes. On tariffs, in the run-up to the election, he's said that they are a useful negotiating tool. We also wonder whether Bessent will comment much on how tariffs will contribute to balancing government finances. If tariffs are highlighted as a key tool, then the USD could push back to the highs.”
“No doubt Bessent will be asked about the strong USD. As discussed in this month's edition of FX Talking, the inflation-adjusted DXY is now at its highest level since 1985. We doubt Bessent will want to go anywhere near the subject of a weaker USD, although there is a chance he could discuss the need for trading partners to strengthen their currencies – that's the outside risk today.”
“But that is a hard message to balance against the need for the USD to remain the world's pre-eminent reserve currency. On balance, we think the USD can say bid today. However, DXY moves back towards 110 and could see some profit-taking ahead of Monday's event risk in the form of Trump's inauguration.”
-
09:47
WTI trades near $78.50 after pulling back from six-month highs
- WTI price retreated after reaching the six-month high at $79.37 on Wednesday.
- EIA Crude Oil Stocks Change dropped for the eighth consecutive week, bringing it to its lowest level since April 2022.
- The US has broadened sanctions on Russian Oil producers and tankers, forcing Moscow's customers to seek alternative supplies.
West Texas Intermediate (WTI) Oil price retreats after reaching six-month highs, gaining more than 3%, in the previous session, trading around $78.50 per barrel during the European hours on Thursday. However, crude Oil prices gained ground due to tighter supply concerns and declining US stockpiles.
The US Energy Information Administration (EIA) data showed an eighth consecutive weekly decline in commercial crude inventories, now at their lowest level since April 2022. This represents the longest streak of declines since 2021, with inventories currently at a six-year seasonal low.
Additionally, concerns over potential supply disruptions have intensified due to new US sanctions targeting Russian Oil revenue. The US has expanded sanctions on Russian Oil producers and tankers, prompting Moscow's key customers to search globally for alternative supplies. Meanwhile, shipping rates have also surged as a result.
However, the US Energy Information Administration (EIA), in its Short-Term Energy Outlook report released on Tuesday, indicated that Oil prices are likely to face downward pressure over the next two years as global production growth outpaces demand.
Global Oil demand is now projected to average 104.1 million barrels per day (bpd), revised down from the previous estimate of 104.3 million bpd and still trailing pre-pandemic levels. According to Reuters, many analysts expect an oversupplied Oil market by 2025, driven by a significant slowdown in demand growth in 2024, particularly in the world's largest energy-consuming nations, the US and China.
According to Reuters, Rory Johnston, founder of Commodity Context, stated that the Organization of the Petroleum Exporting Countries and its allies, known collectively as OPEC+, are likely to remain cautious about increasing supply despite the recent surge in Oil prices. OPEC+ has been curtailing output over the past two years to support the market.
WTI Oil FAQs
WTI Oil is a type of Crude Oil sold on international markets. The WTI stands for West Texas Intermediate, one of three major types including Brent and Dubai Crude. WTI is also referred to as “light” and “sweet” because of its relatively low gravity and sulfur content respectively. It is considered a high quality Oil that is easily refined. It is sourced in the United States and distributed via the Cushing hub, which is considered “The Pipeline Crossroads of the World”. It is a benchmark for the Oil market and WTI price is frequently quoted in the media.
Like all assets, supply and demand are the key drivers of WTI Oil price. As such, global growth can be a driver of increased demand and vice versa for weak global growth. Political instability, wars, and sanctions can disrupt supply and impact prices. The decisions of OPEC, a group of major Oil-producing countries, is another key driver of price. The value of the US Dollar influences the price of WTI Crude Oil, since Oil is predominantly traded in US Dollars, thus a weaker US Dollar can make Oil more affordable and vice versa.
The weekly Oil inventory reports published by the American Petroleum Institute (API) and the Energy Information Agency (EIA) impact the price of WTI Oil. Changes in inventories reflect fluctuating supply and demand. If the data shows a drop in inventories it can indicate increased demand, pushing up Oil price. Higher inventories can reflect increased supply, pushing down prices. API’s report is published every Tuesday and EIA’s the day after. Their results are usually similar, falling within 1% of each other 75% of the time. The EIA data is considered more reliable, since it is a government agency.
OPEC (Organization of the Petroleum Exporting Countries) is a group of 12 Oil-producing nations who collectively decide production quotas for member countries at twice-yearly meetings. Their decisions often impact WTI Oil prices. When OPEC decides to lower quotas, it can tighten supply, pushing up Oil prices. When OPEC increases production, it has the opposite effect. OPEC+ refers to an expanded group that includes ten extra non-OPEC members, the most notable of which is Russia.
-
09:31
GBP/USD: Likely to trade in a range between 1.2130 and 1.2390 – UOB Group
Pound Sterling (GBP) may trade in a range, probably between 1.2180 and 1.2290. In the longer run, weakness in GBP has stabilized; it is likely to trade in a range between 1.2130 and 1.2390, UOB Group’s FX analysts Quek Ser Leang and Lee Sue Ann note.
Weakness in GBP stabilizes
24-HOUR VIEW: “Yesterday, we were of view that GBP ‘is likely to trade in a 1.2150/1.2275 range.’ Our view was incorrect, as GBP dipped to 1.2155, soared to 1.2307, and then pulled back sharply to close at 1.2245 (+0.23%). The price action provides no clarity. Today, GBP may trade in a range, probably between 1.2180 and 1.2290.”
1-3 WEEKS VIEW: “We shifted our GBP view to negative late last week (as annotated in the chart below). Tracking the decline, in our latest narrative from two days ago (14 Jan, spot at 1.2230), we highlighted that ‘deeply oversold conditions signal GBP could trade in a range for a couple of days.’ We also highlighted that ‘a breach of 1.2300 (‘strong resistance’ level) would mean that the weakness in has stabilized.’ Yesterday, GBP rose briefly above 1.2300, reaching a high of 1.2307. Although GBP subsequently pulled back from the high, downward momentum has largely eased. In other words, the weakness in GBP has stabilized. For the time being, we expect GBP to trade in a range, most likely between 1.2130 and 1.2390.”
-
09:27
EUR: Reluctant to unwind its under-valuation – ING
A common theme running amongst FX strategists like ourselves is that EUR/USD has recently been undershooting levels normally suggested by short-term rate differentials. We run a short-term Financial Fair Value model. Other banks will have their own measures. The common theme is that most are saying rate differentials should justify EUR/USD closer to 1.05, ING’s FX analyst Chris Turner notes.
Strong USD can push EUR/USD back to 1.0225/50
“Yesterday provided a great opportunity for EUR/USD to rally. Two-year rate spreads narrowed 5bp on the 0.2% reading on core US CPI. Yet EUR/USD struggled to hold the rally to 1.0350. Not very impressive and perhaps represents a conviction view that the eurozone and the euro will underperform this year on weak growth and weak leadership in the region.”
“We also note that current speculative short positioning seems much more extreme in currencies like the Canadian, Australian and New Zealand dollars than it does in the euro. This suggests that EUR/CAD, EUR/AUD and EUR/NZD could all come lower if Trump does not deliver as aggressive a tariff package as some expect next week.”
“The strong US Dollar (USD) environment could push EUR/USD back to 1.0225/50 today. But we suspect that some buying may emerge there as investors lighten positions ahead of Monday's event risk.”
-
09:22
EUR/USD: Likely to trade between 1.0220 and 1.0400 – UOB Group
Euro (EUR) is expected to consolidate in a 1.0255/1.0345 range. In the longer run, EUR has entered a range trading phase; it is likely to trade between 1.0220 and 1.0400 for the time being, UOB Group’s FX analysts Quek Ser Leang and Lee Sue Ann note.
EUR has entered a range trading phase
24-HOUR VIEW: “When EUR was at 1.0300 in early Asian trade yesterday, we noted that ‘there has been a tentative buildup in momentum.’ We indicated that EUR ‘could rise to 1.0325, potentially reaching 1.0350.’ Our outlook was validated, as EUR rose to 1.0354 before pulling back quickly to close slightly lower by 0.17% at 1.0289. The brief advance did not result in any increase in momentum. The current price movements are likely part of a consolidation phase. Today, we expect EUR to trade in a 1.0255/1.0345 range.”
1-3 WEEKS VIEW: “Our update from yesterday (15 Jan, spot at 1.0300) remains valid. As highlighted, EUR has likely entered a range trading phase, and it is likely to trade between 1.0220 and 1.0400 for the time being.”
-
09:09
Pound Sterling retraces on slower than projected UK GDP growth, weak factory data
- The Pound Sterling drops as the UK GDP rose at a slower-than-expected pace, and factory activity contracted in November.
- Traders have raised BoE dovish bets for February’s policy meeting.
- Investors await the US weekly jobless claims and Retail Sales data for December on Thursday.
The Pound Sterling faces selling pressure in Thursday’s European session after the release of the United Kingdom's (UK) monthly Gross Domestic Product (GDP) and factory data for November. The Office for National Statistics (ONS) reported that the economy returned to growth after contracting in October. However, the growth rate was slower than projected. The economy rose by 0.1% after declining at a similar pace in October. Economists expected the economy to have expanded by 0.2%.
Both Manufacturing and Industrial Production data contracted in November on a monthly as well as annual basis. Month-on-month, Industrial and Manufacturing Production contracted by 0.4% and 0.3%, respectively. The pace of decline was slower than that seen in October. Economists expected Industrial Production to have grown by 0.1%, while Manufacturing Production was estimated to have remained flat.
Signs of continuous weakness in the UK factory activity suggest that producers are not fully utilizing their operating capacity on the assumption that the already weak demand environment will worsen further after United States (US) President-elect Donald Trump slaps hefty import tariffs globally once he takes office.
However, growing expectations that the Bank of England’s (BoE) monetary policy easing will be less gradual this year would offer some relief for factory owners. Traders have raised BoE dovish bets after the release of the UK Consumer Price Index (CPI) data for December on Wednesday, which showed signs of cooling price pressures.
Traders see a roughly 84% chance that the BoE will reduce interest rates by 25 basis points (bps) to 4.5% at its policy meeting in February.
Cooling price pressures have offered some relief to Chancellor of the Exchequer Rachel Reeves as they led to a pause in the rally in yields on UK gilts. 30-year UK gilt yields have corrected to 5.28% from their more-than-26-year high of 5.47%. The British currency has faced a significant decline in the last few trading days as soaring UK gilt yields due to uncertainty over the economic outlook.
Daily digest market movers: Pound Sterling struggles against US Dollar
- The Pound Sterling drops to near 1.2200 against the US Dollar (USD) in European trading hours. The GBP/USD pair falls due to weak UK data. However, the US Dollar consolidates, with the US Dollar Index (DXY) wobbling around 109.00. The USD Index turns sideways as traders reassess expectations for the Federal Reserve’s (Fed) likely interest rate action for the entire year.
- Market participants expect the Fed’s policy-easing path to be less gradual than anticipated earlier. Expectations for the Fed policy outlook were impacted after the release of the United States (US) inflation data for December on Wednesday, which showed that the progress in the disinflation trend has not stalled yet.
- According to the CME FedWatch tool, traders expect the Fed to deliver more than one interest rate cut this year and anticipate the first reduction in June. Before December’s inflation data, traders were anticipating only one interest rate reduction in September.
- For more cues on the interest rate outlook, investors will focus on the US Initial Jobless Claims data for the week ending January 10 and the Retail Sales data for December, which will be published at 13:30 GMT.
Technical Analysis: Pound Sterling remains weak as 20-day EMA slops downwards
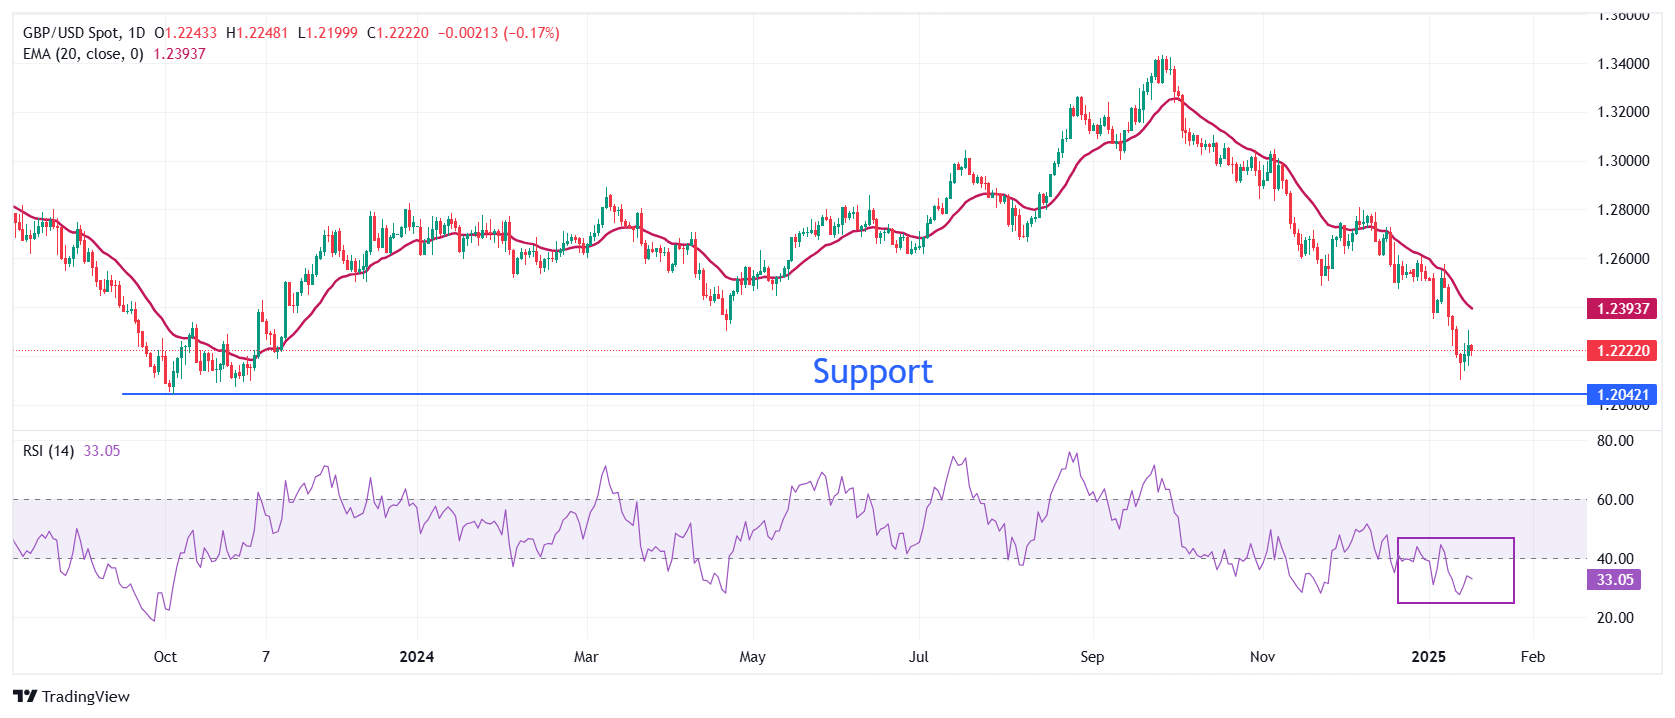
The Pound Sterling trades near the key level of 1.2200 against the US Dollar on Thursday. The outlook for the Cable remains weak as the vertically declining 20-day Exponential Moving Average (EMA) near 1.2394 suggests that the near-term trend is extremely bearish.
The 14-day Relative Strength Index (RSI) rebounds slightly after diving below 30.00 as the momentum oscillator turned oversold. However, the broader scenario remains bearish until it recovers inside the 20.00-40.00 range.
Looking down, the pair is expected to find support near the October 2023 low of 1.2050. On the upside, the 20-day EMA will act as key resistance.
Pound Sterling FAQs
The Pound Sterling (GBP) is the oldest currency in the world (886 AD) and the official currency of the United Kingdom. It is the fourth most traded unit for foreign exchange (FX) in the world, accounting for 12% of all transactions, averaging $630 billion a day, according to 2022 data. Its key trading pairs are GBP/USD, also known as ‘Cable’, which accounts for 11% of FX, GBP/JPY, or the ‘Dragon’ as it is known by traders (3%), and EUR/GBP (2%). The Pound Sterling is issued by the Bank of England (BoE).
The single most important factor influencing the value of the Pound Sterling is monetary policy decided by the Bank of England. The BoE bases its decisions on whether it has achieved its primary goal of “price stability” – a steady inflation rate of around 2%. Its primary tool for achieving this is the adjustment of interest rates. When inflation is too high, the BoE will try to rein it in by raising interest rates, making it more expensive for people and businesses to access credit. This is generally positive for GBP, as higher interest rates make the UK a more attractive place for global investors to park their money. When inflation falls too low it is a sign economic growth is slowing. In this scenario, the BoE will consider lowering interest rates to cheapen credit so businesses will borrow more to invest in growth-generating projects.
Data releases gauge the health of the economy and can impact the value of the Pound Sterling. Indicators such as GDP, Manufacturing and Services PMIs, and employment can all influence the direction of the GBP. A strong economy is good for Sterling. Not only does it attract more foreign investment but it may encourage the BoE to put up interest rates, which will directly strengthen GBP. Otherwise, if economic data is weak, the Pound Sterling is likely to fall.
Another significant data release for the Pound Sterling is the Trade Balance. This indicator measures the difference between what a country earns from its exports and what it spends on imports over a given period. If a country produces highly sought-after exports, its currency will benefit purely from the extra demand created from foreign buyers seeking to purchase these goods. Therefore, a positive net Trade Balance strengthens a currency and vice versa for a negative balance.
-
09:07
NZD/USD Price Forecast: Maintains position above nine-day EMA near 0.5600
- NZD/USD tests the nine-day EMA at 0.5604, followed by the psychological level of 0.5600.
- The short-term price momentum is improved as the pair moves above the nine-day EMA.
- The pair finds its initial resistance at the 14-day EMA of 0.5614 level.
The NZD/USD pair breaks its three-day winning streak, trading around 0.5610 during the European hours on Thursday. The technical analysis of the daily chart indicates a persistent bearish bias as the pair is confined within a descending channel pattern.
The 14-day Relative Strength Index (RSI) remains below the 50 level, signaling an ongoing bearish bias. However, the NZD/USD pair moves above nine-day Exponential Moving Averages (EMA), reflecting an improvement in the short-term price momentum.
Regarding its support, the NZD/USD pair tests immediate nine-day EMA at 0.5604, aligned with the psychological level of 0.5600. A break below this level could lead the pair to navigate the region around its support area at 0.5526—its lowest point since October 2022, reached on December 25. Further support appears near the lower edge of its descending channel at the 0.5500 level.
On the upside, the NZD/USD pair tests initial resistance at the 14-day EMA at 0.5614 level. A break above this level could improve the short-term price momentum and support the pair to test the descending channel’s upper boundary at the psychological level of 0.5660 level.
NZD/USD: Daily Chart
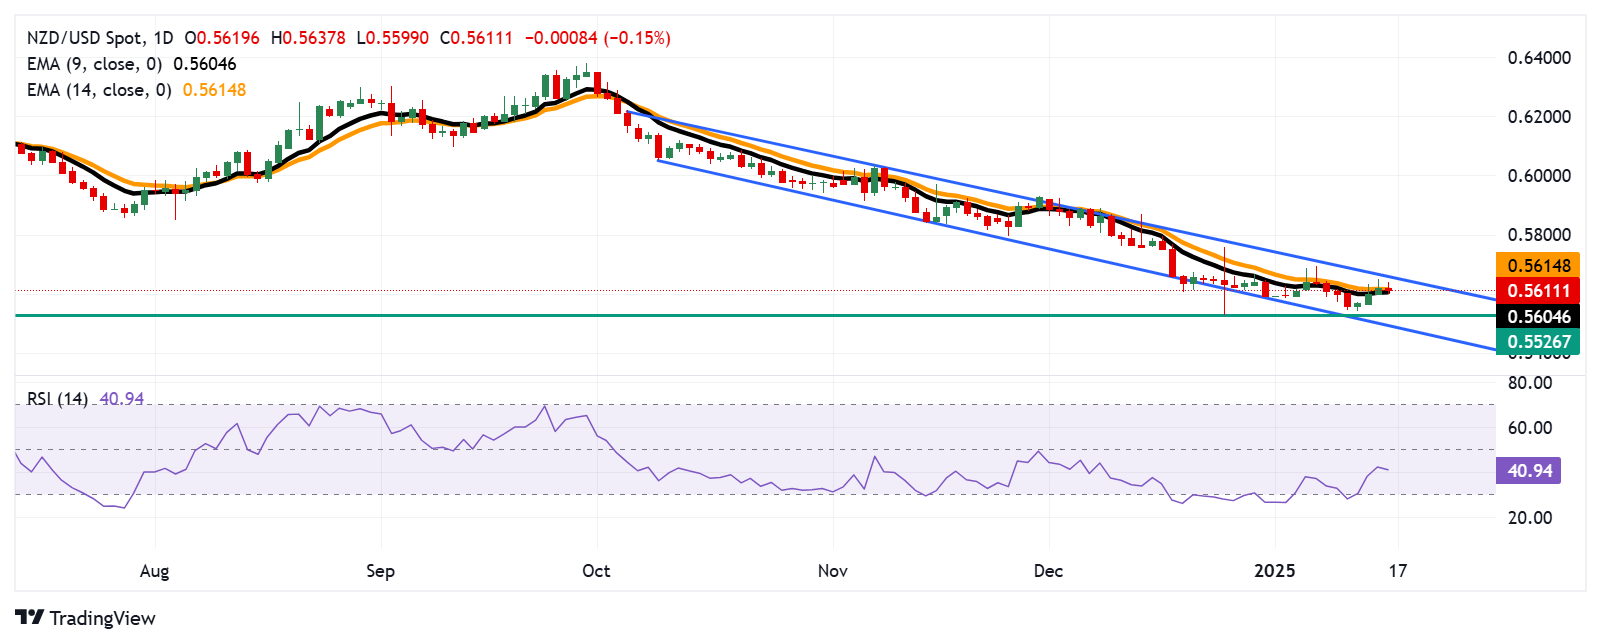
New Zealand Dollar PRICE Today
The table below shows the percentage change of New Zealand Dollar (NZD) against listed major currencies today. New Zealand Dollar was the weakest against the Japanese Yen.
USD EUR GBP JPY CAD AUD NZD CHF USD -0.01% 0.19% -0.25% 0.22% 0.18% 0.16% -0.11% EUR 0.01% 0.20% -0.24% 0.23% 0.19% 0.17% -0.10% GBP -0.19% -0.20% -0.40% 0.03% -0.01% -0.03% -0.30% JPY 0.25% 0.24% 0.40% 0.49% 0.44% 0.38% 0.16% CAD -0.22% -0.23% -0.03% -0.49% -0.04% -0.07% -0.33% AUD -0.18% -0.19% 0.01% -0.44% 0.04% -0.02% -0.28% NZD -0.16% -0.17% 0.03% -0.38% 0.07% 0.02% -0.26% CHF 0.11% 0.10% 0.30% -0.16% 0.33% 0.28% 0.26% The heat map shows percentage changes of major currencies against each other. The base currency is picked from the left column, while the quote currency is picked from the top row. For example, if you pick the New Zealand Dollar from the left column and move along the horizontal line to the US Dollar, the percentage change displayed in the box will represent NZD (base)/USD (quote).
-
08:51
Forex Today: Dollar struggles amid upbeat mood, ahead of high-impact US data
Here is what you need to know on Thursday, January 16:
Risk-off flows remain in vogue in the early European session on Thursday, with the US Dollar (USD) struggling alongside the US Treasury bond yields. The market optimism is linked to the revival of expectations that the US Federal Reserve (Fed) would remain on track for two interest rate cuts this year in light of tame inflation figures.
US Consumer Price Index (CPI) rose in line with estimates at an annual rate of 2.9% in December from November's 2.7%. However, core CPI, which excludes food and energy prices, rose by 3.2%, below forecasts of 3.3%. Earlier in the week, the US annual Producer Price Index (PPI) rose 3.3% in December, missing the expected 3.4% growth.
The dovish Fed bets, hopes for more Chinese stimulus and easing fears over potential disruptive trade tariffs under Donald Trump’s presidency lift investors’ sentiment while diminishing the USD’s safe-haven appeal.
However, FX majors fail to capitalize on the risk-on sentiment and a subdued USD, the Australian Dollar (AUD) and the Japanese Yen (JPY) emerging as the weakest currencies across the FX board. AUD/USD is closing in on the 0.6200 level after spiking to 0.6250 in a knee-jerk reaction to strong Australian employment change data. However, the uptick in the OZ Unemployment Rate added to the bets of early easing by the Reserve Bank of Australia (RBA).
Meanwhile, USD/JPY witnessed another volatile Asian session on Thursday, initially falling hard from 156.00 to 155.20 on mounting expectations that the Bank of Japan (BoJ) will hike interest rates next week. Citing unnamed sources, Bloomberg reported that the Japanese central bank is expected to raise rates next week, barring a major market rout following US President-elect Donald Trump’s inauguration. USD/JPY buyers returned with a bang and recaptured 156.00 following BoJ Governor Kazuo Ueda’s commentary.
The Pound Sterling maintains its offered tone, leaving GBP/USD gyrating near 1.2200 as traders digest the disappointing UK Gross Domestic Product (GDP) and Industrial Production data for November. The UK economy expanded at a monthly pace of 0.1% in November, below the forecast of +0.2%. Other data from the UK showed that monthly Industrial and Manufacturing Production dropped by 0.4% and 0.3%, respectively, in November. Both readings surprised markets to the downside.
EUR/USD defends minor bids near 1.0300 after failing to resist above the latter, courtesy of the improved market mood. But the further upside appears limited amid dovish European Central Bank (ECB) expectations and ahead of the ECB Policy Accounts of the December meeting. The pair also trades with caution before the release of the US Retail Sales and Jobless Claims data.
USD/CAD stays supported above 1.4350 as Oil price consolidates its rally to six-month highs. WTI oil price is down 0.45% on the day, trading below $79 as of writing.
Gold price rebounds to test $2,700 in the European session, reversing a brief dip to $2,690.
US Dollar PRICE Today
The table below shows the percentage change of US Dollar (USD) against listed major currencies today. US Dollar was the weakest against the Japanese Yen.
USD EUR GBP JPY CAD AUD NZD CHF USD -0.02% 0.20% -0.27% 0.18% 0.19% 0.16% -0.10% EUR 0.02% 0.22% -0.24% 0.20% 0.21% 0.18% -0.08% GBP -0.20% -0.22% -0.44% -0.02% -0.01% -0.05% -0.30% JPY 0.27% 0.24% 0.44% 0.42% 0.43% 0.35% 0.14% CAD -0.18% -0.20% 0.02% -0.42% 0.02% -0.03% -0.28% AUD -0.19% -0.21% 0.01% -0.43% -0.02% -0.03% -0.29% NZD -0.16% -0.18% 0.05% -0.35% 0.03% 0.03% -0.25% CHF 0.10% 0.08% 0.30% -0.14% 0.28% 0.29% 0.25% The heat map shows percentage changes of major currencies against each other. The base currency is picked from the left column, while the quote currency is picked from the top row. For example, if you pick the US Dollar from the left column and move along the horizontal line to the Japanese Yen, the percentage change displayed in the box will represent USD (base)/JPY (quote).
-
08:32
GBP/JPY remains tepid near 190.50 following key economic figures from United Kingdom
- GBP/USD remains under pressure as UK GDP shows growth in December but falls short of market expectations.
- The yield on the UK 10-year Gilt dropped to 4.73%, pulling back from multi-decade highs.
- The Japanese Yen strengthens as expectations rise for the BoJ to raise interest rates next week.
GBP/JPY continues to lose ground for the second successive day, trading around 190.60 during the early European hours. The GBP/JPY cross loses ground as the Pound Sterling (GBP) faces challenges following the disappointing economic data from the United Kingdom (UK) on Thursday.
The UK economy returned to growth in November, with Gross Domestic Product (GDP) rising by 0.1%, following a 0.1% contraction in October. However, this fell short of market expectations for a 0.2% expansion.
Meanwhile, the Index of Services for October remained unchanged at 0% 3M/3M, compared to October's 0.1%. In November, Monthly Industrial and Manufacturing Production declined by 0.4% and 0.3%, respectively, with both readings coming in below market expectations.
Additionally, the GBP received downward pressure as the yield on the UK 10-year Gilt fell to 4.73%, retreating from multi-decade highs, after official data showed an unexpected drop in headline UK inflation, increasing expectations of rate cuts by the Bank of England (BoE).
The UK Consumer Price Index (CPI) increased by 2.5% year-over-year in December, down from 2.6% in November and below the market forecast of 2.7%. Despite the slowdown, the figure remained above the Bank of England’s (BoE) 2% target.
Moreover, the Japanese Yen (JPY) appreciates amid growing expectations that the Bank of Japan (BoJ) will hike interest rates next week. These speculations have driven yields on Japanese Government Bonds (JGBs) to multi-year highs.
Bloomberg reported on Thursday, citing unnamed sources, that the BoJ is likely to raise interest rates next week unless a significant market disruption occurs following the inauguration of US President-elect Donald Trump.
BoJ Governor Kazuo Ueda reiterated that the central bank will discuss the possibility of a rate hike next week and may increase the policy rate this year if economic and inflation conditions continue to improve. Key factors influencing the BoJ’s decision include the policy direction of the new US administration and domestic wage negotiations.
Economic Indicator
Gross Domestic Product (MoM)
The Gross Domestic Product (GDP), released by the Office for National Statistics on a monthly and quarterly basis, is a measure of the total value of all goods and services produced in the UK during a given period. The GDP is considered as the main measure of UK economic activity. The MoM reading compares economic activity in the reference month to the previous month. Generally, a rise in this indicator is bullish for the Pound Sterling (GBP), while a low reading is seen as bearish.
Read more.Last release: Thu Jan 16, 2025 07:00
Frequency: Monthly
Actual: 0.1%
Consensus: 0.2%
Previous: -0.1%
Source: Office for National Statistics
-
08:17
EUR/GBP sticks to gains around 0.8635-0.8640 area after UK data/German CPI
- EUR/GBP regains positive traction and draws support from a combination of factors.
- The mixed UK macro data lifts BoE rate cut bets and undermines the British Pound.
- Higher German core CPI lends some support to the shared currency and spot prices.
The EUR/GBP cross attracts fresh buyers near the 0.8400 mark and stalls the previous day's sharp retracement slide from its highest level since August 23. Spot prices stick to positive bias around the 0.8435-0.8440 region following the release of the UK macro data and the final German Consumer Price Index (CPI) print.
The UK Office for National Statistics (ONS) reported that the economy returned to expansion and grew 0.1% in November after declining 0.1% in the previous month. Other data from the UK showed that monthly Industrial and Manufacturing Production dropped more than expected, by 0.4% and 0.3%, respectively, in November. This comes on top of Wednesday's softer consumer inflation figures from the UK and offers the Bank of England (BoE) an opportunity to cut interest rates in February. Adding to this concerns about the UK’s fiscal situation and the risk of stagflation – a combination of high inflation and weak economic growth – undermine the British Pound (GBP).
The shared currency, on the other hand, draws some support from a rise in German core annual inflation, which crept higher to 3.3% in December from 3.0% in the previous month. This turns out to be another factor that remains supportive of the bid tone surrounding the EUR/GBP cross. The data, however, raises stagflation worries for the Eurozone's largest economy and reaffirms expectations for further interest rate cuts by the European Central Bank (ECB). This might cap gains for the Euro and warrants some caution for bullish traders around the currency pair, making it prudent to wait for acceptance above the very important 200-day SMA before placing fresh bets.
Economic Indicator
Gross Domestic Product (MoM)
The Gross Domestic Product (GDP), released by the Office for National Statistics on a monthly and quarterly basis, is a measure of the total value of all goods and services produced in the UK during a given period. The GDP is considered as the main measure of UK economic activity. The MoM reading compares economic activity in the reference month to the previous month. Generally, a rise in this indicator is bullish for the Pound Sterling (GBP), while a low reading is seen as bearish.
Read more.Last release: Thu Jan 16, 2025 07:00
Frequency: Monthly
Actual: 0.1%
Consensus: 0.2%
Previous: -0.1%
Source: Office for National Statistics
-
08:03
United Kingdom Total Trade Balance fell from previous £-3.718B to £-4.757B in November
-
08:03
United Kingdom Total Trade Balance declined to £-4.76B in November from previous £-3.718B
-
08:01
United Kingdom Goods Trade Balance came in at £-19.311B, below expectations (£-17.9B) in November
-
08:01
Germany Consumer Price Index (YoY) meets forecasts (2.6%) in December
-
08:01
United Kingdom Index of Services (3M/3M) below forecasts (0.1%) in November: Actual (0%)
-
08:01
United Kingdom Industrial Production (MoM) below expectations (0.1%) in November: Actual (-0.4%)
-
08:01
United Kingdom Industrial Production (YoY) came in at -1.8%, below expectations (-1%) in November
-
08:01
UK GDP rebounds 0.1% MoM in November vs. 0.2% expected
- UK GDP jumped 0.1% MoM in November, missing the forecast.
- GBP/USD retests 1.2200 after the UK economic data.
The UK economy returned to expansion, with the Gross Domestic Product (GDP) arriving at 0.1% in November after declining 0.1% in October, according to the latest data published by the Office for National Statistics (ONS) on Thursday. Markets expected a 0.2% growth in the reported period.
Meanwhile, the Index of services (October) came in at 0% 3M/3M versus October’s 0.1%.
Other data from the UK showed that monthly Industrial and Manufacturing Production dropped by 0.4% and 0.3%, respectively, in November. Both readings surprised markets to the downside.
Separately, the UK Goods Trade Balance came in at GBP-19.311 billion MoM in the same period vs. GBP-17.9 billion expected and GBP-19.327 billion previous.
Market reaction to the UK data
The UK economic data refuelled the downside in the Pound Sterling. At the press time, GBP/USD is trading 0.29% lower on the day near 1.2200.
British Pound PRICE Today
The table below shows the percentage change of British Pound (GBP) against listed major currencies today. British Pound was the weakest against the Japanese Yen.
USD EUR GBP JPY CAD AUD NZD CHF USD 0.08% 0.31% -0.23% 0.22% 0.35% 0.29% -0.06% EUR -0.08% 0.22% -0.29% 0.14% 0.27% 0.21% -0.13% GBP -0.31% -0.22% -0.53% -0.08% 0.05% -0.02% -0.35% JPY 0.23% 0.29% 0.53% 0.44% 0.56% 0.45% 0.16% CAD -0.22% -0.14% 0.08% -0.44% 0.14% 0.06% -0.27% AUD -0.35% -0.27% -0.05% -0.56% -0.14% -0.06% -0.39% NZD -0.29% -0.21% 0.02% -0.45% -0.06% 0.06% -0.33% CHF 0.06% 0.13% 0.35% -0.16% 0.27% 0.39% 0.33% The heat map shows percentage changes of major currencies against each other. The base currency is picked from the left column, while the quote currency is picked from the top row. For example, if you pick the British Pound from the left column and move along the horizontal line to the US Dollar, the percentage change displayed in the box will represent GBP (base)/USD (quote).
-
08:00
Germany Harmonized Index of Consumer Prices (MoM) meets forecasts (0.7%) in December
-
08:00
Germany Harmonized Index of Consumer Prices (YoY) meets forecasts (2.8%) in December
-
08:00
Germany Consumer Price Index (MoM) above forecasts (0.4%) in December: Actual (0.5%)
-
08:00
United Kingdom Trade Balance; non-EU declined to £-7.72B in November from previous £-7.277B
-
08:00
United Kingdom Manufacturing Production (MoM) came in at -0.3%, below expectations (0%) in November
-
08:00
United Kingdom Manufacturing Production (YoY) below expectations (-0.4%) in November: Actual (-1.2%)
-
08:00
United Kingdom Goods Trade Balance below expectations (£-17.9B) in November: Actual (£-19.31B)
-
08:00
United Kingdom Gross Domestic Product (MoM) came in at 0.1%, below expectations (0.2%) in November
-
07:51
USD/CHF holds steady above 0.9100 as cooling US inflation keeps Fed on track for rate cuts
- USD/CHF flat lines near 0.9125 in Thursday’s early European session.
- Softer US CPI inflation sparks speculation about future Fed rate cuts.
- The uncertainties and geopolitical risks could boost the safe-haven currency like the CHF.
The USD/CHF pair trades on a flat note around 0.9125 during the early European trading hours on Thursday. The Greenback struggles to gain ground after cooler US inflation data heightens the expectations of potential Federal Reserve (Fed) rate cuts. Traders await the US December Retail Sales and weekly Initial Jobless Claims, which will be published later on Thursday.
The Bureau of Labor Statistics revealed on Thursday that the US Consumer Price Index (CPI) climbed 2.9% YoY in December versus 2.7% prior. This reading was in line with forecasts. Meanwhile, the US core CPI, which excludes volatile food and energy prices, rose 3.2% YoY in December, slightly softer than the 3.3% expected.
Futures pricing continued to imply a near certainty that the Fed would hold the interest rate steady at its January 28-29 meeting but priced in a nearly 50% chance of two rate cuts through the year, according to the CME FedWatch tool. The markets anticipate the next reductions likely will happen in May or June.
Israel and Hamas have agreed to a deal that will pause the war in Gaza following 15 months of war. The agreement would come into effect on Sunday so long as it was approved by the Israeli cabinet, per CNN. Investors will closely monitor the development surrounding the geopolitical risks. Any signs of escalating tensions in the Middle East could boost the safe-haven flows, benefiting the Swiss Franc (CHF).Swiss Franc FAQs
The Swiss Franc (CHF) is Switzerland’s official currency. It is among the top ten most traded currencies globally, reaching volumes that well exceed the size of the Swiss economy. Its value is determined by the broad market sentiment, the country’s economic health or action taken by the Swiss National Bank (SNB), among other factors. Between 2011 and 2015, the Swiss Franc was pegged to the Euro (EUR). The peg was abruptly removed, resulting in a more than 20% increase in the Franc’s value, causing a turmoil in markets. Even though the peg isn’t in force anymore, CHF fortunes tend to be highly correlated with the Euro ones due to the high dependency of the Swiss economy on the neighboring Eurozone.
The Swiss Franc (CHF) is considered a safe-haven asset, or a currency that investors tend to buy in times of market stress. This is due to the perceived status of Switzerland in the world: a stable economy, a strong export sector, big central bank reserves or a longstanding political stance towards neutrality in global conflicts make the country’s currency a good choice for investors fleeing from risks. Turbulent times are likely to strengthen CHF value against other currencies that are seen as more risky to invest in.
The Swiss National Bank (SNB) meets four times a year – once every quarter, less than other major central banks – to decide on monetary policy. The bank aims for an annual inflation rate of less than 2%. When inflation is above target or forecasted to be above target in the foreseeable future, the bank will attempt to tame price growth by raising its policy rate. Higher interest rates are generally positive for the Swiss Franc (CHF) as they lead to higher yields, making the country a more attractive place for investors. On the contrary, lower interest rates tend to weaken CHF.
Macroeconomic data releases in Switzerland are key to assessing the state of the economy and can impact the Swiss Franc’s (CHF) valuation. The Swiss economy is broadly stable, but any sudden change in economic growth, inflation, current account or the central bank’s currency reserves have the potential to trigger moves in CHF. Generally, high economic growth, low unemployment and high confidence are good for CHF. Conversely, if economic data points to weakening momentum, CHF is likely to depreciate.
As a small and open economy, Switzerland is heavily dependent on the health of the neighboring Eurozone economies. The broader European Union is Switzerland’s main economic partner and a key political ally, so macroeconomic and monetary policy stability in the Eurozone is essential for Switzerland and, thus, for the Swiss Franc (CHF). With such dependency, some models suggest that the correlation between the fortunes of the Euro (EUR) and the CHF is more than 90%, or close to perfect.
-
07:19
FX option expiries for Jan 16 NY cut
FX option expiries for Jan 16 NY cut at 10:00 Eastern Time via DTCC can be found below.
EUR/USD: EUR amounts
- 1.0050 2b
- 1.0200 840m
- 1.0335 1.2b
- 1.0350 1.4b
- 1.0400 820m
GBP/USD: GBP amounts
- 1.2100 784m
- 1.2450 509m
USD/JPY: USD amounts
- 156.00 625m
- 157.00 1b
USD/CAD: USD amounts
- 1.4300 761m
- 1.4500 1.2b
-
06:31
EUR/USD moves below 1.0300 due to dovish sentiment surrounding ECB, US Retail Sales eyed
- EUR/USD struggles as the ECB could implement additional policy easing amid a weak economic outlook in the Eurozone.
- The US Dollar depreciated as speculation grew that the Fed may implement two interest rate cuts this year.
- US Retail Sales could increase by 0.6% month-over-month in December, against the previous 0.7% growth.
EUR/USD extends losses for the second successive session, trading around 1.0280 during the Asian hours on Thursday. The EUR/USD pair faces downward pressure as European Central Bank (ECB) officials continue to reinforce market expectations of further policy easing, driven by the Eurozone's weak economic outlook.
At a conference on Monday, ECB policymaker and Bank of Finland Governor Olli Rehn stated that he anticipates monetary policy will exit restrictive territory within the coming months, likely by “midsummer.”
However, the EUR/USD pair gained ground as the US Dollar (USD) extended its decline following the cooler-than-expected US Consumer Price Index (CPI) inflation data for December, which heightened speculation that the US Federal Reserve (Fed) could implement two interest rate cuts this year.
The US CPI rose by 2.9% year-over-year in December, up from 2.7% in November, matching market expectations. The monthly CPI increased by 0.4%, following a 0.3% rise in November. US Core CPI, excluding volatile food and energy prices, increased by 3.2% annually in December, slightly below both the previous month's 3.3% and analysts' forecast of 3.3%. Core CPI edged up by 0.2% month-over-month in December 2024.
The Federal Reserve reported in its latest Beige Book survey, released on Wednesday, that economic activity saw slight to moderate growth across the twelve Federal Reserve Districts in late November and December. Consumer spending increased moderately, driven by strong holiday sales that surpassed expectations. However, manufacturing activity experienced a slight decline overall, as some manufacturers stockpiled inventories in anticipation of higher tariffs.
Euro FAQs
The Euro is the currency for the 19 European Union countries that belong to the Eurozone. It is the second most heavily traded currency in the world behind the US Dollar. In 2022, it accounted for 31% of all foreign exchange transactions, with an average daily turnover of over $2.2 trillion a day. EUR/USD is the most heavily traded currency pair in the world, accounting for an estimated 30% off all transactions, followed by EUR/JPY (4%), EUR/GBP (3%) and EUR/AUD (2%).
The European Central Bank (ECB) in Frankfurt, Germany, is the reserve bank for the Eurozone. The ECB sets interest rates and manages monetary policy. The ECB’s primary mandate is to maintain price stability, which means either controlling inflation or stimulating growth. Its primary tool is the raising or lowering of interest rates. Relatively high interest rates – or the expectation of higher rates – will usually benefit the Euro and vice versa. The ECB Governing Council makes monetary policy decisions at meetings held eight times a year. Decisions are made by heads of the Eurozone national banks and six permanent members, including the President of the ECB, Christine Lagarde.
Eurozone inflation data, measured by the Harmonized Index of Consumer Prices (HICP), is an important econometric for the Euro. If inflation rises more than expected, especially if above the ECB’s 2% target, it obliges the ECB to raise interest rates to bring it back under control. Relatively high interest rates compared to its counterparts will usually benefit the Euro, as it makes the region more attractive as a place for global investors to park their money.
Data releases gauge the health of the economy and can impact on the Euro. Indicators such as GDP, Manufacturing and Services PMIs, employment, and consumer sentiment surveys can all influence the direction of the single currency. A strong economy is good for the Euro. Not only does it attract more foreign investment but it may encourage the ECB to put up interest rates, which will directly strengthen the Euro. Otherwise, if economic data is weak, the Euro is likely to fall. Economic data for the four largest economies in the euro area (Germany, France, Italy and Spain) are especially significant, as they account for 75% of the Eurozone’s economy.
Another significant data release for the Euro is the Trade Balance. This indicator measures the difference between what a country earns from its exports and what it spends on imports over a given period. If a country produces highly sought after exports then its currency will gain in value purely from the extra demand created from foreign buyers seeking to purchase these goods. Therefore, a positive net Trade Balance strengthens a currency and vice versa for a negative balance.
-
06:31
Netherlands, The Unemployment Rate s.a (3M) remains unchanged at 3.7% in December
-
06:27
USD/CAD Price Forecast: The first upside barrier emerges above 1.4400
- USD/CAD rebounds to around 1.4355 in Thursday’s early European session.
- The negative outlook prevails below the 100-period EMA with the bearish RSI indicator.
- The initial support level is located at 1.4322; the first upside barrier emerges at the 1.4400-1.4410 region.
The USD/CAD pair recovers to 1.4355, snapping the three-day losing streak during the early European session on Thursday. The renewed US Dollar (USD) demand provides some support to the pair. However, a rise in crude oil prices might boost the commodity-linked Loonie and cap the upside for the pair.
According to the 4-hour chart, the bearish outlook of USD/CAD remains intact as the pair is below the key 100-period Exponential Moving Average (EMA). If the pair decisively crosses above this level, it could resume its upside. However, the Relative Strength Index (RSI) stands below the midline near 45.80, suggesting that further downside cannot be ruled out in the near term.
The initial support level for USD/CAD is located at 1.4322, the low of January 16. Extended losses could expose 1.4300, representing the lower limit of the Bollinger Band and psychological level. The additional downside filter to watch is 1.4279, the low of January 6.
On the other hand, sustained trading above the key 100-period EMA could see a rally to the 1.4400-1.4410 zone, the round mark and the high of January 14. Further north, the next hurdle to watch is 1.4442, the upper boundary of the Bollinger Band.USD/CAD 4-hour chart
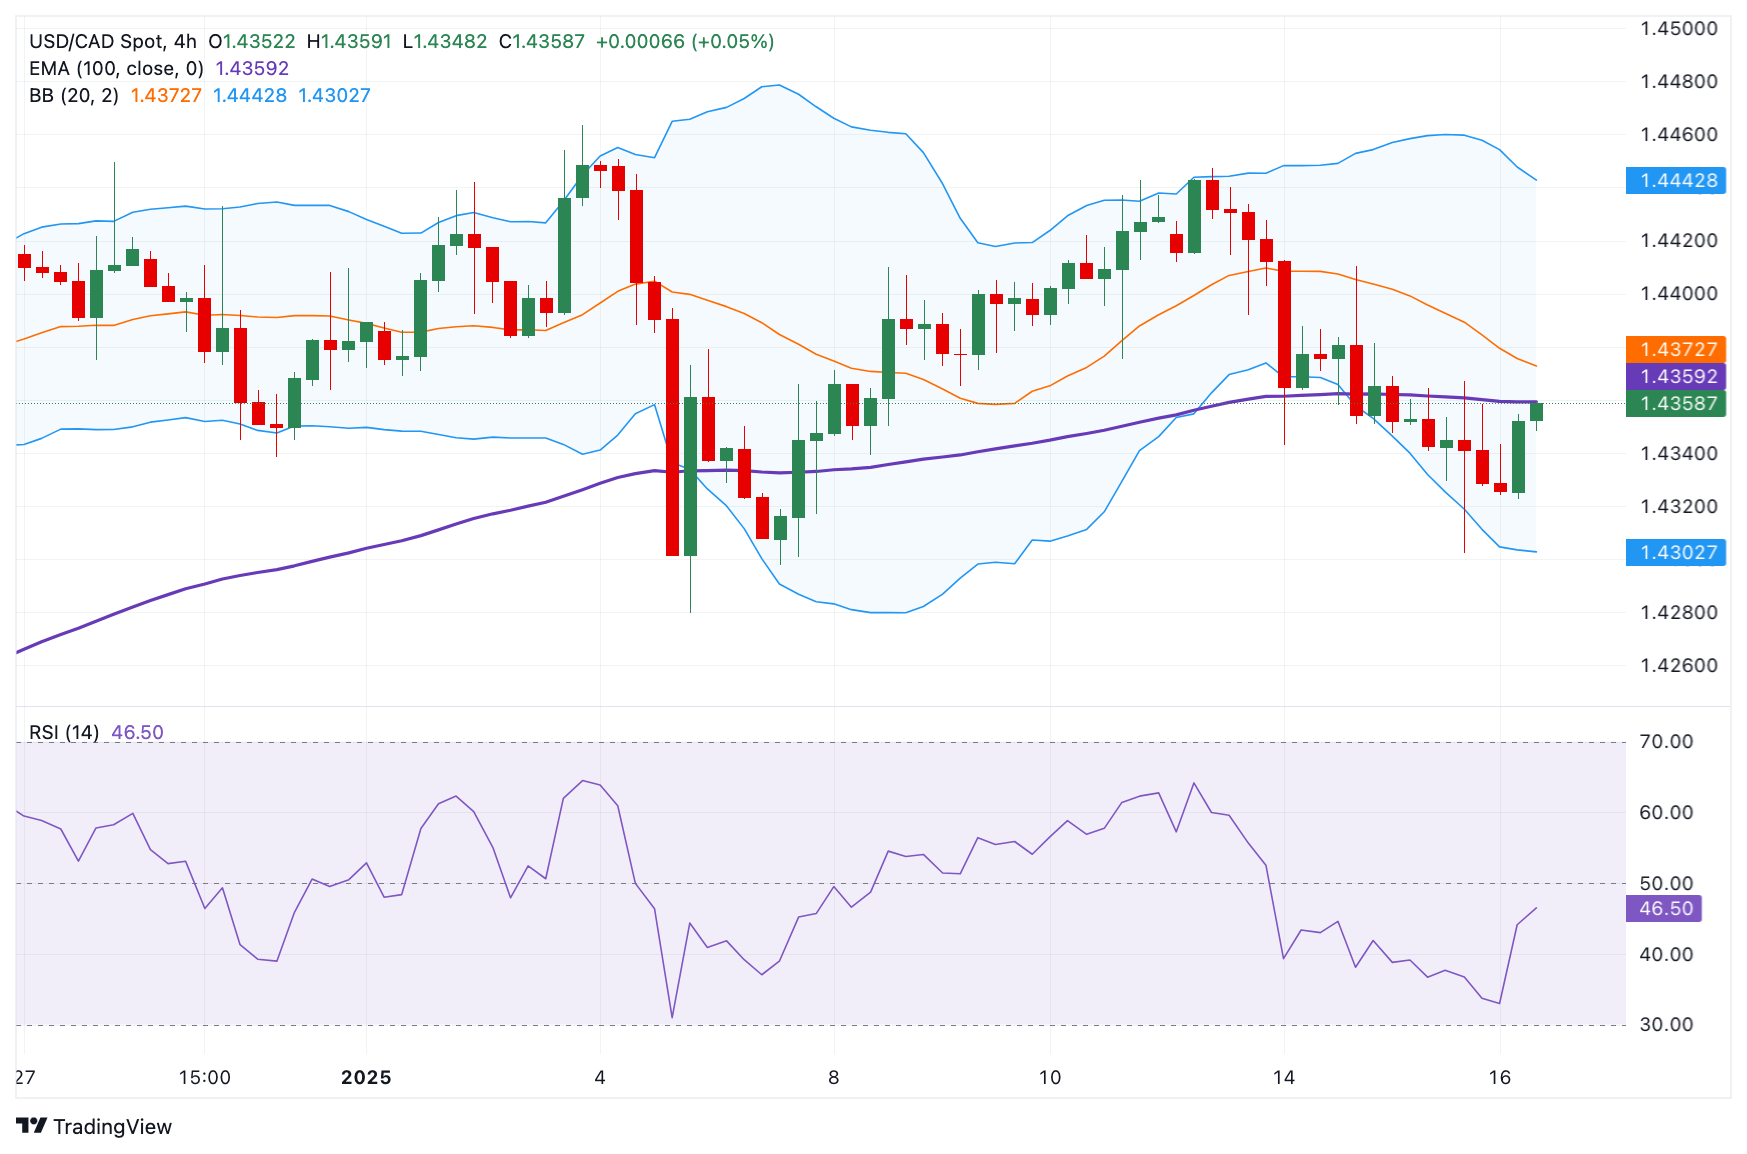
Canadian Dollar FAQs
The key factors driving the Canadian Dollar (CAD) are the level of interest rates set by the Bank of Canada (BoC), the price of Oil, Canada’s largest export, the health of its economy, inflation and the Trade Balance, which is the difference between the value of Canada’s exports versus its imports. Other factors include market sentiment – whether investors are taking on more risky assets (risk-on) or seeking safe-havens (risk-off) – with risk-on being CAD-positive. As its largest trading partner, the health of the US economy is also a key factor influencing the Canadian Dollar.
The Bank of Canada (BoC) has a significant influence on the Canadian Dollar by setting the level of interest rates that banks can lend to one another. This influences the level of interest rates for everyone. The main goal of the BoC is to maintain inflation at 1-3% by adjusting interest rates up or down. Relatively higher interest rates tend to be positive for the CAD. The Bank of Canada can also use quantitative easing and tightening to influence credit conditions, with the former CAD-negative and the latter CAD-positive.
The price of Oil is a key factor impacting the value of the Canadian Dollar. Petroleum is Canada’s biggest export, so Oil price tends to have an immediate impact on the CAD value. Generally, if Oil price rises CAD also goes up, as aggregate demand for the currency increases. The opposite is the case if the price of Oil falls. Higher Oil prices also tend to result in a greater likelihood of a positive Trade Balance, which is also supportive of the CAD.
While inflation had always traditionally been thought of as a negative factor for a currency since it lowers the value of money, the opposite has actually been the case in modern times with the relaxation of cross-border capital controls. Higher inflation tends to lead central banks to put up interest rates which attracts more capital inflows from global investors seeking a lucrative place to keep their money. This increases demand for the local currency, which in Canada’s case is the Canadian Dollar.
Macroeconomic data releases gauge the health of the economy and can have an impact on the Canadian Dollar. Indicators such as GDP, Manufacturing and Services PMIs, employment, and consumer sentiment surveys can all influence the direction of the CAD. A strong economy is good for the Canadian Dollar. Not only does it attract more foreign investment but it may encourage the Bank of Canada to put up interest rates, leading to a stronger currency. If economic data is weak, however, the CAD is likely to fall.
-
05:59
EUR/JPY Price Forecast: Bounces off one-month low, still deep in the red below mid-160.00s
- EUR/JPY remains under heavy selling pressure for the second successive day on Thursday.
- The JPY continues to be underpinned by rising bets for a BoJ interest rate hike next week.
- The technical setup favors bears and supports prospects for a further depreciating move.
The EUR/JPY cross drifts lower for the second successive day on Thursday and drops to over a one-month trough, around the 159.75 region during the Asian session. Spot prices, however, rebound a few pips in the last hour and currently trade just below mid-160.00s, still down over 0.40% for the day.
The Japanese Yen (JPY) continues with its relative outperformance in the wake of a potential Bank of Japan (BoJ) interest rate hike next week. The shared currency, on the other hand, is undermined by bets for further interest rate cuts by the European Central Bank (ECB), which turns out to be another factor exerting pressure on the EUR/JPY cross. That said, the prevalent risk-on mood caps gains for the safe-haven JPY and offers some support to spot prices.
From a technical perspective, the recent repeated failures near the 164.70-164.80 region, which coincides with the 200-day Simple Moving Average (SMA), constitute the formation of multiple tops on the daily chart. Furthermore, a sustained break and acceptance below the 161.00 mark, along with the fact that oscillators on the daily chart have started gaining negative traction, suggests that the path of least resistance for the EUR/JPY cross is to the downside.
Hence, any further recovery is more likely to attract fresh sellers and remain capped near the 161.00 round figure. Some follow-through buying, however, could trigger a short-covering rally and lift the EUR/JPY cross to the next relevant hurdle near the 161.65 region, though the momentum runs the risk of fizzling out rather quickly near the 162.00 mark.
On the flip side, acceptance below the 160.00 psychological mark could drag spot prices below the 159.75 area, or the Asian session swing low, towards testing sub-159.00 levels. The downward trajectory could extend towards the 158.55-158.50 area en route to the 158.05-158.00 zone and the 157.60-157.55 region. Bearish traders might then aim to challenge the December 2024 low, around the 156.20-156.15 zone, with some intermediate support near the 157.00 round figure.
EUR/JPY daily chart
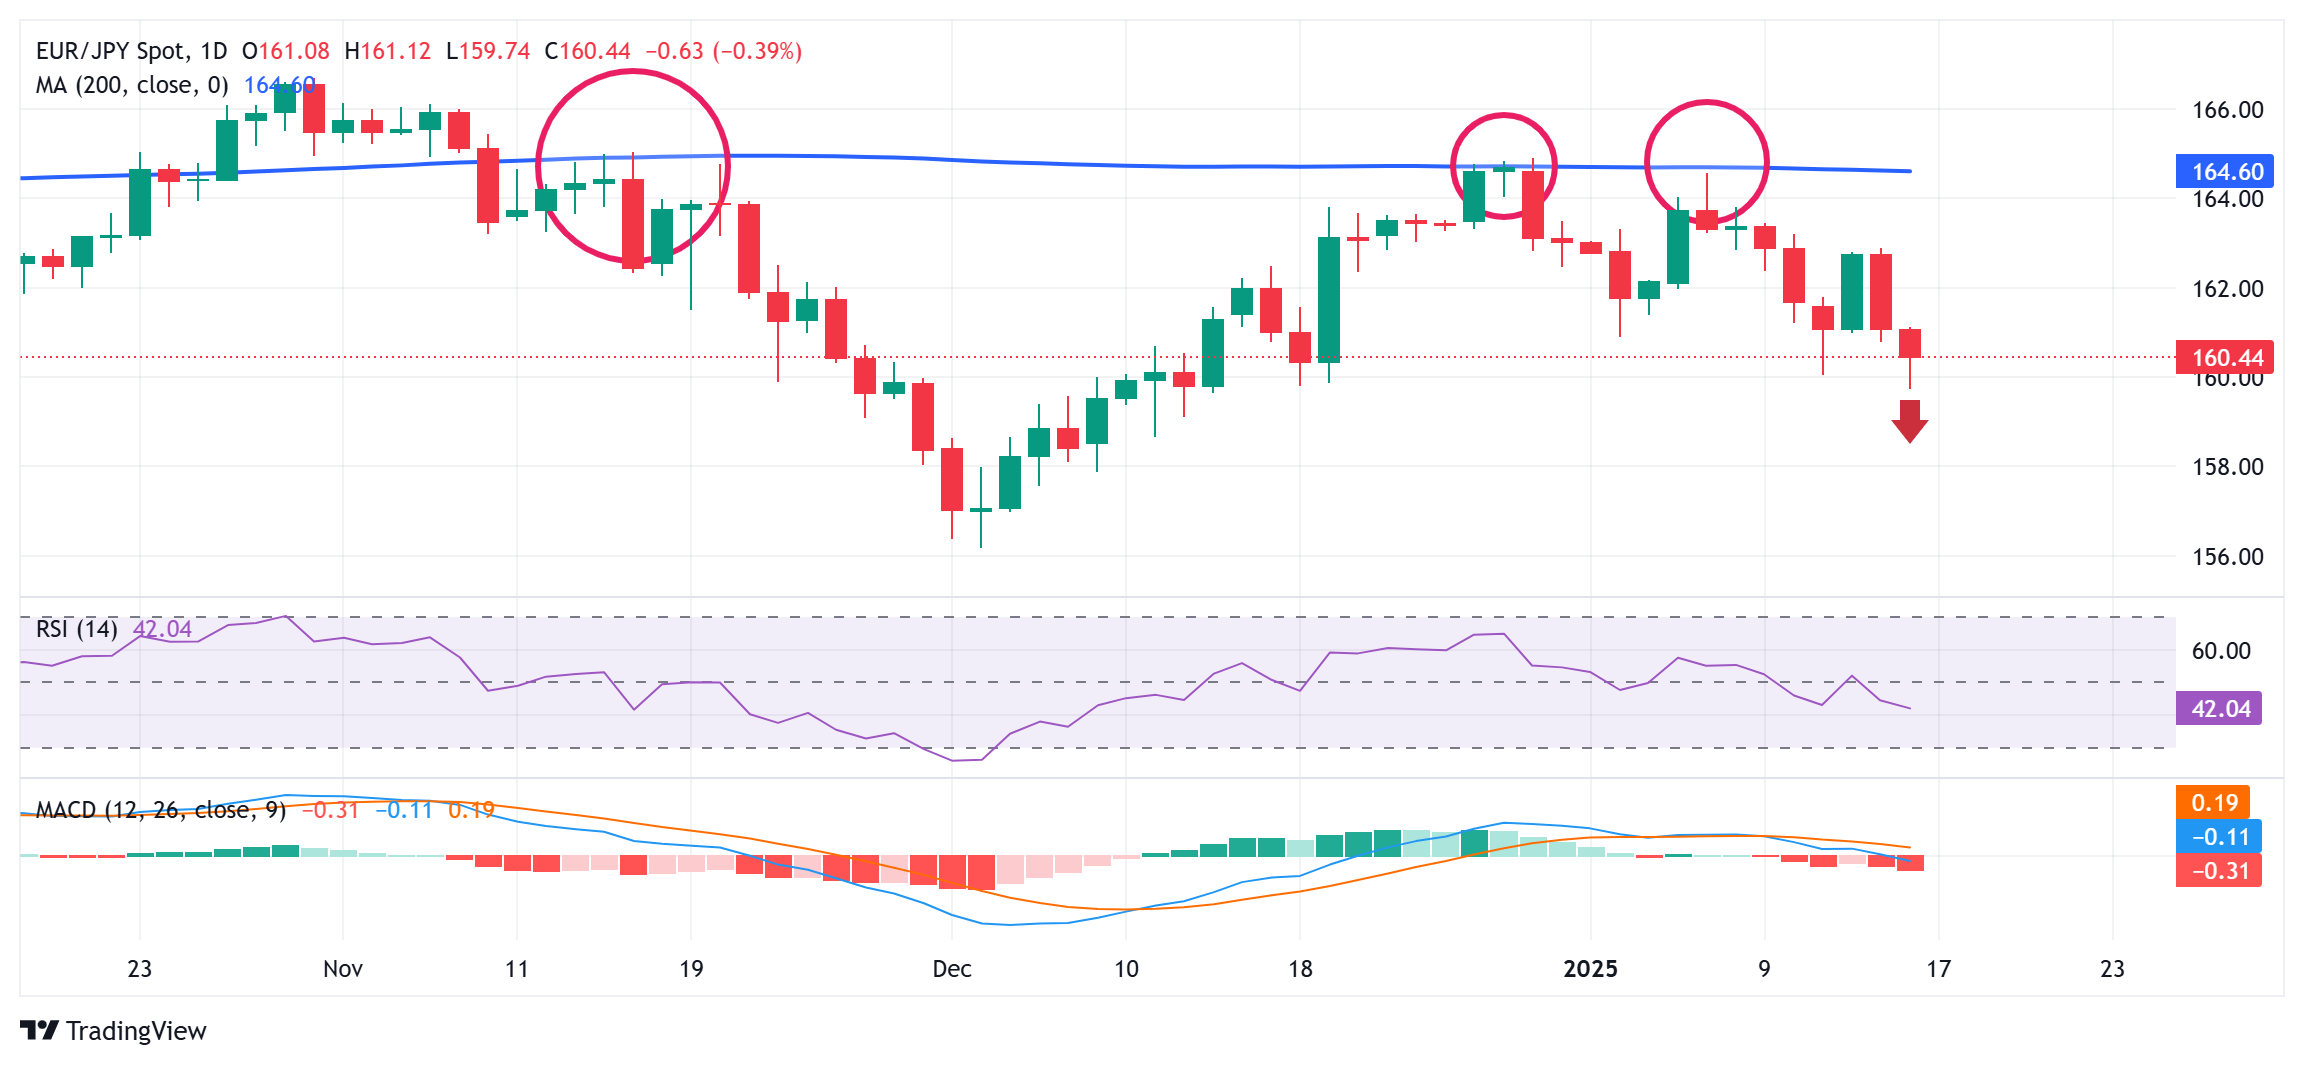
Bank of Japan FAQs
The Bank of Japan (BoJ) is the Japanese central bank, which sets monetary policy in the country. Its mandate is to issue banknotes and carry out currency and monetary control to ensure price stability, which means an inflation target of around 2%.
The Bank of Japan embarked in an ultra-loose monetary policy in 2013 in order to stimulate the economy and fuel inflation amid a low-inflationary environment. The bank’s policy is based on Quantitative and Qualitative Easing (QQE), or printing notes to buy assets such as government or corporate bonds to provide liquidity. In 2016, the bank doubled down on its strategy and further loosened policy by first introducing negative interest rates and then directly controlling the yield of its 10-year government bonds. In March 2024, the BoJ lifted interest rates, effectively retreating from the ultra-loose monetary policy stance.
The Bank’s massive stimulus caused the Yen to depreciate against its main currency peers. This process exacerbated in 2022 and 2023 due to an increasing policy divergence between the Bank of Japan and other main central banks, which opted to increase interest rates sharply to fight decades-high levels of inflation. The BoJ’s policy led to a widening differential with other currencies, dragging down the value of the Yen. This trend partly reversed in 2024, when the BoJ decided to abandon its ultra-loose policy stance.
A weaker Yen and the spike in global energy prices led to an increase in Japanese inflation, which exceeded the BoJ’s 2% target. The prospect of rising salaries in the country – a key element fuelling inflation – also contributed to the move.
-
05:58
Silver Price Forecast: XAG/USD remains above $30.50 due to reinforced Fed’s dovish stance
- Silver price appreciated as softer US Inflation sparked speculation of the Fed implementing two interest rate cuts in 2025.
- The dollar-denominated Silver gains support as the weaker US Dollar makes it more affordable for buyers using foreign currencies.
- Silver demand could weaken as overcapacity in China’s solar panel industry drives photovoltaic companies to join a government self-discipline program.
Silver price (XAG/USD) remains stable at around $30.70 per troy ounce during the Asian session on Thursday. The price of the non-yielding metal gained support as December's lower-than-expected underlying inflation in the US sparked speculation that the US Federal Reserve (Fed) might implement two interest rate cuts this year.
Meanwhile, 2-year and 10-year US Treasury bond yields stand at 4.27% and 4.66%, respectively, at the time of writing. Both yields dropped by over 2% on Wednesday. Additionally, the US Dollar Index (DXY), which gauges the US Dollar's (USD) performance against six major currencies, is trading near 109.00, extending its downside for the fourth successive session. A weaker USD makes the precious metal more affordable for buyers using foreign currencies, which boosts the demand for Silver.
The US CPI rose by 2.9% year-over-year in December, up from 2.7% in November, matching market expectations. The monthly CPI increased by 0.4%, following a 0.3% rise in November. US Core CPI, excluding volatile food and energy prices, increased by 3.2% annually in December, slightly below both the previous month's 3.3% and analysts' forecast of 3.3%. Core CPI edged up by 0.2% month-over-month in December 2024.
Overcapacity in China’s solar panel industry has prompted photovoltaic companies to join a government self-discipline program designed to regulate supply, which could limit the outlook for Silver demand from this key sector. Additionally, reports of forced labor practices in solar panel factories in the Xinjiang region of China have led the US to impose import bans on selected manufacturers.
Silver FAQs
Silver is a precious metal highly traded among investors. It has been historically used as a store of value and a medium of exchange. Although less popular than Gold, traders may turn to Silver to diversify their investment portfolio, for its intrinsic value or as a potential hedge during high-inflation periods. Investors can buy physical Silver, in coins or in bars, or trade it through vehicles such as Exchange Traded Funds, which track its price on international markets.
Silver prices can move due to a wide range of factors. Geopolitical instability or fears of a deep recession can make Silver price escalate due to its safe-haven status, although to a lesser extent than Gold's. As a yieldless asset, Silver tends to rise with lower interest rates. Its moves also depend on how the US Dollar (USD) behaves as the asset is priced in dollars (XAG/USD). A strong Dollar tends to keep the price of Silver at bay, whereas a weaker Dollar is likely to propel prices up. Other factors such as investment demand, mining supply – Silver is much more abundant than Gold – and recycling rates can also affect prices.
Silver is widely used in industry, particularly in sectors such as electronics or solar energy, as it has one of the highest electric conductivity of all metals – more than Copper and Gold. A surge in demand can increase prices, while a decline tends to lower them. Dynamics in the US, Chinese and Indian economies can also contribute to price swings: for the US and particularly China, their big industrial sectors use Silver in various processes; in India, consumers’ demand for the precious metal for jewellery also plays a key role in setting prices.
Silver prices tend to follow Gold's moves. When Gold prices rise, Silver typically follows suit, as their status as safe-haven assets is similar. The Gold/Silver ratio, which shows the number of ounces of Silver needed to equal the value of one ounce of Gold, may help to determine the relative valuation between both metals. Some investors may consider a high ratio as an indicator that Silver is undervalued, or Gold is overvalued. On the contrary, a low ratio might suggest that Gold is undervalued relative to Silver.
-
05:35
India Gold price today: Gold steadies, according to FXStreet data
Gold prices remained broadly unchanged in India on Thursday, according to data compiled by FXStreet.
The price for Gold stood at 7,498.27 Indian Rupees (INR) per gram, broadly stable compared with the INR 7,495.38 it cost on Wednesday.
The price for Gold was broadly steady at INR 87,458.70 per tola from INR 87,424.65 per tola a day earlier.
Unit measure Gold Price in INR 1 Gram 7,498.27 10 Grams 74,983.00 Tola 87,458.70 Troy Ounce 233,217.30 FXStreet calculates Gold prices in India by adapting international prices (USD/INR) to the local currency and measurement units. Prices are updated daily based on the market rates taken at the time of publication. Prices are just for reference and local rates could diverge slightly.
Gold FAQs
Gold has played a key role in human’s history as it has been widely used as a store of value and medium of exchange. Currently, apart from its shine and usage for jewelry, the precious metal is widely seen as a safe-haven asset, meaning that it is considered a good investment during turbulent times. Gold is also widely seen as a hedge against inflation and against depreciating currencies as it doesn’t rely on any specific issuer or government.
Central banks are the biggest Gold holders. In their aim to support their currencies in turbulent times, central banks tend to diversify their reserves and buy Gold to improve the perceived strength of the economy and the currency. High Gold reserves can be a source of trust for a country’s solvency. Central banks added 1,136 tonnes of Gold worth around $70 billion to their reserves in 2022, according to data from the World Gold Council. This is the highest yearly purchase since records began. Central banks from emerging economies such as China, India and Turkey are quickly increasing their Gold reserves.
Gold has an inverse correlation with the US Dollar and US Treasuries, which are both major reserve and safe-haven assets. When the Dollar depreciates, Gold tends to rise, enabling investors and central banks to diversify their assets in turbulent times. Gold is also inversely correlated with risk assets. A rally in the stock market tends to weaken Gold price, while sell-offs in riskier markets tend to favor the precious metal.
The price can move due to a wide range of factors. Geopolitical instability or fears of a deep recession can quickly make Gold price escalate due to its safe-haven status. As a yield-less asset, Gold tends to rise with lower interest rates, while higher cost of money usually weighs down on the yellow metal. Still, most moves depend on how the US Dollar (USD) behaves as the asset is priced in dollars (XAU/USD). A strong Dollar tends to keep the price of Gold controlled, whereas a weaker Dollar is likely to push Gold prices up.
(An automation tool was used in creating this post.)
-
05:22
GBP/USD edges lower to near 1.2200 as UK Gilt yields drop
- GBP/USD faces pressure as UK Gilt yields decline following lower-than-expected UK inflation.
- The yield on the UK 10-year Gilt dropped to 4.73%, pulling back from multi-decade highs.
- The US Dollar depreciated following the softer US Consumer Price Index inflation data for December.
GBP/USD edges lower after two days of gains, trading around 1.2220 during the Asian hours on Thursday. The Pound Sterling (GBP) receives downward pressure following lower-than-expected inflation data from the United Kingdom (UK) released on Wednesday.
The yield on the UK 10-year Gilt fell to 4.73%, retreating from multi-decade highs, after official data showed an unexpected drop in headline UK inflation, increasing expectations of rate cuts by the Bank of England (BoE).
The UK Consumer Price Index (CPI) increased by 2.5% year-over-year in December, down from 2.6% in November and below the market forecast of 2.7%. Despite the slowdown, the figure remained above the Bank of England’s (BoE) 2% target.
Meanwhile, the annual core CPI, which excludes volatile food and energy items, grew by 3.2% in December, compared to a 3.5% increase in November, missing market expectations of 3.4%. Additionally, services inflation declined sharply to 4.4% year-over-year in December, down from 5% in November.
However, the GBP/USD pair gained ground as the US Dollar (USD) extended its decline following the cooler-than-expected US Consumer Price Index (CPI) inflation data for December, which heightened speculation that the US Federal Reserve (Fed) could implement two interest rate cuts this year.
The US CPI rose by 2.9% year-over-year in December, up from 2.7% in November, matching market expectations. On a monthly basis, CPI increased by 0.4%, following a 0.3% rise in November. US Core CPI, excluding volatile food and energy prices, increased by 3.2% annually in December, slightly below both the previous month's 3.3% and analysts' forecast of 3.3%. On a monthly basis, core CPI edged up by 0.2% in December 2024.
The US Dollar Index (DXY), which gauges the US Dollar's performance against six major currencies, is trading near 109.00. Meanwhile, 2-year and 10-year US Treasury bond yields are at 4.27% and 4.66%, respectively. Both yields dropped by over 2% on Wednesday as softer US core CPI data fueled expectations that the Federal Reserve’s easing cycle may continue.
Pound Sterling FAQs
The Pound Sterling (GBP) is the oldest currency in the world (886 AD) and the official currency of the United Kingdom. It is the fourth most traded unit for foreign exchange (FX) in the world, accounting for 12% of all transactions, averaging $630 billion a day, according to 2022 data. Its key trading pairs are GBP/USD, also known as ‘Cable’, which accounts for 11% of FX, GBP/JPY, or the ‘Dragon’ as it is known by traders (3%), and EUR/GBP (2%). The Pound Sterling is issued by the Bank of England (BoE).
The single most important factor influencing the value of the Pound Sterling is monetary policy decided by the Bank of England. The BoE bases its decisions on whether it has achieved its primary goal of “price stability” – a steady inflation rate of around 2%. Its primary tool for achieving this is the adjustment of interest rates. When inflation is too high, the BoE will try to rein it in by raising interest rates, making it more expensive for people and businesses to access credit. This is generally positive for GBP, as higher interest rates make the UK a more attractive place for global investors to park their money. When inflation falls too low it is a sign economic growth is slowing. In this scenario, the BoE will consider lowering interest rates to cheapen credit so businesses will borrow more to invest in growth-generating projects.
Data releases gauge the health of the economy and can impact the value of the Pound Sterling. Indicators such as GDP, Manufacturing and Services PMIs, and employment can all influence the direction of the GBP. A strong economy is good for Sterling. Not only does it attract more foreign investment but it may encourage the BoE to put up interest rates, which will directly strengthen GBP. Otherwise, if economic data is weak, the Pound Sterling is likely to fall.
Another significant data release for the Pound Sterling is the Trade Balance. This indicator measures the difference between what a country earns from its exports and what it spends on imports over a given period. If a country produces highly sought-after exports, its currency will benefit purely from the extra demand created from foreign buyers seeking to purchase these goods. Therefore, a positive net Trade Balance strengthens a currency and vice versa for a negative balance.
-
05:14
Gold price bulls retain control near one-month top, move beyond $2,700 awaited
- Gold prices continue to draw support from bets for more interest rate cuts by the Fed.
- Concerns about Trump’s trade tariff plans also benefit the safe-haven precious metal.
- The risk-on mood and a modest USD uptick cap the upside for the XAU/USD pair.
Gold price (XAU/USD) touches a fresh one-month top during the Asian session on Thursday, though it struggles to build on the momentum beyond the $2,700 mark. Against the backdrop of easing fears about US President-elect Donald Trump's disruptive trade tariffs, bets that the Federal Reserve (Fed) could cut interest rates twice this year remain supportive of the upbeat market mood. Apart from this, a modest US Dollar (USD) uptick turns out to be a key factor keeping a lid on the safe-haven precious metal.
Meanwhile, signs of abating inflationary pressures in the US suggest that the Fed may not necessarily exclude the possibility of cutting rates further by the end of this year. This led to the overnight slump in the US Treasury bond yields, which might cap the USD and support the non-yielding Gold price. Moreover, uncertainties around Trump's tariff plan and its potential impact on global growth should help limit any meaningful downside for the commodity. Traders now look to the US macro data for short-term impetus.
Gold price sticks to bullish bias as cooler US inflation data revives Fed rate cut bets
- Bloomberg reported earlier this week that the incoming US President Donald Trump's economic advisers are considering a program to gradually increase tariffs month by month.
- Moreover, cooler-than-expected inflation data from the US revived expectations that the Federal Reserve's policy easing cycle may not be over yet and underpins the Gold price.
- The US Bureau of Labor Statistics (BLS) reported that the headline CPI rose 0.4% in December and the yearly rate accelerated to 2.9% from 2.7% recorded in the previous month.
- Meanwhile, the core gauge, which excludes volatile food and energy prices, rose 3.2% on a yearly basis as compared to the 3.3% increase in November and consensus estimates.
- The markets were quick to react and now expect the Fed to deliver 40 basis points (bps) rate cuts by year-end, compared with about 31 bps before the December inflation data.
- The yield on the benchmark 10-year US government bond retreated further away from the 14-month high touched on Monday, dragging the US Dollar to a fresh one-week low.
- Investors, however, seem convinced that the Fed will pause its rate-cutting cycle later this year, which helps revive the USD demand and contributes to capping the XAU/USD.
- Richmond Fed President Tom Barkin said that fresh inflation data show progress on lowering inflation to the central bank's 2% goal, but added that rates should remain restrictive.
- Ukraine carried out its most massive attack, targeting military and oil facilities deep inside Russia, with drones and missiles, including US-made ATACMS ballistic missiles.
- In response, Russia launched its own bombardment, predominantly targeting Ukraine’s gas infrastructure and energy facilities with more than 40 missiles and 70 attack drones.
- Qatar’s Prime Minister said on Wednesday that Israel and Hamas agreed to a ceasefire in Gaza and exchange Israeli hostages for Palestinian prisoners after 15 months of war.
- Traders now look to the US economic docket – featuring monthly Retail Sales and the usual Weekly Initial Jobless Claims – for a fresh impetus later during the North American session.
Gold price remains on track to climb further towards testing the $2,715-2,720 hurdle
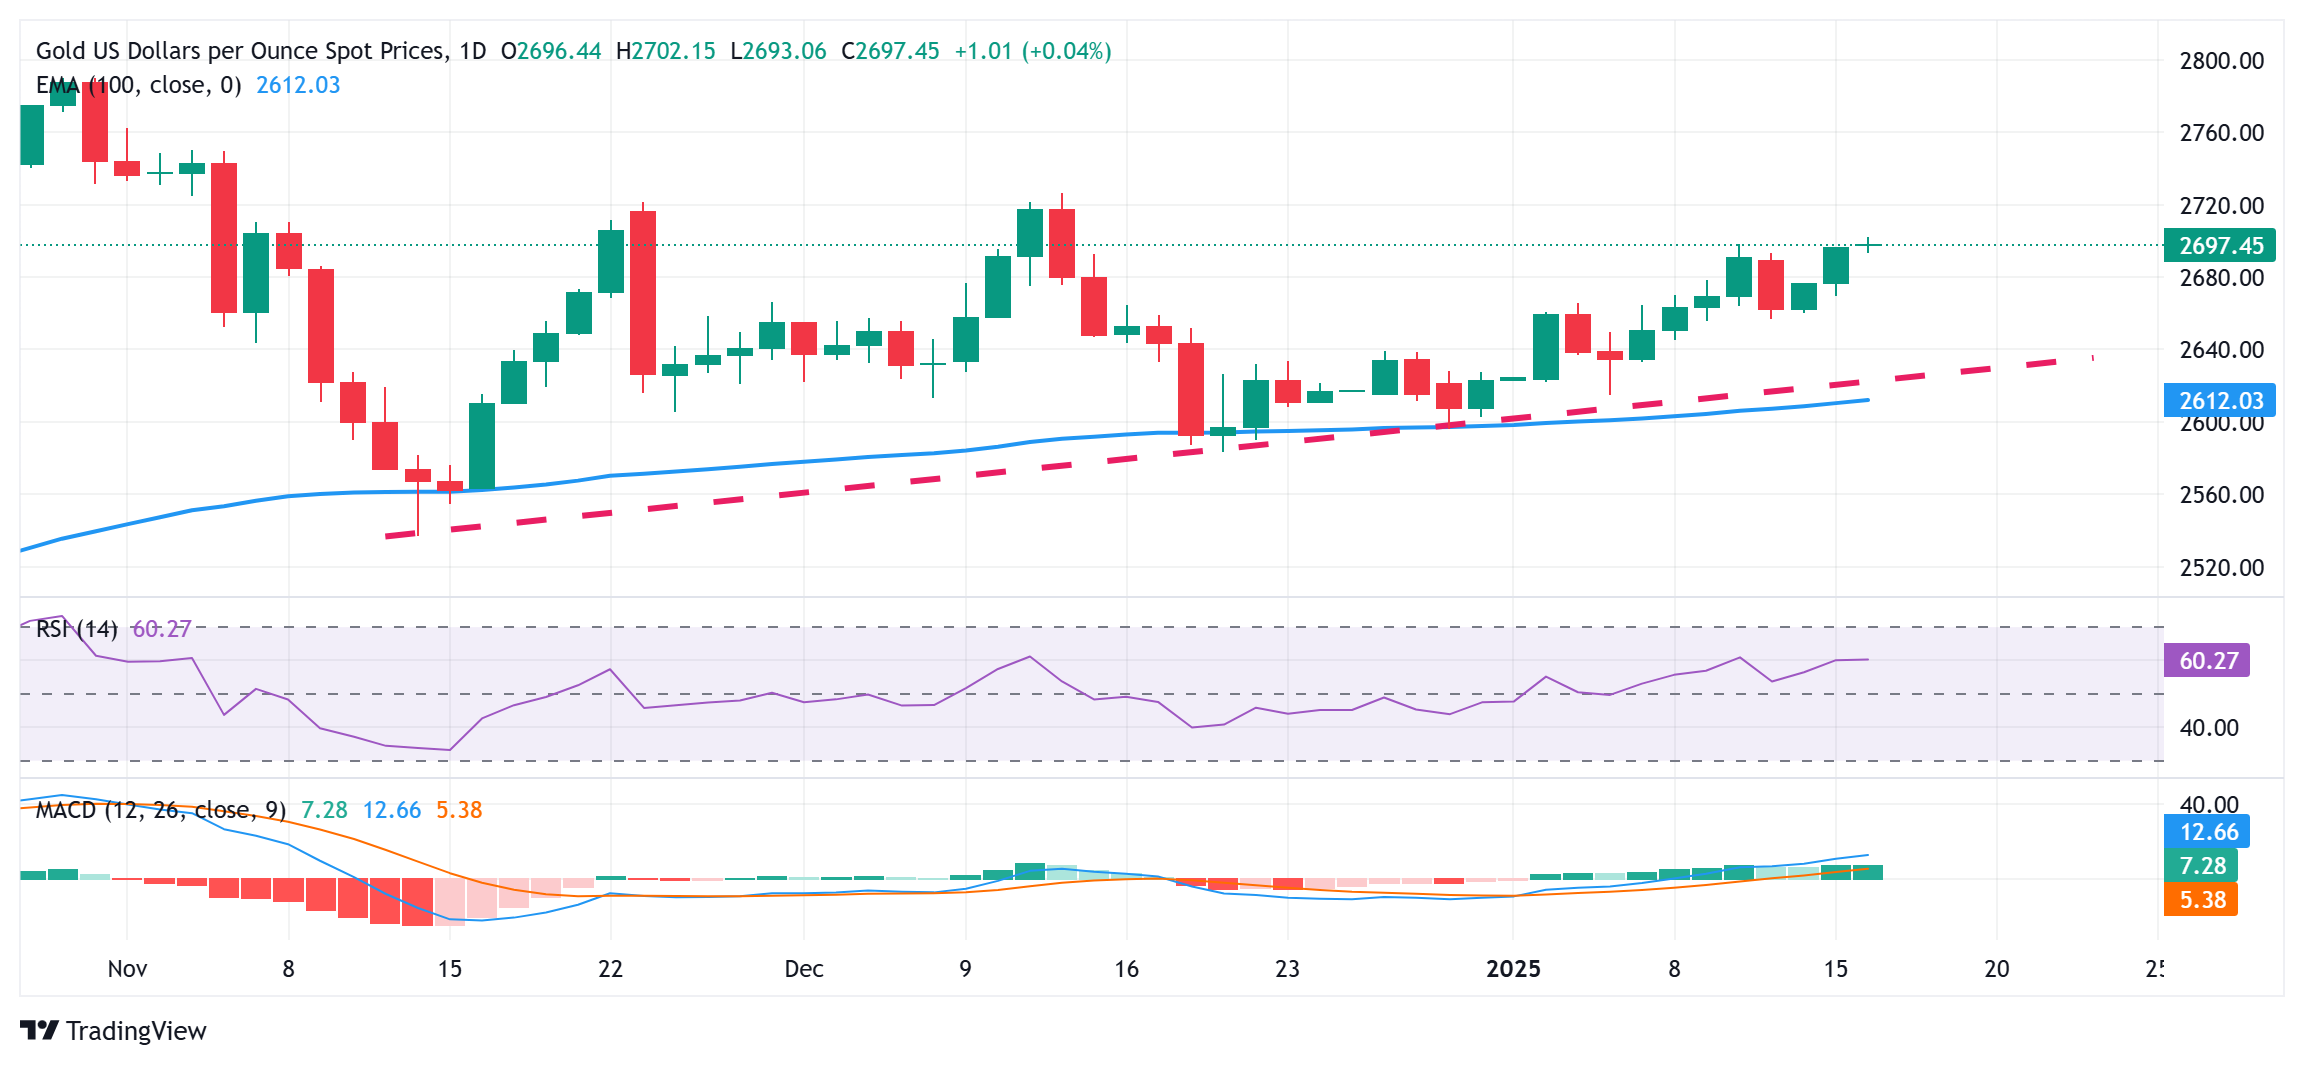
From a technical perspective, positive oscillators on the daily chart support prospects for a further move-up towards the $2,715-2,720 supply zone. Some follow-through buying should pave the way for additional gains towards the next relevant hurdle near the $2,748-2,750 region, above which the Gold price could aim to retest the all-time peak, around the $2,790 area touched in October 2024.
On the flip side, any meaningful pullback now seems to find decent support and attract fresh buyers around the $2,678 region. This should help limit the downside near the $2,664-2,663 horizontal zone. Failure to defend the said support levels could make the Gold price vulnerable to accelerate the fall towards the $2,635 area en route to the $2,615 confluence – comprising a short-term ascending trend line and the 100-day Exponential Moving Average (EMA).
Gold FAQs
Gold has played a key role in human’s history as it has been widely used as a store of value and medium of exchange. Currently, apart from its shine and usage for jewelry, the precious metal is widely seen as a safe-haven asset, meaning that it is considered a good investment during turbulent times. Gold is also widely seen as a hedge against inflation and against depreciating currencies as it doesn’t rely on any specific issuer or government.
Central banks are the biggest Gold holders. In their aim to support their currencies in turbulent times, central banks tend to diversify their reserves and buy Gold to improve the perceived strength of the economy and the currency. High Gold reserves can be a source of trust for a country’s solvency. Central banks added 1,136 tonnes of Gold worth around $70 billion to their reserves in 2022, according to data from the World Gold Council. This is the highest yearly purchase since records began. Central banks from emerging economies such as China, India and Turkey are quickly increasing their Gold reserves.
Gold has an inverse correlation with the US Dollar and US Treasuries, which are both major reserve and safe-haven assets. When the Dollar depreciates, Gold tends to rise, enabling investors and central banks to diversify their assets in turbulent times. Gold is also inversely correlated with risk assets. A rally in the stock market tends to weaken Gold price, while sell-offs in riskier markets tend to favor the precious metal.
The price can move due to a wide range of factors. Geopolitical instability or fears of a deep recession can quickly make Gold price escalate due to its safe-haven status. As a yield-less asset, Gold tends to rise with lower interest rates, while higher cost of money usually weighs down on the yellow metal. Still, most moves depend on how the US Dollar (USD) behaves as the asset is priced in dollars (XAU/USD). A strong Dollar tends to keep the price of Gold controlled, whereas a weaker Dollar is likely to push Gold prices up.
-
04:41
BoJ’s Ueda: Will debate at next week's meeting whether to hike rates
Bank of Japan (BoJ) Governor Kazuo Ueda said on Thursday that the board members “will debate at next week's meeting whether to hike rates.”
Additional quotes
Will raise policy rate this year if economic, price conditions continue to improve.
How to proceed with monetary policy adjustment will depend on economic, price, financial conditions at the time.
New US administration's policy outlook, domestic wage negotiations are key factors in the BoJ’s policy decision.
-
04:24
USD/INR remains strong ahead of US Retail Sales release
- The Indian Rupee drifts lower in Thursday’s Asian session.
- Higher oil prices and persistent outflows weigh on the INR, but weaker USD and RBI’s intervention might cap its downside.
- Investors await the US December Retail Sales and weekly Initial Jobless Claims releases on Thursday for fresh impetuses.
The Indian Rupee (INR) trades in negative territory on Thursday. A surge in crude oil prices exerts some selling pressure on the local currency as India relies on overseas suppliers for almost 90% of its oil consumption. Furthermore, continued outflows from foreign investors and concerns about India’s economic slowdown contribute to the INR’s downside.
However, the cooler-than-expected US inflation data raises the bet that the US Federal Reserve (Fed) could cut interest rates twice this year. This, in turn, could weigh on the US Dollar (USD) and support the INR. The routine intervention from the Reserve Bank of India (RBI) also helps limit the local currency’s losses. The Indian central bank has regularly intervened to prop up the currency, burning through almost $70bn of its foreign exchange reserves since they reached a record high of $705bn in September 2024. Investors brace for the US Retail Sales for December and weekly Initial Jobless Claims, which are due later on Thursday.Indian Rupee remains vulnerable amid a rise in crude oil prices and foreign fund outflows
- India's economy is expected to become the fourth largest in the world by 2026, surpassing Japan, according to the PHDCCI on Wednesday. It projected the nation's GDP to grow 6.8% in the current financial year ending March and 7.7% in FY26.
- India’s trade deficit narrowed to $21.94 billion in December from $37.84 billion in November, led by a sharp decline in gold and oil import bills, data released by the Ministry of Commerce and Industry showed on Wednesday.
- The US Consumer Price Index (CPI) climbed 2.9% YoY in December, compared to 2.7% in November, according to the Bureau of Labor Statistics on Thursday. This reading came in line with market expectations.
- The US core CPI, which excludes volatile food and energy prices, rose 3.2% YoY in December, below the previous reading and the market consensus of 3.3%.
- According to the Fed’s Beige Book survey released on Wednesday, economic activity increased “slightly to moderately” across the US in late November and December, supported by strong holiday sales.
USD/INR paints a positive picture, overbought RSI warrants caution for bulls in the near term
The Indian Rupee weakens on the day. The bullish outlook of the USD/INR pair prevails as the price has formed higher highs and higher lows while holding above the key 100-day Exponential Moving Average (EMA) on the daily chart. Nonetheless, further consolidation cannot be ruled out in the near term as the 14-day Relative Strength Index (RSI) moves beyond the 70.00 mark. This suggests an overbought condition and warrants some caution for bulls.
The first upside barrier for USD/INR emerges at an all-time high of 86.69. Extended gains could see a rally to the 87.00 psychological level.
On the other hand, the initial downside target to watch is 86.12, the low of January 13. Any follow-through selling below this level could pave the way to 85.85, the low of January 10. The next contention level is seen at 85.65, the low of January 7.Indian Rupee FAQs
The Indian Rupee (INR) is one of the most sensitive currencies to external factors. The price of Crude Oil (the country is highly dependent on imported Oil), the value of the US Dollar – most trade is conducted in USD – and the level of foreign investment, are all influential. Direct intervention by the Reserve Bank of India (RBI) in FX markets to keep the exchange rate stable, as well as the level of interest rates set by the RBI, are further major influencing factors on the Rupee.
The Reserve Bank of India (RBI) actively intervenes in forex markets to maintain a stable exchange rate, to help facilitate trade. In addition, the RBI tries to maintain the inflation rate at its 4% target by adjusting interest rates. Higher interest rates usually strengthen the Rupee. This is due to the role of the ‘carry trade’ in which investors borrow in countries with lower interest rates so as to place their money in countries’ offering relatively higher interest rates and profit from the difference.
Macroeconomic factors that influence the value of the Rupee include inflation, interest rates, the economic growth rate (GDP), the balance of trade, and inflows from foreign investment. A higher growth rate can lead to more overseas investment, pushing up demand for the Rupee. A less negative balance of trade will eventually lead to a stronger Rupee. Higher interest rates, especially real rates (interest rates less inflation) are also positive for the Rupee. A risk-on environment can lead to greater inflows of Foreign Direct and Indirect Investment (FDI and FII), which also benefit the Rupee.
Higher inflation, particularly, if it is comparatively higher than India’s peers, is generally negative for the currency as it reflects devaluation through oversupply. Inflation also increases the cost of exports, leading to more Rupees being sold to purchase foreign imports, which is Rupee-negative. At the same time, higher inflation usually leads to the Reserve Bank of India (RBI) raising interest rates and this can be positive for the Rupee, due to increased demand from international investors. The opposite effect is true of lower inflation.
-
04:10
NZD/USD maintains position above 0.5600 due to increased odds of Fed rate cuts
- NZD/USD strengthened as December's US CPI data fueled speculation that the Fed might implement two interest rate cuts this year.
- US Core CPI increased 3.2% YoY in December, slightly below the expected 3.3% rise.
- The New Zealand Dollar strengthened on improved market sentiment following reports of the incoming Trump administration considering gradual tariff hikes.
NZD/USD remains above 0.5600 during the Asian hours on Thursday following three successive days of gains. The pair received gains as the US Dollar (USD) extended its downside following the cooler-than-expected US Consumer Price Index (CPI) inflation data for December raises the bet that the US Federal Reserve (Fed) could cut interest rates twice this year.
The US Consumer Price Index increased by 2.9% year-over-year in December, up from 2.7% in November, aligning with market expectations. On a monthly basis, CPI rose 0.4%, following a 0.3% increase in the previous month.
US Core CPI, which excludes volatile food and energy prices, rose 3.2% annually in December, slightly below November's figure and analysts' forecast of 3.3%. On a monthly basis, core CPI edged up 0.2% in December 2024.
The US Dollar Index (DXY), which gauges the US Dollar's performance against six major currencies, is trading near 109.00. Meanwhile, 2-year and 10-year US Treasury bond yields are at 4.27% and 4.66%, respectively. Both yields dropped by over 2% on Wednesday as softer US core CPI data fueled expectations that the Federal Reserve’s easing cycle may continue.
The risk-sensitive New Zealand Dollar (NZD) strengthened on improved market sentiment following reports from Bloomberg suggesting that US President-elect Donald Trump's economic team is considering a gradual approach to raising import tariffs, boosting investor confidence.
The NZD also found support from strong trade data out of China and Beijing's measures to stabilize the Yuan. However, its gains may be capped as markets expect the Reserve Bank of New Zealand (RBNZ) to cut its 4.25% cash rate by 50 basis points in February, reflecting the country's weak economic conditions.
New Zealand Dollar FAQs
The New Zealand Dollar (NZD), also known as the Kiwi, is a well-known traded currency among investors. Its value is broadly determined by the health of the New Zealand economy and the country’s central bank policy. Still, there are some unique particularities that also can make NZD move. The performance of the Chinese economy tends to move the Kiwi because China is New Zealand’s biggest trading partner. Bad news for the Chinese economy likely means less New Zealand exports to the country, hitting the economy and thus its currency. Another factor moving NZD is dairy prices as the dairy industry is New Zealand’s main export. High dairy prices boost export income, contributing positively to the economy and thus to the NZD.
The Reserve Bank of New Zealand (RBNZ) aims to achieve and maintain an inflation rate between 1% and 3% over the medium term, with a focus to keep it near the 2% mid-point. To this end, the bank sets an appropriate level of interest rates. When inflation is too high, the RBNZ will increase interest rates to cool the economy, but the move will also make bond yields higher, increasing investors’ appeal to invest in the country and thus boosting NZD. On the contrary, lower interest rates tend to weaken NZD. The so-called rate differential, or how rates in New Zealand are or are expected to be compared to the ones set by the US Federal Reserve, can also play a key role in moving the NZD/USD pair.
Macroeconomic data releases in New Zealand are key to assess the state of the economy and can impact the New Zealand Dollar’s (NZD) valuation. A strong economy, based on high economic growth, low unemployment and high confidence is good for NZD. High economic growth attracts foreign investment and may encourage the Reserve Bank of New Zealand to increase interest rates, if this economic strength comes together with elevated inflation. Conversely, if economic data is weak, NZD is likely to depreciate.
The New Zealand Dollar (NZD) tends to strengthen during risk-on periods, or when investors perceive that broader market risks are low and are optimistic about growth. This tends to lead to a more favorable outlook for commodities and so-called ‘commodity currencies’ such as the Kiwi. Conversely, NZD tends to weaken at times of market turbulence or economic uncertainty as investors tend to sell higher-risk assets and flee to the more-stable safe havens.
-
03:52
Japanese Yen jumps to four-week top against USD amid BoJ rate hike talks
- The Japanese Yen remains well supported by rising bets for a BoJ rate hike in January.
- The narrowing of the US-Japan yield differential provides an additional boost to the JPY.
- The USD hangs near a one-week low and further contributes to the USD/JPY pair’s slide.
The Japanese Yen (JPY) attracts buyers for the second consecutive day on Thursday on the back of the Bank of Japan Governor Kazuo Ueda's hawkish comments, signaling a potential rate hike next week. Adding to this, signs of broadening inflationary pressures in Japan support prospects for further policy tightening by the BoJ, pushing yields on Japanese Government Bonds (JGBs) to multi-year highs. In contrast, the US Treasury bond yields retreated sharply on Wednesday in reaction to benign US inflation data. The resultant narrowing of the US-Japan yield-differential is seen as another factor undermining the JPY.
Meanwhile, cooler-than-expected US inflation increased the chances that the Federal Reserve could cut interest rates twice this year. This keeps the US Dollar (USD) bulls on the defensive and drags the USD/JPY pair to a fresh four-week low, around the 155.20 area during the Asian session on Thursday. That said, the risk-on mood might hold back traders from placing fresh bullish bets around the safe-haven JPY and offer some support to the currency pair. Investors now look to the US economic docket – featuring the release of monthly Retail Sales and Weekly Initial Jobless Claims – for short-term opportunities.
Japanese Yen remains supported by BoJ Governor Ueda's hawkish comments on Wednesday
- Bank of Japan Governor Kazuo Ueda said on Wednesday that the central bank will debate whether to raise interest rates at the next policy meeting on January 23-24.
- Ueda’s remarks echo Deputy Governor Ryozo Himino’s comments on Tuesday and lift bets for an interest rate hike next week, providing a strong boost to the Japanese Yen.
- The yield on the benchmark 10-year Japanese government bond advanced to its highest level since 2011 amid the prospects for further policy tightening by the BoJ.
- In contrast, the US Treasury bond yields fell on Wednesday following the release of the US Consumer Price Index (CPI), which eased fears that inflation was accelerating.
- The US Bureau of Labor Statistics (BLS) reported that the headline CPI rose 0.4% in December and the yearly rate accelerated to 2.9% from 2.7% in the previous month.
- The core gauge, which excludes volatile food and energy prices, rose 3.2% on a yearly basis as compared to the 3.3% increase recorded in November and expectations.
- The US Dollar dived to a one-week low following the release of the latest US consumer inflation figures and contributed to the USD/JPY pair's decline on Wednesday.
- Richmond Fed President Tom Barkin said that fresh inflation data show progress on lowering inflation to the central bank's 2% goal, but added that rates should remain restrictive.
- Against the backdrop of easing fears about US President-elect Donald Trump's disruptive trade tariffs, softer US inflation data remains supportive of the upbeat market mood.
- Traders look to the US macro data for a fresh impetus later during the North American session, though the focus will remain glued to the upcoming BoJ policy meeting.
USD/JPY could find support near 155.00 before dropping to test ascending channel support
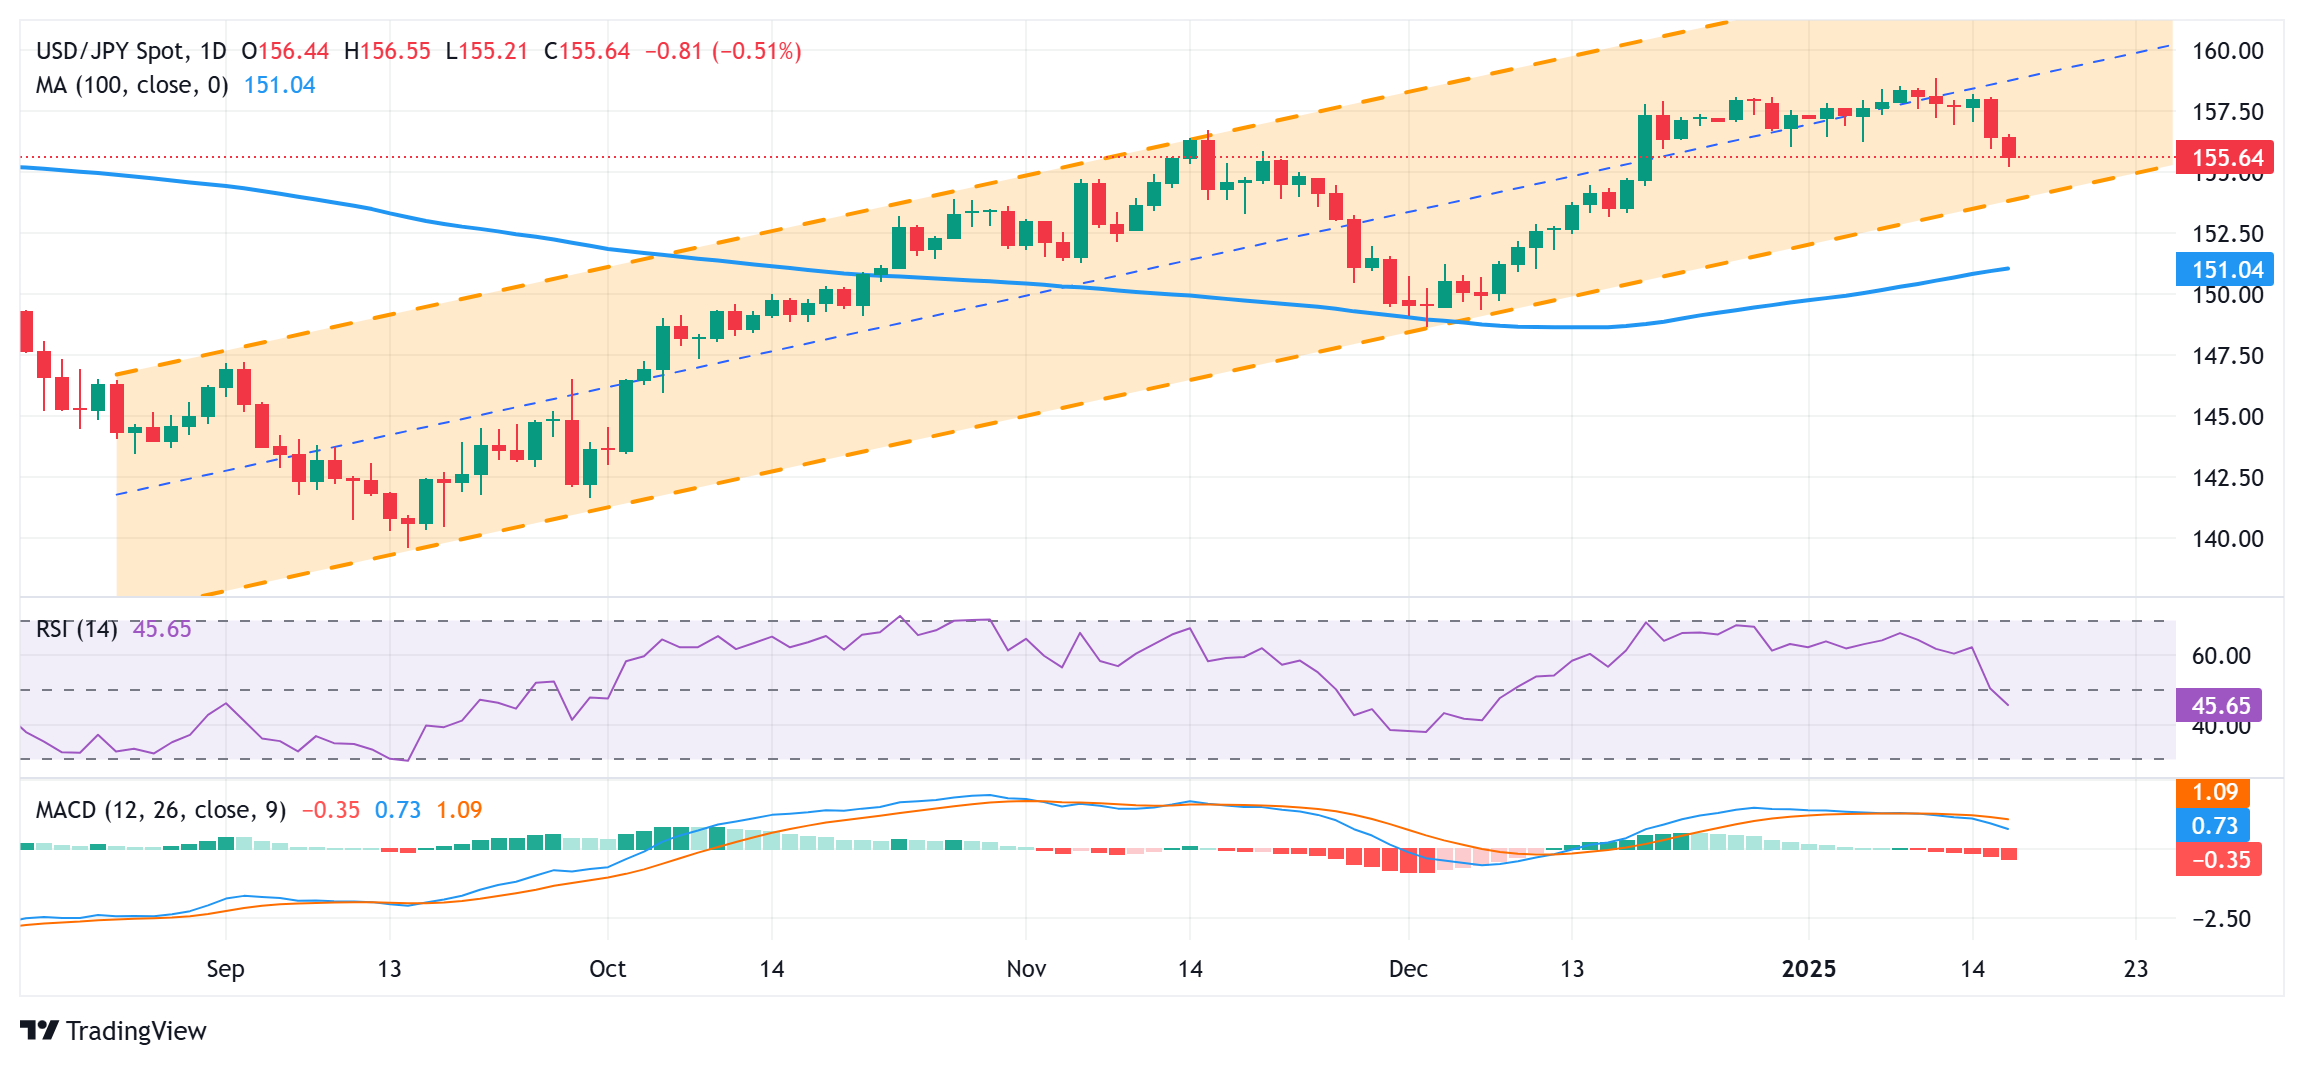
Any further slide is likely to find some support near the 155.00 psychological mark, below which the USD/JPY pair could slide to the 154.55-154.50 region. The latter represents the lower boundary of a four-month-old upward-sloping channel and should act as a key pivotal point. A convincing break below will be seen as a fresh trigger for bearish traders and pave the way for an extension of the recent retracement slide from a multi-month peak touched last Friday. Spot prices might then weaken further below the 154.00 mark and test the next relevant support near the 153.40-153.35 horizontal zone.
On the flip side, any attempted recovery might now confront resistance near the 156.00 mark ahead of the 156.35-156.45 region and the 156.75 area. Some follow-through buying, leading to a subsequent strength beyond the 157.00 mark, might shift the bias back in favor of bullish traders and lift the USD/JPY pair to the 155.55-155.60 intermediate hurdle en route to the 158.00 round figure. The momentum could extend further towards challenging the multi-month peak, around the 158.85-158.90 region.
Bank of Japan FAQs
The Bank of Japan (BoJ) is the Japanese central bank, which sets monetary policy in the country. Its mandate is to issue banknotes and carry out currency and monetary control to ensure price stability, which means an inflation target of around 2%.
The Bank of Japan embarked in an ultra-loose monetary policy in 2013 in order to stimulate the economy and fuel inflation amid a low-inflationary environment. The bank’s policy is based on Quantitative and Qualitative Easing (QQE), or printing notes to buy assets such as government or corporate bonds to provide liquidity. In 2016, the bank doubled down on its strategy and further loosened policy by first introducing negative interest rates and then directly controlling the yield of its 10-year government bonds. In March 2024, the BoJ lifted interest rates, effectively retreating from the ultra-loose monetary policy stance.
The Bank’s massive stimulus caused the Yen to depreciate against its main currency peers. This process exacerbated in 2022 and 2023 due to an increasing policy divergence between the Bank of Japan and other main central banks, which opted to increase interest rates sharply to fight decades-high levels of inflation. The BoJ’s policy led to a widening differential with other currencies, dragging down the value of the Yen. This trend partly reversed in 2024, when the BoJ decided to abandon its ultra-loose policy stance.
A weaker Yen and the spike in global energy prices led to an increase in Japanese inflation, which exceeded the BoJ’s 2% target. The prospect of rising salaries in the country – a key element fuelling inflation – also contributed to the move.
-
03:33
Australian Dollar holds ground following Australian Employment report
- The Australian Dollar saw modest support in response to the Australian Employment report.
- Australia’s Employment increased by 56.3K in December, up from 28.2K in November; the Unemployment Rate rose to 4.0%.
- The US Dollar weakened after the softer US Consumer Price Index for December was released on Wednesday.
The Australian Dollar (AUD) remains stable on Thursday following three consecutive days of gains against the US Dollar (USD). The AUD/USD pair saw modest support as the AUD posted slight gains in response to the Australian Employment report.
According to the Australian Bureau of Statistics (ABS), employment increased by 56.3K in December, up from 28.2K in November (revised from 35.6K) and significantly exceeding the market forecast of 15.0K. Meanwhile, the Unemployment Rate rose to 4.0% in December, compared to 3.9% in November, aligning with market expectations.
Bjorn Jarvis, head of labor statistics at the ABS, highlighted key data points: "The employment-to-population ratio rose 0.1% percentage points to a new record of 64.5%. This was 0.5 percentage points higher than a year ago and 2.3 percentage points above pre-COVID-19 levels. The increase in both employment and unemployment led to a further rise in the participation rate, which reflects the proportion of the population either employed or actively seeking work."
US President-elect Donald Trump's economic team considered a gradual increase in import tariffs. This optimism has bolstered risk-on market sentiment and supported risk-sensitive currencies like the AUD and contributed to the appreciation of the AUD/JPY pair.
Australian Dollar appreciates as US Dollar depreciates following CPI Inflation
- The US Dollar Index (DXY), which measures the US Dollar’s performance against six major currencies, trades near 109.00. The Greenback extends its downside following the cooler-than-expected US Consumer Price Index (CPI) inflation data for December raises the bet that the US Federal Reserve (Fed) could cut interest rates twice this year.
- The US Consumer Price Index increased by 2.9% year-over-year in December, up from 2.7% in November, aligning with market expectations. On a monthly basis, CPI rose 0.4%, following a 0.3% increase in the previous month.
- US Core CPI, which excludes volatile food and energy prices, rose 3.2% annually in December, slightly below November's figure and analysts' forecast of 3.3%. On a monthly basis, core CPI edged up 0.2% in December 2024.
- US Producer Price Index for final demand rose 0.2% MoM in December after an unrevised 0.4% advance in November, softer than the 0.3% expected. The PPI climbed 3.3% YoY in December, the most since February 2023, after increasing 3.0% in November. This reading came in below the consensus of 3.4%.
- On Wednesday, Scott Bessent, Donald Trump’s nominee for Treasury Secretary, emphasized the importance of maintaining the US Dollar as the world’s reserve currency for the nation's economic stability and future prosperity. Bessent stated “Productive investment that grows the economy must be prioritized over wasteful spending that drives inflation,” per Bloomberg.
- The Federal Reserve reported in its latest Beige Book survey, released on Wednesday, that economic activity saw slight to moderate growth across the twelve Federal Reserve Districts in late November and December. Consumer spending increased moderately, driven by strong holiday sales that surpassed expectations. However, manufacturing activity experienced a slight decline overall, as some manufacturers stockpiled inventories in anticipation of higher tariffs.
- Federal Reserve Board of Governors member Michelle Bowman added her voice to a chorus of Fed speakers last week as policymakers work double-duty to try and smooth over market reactions to a much tighter pace of rate cuts in 2025 than many market participants had previously anticipated.
- Australia’s Westpac Consumer Confidence Index dropped by 0.7% to 92.1 points, reflecting ongoing consumer pessimism. The decline in consumer confidence sparked concerns about the outlook for interest rates and Australia’s broader economic health. Markets are now pricing in a 67% likelihood that the Reserve Bank of Australia will lower its 4.35% cash rate by 25 basis points in February, with a full rate cut expected by April.
- On Monday, the China Foreign Exchange Committee (CFXC) pledged to support the Chinese Yuan during a meeting in Beijing, held under the guidance of the People’s Bank of China (PBOC). Separately, the PBOC and the State Administration of Foreign Exchange (SAFE), China’s FX regulator, announced an increase in the macro-prudential adjustment parameter for cross-border financing from 1.5 to 1.75, effective January 13, 2025.
- People's Bank of China (PBOC) Governor Pan Gongsheng stated on Monday that "interest rate and reserve requirement ratio (RRR) tools will be utilized to maintain ample liquidity." Gongsheng reaffirmed China's plans to increase the fiscal deficit and emphasized that China will continue to be a driving force for the global economy.
Technical Analysis: Australian Dollar could test the 0.6200 support near 14-day EMA
The AUD/USD pair trades around 0.6220 on Thursday, testing to break above the descending channel on the daily chart. A successful break would weaken the bearish bias. The 14-day Relative Strength Index (RSI) rises toward the 50 level, indicating a recovery.
The AUD/USD pair faces immediate resistance at the upper boundary of the descending channel, around 0.6220.
Regarding its support, the AUD/USD pair may test the 14-day Exponential Moving Average (EMA) at 0.6214, followed by the nine-day EMA at 0.6206. A more significant support level lies near the lower boundary of the descending channel, close to the 0.5920 level.
AUD/USD: Daily Chart
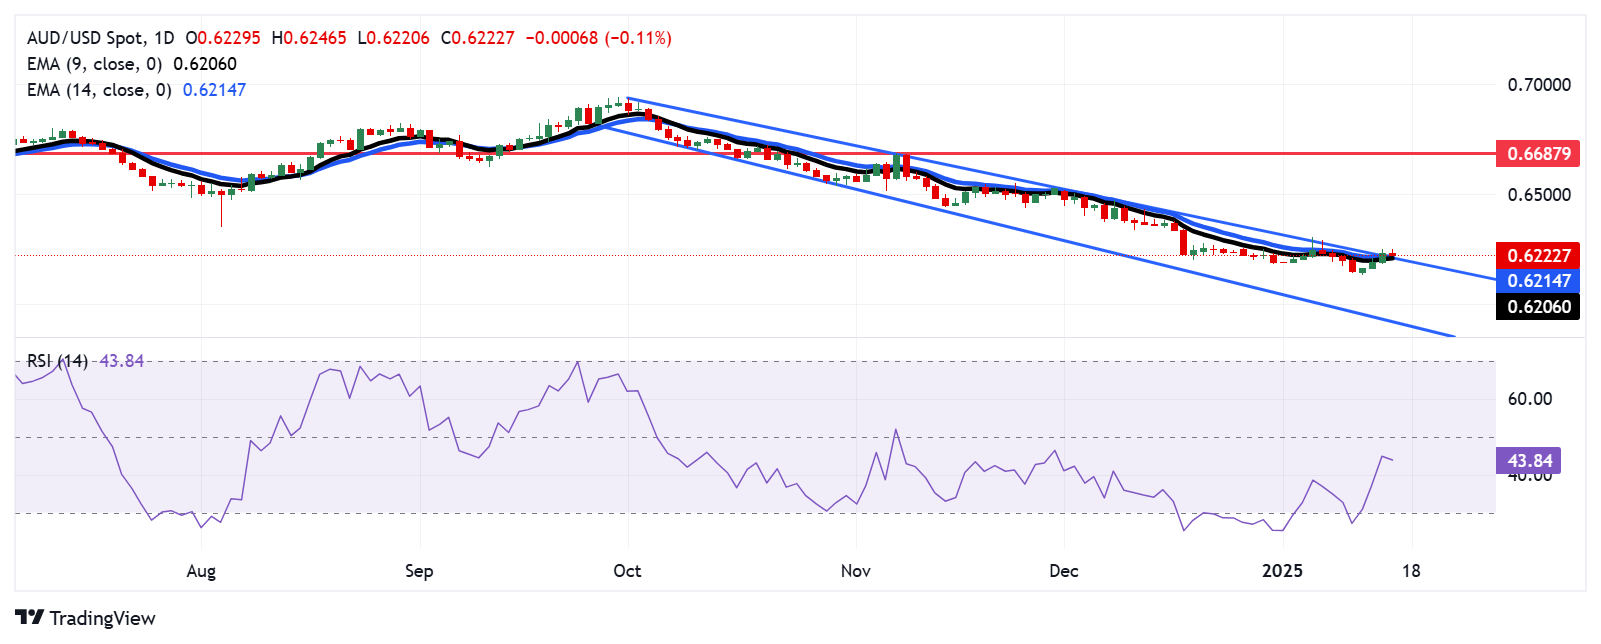
Australian Dollar PRICE Today
The table below shows the percentage change of Australian Dollar (AUD) against listed major currencies today. Australian Dollar was the strongest against the British Pound.
USD EUR GBP JPY CAD AUD NZD CHF USD 0.06% 0.13% -0.53% 0.13% 0.14% 0.05% -0.04% EUR -0.06% 0.07% -0.58% 0.07% 0.07% -0.01% -0.10% GBP -0.13% -0.07% -0.63% 0.00% 0.00% -0.08% -0.17% JPY 0.53% 0.58% 0.63% 0.67% 0.66% 0.53% 0.48% CAD -0.13% -0.07% -0.00% -0.67% 0.00% -0.08% -0.17% AUD -0.14% -0.07% -0.00% -0.66% -0.01% -0.08% -0.17% NZD -0.05% 0.01% 0.08% -0.53% 0.08% 0.08% -0.09% CHF 0.04% 0.10% 0.17% -0.48% 0.17% 0.17% 0.09% The heat map shows percentage changes of major currencies against each other. The base currency is picked from the left column, while the quote currency is picked from the top row. For example, if you pick the Australian Dollar from the left column and move along the horizontal line to the US Dollar, the percentage change displayed in the box will represent AUD (base)/USD (quote).
Australian Dollar FAQs
One of the most significant factors for the Australian Dollar (AUD) is the level of interest rates set by the Reserve Bank of Australia (RBA). Because Australia is a resource-rich country another key driver is the price of its biggest export, Iron Ore. The health of the Chinese economy, its largest trading partner, is a factor, as well as inflation in Australia, its growth rate and Trade Balance. Market sentiment – whether investors are taking on more risky assets (risk-on) or seeking safe-havens (risk-off) – is also a factor, with risk-on positive for AUD.
The Reserve Bank of Australia (RBA) influences the Australian Dollar (AUD) by setting the level of interest rates that Australian banks can lend to each other. This influences the level of interest rates in the economy as a whole. The main goal of the RBA is to maintain a stable inflation rate of 2-3% by adjusting interest rates up or down. Relatively high interest rates compared to other major central banks support the AUD, and the opposite for relatively low. The RBA can also use quantitative easing and tightening to influence credit conditions, with the former AUD-negative and the latter AUD-positive.
China is Australia’s largest trading partner so the health of the Chinese economy is a major influence on the value of the Australian Dollar (AUD). When the Chinese economy is doing well it purchases more raw materials, goods and services from Australia, lifting demand for the AUD, and pushing up its value. The opposite is the case when the Chinese economy is not growing as fast as expected. Positive or negative surprises in Chinese growth data, therefore, often have a direct impact on the Australian Dollar and its pairs.
Iron Ore is Australia’s largest export, accounting for $118 billion a year according to data from 2021, with China as its primary destination. The price of Iron Ore, therefore, can be a driver of the Australian Dollar. Generally, if the price of Iron Ore rises, AUD also goes up, as aggregate demand for the currency increases. The opposite is the case if the price of Iron Ore falls. Higher Iron Ore prices also tend to result in a greater likelihood of a positive Trade Balance for Australia, which is also positive of the AUD.
The Trade Balance, which is the difference between what a country earns from its exports versus what it pays for its imports, is another factor that can influence the value of the Australian Dollar. If Australia produces highly sought after exports, then its currency will gain in value purely from the surplus demand created from foreign buyers seeking to purchase its exports versus what it spends to purchase imports. Therefore, a positive net Trade Balance strengthens the AUD, with the opposite effect if the Trade Balance is negative.
-
03:31
USD/KRW drops and pops after BoK surprises with rates on-hold decision
Speaking at the post-policy meeting press conference, Bank of Korea (BoK) Governor Rhee Chang-yong said that “Thursday's rate decision was not unanimous.”
Additional takeaways
Board member Shin Sung-hwan dissented to Thursday's rate decision.
Need for further rate cuts higher now that downside risks to economic growth has heightened.
All board members said a rate cut would be necessary but took consideration of Dollar-Won FX rates fluctuating due to political turmoil.
Dollar-Won FX rates considerably higher than south korea's economic fundamental.
Need to monitor the impact of two policy rate cuts.
Dollar-won FX rates are unnecessarily high.
Six board members said they are open to rate cuts in the three month ahead window.
Board member Shin said while FX rates is a concern, a rate cut still is appropriate to support growth.
Inflation-targeting central to monetary policy decision making.
Would be appropriate to wait until domestic political turmoil stabilizes, some certainty comes from new US administration before changing policies.
Political turmoil impacting South Korea's economy.
Thursday's rate decision was not because dollar-won rates are at a certain level, but because political uncertainties have been impacting the FX rates.
BoK plans to announce interim assessment on the impact of martial law declaration next week.
The South Korean central bank unexpectedly held its policy interest rate steady at 3% earlier this Thursday, weighing the impact of the previous two rate cuts and the political upheaval on the economy and the exchange rate.
The decision is the first since impeached President Yoon Suk Yeol's attempt to impose martial law in early December. South Korean authorities arrested Yoon on Wednesday.
USD/KRW reaction to the BoK’s policy event
USD/KRW fell hard to test 1,450 in a knee-jerk reaction to the BoK’s surprise rate decision. However, buyers jumped back on the bids following the dovish remarks from Governor Rhee. At the time of writing, USD/KRW has recovered losses to trade neutral at 1,4554.
-
03:30
Commodities. Daily history for Wednesday, January 15, 2025
Raw materials Closed Change, % Silver 30.618 2.43 Gold 2695.99 0.72 Palladium 961.02 2.58 -
03:11
BoJ likely to raise rates next week, barring major market rout following Trump inauguration – Bloomberg
Bloomberg reported on Thursday, citing several unnamed people, that the Bank of Japan (BoJ) is expected to raise interest rates next week, barring a major market rout following US President-elect Donald Trump’s inauguration.
The Japanese Yen witnessed a fresh leg lower to near 155.20 against the US Dollar following this report, with USD/JPY now recovering some losses to trade at 155.60, still down 0.50% on the day.
Japanese Yen PRICE Today
The table below shows the percentage change of Japanese Yen (JPY) against listed major currencies today. Japanese Yen was the strongest against the British Pound.
USD EUR GBP JPY CAD AUD NZD CHF USD 0.06% 0.13% -0.56% 0.12% 0.10% 0.03% -0.04% EUR -0.06% 0.07% -0.62% 0.06% 0.03% -0.03% -0.10% GBP -0.13% -0.07% -0.68% -0.01% -0.03% -0.10% -0.17% JPY 0.56% 0.62% 0.68% 0.68% 0.66% 0.54% 0.53% CAD -0.12% -0.06% 0.01% -0.68% -0.02% -0.09% -0.16% AUD -0.10% -0.03% 0.03% -0.66% 0.02% -0.07% -0.13% NZD -0.03% 0.03% 0.10% -0.54% 0.09% 0.07% -0.07% CHF 0.04% 0.10% 0.17% -0.53% 0.16% 0.13% 0.07% The heat map shows percentage changes of major currencies against each other. The base currency is picked from the left column, while the quote currency is picked from the top row. For example, if you pick the Japanese Yen from the left column and move along the horizontal line to the US Dollar, the percentage change displayed in the box will represent JPY (base)/USD (quote).
Bank of Japan FAQs
The Bank of Japan (BoJ) is the Japanese central bank, which sets monetary policy in the country. Its mandate is to issue banknotes and carry out currency and monetary control to ensure price stability, which means an inflation target of around 2%.
The Bank of Japan embarked in an ultra-loose monetary policy in 2013 in order to stimulate the economy and fuel inflation amid a low-inflationary environment. The bank’s policy is based on Quantitative and Qualitative Easing (QQE), or printing notes to buy assets such as government or corporate bonds to provide liquidity. In 2016, the bank doubled down on its strategy and further loosened policy by first introducing negative interest rates and then directly controlling the yield of its 10-year government bonds. In March 2024, the BoJ lifted interest rates, effectively retreating from the ultra-loose monetary policy stance.
The Bank’s massive stimulus caused the Yen to depreciate against its main currency peers. This process exacerbated in 2022 and 2023 due to an increasing policy divergence between the Bank of Japan and other main central banks, which opted to increase interest rates sharply to fight decades-high levels of inflation. The BoJ’s policy led to a widening differential with other currencies, dragging down the value of the Yen. This trend partly reversed in 2024, when the BoJ decided to abandon its ultra-loose policy stance.
A weaker Yen and the spike in global energy prices led to an increase in Japanese inflation, which exceeded the BoJ’s 2% target. The prospect of rising salaries in the country – a key element fuelling inflation – also contributed to the move.
-
03:04
WTI declines below $79.00 as prospects improve for a Gaza ceasefire
- WTI price loses ground to near $78.85 in Thursday’s Asian session.
- Israel and Hamas agreed to a ceasefire deal, weighing on the WTI price.
- US crude oil inventories declined by 1.962 million barrels last week, according to the EIA.
West Texas Intermediate (WTI), the US crude oil benchmark, is trading around $78.85 on Thursday. The WTI price edges lower as improved prospects for a ceasefire between Hamas and Israel could ease geopolitical tensions in the Middle East, which weigh on the WTI price.
According to an official, Israel and Hamas agreed to a deal to halt fighting in Gaza and exchange Israeli hostages for Palestinian prisoners. An ending of conflicts between Israel and Hamas will ease tensions in the Middle East and reduce the threats of disruption to crude supplies in the region. This, in turn, could undermine the black gold price.
However, US crude oil stockpiles extend decline, which might cap the downside for the WTI price. The US Energy Information Administration weekly report showed crude oil stockpiles in the United States for the week ending January 10 decreased by 1.962 million barrels, compared to a decline of 959K barrels in the previous week. The market consensus estimated that stocks would fall by 1.6 million barrels.Oil traders await the release of US Retail Sales for December and weekly Initial Jobless Claims for fresh impetus, which are due later on Thursday. In case of a weaker-than-expected outcome, this could drag the Greenback lower and lift the USD-denominated commodity price.
WTI Oil FAQs
WTI Oil is a type of Crude Oil sold on international markets. The WTI stands for West Texas Intermediate, one of three major types including Brent and Dubai Crude. WTI is also referred to as “light” and “sweet” because of its relatively low gravity and sulfur content respectively. It is considered a high quality Oil that is easily refined. It is sourced in the United States and distributed via the Cushing hub, which is considered “The Pipeline Crossroads of the World”. It is a benchmark for the Oil market and WTI price is frequently quoted in the media.
Like all assets, supply and demand are the key drivers of WTI Oil price. As such, global growth can be a driver of increased demand and vice versa for weak global growth. Political instability, wars, and sanctions can disrupt supply and impact prices. The decisions of OPEC, a group of major Oil-producing countries, is another key driver of price. The value of the US Dollar influences the price of WTI Crude Oil, since Oil is predominantly traded in US Dollars, thus a weaker US Dollar can make Oil more affordable and vice versa.
The weekly Oil inventory reports published by the American Petroleum Institute (API) and the Energy Information Agency (EIA) impact the price of WTI Oil. Changes in inventories reflect fluctuating supply and demand. If the data shows a drop in inventories it can indicate increased demand, pushing up Oil price. Higher inventories can reflect increased supply, pushing down prices. API’s report is published every Tuesday and EIA’s the day after. Their results are usually similar, falling within 1% of each other 75% of the time. The EIA data is considered more reliable, since it is a government agency.
OPEC (Organization of the Petroleum Exporting Countries) is a group of 12 Oil-producing nations who collectively decide production quotas for member countries at twice-yearly meetings. Their decisions often impact WTI Oil prices. When OPEC decides to lower quotas, it can tighten supply, pushing up Oil prices. When OPEC increases production, it has the opposite effect. OPEC+ refers to an expanded group that includes ten extra non-OPEC members, the most notable of which is Russia.
-
02:15
PBOC sets USD/CNY reference rate at 7.1881 vs. 7.1883 previous
The People’s Bank of China (PBoC) set the USD/CNY central rate for the trading session ahead on Thursday at 7.1881 as compared to the previous day's fix of 7.1883 and 7.3247 Reuters estimates.
PBOC FAQs
The primary monetary policy objectives of the People's Bank of China (PBoC) are to safeguard price stability, including exchange rate stability, and promote economic growth. China’s central bank also aims to implement financial reforms, such as opening and developing the financial market.
The PBoC is owned by the state of the People's Republic of China (PRC), so it is not considered an autonomous institution. The Chinese Communist Party (CCP) Committee Secretary, nominated by the Chairman of the State Council, has a key influence on the PBoC’s management and direction, not the governor. However, Mr. Pan Gongsheng currently holds both of these posts.
Unlike the Western economies, the PBoC uses a broader set of monetary policy instruments to achieve its objectives. The primary tools include a seven-day Reverse Repo Rate (RRR), Medium-term Lending Facility (MLF), foreign exchange interventions and Reserve Requirement Ratio (RRR). However, The Loan Prime Rate (LPR) is China’s benchmark interest rate. Changes to the LPR directly influence the rates that need to be paid in the market for loans and mortgages and the interest paid on savings. By changing the LPR, China’s central bank can also influence the exchange rates of the Chinese Renminbi.
Yes, China has 19 private banks – a small fraction of the financial system. The largest private banks are digital lenders WeBank and MYbank, which are backed by tech giants Tencent and Ant Group, per The Straits Times. In 2014, China allowed domestic lenders fully capitalized by private funds to operate in the state-dominated financial sector.
-
02:15
Bessent says Dollar’s global status is critical to US economy
Scott Bessent, Donald Trump’s nominee for Treasury secretary, said on Wednesday that maintaining the US Dollar (USD) as the world’s reserve asset is important to US economic health and the nation’s future, per Bloomberg.
Key quotes
“We must secure supply chains that are vulnerable to strategic competitors, and we must carefully deploy sanctions as part of a whole-of-government approach to address our national security requirements,”
“And critically, we must ensure that the US dollar remains the world’s reserve currency.”
“Trump was the first president in modern times to recognize the need to change our trade policy and stand up for American workers,”
“Productive investment that grows the economy must be prioritized over wasteful spending that drives inflation.”Market reaction
The US Dollar Index (DXY) is trading 0.04% lower on the day at 109.06, as of writing.
US Dollar FAQs
The US Dollar (USD) is the official currency of the United States of America, and the ‘de facto’ currency of a significant number of other countries where it is found in circulation alongside local notes. It is the most heavily traded currency in the world, accounting for over 88% of all global foreign exchange turnover, or an average of $6.6 trillion in transactions per day, according to data from 2022. Following the second world war, the USD took over from the British Pound as the world’s reserve currency. For most of its history, the US Dollar was backed by Gold, until the Bretton Woods Agreement in 1971 when the Gold Standard went away.
The most important single factor impacting on the value of the US Dollar is monetary policy, which is shaped by the Federal Reserve (Fed). The Fed has two mandates: to achieve price stability (control inflation) and foster full employment. Its primary tool to achieve these two goals is by adjusting interest rates. When prices are rising too quickly and inflation is above the Fed’s 2% target, the Fed will raise rates, which helps the USD value. When inflation falls below 2% or the Unemployment Rate is too high, the Fed may lower interest rates, which weighs on the Greenback.
In extreme situations, the Federal Reserve can also print more Dollars and enact quantitative easing (QE). QE is the process by which the Fed substantially increases the flow of credit in a stuck financial system. It is a non-standard policy measure used when credit has dried up because banks will not lend to each other (out of the fear of counterparty default). It is a last resort when simply lowering interest rates is unlikely to achieve the necessary result. It was the Fed’s weapon of choice to combat the credit crunch that occurred during the Great Financial Crisis in 2008. It involves the Fed printing more Dollars and using them to buy US government bonds predominantly from financial institutions. QE usually leads to a weaker US Dollar.
Quantitative tightening (QT) is the reverse process whereby the Federal Reserve stops buying bonds from financial institutions and does not reinvest the principal from the bonds it holds maturing in new purchases. It is usually positive for the US Dollar.
-
02:00
South Korea BoK Interest Rate Decision came in at 3%, above forecasts (2.75%)
-
01:31
Australia Part-Time Employment: 80K (December) vs -17K
-
01:30
Australia Participation Rate registered at 67.1% above expectations (67%) in December
-
01:30
Australia Unemployment Rate s.a. meets forecasts (4%) in December
-
01:30
Stocks. Daily history for Wednesday, January 15, 2025
Index Change, points Closed Change, % NIKKEI 225 -29.72 38444.58 -0.08 Hang Seng 66.29 19286.07 0.34 KOSPI -0.59 2496.81 -0.02 ASX 200 -17.7 8213.3 -0.22 DAX 303.35 20574.68 1.5 CAC 40 50.92 7474.59 0.69 Dow Jones 703.27 43221.55 1.65 S&P 500 107 5949.91 1.83 NASDAQ Composite 466.84 19511.23 2.45 -
01:30
Australia Employment Change s.a. registered at 56.3K above expectations (15K) in December
-
01:30
Australia Full-Time Employment declined to -23.7K in December from previous 52.6K
-
01:18
EUR/USD flat lines near 1.0300 on softer US CPI data
- EUR/USD trades flat around 1.0295 in Thursday’s early Asian session.
- The softer US core CPI data revives Fed easing expectations, which cap the upside for the USD.
- Traders see the ECB delivering three or four rate cuts this year.
The EUR/USD pair holds steady around 1.0295 during the early Asian session on Thursday. The cooler-than-expected US Consumer Price Index (CPI) inflation data for December raises the bet that the US Federal Reserve (Fed) could cut interest rates twice this year, which weighs on the Greenback. However, rising concerns over Eurozone economic growth might cap the upside for the major pair.
The US Dollar (USD) declined after the US core CPI data came in softer than estimated, triggering expectations that the Fed's easing cycle may not be over yet. Markets now expect the US central bank to deliver 40 basis points (bps) of rate cuts by year-end, compared with about 31 bps before the inflation data.
Across the pond, the European Central Bank (ECB) delivered rate cuts four times last year, and traders expect three or four moves this year due to the concerns about the Eurozone's weak economic outlook. The rising bets of further interest rate reductions from the ECB could undermine the Euro (EUR) against the USD in the near term.
Later on Thursday, investors will keep an eye on Germany’s Harmonized Index of Consumer Prices (HICP) for December and the ECB Monetary Policy Meeting Accounts. On the US docket, the Retail Sales for December and weekly Initial Jobless Claims will be the highlights.Euro FAQs
The Euro is the currency for the 19 European Union countries that belong to the Eurozone. It is the second most heavily traded currency in the world behind the US Dollar. In 2022, it accounted for 31% of all foreign exchange transactions, with an average daily turnover of over $2.2 trillion a day. EUR/USD is the most heavily traded currency pair in the world, accounting for an estimated 30% off all transactions, followed by EUR/JPY (4%), EUR/GBP (3%) and EUR/AUD (2%).
The European Central Bank (ECB) in Frankfurt, Germany, is the reserve bank for the Eurozone. The ECB sets interest rates and manages monetary policy. The ECB’s primary mandate is to maintain price stability, which means either controlling inflation or stimulating growth. Its primary tool is the raising or lowering of interest rates. Relatively high interest rates – or the expectation of higher rates – will usually benefit the Euro and vice versa. The ECB Governing Council makes monetary policy decisions at meetings held eight times a year. Decisions are made by heads of the Eurozone national banks and six permanent members, including the President of the ECB, Christine Lagarde.
Eurozone inflation data, measured by the Harmonized Index of Consumer Prices (HICP), is an important econometric for the Euro. If inflation rises more than expected, especially if above the ECB’s 2% target, it obliges the ECB to raise interest rates to bring it back under control. Relatively high interest rates compared to its counterparts will usually benefit the Euro, as it makes the region more attractive as a place for global investors to park their money.
Data releases gauge the health of the economy and can impact on the Euro. Indicators such as GDP, Manufacturing and Services PMIs, employment, and consumer sentiment surveys can all influence the direction of the single currency. A strong economy is good for the Euro. Not only does it attract more foreign investment but it may encourage the ECB to put up interest rates, which will directly strengthen the Euro. Otherwise, if economic data is weak, the Euro is likely to fall. Economic data for the four largest economies in the euro area (Germany, France, Italy and Spain) are especially significant, as they account for 75% of the Eurozone’s economy.
Another significant data release for the Euro is the Trade Balance. This indicator measures the difference between what a country earns from its exports and what it spends on imports over a given period. If a country produces highly sought after exports then its currency will gain in value purely from the extra demand created from foreign buyers seeking to purchase these goods. Therefore, a positive net Trade Balance strengthens a currency and vice versa for a negative balance.
-
01:15
Currencies. Daily history for Wednesday, January 15, 2025
Pare Closed Change, % AUDUSD 0.62258 0.52 EURJPY 160.998 -1.11 EURUSD 1.02891 -0.14 GBPJPY 191.542 -0.72 GBPUSD 1.22415 0.27 NZDUSD 0.56149 0.25 USDCAD 1.43388 -0.06 USDCHF 0.91265 0.02 USDJPY 156.468 -0.93 -
01:01
United Kingdom RICS Housing Price Balance came in at 28%, above forecasts (27%) in December
-
01:01
Australia Consumer Inflation Expectations declined to 4% in January from previous 4.2%
-
00:50
Japan Producer Price Index (MoM) came in at 0.3%, below expectations (0.4%) in December
-
00:50
Japan Producer Price Index (YoY) meets expectations (3.8%) in December
-
00:38
Fed’s Beige Book: Economic activity increases slightly to moderately at year-end
The Federal Reserve (Fed) commented in its latest Beige Book survey released on Wednesday that economic activity increased “slightly to moderately” across the US in late November and December, supported by strong holiday sales.
Key quotes
Economic activity increased slightly to moderately across the twelve Federal Reserve Districts in late November and December.
Consumer spending moved up moderately, with strong holiday sales exceeding expectations.
Manufacturing decreased slightly on the net; some manufacturers stockpiled inventories in anticipation of higher tariffs.
Commercial real estate sales edged up.
More optimism about the 2025 outlook, though concerns remain about immigration and tariff policy affecting the economy.
Employment ticked up slightly, with six Districts reporting increases and six reporting no change.
Wage growth picked up at a moderate pace, but there were reports of easing wage pressures.
Prices increased modestly overall, with growth ranging from flat to moderate.Market reaction
The US Dollar Index (DXY) is trading 0.04% lower on the day at 109.06, as of writing.
Fed FAQs
Monetary policy in the US is shaped by the Federal Reserve (Fed). The Fed has two mandates: to achieve price stability and foster full employment. Its primary tool to achieve these goals is by adjusting interest rates. When prices are rising too quickly and inflation is above the Fed’s 2% target, it raises interest rates, increasing borrowing costs throughout the economy. This results in a stronger US Dollar (USD) as it makes the US a more attractive place for international investors to park their money. When inflation falls below 2% or the Unemployment Rate is too high, the Fed may lower interest rates to encourage borrowing, which weighs on the Greenback.
The Federal Reserve (Fed) holds eight policy meetings a year, where the Federal Open Market Committee (FOMC) assesses economic conditions and makes monetary policy decisions. The FOMC is attended by twelve Fed officials – the seven members of the Board of Governors, the president of the Federal Reserve Bank of New York, and four of the remaining eleven regional Reserve Bank presidents, who serve one-year terms on a rotating basis.
In extreme situations, the Federal Reserve may resort to a policy named Quantitative Easing (QE). QE is the process by which the Fed substantially increases the flow of credit in a stuck financial system. It is a non-standard policy measure used during crises or when inflation is extremely low. It was the Fed’s weapon of choice during the Great Financial Crisis in 2008. It involves the Fed printing more Dollars and using them to buy high grade bonds from financial institutions. QE usually weakens the US Dollar.
Quantitative tightening (QT) is the reverse process of QE, whereby the Federal Reserve stops buying bonds from financial institutions and does not reinvest the principal from the bonds it holds maturing, to purchase new bonds. It is usually positive for the value of the US Dollar.
-
00:26
Canadian PM Trudeau: Nothing ruled out when it comes to responding to US tariffs
Canadian Prime Minister Justin Trudeau said on Wednesday that Canada will consider every kind of countermeasure if US President-elect Donald Trump goes ahead with a threat to impose a 25% tariff on Canadian imports, per Reuters.
Key quotes
"Nothing can be off the table if the U.S. continues to choose to move forward with these punishing tariffs," Trudeau said after meeting the premiers of the 10 provinces to discuss potential responses.”
"I support the principle of a proportional dollar for dollar response.”Market reaction
The USD/CAD pair is trading 0.05% higher on the day at 1.4335, as of writing.
Canadian Dollar FAQs
The key factors driving the Canadian Dollar (CAD) are the level of interest rates set by the Bank of Canada (BoC), the price of Oil, Canada’s largest export, the health of its economy, inflation and the Trade Balance, which is the difference between the value of Canada’s exports versus its imports. Other factors include market sentiment – whether investors are taking on more risky assets (risk-on) or seeking safe-havens (risk-off) – with risk-on being CAD-positive. As its largest trading partner, the health of the US economy is also a key factor influencing the Canadian Dollar.
The Bank of Canada (BoC) has a significant influence on the Canadian Dollar by setting the level of interest rates that banks can lend to one another. This influences the level of interest rates for everyone. The main goal of the BoC is to maintain inflation at 1-3% by adjusting interest rates up or down. Relatively higher interest rates tend to be positive for the CAD. The Bank of Canada can also use quantitative easing and tightening to influence credit conditions, with the former CAD-negative and the latter CAD-positive.
The price of Oil is a key factor impacting the value of the Canadian Dollar. Petroleum is Canada’s biggest export, so Oil price tends to have an immediate impact on the CAD value. Generally, if Oil price rises CAD also goes up, as aggregate demand for the currency increases. The opposite is the case if the price of Oil falls. Higher Oil prices also tend to result in a greater likelihood of a positive Trade Balance, which is also supportive of the CAD.
While inflation had always traditionally been thought of as a negative factor for a currency since it lowers the value of money, the opposite has actually been the case in modern times with the relaxation of cross-border capital controls. Higher inflation tends to lead central banks to put up interest rates which attracts more capital inflows from global investors seeking a lucrative place to keep their money. This increases demand for the local currency, which in Canada’s case is the Canadian Dollar.
Macroeconomic data releases gauge the health of the economy and can have an impact on the Canadian Dollar. Indicators such as GDP, Manufacturing and Services PMIs, employment, and consumer sentiment surveys can all influence the direction of the CAD. A strong economy is good for the Canadian Dollar. Not only does it attract more foreign investment but it may encourage the Bank of Canada to put up interest rates, leading to a stronger currency. If economic data is weak, however, the CAD is likely to fall.
-
00:14
BoE’s Taylor: Central bank should cut rates pre-emptively
The Bank of England (BoE) policymaker Alan Taylor said on Wednesday that the BoE should move quickly to cut interest rates “pre-emptively” as the UK is “in the last half mile on inflation.”
Key quotes
"Right now, I think it makes sense to cut rates pre-emptively to take out a little insurance against this change in the balance of risks, given that our policy rate is still far above neutral and would still remain very restrictive.”
"We are in the last half mile on inflation, but with the economy weakening, it’s time to get interest rates back toward normal to sustain a soft landing.”
"It is this logic that convinced me to vote for an interest rate cut in December.”
“On multiple fronts, UK businesses and households could face a near-term cashflow squeeze, and we need to keep a careful eye on this important potential downside trigger.”
“I fully appreciate these challenges for businesses and households and the headwinds they pose for the UK economic outlook, together with all the other emerging downside economic risks in the UK and around the world.”Market reaction
The GBP/USD pair is trading 0.03% lower on the day at 1.2239, as of writing.
BoE FAQs
The Bank of England (BoE) decides monetary policy for the United Kingdom. Its primary goal is to achieve ‘price stability’, or a steady inflation rate of 2%. Its tool for achieving this is via the adjustment of base lending rates. The BoE sets the rate at which it lends to commercial banks and banks lend to each other, determining the level of interest rates in the economy overall. This also impacts the value of the Pound Sterling (GBP).
When inflation is above the Bank of England’s target it responds by raising interest rates, making it more expensive for people and businesses to access credit. This is positive for the Pound Sterling because higher interest rates make the UK a more attractive place for global investors to park their money. When inflation falls below target, it is a sign economic growth is slowing, and the BoE will consider lowering interest rates to cheapen credit in the hope businesses will borrow to invest in growth-generating projects – a negative for the Pound Sterling.
In extreme situations, the Bank of England can enact a policy called Quantitative Easing (QE). QE is the process by which the BoE substantially increases the flow of credit in a stuck financial system. QE is a last resort policy when lowering interest rates will not achieve the necessary result. The process of QE involves the BoE printing money to buy assets – usually government or AAA-rated corporate bonds – from banks and other financial institutions. QE usually results in a weaker Pound Sterling.
Quantitative tightening (QT) is the reverse of QE, enacted when the economy is strengthening and inflation starts rising. Whilst in QE the Bank of England (BoE) purchases government and corporate bonds from financial institutions to encourage them to lend; in QT, the BoE stops buying more bonds, and stops reinvesting the principal maturing on the bonds it already holds. It is usually positive for the Pound Sterling.
The Trade Balance, which is the difference between what a country earns from its exports versus what it pays for its imports, is another factor that can influence the value of the Australi
-
00:01
USD/CAD holds below 1.4350 as US CPI data boosts Fed rate cut bets
- USD/CAD softens to around 1.4335 in Thursday’s early Asian session.
- The cooler-than-expected US core CPI revives bets on Fed rate cuts this year.
- Crude oil prices rise on US crude draw and Russia sanctions, supporting the commodity-linked Loonie.
The USD/CAD pair extends the decline to near 1.4335 during the early Asian session on Thursday. The US Dollar (USD) weakens after the cooler-than-expected inflation data triggered the expectation that the US Federal Reserve (Fed) could cut interest rates twice this year.
Data released by the Bureau of Labor Statistics on Thursday showed that the US Consumer Price Index (CPI) climbed 2.9% on a yearly basis in December, compared to 2.7% in November. This reading came in line with market expectations. The core CPI, which excludes volatile food and energy prices, rose 3.2% on a yearly basis in December, below the previous reading and the market consensus of 3.3%.
The softer inflation data revives the bets on Fed rate cuts this year, weighing on the Greenback. "The cooler inflation print was a sign for traders to cut some long positions in the dollar, said Joseph Trevisani, senior analyst at FX Street in New York.
On the Loonie front, a rise in crude oil prices amid a large draw in U.S. crude stockpiles and potential supply disruptions caused by new United States (US) sanctions on Russia boosts the commodity-linked Canadian Dollar (CAD). Canada is the largest oil exporter to the US, and higher crude oil prices tend to have a positive impact on the CAD value.Canadian Dollar FAQs
The key factors driving the Canadian Dollar (CAD) are the level of interest rates set by the Bank of Canada (BoC), the price of Oil, Canada’s largest export, the health of its economy, inflation and the Trade Balance, which is the difference between the value of Canada’s exports versus its imports. Other factors include market sentiment – whether investors are taking on more risky assets (risk-on) or seeking safe-havens (risk-off) – with risk-on being CAD-positive. As its largest trading partner, the health of the US economy is also a key factor influencing the Canadian Dollar.
The Bank of Canada (BoC) has a significant influence on the Canadian Dollar by setting the level of interest rates that banks can lend to one another. This influences the level of interest rates for everyone. The main goal of the BoC is to maintain inflation at 1-3% by adjusting interest rates up or down. Relatively higher interest rates tend to be positive for the CAD. The Bank of Canada can also use quantitative easing and tightening to influence credit conditions, with the former CAD-negative and the latter CAD-positive.
The price of Oil is a key factor impacting the value of the Canadian Dollar. Petroleum is Canada’s biggest export, so Oil price tends to have an immediate impact on the CAD value. Generally, if Oil price rises CAD also goes up, as aggregate demand for the currency increases. The opposite is the case if the price of Oil falls. Higher Oil prices also tend to result in a greater likelihood of a positive Trade Balance, which is also supportive of the CAD.
While inflation had always traditionally been thought of as a negative factor for a currency since it lowers the value of money, the opposite has actually been the case in modern times with the relaxation of cross-border capital controls. Higher inflation tends to lead central banks to put up interest rates which attracts more capital inflows from global investors seeking a lucrative place to keep their money. This increases demand for the local currency, which in Canada’s case is the Canadian Dollar.
Macroeconomic data releases gauge the health of the economy and can have an impact on the Canadian Dollar. Indicators such as GDP, Manufacturing and Services PMIs, employment, and consumer sentiment surveys can all influence the direction of the CAD. A strong economy is good for the Canadian Dollar. Not only does it attract more foreign investment but it may encourage the Bank of Canada to put up interest rates, leading to a stronger currency. If economic data is weak, however, the CAD is likely to fall.
-