Noticias del mercado
-
23:50
Silver Price Forecast: XAG/USD holds firm, negative divergence looms
- Silver trades at $32.35 after briefly touching a three-month high of $33.39.
- RSI remains bullish, but failure to confirm higher highs raises caution.
- Key support at $31.92; upside targets $32.50 and $33.00 psychological level.
Silver price edges higher and registered gains of over 0.70% on Monday as US financial markets remained closed in observance of Presidents’ Day. At the time of writing, XAG/USD trades at $32.35 as Tuesday’s Asian session begins, virtually unchanged.
XAG/USD Price Forecast: Technical outlook
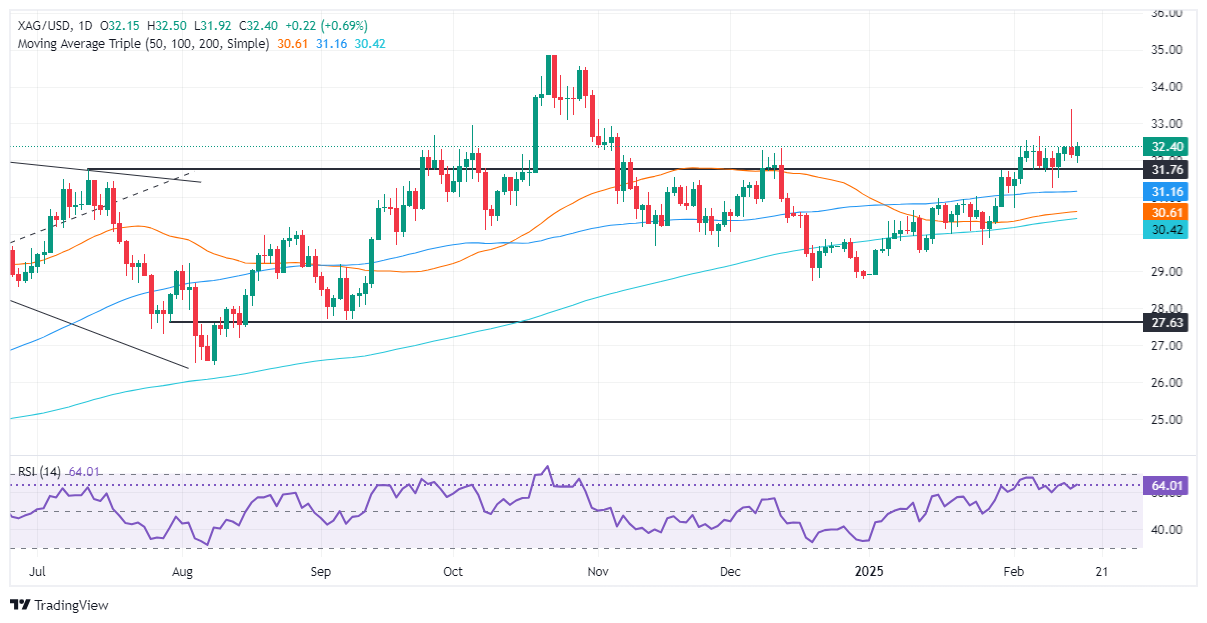
The grey metal shifted from neutral to upward biased, though a quick rejection candle printed on February 14 after hitting a three-month high of $33.39 could pave the way for further downside.
The Relative Strength Index (RSI) remains bullish, but it is worth noting that as XAG/USD spiked past $33.00, the RSI failed to record a higher high, indicating that a ‘negative divergence’ looms.
If Silver drops below the February 17 swing low of $31.92, the grey metal would be poised to test the 100-day Simple Moving Average (SMA) at $31.15. A breach of the latter will expose the 50 and 200-day SMAs, each at $30.60 and $30.42.
On the other hand, if XAG/USD rallies past $32.50, the psychological $33.00 mark would be the key resistance. Once surpassed, the year-to-date (YTD) high would be up next at $33.39.
XAG/USD Price Chart – Daily
Silver FAQs
Silver is a precious metal highly traded among investors. It has been historically used as a store of value and a medium of exchange. Although less popular than Gold, traders may turn to Silver to diversify their investment portfolio, for its intrinsic value or as a potential hedge during high-inflation periods. Investors can buy physical Silver, in coins or in bars, or trade it through vehicles such as Exchange Traded Funds, which track its price on international markets.
Silver prices can move due to a wide range of factors. Geopolitical instability or fears of a deep recession can make Silver price escalate due to its safe-haven status, although to a lesser extent than Gold's. As a yieldless asset, Silver tends to rise with lower interest rates. Its moves also depend on how the US Dollar (USD) behaves as the asset is priced in dollars (XAG/USD). A strong Dollar tends to keep the price of Silver at bay, whereas a weaker Dollar is likely to propel prices up. Other factors such as investment demand, mining supply – Silver is much more abundant than Gold – and recycling rates can also affect prices.
Silver is widely used in industry, particularly in sectors such as electronics or solar energy, as it has one of the highest electric conductivity of all metals – more than Copper and Gold. A surge in demand can increase prices, while a decline tends to lower them. Dynamics in the US, Chinese and Indian economies can also contribute to price swings: for the US and particularly China, their big industrial sectors use Silver in various processes; in India, consumers’ demand for the precious metal for jewellery also plays a key role in setting prices.
Silver prices tend to follow Gold's moves. When Gold prices rise, Silver typically follows suit, as their status as safe-haven assets is similar. The Gold/Silver ratio, which shows the number of ounces of Silver needed to equal the value of one ounce of Gold, may help to determine the relative valuation between both metals. Some investors may consider a high ratio as an indicator that Silver is undervalued, or Gold is overvalued. On the contrary, a low ratio might suggest that Gold is undervalued relative to Silver.
-
23:08
AUD/JPY Price Analysis: Bears take control as pair slips below 20-day SMA
- AUD/JPY declines by 0.42% to 96.30 on Monday, extending its recent losing streak.
- RSI drops to negative territory, signaling increasing bearish pressure.
- The breach of the 20-day SMA confirms a shift in sentiment, putting sellers in control.
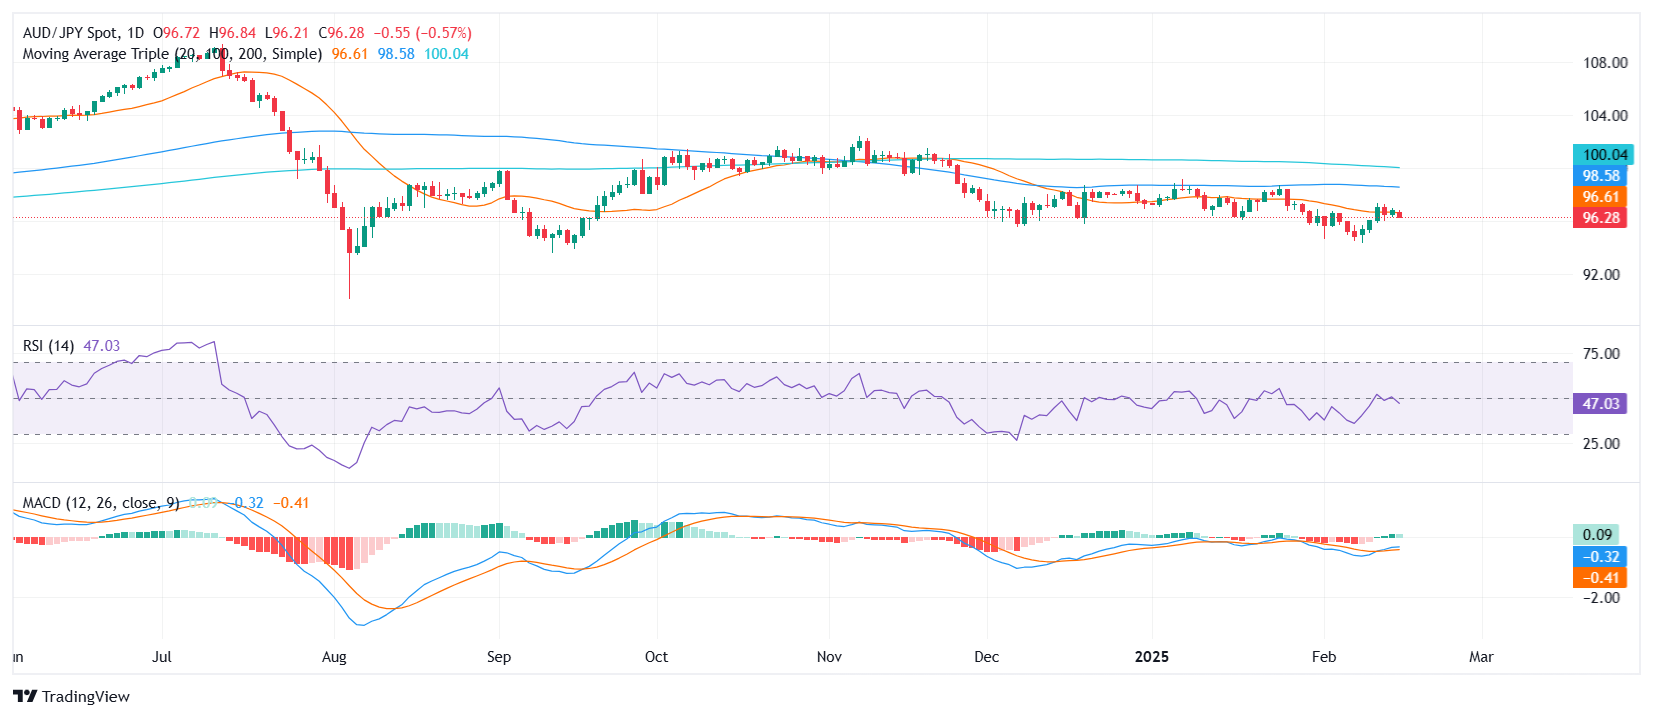
AUD/JPY continued its downward movement on Monday, losing 0.42% to settle around 96.30. The break below the 20-day Simple Moving Average (SMA) reinforces the weakening trend, as buyers struggle to regain momentum. The pair has now given up most of its recent gains, with sellers gaining traction.
Momentum indicators paint a bearish picture. The Relative Strength Index (RSI) has fallen sharply to 48, reflecting increased downside pressure, while the Moving Average Convergence Divergence (MACD) histogram shows decreasing green bars, suggesting that bullish attempts are fading. The pair’s inability to hold above the 20-day SMA indicates that selling momentum could intensify.
If the downward trend persists, the next key support lies around 96.00, followed by 95.50. On the upside, buyers would need to push AUD/JPY back above the 20-day SMA near 96.60 to regain short-term control and shift sentiment toward a more neutral stance.
AUD/JPY daily chart
-
22:45
Australia RBA set to cut interest rate by 25 bps amid easing inflation
- The Reserve Bank of Australia is expected to cut the OCR by 25 basis points.
- Australian core inflation eased in the final quarter of 2024 but remained above the RBA’s target.
- The Australian Dollar consolidates gains against its American rival ahead of the announcement.
The Reserve Bank of Australia (RBA) will announce its first monetary policy decision of 2025 on Tuesday, and market participants anticipate the Board will cut the benchmark interest rate by 25 basis points (bps).
Since hiking the Official Cash Rate (OCR) to 4.35% in November 2023, the RBA has maintained it steady at this level, as inflation has remained stubbornly high. As a result, pressure on households and businesses has become a significant concern, with sluggish economic growth taking its toll on policymakers’ decisions.
Will this be the first of multiple interest rate cuts in Australia?
Indeed, inflation in Australia has given signs of improvement in December, boosting the odds for an interest rate cut in February.
The latest quarterly Consumer Price Index (CPI) released showed that inflation rose by less than anticipated in the final quarter of 2024. The RBA’s preferred inflation gauge, the Trimmed Mean CPI, was up 0.5% in the quarter, below the anticipated 0.6%, and the annualized figure hit 3.2%, down from the previous 3.5%.
Solid employment growth, on the other hand, weighs negatively on interest rate-cut odds. Annual employment growth strengthened to 3.1% in December from 2.3% in November, the strongest rate since October 2023. Australia is expected to have added 20K new jobs in January after creating 56,3K in December. January employment data, however, will not be available until after the RBA monetary policy announcement.
Back in December, the RBA’s decision accompanying the statement showed that “some of the upside risks to inflation appear to have eased and while the level of aggregate demand still appears to be above the economy’s supply capacity, that gap continues to close.”
However, the Minutes of the meeting released two weeks afterwards included a modest change in the wording. Officials were then “gaining some confidence” that inflation was moving sustainably towards their target of between 2% and 3%.
RBA Governor Michele Bullock also noted that the Board discussed that upside inflation risks had eased but not gone away, yet an interest rate cut or hike was not on the table.
Overall, market players anticipate a rate cut, but they do not expect it will be the first of many. On the contrary, the RBA is anticipated to maintain its cautious approach to monetary easing. The current restrictive policy settings would likely be unwound at a slow pace.
How will the Reserve Bank of Australia decision impact AUD/USD?
Should the RBA announce an expected 25 bps interest rate cut, the Australian Dollar (AUD) may come under selling pressure. However, how weak the AUD could be depends on what policymakers anticipate. If the Board announces an unexpected 50 bps trim or announces more cuts coming in the upcoming meetings, it would be quite bearish for the Aussie.
On the contrary, hints at spaced interest rate cuts may push the AUD up, as it would be read as a “hawkish cut.”
RBA Governor Michele Bullock will offer a press conference after the announcement and will have to explain much if the decision diverges from expectations.
Valeria Bednarik, Chief Analyst at FXStreet, says: “The AUD/USD pair peaked at 0.6373 ahead of the announcement, its highest since mid-December. The pair maintains its technically bullish stance amid broad US Dollar (USD) weakness. The Greenback trades on the back foot ever since financial markets understood US President Donald Trump's fiscal measures pushed the Federal Reserve (Fed) into the hawkish path.”
“In fact, uncertainty over what US tariffs may mean to the Australian economy will likely be part of the RBA’s announcement,” Bednarik added.
“Technically speaking, the AUD/USD pair has scope to extend its advance towards the 0.6470 region, where the pair presents multiple intraday highs and lows from the last few months. To reach such an altitude, the pair first needs to overcome the aforementioned intraday high, which is the immediate resistance level. Interim resistance comes next at 0.6430. A dovish outcome could push the pair through the 0.6300 threshold, with additional slides exposing the 0.6230 price zone.”
RBA FAQs
The Reserve Bank of Australia (RBA) sets interest rates and manages monetary policy for Australia. Decisions are made by a board of governors at 11 meetings a year and ad hoc emergency meetings as required. The RBA’s primary mandate is to maintain price stability, which means an inflation rate of 2-3%, but also “..to contribute to the stability of the currency, full employment, and the economic prosperity and welfare of the Australian people.” Its main tool for achieving this is by raising or lowering interest rates. Relatively high interest rates will strengthen the Australian Dollar (AUD) and vice versa. Other RBA tools include quantitative easing and tightening.
While inflation had always traditionally been thought of as a negative factor for currencies since it lowers the value of money in general, the opposite has actually been the case in modern times with the relaxation of cross-border capital controls. Moderately higher inflation now tends to lead central banks to put up their interest rates, which in turn has the effect of attracting more capital inflows from global investors seeking a lucrative place to keep their money. This increases demand for the local currency, which in the case of Australia is the Aussie Dollar.
Macroeconomic data gauges the health of an economy and can have an impact on the value of its currency. Investors prefer to invest their capital in economies that are safe and growing rather than precarious and shrinking. Greater capital inflows increase the aggregate demand and value of the domestic currency. Classic indicators, such as GDP, Manufacturing and Services PMIs, employment, and consumer sentiment surveys can influence AUD. A strong economy may encourage the Reserve Bank of Australia to put up interest rates, also supporting AUD.
Quantitative Easing (QE) is a tool used in extreme situations when lowering interest rates is not enough to restore the flow of credit in the economy. QE is the process by which the Reserve Bank of Australia (RBA) prints Australian Dollars (AUD) for the purpose of buying assets – usually government or corporate bonds – from financial institutions, thereby providing them with much-needed liquidity. QE usually results in a weaker AUD.
Quantitative tightening (QT) is the reverse of QE. It is undertaken after QE when an economic recovery is underway and inflation starts rising. Whilst in QE the Reserve Bank of Australia (RBA) purchases government and corporate bonds from financial institutions to provide them with liquidity, in QT the RBA stops buying more assets, and stops reinvesting the principal maturing on the bonds it already holds. It would be positive (or bullish) for the Australian Dollar.
Economic Indicator
RBA Interest Rate Decision
The Reserve Bank of Australia (RBA) announces its interest rate decision at the end of its eight scheduled meetings per year. If the RBA is hawkish about the inflationary outlook of the economy and raises interest rates it is usually bullish for the Australian Dollar (AUD). Likewise, if the RBA has a dovish view on the Australian economy and keeps interest rates unchanged, or cuts them, it is seen as bearish for AUD.
Read more.Next release: Tue Feb 18, 2025 03:30
Frequency: Irregular
Consensus: 4.1%
Previous: 4.35%
Source: Reserve Bank of Australia
-
22:42
NZD/USD Price Analysis: Bulls extend rally toward key resistance
- NZD/USD climbs to 0.5735, reaching its highest level since late January.
- The pair maintains its bullish trajectory, posting a 1.50% gain since last week.
- Technical indicators remain supportive, with RSI rising sharply.
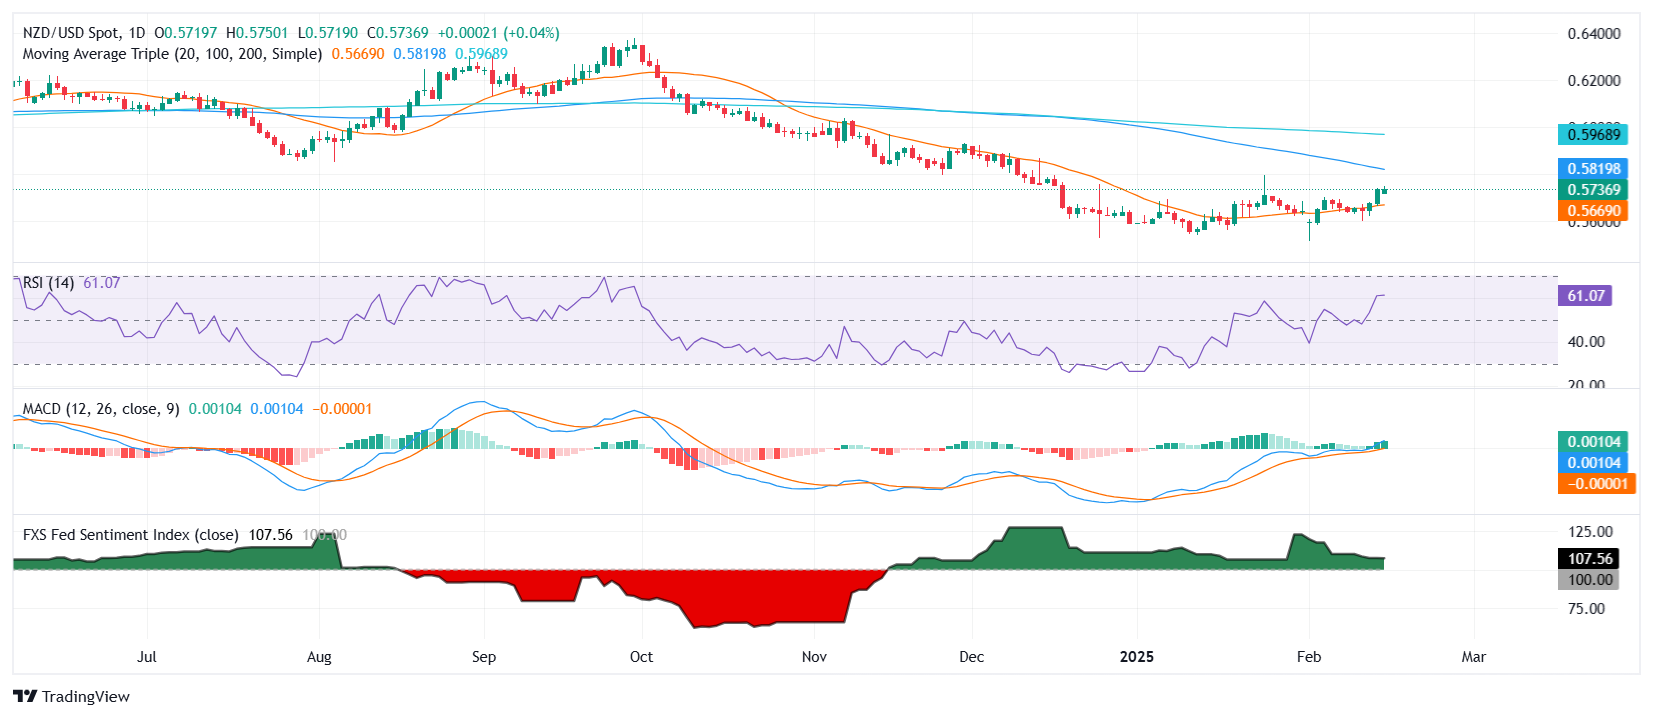
The NZD/USD pair continued its upward momentum on Monday, gaining 0.26% to reach 0.5735, marking its highest level since late January. The pair has now accumulated a 1.50% advance over the past week, with bulls showing no signs of letting up. The next key test lies ahead at the 100-day Simple Moving Average (SMA), positioned at 0.5825, a level that could determine whether the rally extends further.
Technical indicators suggest that buyers are firmly in control. The Relative Strength Index (RSI) has surged to 63, remaining in positive territory, indicating strong bullish sentiment. Meanwhile, the Moving Average Convergence Divergence (MACD) histogram continues to print rising green bars, reinforcing the ongoing momentum.
Looking ahead, further gains could materialize if NZD/USD manages to breach the 0.5750 level, with the next key resistance seen at the 100-day SMA around 0.5825. A sustained break above this area would open the door for a move toward 0.5900. Conversely, failure to maintain current levels may see the pair retreating toward initial support at 0.5700, followed by the 20-day SMA near 0.5650.
NZD/USD daily chart
-
22:09
Crude Oil rebounds on Monday, WTI climbs back over $71
- Crude Oil markets recovered lost ground on Monday, rising 0.8%.
- WTI bounced back above $71.00 per barrel but still remains soft.
- US drilling activity remains low, but demand remains soft.
West Texas Intermediate (WTI) US Crude Oil prices rebounded on Monday despite an overall lack of news during the US session. US markets were largely dark in celebration of President’s Day, keeping trade volumes in check.
Trade sanctions are keeping some shipping vessels moored offshore in Russia, crimping energy flows in the Asiatic regions. Global Crude Oil demand is also consistently underperforming forecasts, sparking some pumping agencies to slow up their production metrics. Despite turning the spigots lower, US production continues to outrun refiners’ ability to sop up production, which hit its tenth-highest ever week-on-week output capacity according to the Energy Information Administration (EIA).
The latest week-on-week Crude Oil supplies figures for the US are due from the EIA as well as the American Petroleum Institute (API). Both figures are slated for release on Wednesday.
WTI price forecast
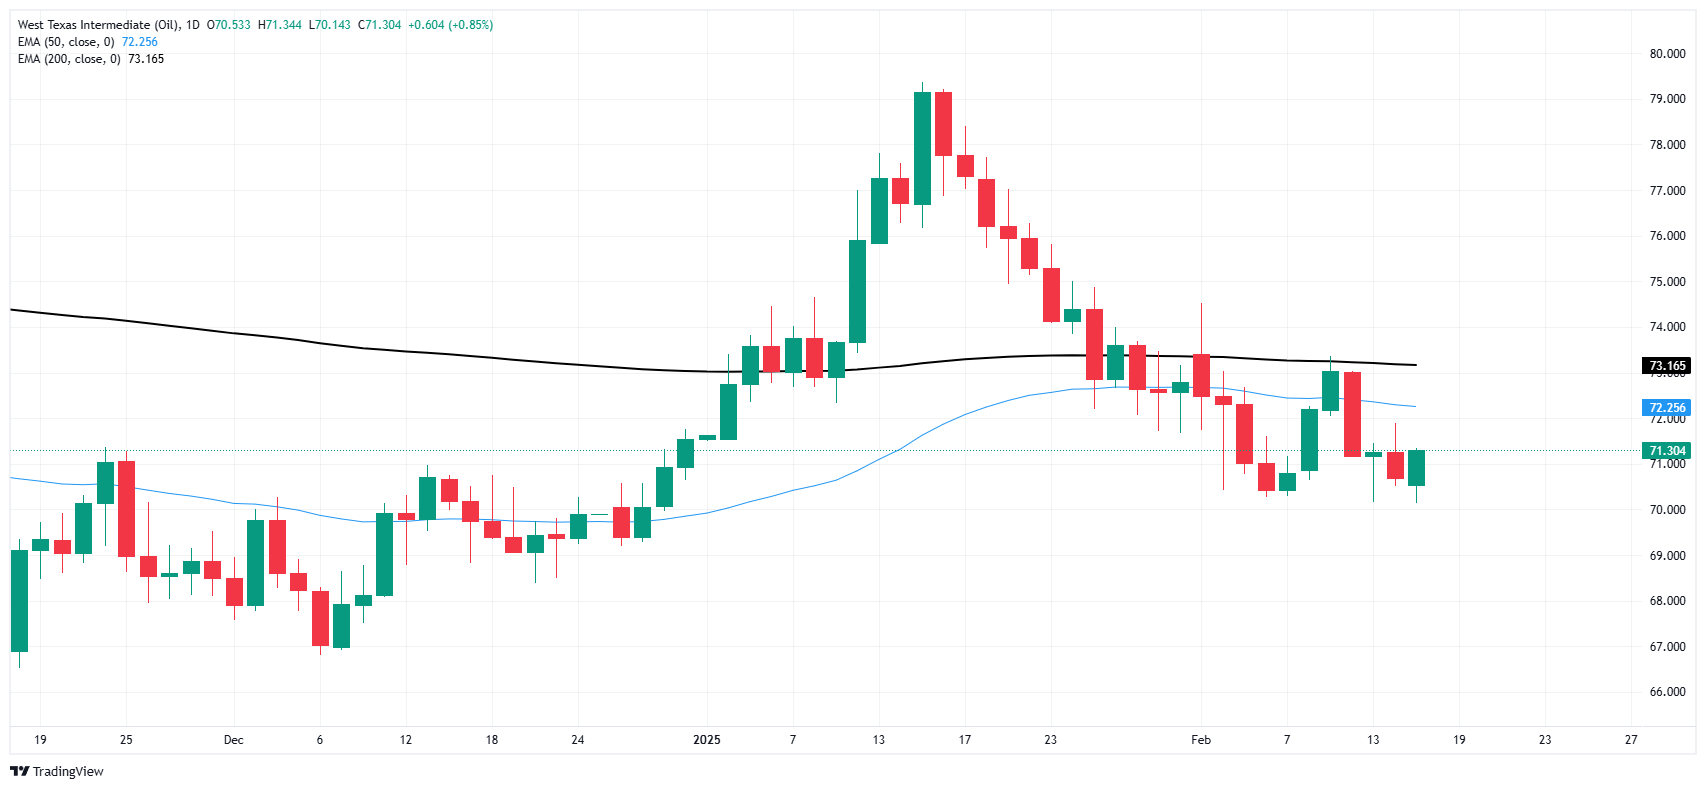
Crude Oil prices caught a bid on Monday, but barrel prices continue to run on the low side of the 50-day Exponential Moving Average (EMA) near $72.25. A near-term decline in energies price action appears to have abated after knocking WTI off its latest swing high above $79.00, dragging bids back below the 200-day EMA near $73.90 in the process. A technical floor is priced in just above the $70.00 major price handle, keeping prices caught in a tight technical range.
WTI daily chart
WTI Oil FAQs
WTI Oil is a type of Crude Oil sold on international markets. The WTI stands for West Texas Intermediate, one of three major types including Brent and Dubai Crude. WTI is also referred to as “light” and “sweet” because of its relatively low gravity and sulfur content respectively. It is considered a high quality Oil that is easily refined. It is sourced in the United States and distributed via the Cushing hub, which is considered “The Pipeline Crossroads of the World”. It is a benchmark for the Oil market and WTI price is frequently quoted in the media.
Like all assets, supply and demand are the key drivers of WTI Oil price. As such, global growth can be a driver of increased demand and vice versa for weak global growth. Political instability, wars, and sanctions can disrupt supply and impact prices. The decisions of OPEC, a group of major Oil-producing countries, is another key driver of price. The value of the US Dollar influences the price of WTI Crude Oil, since Oil is predominantly traded in US Dollars, thus a weaker US Dollar can make Oil more affordable and vice versa.
The weekly Oil inventory reports published by the American Petroleum Institute (API) and the Energy Information Agency (EIA) impact the price of WTI Oil. Changes in inventories reflect fluctuating supply and demand. If the data shows a drop in inventories it can indicate increased demand, pushing up Oil price. Higher inventories can reflect increased supply, pushing down prices. API’s report is published every Tuesday and EIA’s the day after. Their results are usually similar, falling within 1% of each other 75% of the time. The EIA data is considered more reliable, since it is a government agency.
OPEC (Organization of the Petroleum Exporting Countries) is a group of 12 Oil-producing nations who collectively decide production quotas for member countries at twice-yearly meetings. Their decisions often impact WTI Oil prices. When OPEC decides to lower quotas, it can tighten supply, pushing up Oil prices. When OPEC increases production, it has the opposite effect. OPEC+ refers to an expanded group that includes ten extra non-OPEC members, the most notable of which is Russia.
-
21:56
Australian Dollar refreshes two-month high near 0.6370 ahead of RBA monetary policy decision
- Aussie climbs on upbeat risk appetite and a softer US Dollar.
- Traders downplay the potential impact of new tariffs.
- RBA expected to cut the cash rate from 4.35% to 4.10%.
The AUD/USD pair posts a fresh two-month high at 0.6373 in Monday’s session. The Aussie pair strengthens as the Australian Dollar (AUD) performs strongly in an upbeat market mood. Market sentiment is favorable for risky assets as investors expect United States (US) President Donald Trump’s tariff agenda will not prove as impactful as initially feared, as well as a softer US Dollar (USD).
Daily digest market movers: Aussie set to test RBA decision
- Global trade disputes have recently boosted risk-sensitive currencies, with the Australian Dollar tracking higher as the United States Dollar retreated.
- The Aussie capitalized on the Greenback’s pullback, clawing back from midweek losses and briefly reclaiming the 0.6399 region at the top of its monthly range.
- With inflation pressures in Australia trending lower, market participants anticipate a Reserve Bank of Australia (RBA) rate cut from 4.35% to 4.10% on Tuesday.
- Nonetheless, the RBA could deliver a hawkish surprise by highlighting labor-market tightness and residual inflation risks.
- In that sense, markets will closely monitor the tone of the statement as the RBA could continue being the last of the G10 central banks to cut rates.
AUD/USD technical outlook: Momentum builds above 0.6365 as pair eyes 100-day SMA
The AUD/USD pair rose to 0.6365 on Monday, notching levels unseen since December and firmly crossing its 20-day Simple Moving Average. The Relative Strength Index (RSI) is at 67, pushing into near-overbought territory with strong upside momentum, while the Moving Average Convergence Divergence (MACD) histogram prints rising green bars.
Should risk appetite remain robust and markets absorb any RBA rate decision smoothly, the Aussie could extend gains toward the 100-day Simple Moving Average near 0.6670.
Australian Dollar FAQs
One of the most significant factors for the Australian Dollar (AUD) is the level of interest rates set by the Reserve Bank of Australia (RBA). Because Australia is a resource-rich country another key driver is the price of its biggest export, Iron Ore. The health of the Chinese economy, its largest trading partner, is a factor, as well as inflation in Australia, its growth rate and Trade Balance. Market sentiment – whether investors are taking on more risky assets (risk-on) or seeking safe-havens (risk-off) – is also a factor, with risk-on positive for AUD.
The Reserve Bank of Australia (RBA) influences the Australian Dollar (AUD) by setting the level of interest rates that Australian banks can lend to each other. This influences the level of interest rates in the economy as a whole. The main goal of the RBA is to maintain a stable inflation rate of 2-3% by adjusting interest rates up or down. Relatively high interest rates compared to other major central banks support the AUD, and the opposite for relatively low. The RBA can also use quantitative easing and tightening to influence credit conditions, with the former AUD-negative and the latter AUD-positive.
China is Australia’s largest trading partner so the health of the Chinese economy is a major influence on the value of the Australian Dollar (AUD). When the Chinese economy is doing well it purchases more raw materials, goods and services from Australia, lifting demand for the AUD, and pushing up its value. The opposite is the case when the Chinese economy is not growing as fast as expected. Positive or negative surprises in Chinese growth data, therefore, often have a direct impact on the Australian Dollar and its pairs.
Iron Ore is Australia’s largest export, accounting for $118 billion a year according to data from 2021, with China as its primary destination. The price of Iron Ore, therefore, can be a driver of the Australian Dollar. Generally, if the price of Iron Ore rises, AUD also goes up, as aggregate demand for the currency increases. The opposite is the case if the price of Iron Ore falls. Higher Iron Ore prices also tend to result in a greater likelihood of a positive Trade Balance for Australia, which is also positive of the AUD.
The Trade Balance, which is the difference between what a country earns from its exports versus what it pays for its imports, is another factor that can influence the value of the Australian Dollar. If Australia produces highly sought after exports, then its currency will gain in value purely from the surplus demand created from foreign buyers seeking to purchase its exports versus what it spends to purchase imports. Therefore, a positive net Trade Balance strengthens the AUD, with the opposite effect if the Trade Balance is negative.
-
21:53
USD/JPY Price Forecast: Slips below 152.00 as bearish momentum builds
- USD/JPY eyes February 7 low of 150.93 as downtrend resumes.
- RSI signals further weakness; potential drop to 148.64 if support breaks.
- Upside limited unless buyers reclaim 152.00 and 200-day SMA at 152.70.
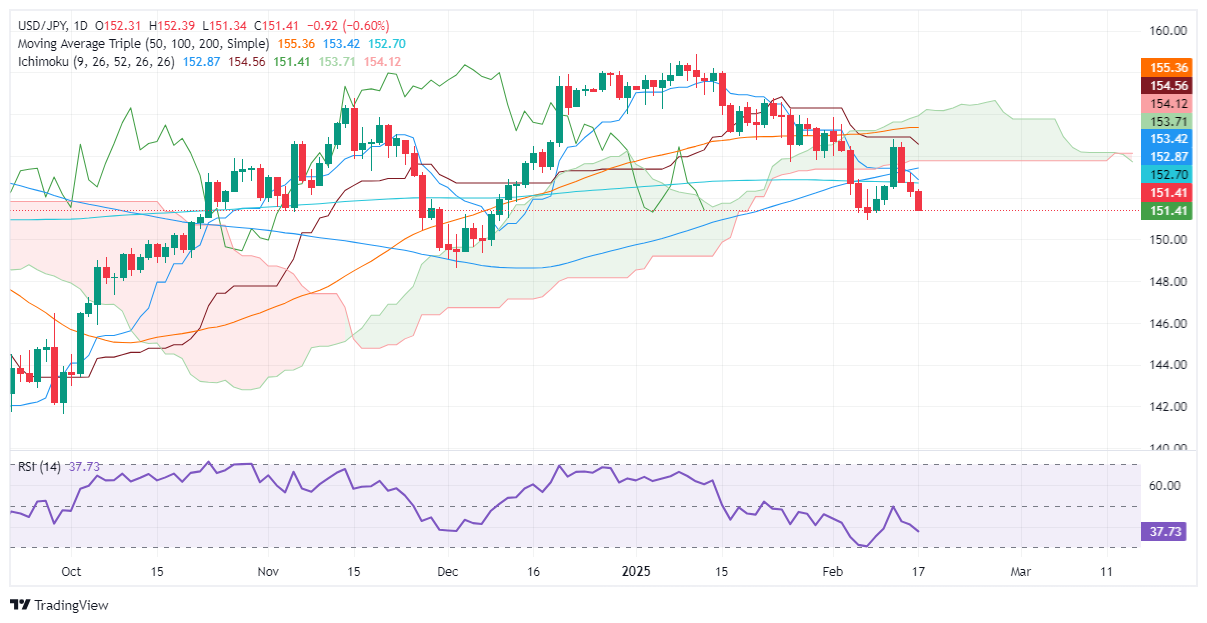
The USD/JPY retreats during the North American session and trades below the 200-day Simple Moving Average (SMA) of 152.70 for the second consecutive trading day. Thin liquidity conditions due to a holiday in the United States (US) keep the pair trading subdued below the 151.50 mark.
USD/JPY Price Forecast: Technical outlook
The USD/JPY downtrend resumed on Monday, with the pair dropping below 152.00. Sellers are eyeing a test of the latest cycle low, reached on February 7 at 150.93, which, once cleared, could pave the way for a 200 pip fall to challenge the December 3 swing low of 148.64.
The Relative Strength Index (RSI) remains bearish, favoring a further USD/JPY downside.
Conversely, if USD/JPY climbs past 152.00, buyers could test the 200-day SMA at 152.70. On further strength, the next resistance would be 153.00, ahead of the Senkou Span B at 153.73.
USD/JPY Price Chart – Daily
Japanese Yen FAQs
The Japanese Yen (JPY) is one of the world’s most traded currencies. Its value is broadly determined by the performance of the Japanese economy, but more specifically by the Bank of Japan’s policy, the differential between Japanese and US bond yields, or risk sentiment among traders, among other factors.
One of the Bank of Japan’s mandates is currency control, so its moves are key for the Yen. The BoJ has directly intervened in currency markets sometimes, generally to lower the value of the Yen, although it refrains from doing it often due to political concerns of its main trading partners. The BoJ ultra-loose monetary policy between 2013 and 2024 caused the Yen to depreciate against its main currency peers due to an increasing policy divergence between the Bank of Japan and other main central banks. More recently, the gradually unwinding of this ultra-loose policy has given some support to the Yen.
Over the last decade, the BoJ’s stance of sticking to ultra-loose monetary policy has led to a widening policy divergence with other central banks, particularly with the US Federal Reserve. This supported a widening of the differential between the 10-year US and Japanese bonds, which favored the US Dollar against the Japanese Yen. The BoJ decision in 2024 to gradually abandon the ultra-loose policy, coupled with interest-rate cuts in other major central banks, is narrowing this differential.
The Japanese Yen is often seen as a safe-haven investment. This means that in times of market stress, investors are more likely to put their money in the Japanese currency due to its supposed reliability and stability. Turbulent times are likely to strengthen the Yen’s value against other currencies seen as more risky to invest in.
-
20:21
Gold price rebounds as US holiday trade keeps volatility low
- Gold gains 0.56% despite thin liquidity on US Presidents’ Day.
- Geopolitical risks, US trade policies support bullion’s long-term outlook.
- Traders await FOMC Minutes, Fed speakers, and key US economic data.
Gold price climbed on Monday during the North American session, posting gains of 0.56% amid thin trading as markets in the United States (US) were closed in observance of Presidents’ Day. The XAU/USD traded at $2,898 after hitting a daily low of $2,878.
Last Friday, Gold registered its most significant loss since December 18, yet the outlook for the precious metal looks promising amid geopolitical uncertainties and US trade policies aimed at narrowing the deficit.
Data from the US was mixed last week with the Consumer Price Index (CPI) and the Producer Price Index (PPI) coming slightly hot. Retail Sales disappointed investors, who rushed to price in further easing by the Federal Reserve (Fed).
Fed officials have become cautious as inflation remains above the 2% goal. Philadelphia Fed President Patrick Harker said that policy needs to be “steady” for now and emphasized that monetary policy is in a good place. Harker added that the labor market is solid and that policy should be focused on lowering inflation.
Recently, Fed Governor Michelle Bowman said she expects inflation to decline, though she acknowledged that upside risks remain.
This week, the US economic docket will feature further Fed speakers, housing data, the latest Federal Open Market Committee (FOMC) Meeting Minutes, Initial Jobless Claims, and S&P Global Flash PMIs final reading for February.
Daily digest market movers: Gold price benefits from safe-haven demand
- The US 10-year Treasury bond yield tanked four basis points (bps) on Friday and sits at 4.478%.
- US real yields, which correlate inversely to Bullion prices, dropped four basis points to 2.039%, a tailwind for XAU/USD.
- The World Gold Council revealed that central banks purchased over 1,000 tonnes of Gold for the third consecutive year in 2024. Following Trump's electoral victory, purchases by central banks surged by more than 54% YoY to 333 tonnes, according to WGC data.
- Money market fed funds rate futures are pricing in 43 basis points of easing by the Fed in 2025.
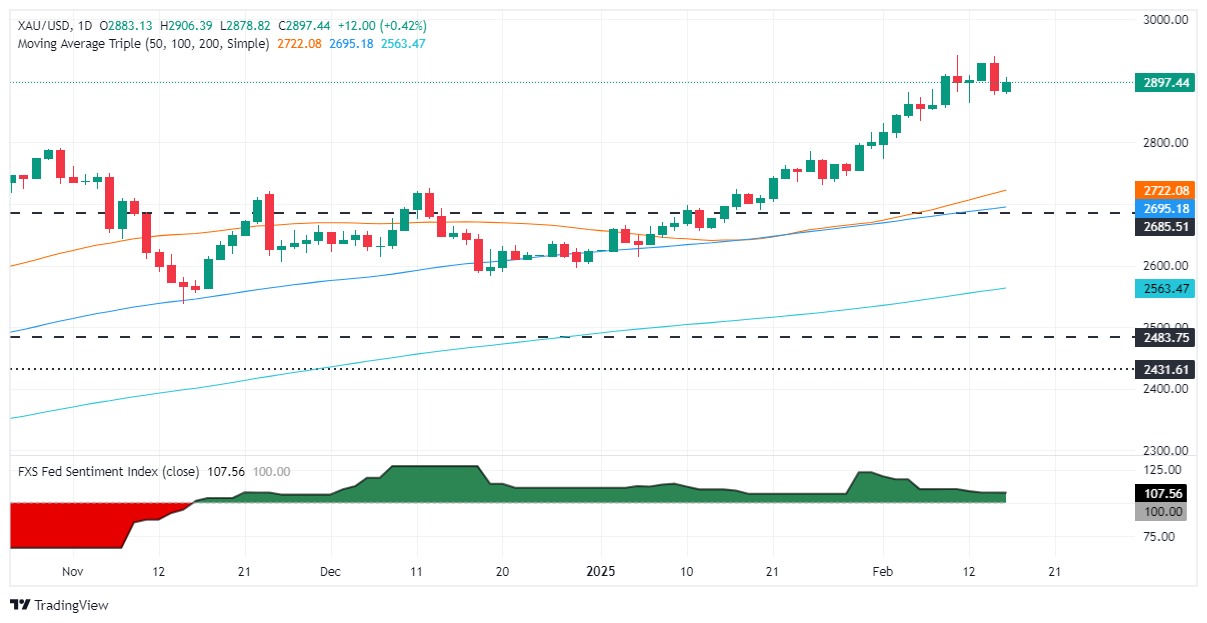
XAU/USD technical outlook: Gold price rises toward $2,900
The uptrend in Gold remains in play, though buyers must clear the $2,900 figure, to remain hopeful of testing the year-to-date (YTD) high of $2,942. If those two levels are cleared, the next ceiling level would be $2,950, followed by the $3,000 mark.
Conversely, XAU/USD daily close below $2,900 could pave the way for challenging the February 14 swing low of $2,877, followed by the February 12 low of $2,864. On further weakness, Gold could fall to test the October 31 swing high at $2,790.
Gold FAQs
Gold has played a key role in human’s history as it has been widely used as a store of value and medium of exchange. Currently, apart from its shine and usage for jewelry, the precious metal is widely seen as a safe-haven asset, meaning that it is considered a good investment during turbulent times. Gold is also widely seen as a hedge against inflation and against depreciating currencies as it doesn’t rely on any specific issuer or government.
Central banks are the biggest Gold holders. In their aim to support their currencies in turbulent times, central banks tend to diversify their reserves and buy Gold to improve the perceived strength of the economy and the currency. High Gold reserves can be a source of trust for a country’s solvency. Central banks added 1,136 tonnes of Gold worth around $70 billion to their reserves in 2022, according to data from the World Gold Council. This is the highest yearly purchase since records began. Central banks from emerging economies such as China, India and Turkey are quickly increasing their Gold reserves.
Gold has an inverse correlation with the US Dollar and US Treasuries, which are both major reserve and safe-haven assets. When the Dollar depreciates, Gold tends to rise, enabling investors and central banks to diversify their assets in turbulent times. Gold is also inversely correlated with risk assets. A rally in the stock market tends to weaken Gold price, while sell-offs in riskier markets tend to favor the precious metal.
The price can move due to a wide range of factors. Geopolitical instability or fears of a deep recession can quickly make Gold price escalate due to its safe-haven status. As a yield-less asset, Gold tends to rise with lower interest rates, while higher cost of money usually weighs down on the yellow metal. Still, most moves depend on how the US Dollar (USD) behaves as the asset is priced in dollars (XAU/USD). A strong Dollar tends to keep the price of Gold controlled, whereas a weaker Dollar is likely to push Gold prices up.
-
20:16
Forex Today: What if the RBA…?
The US Dollar alternated gains with losses in the area of two-month lows in a context of marginal trading conditions amid the inactivity in the US markets due to the Washington’s Day holiday.
Here is what you need to know on Tuesday, February 18:
The US Dollar Index (DXY) navigated a vacillating session in the sub-107.00 zone, or multi-week lows, following the absence of volatility in the broader FX galaxy. The NAHB Housing Market Index is due, along with the NY Empire State Manufacturing Index, TIC Flows, and speeches by Waller, Barr and Daly.
EUR/USD traded with marginal loses after returning to the region below the 1.0500 mark. The ZEW’s Economic Sentiment gauge in Germany and the euro bloc will precede the speech by the ECB’s Cipollone and the ECOFIN Meeting.
GBP/USD maintained its bullish bias in place above the key 1.2600 hurdle. The UK docket will feature the labour market report along with the speech by the BoE’s Bailey.
Further appreciation of the Japanese yen kept USD/JPY on the back foot in the area of multi-day lows around 151.30. The BoJ’s Takada will be the only release in the domestic calendar.
AUD/USD clinched new two-months tops around 0.6370, extending further its monthly recovery. The RBA will hold its monetary policy meeting, followed by Governor M. Bullock’s press conference.
Prices of WTI rebounded modestly amid the indecisive greenback, potential ceasefire talks in the Russia-Ukraine war and supply disruptions in the Caspian region.
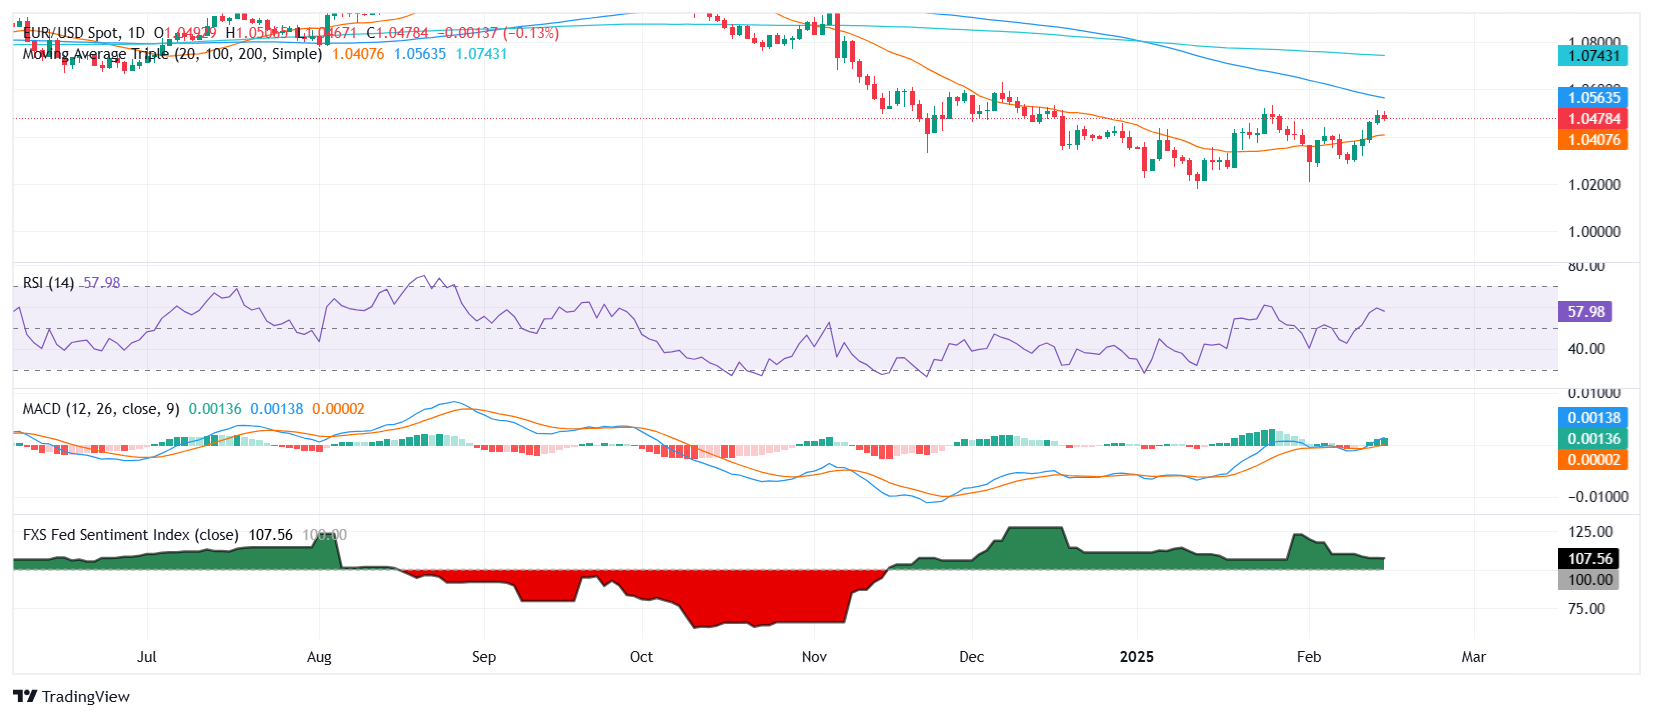
Prices of Gold partially faded Friday’s deep sell-off and flirted with the $2,900 region against the backdrop of the lack of direction in the dollar and steady concerns around US tariffs. Silver prices followed suit and advanced to the $32.50 zone per ounce.
-
19:40
US Dollar stalls as traders await key data and Fed speakers
- The DXY remains stuck around 106.00, looking for direction on Presidents’ Day.
- Fed funds futures price in 50 basis points of rate cuts for 2025 after weak Retail Sales data.
- Traders are eyeing global February PMI readings on Friday for potential divergence signals.
- US tariff concerns persist with auto levies expected to begin on April 2.
The US Dollar Index (DXY), which tracks the US Dollar's performance against six major currencies, trades flat on Monday as traders monitor new geopolitical developments. With ongoing talks in Riyadh regarding a Ukraine-Russia peace deal, markets are assessing potential outcomes and their impact on risk sentiment. At the time of writing, the DXY remains stuck above the 106.00 range with investors awaiting key economic data later this week.
Daily digest market movers: US Dollar remains range-bound as markets digest mixed signals
- The US Dollar hovers near last week’s low with no clear directional momentum.
- Fed funds futures now price in 50 basis points of rate cuts for 2025 following weak US January Retail Sales data.
- Despite the Retail Sales miss, consumer spending remains supported by real wage growth, a solid labor market, and strong household balance sheets.
- Traders may not see much USD relief until Friday when global February PMI data could highlight divergence among economies.
- Philadelphia Fed President Patrick Harker, Fed Governor Michelle Bowman, and Fed Governor Christopher Waller will speak on Monday.
- Last Friday, Fed President Lorie Logan cautioned that lower inflation does not automatically warrant further rate cuts.
- Markets continue to shrug off tariff concerns despite US President Donald Trump confirming auto levies will begin on April 2.
- Country-by-country reciprocal tariffs are also set to take effect around the same time, though implementation may be gradual.
DXY technical outlook: Key support in focus as bearish pressure builds
The US Dollar Index struggles to maintain momentum after losing the 20-day Simple Moving Average (SMA), reinforcing a bearish outlook. The Relative Strength Index (RSI) remains in negative territory, confirming weakening momentum, while the Moving Average Convergence Divergence (MACD) suggests a steady bearish trend.
Immediate support is seen at the 100-day SMA near 106.30 with a break below this level likely to confirm a negative short-term outlook. Resistance remains at 106.80, followed by the 20-day SMA at 107.20.
US Dollar FAQs
The US Dollar (USD) is the official currency of the United States of America, and the ‘de facto’ currency of a significant number of other countries where it is found in circulation alongside local notes. It is the most heavily traded currency in the world, accounting for over 88% of all global foreign exchange turnover, or an average of $6.6 trillion in transactions per day, according to data from 2022. Following the second world war, the USD took over from the British Pound as the world’s reserve currency. For most of its history, the US Dollar was backed by Gold, until the Bretton Woods Agreement in 1971 when the Gold Standard went away.
The most important single factor impacting on the value of the US Dollar is monetary policy, which is shaped by the Federal Reserve (Fed). The Fed has two mandates: to achieve price stability (control inflation) and foster full employment. Its primary tool to achieve these two goals is by adjusting interest rates. When prices are rising too quickly and inflation is above the Fed’s 2% target, the Fed will raise rates, which helps the USD value. When inflation falls below 2% or the Unemployment Rate is too high, the Fed may lower interest rates, which weighs on the Greenback.
In extreme situations, the Federal Reserve can also print more Dollars and enact quantitative easing (QE). QE is the process by which the Fed substantially increases the flow of credit in a stuck financial system. It is a non-standard policy measure used when credit has dried up because banks will not lend to each other (out of the fear of counterparty default). It is a last resort when simply lowering interest rates is unlikely to achieve the necessary result. It was the Fed’s weapon of choice to combat the credit crunch that occurred during the Great Financial Crisis in 2008. It involves the Fed printing more Dollars and using them to buy US government bonds predominantly from financial institutions. QE usually leads to a weaker US Dollar.
Quantitative tightening (QT) is the reverse process whereby the Federal Reserve stops buying bonds from financial institutions and does not reinvest the principal from the bonds it holds maturing in new purchases. It is usually positive for the US Dollar.
-
18:32
Mexican Peso extends gains as USD/MXN breaks key support
- USD/MXN dips below 50-day SMA at 20.42, trading at 20.27.
- Weak US Retail Sales and softer PPI sub-components fuel Fed easing expectations.
- Mexico’s Retail Sales, Banxico minutes, and Q4 GDP are in focus this week.
The Mexican Peso (MXN) extended its gains versus the US Dollar (USD), clearing key support at the 50-day Simple Moving Average (SMA) of 20.42 as the USD/MXN found acceptance at lower exchange rates. At the time of writing, the exotic pair trades at 20.27, down 0.09%.
Last week’s worse-than-expected United States (US) Retail Sales report drove the USD/MXN pair lower amid the uncertainty about economic growth in the US.
Although US consumer inflation data surged, some sub-components of the Producer Price Index (PPI) used to calculate the Federal Reserve’s (Fed) preferred inflation gauge, the Core Personal Consumption Expenditures (PCE) Price Index, suggests that prices could aim lower, increasing the chances for Fed’s easing.
After Friday’s data, figures from the Chicago Board of Trade (CBOT) suggest that investors had priced in 43 basis points (bps) of easing.
Despite this, the Philadelphia Fed President Patrick Harker stated that the current state of the economy justifies maintaining a steady rate policy, noting that monetary policy is well-positioned now. He acknowledged that inflation has remained elevated and persistent in recent months, emphasizing that the Fed's policy stance should continue to work towards lowering inflation.
Ahead of this week, Mexico’s economic docket will feature Retail Sales for December, the release of Banco de Mexico (Banxico) latest meeting minutes, and Gross Domestic Product (GDP) figures for Q4 2024.
Daily digest market movers: Mexican Peso climbs despite Banxico’s dovish stance
- Monetary policy divergence between Banxico and the Fed favors further USD/MXN upside, as the Fed would likely hold rates for a longer period, while Banxico is expected to cut rates again by 50 basis points in the next meeting.
- The US Dollar Index (DXY), which tracks the buck's performance against a basket of currencies, is virtually unchanged at 106.77, a headwind for USD/MXN.
- Trade disputes between the US and Mexico remain in the boiler room. Although the countries found common ground previously, USD/MXN traders should know that there is a 30-day pause and that tensions could arise toward the end of February.
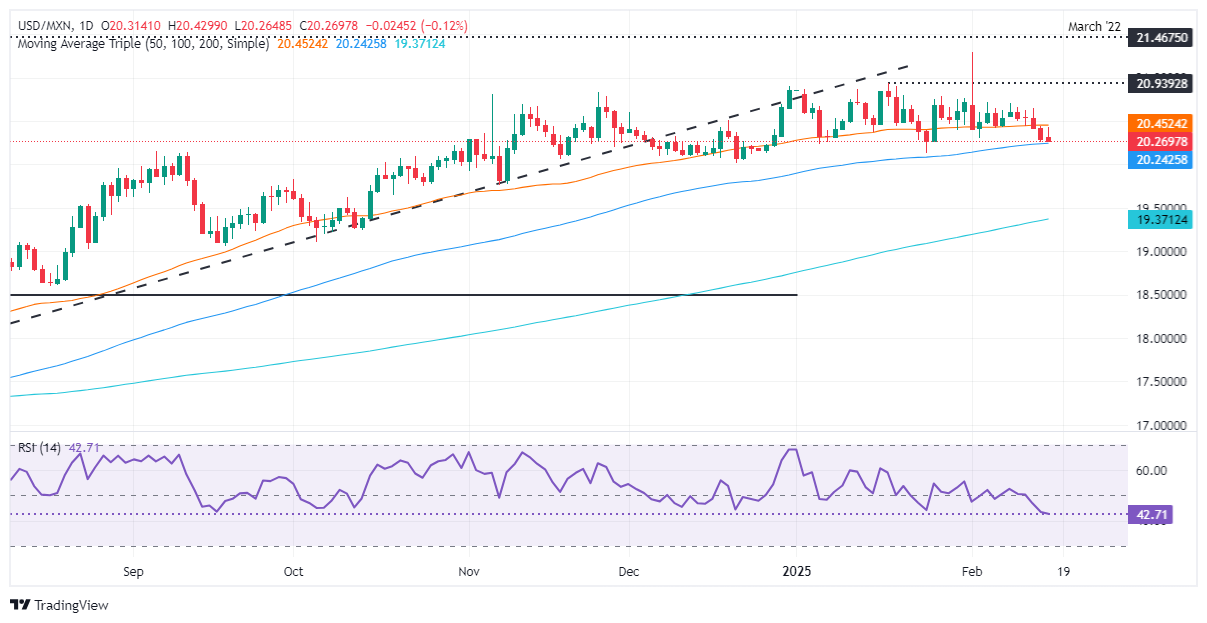
USD/MXN technical outlook: Mexican Peso surges as USD/MXN drops below 50-day SMA
USD/MXN trends lower on Monday and close into the 100-day SMA at 20.24, which, if cleared, could open the door for further downside. The Relative Strength Index (RSI) turned bearish, which indicated that the exotic pair could be headed to the 20.00 psychological figure.
In that outcome, if sellers push prices below 20.00, the next support would be the October 18 swing low at 19.64, followed by the 200-day SMA at 19.37.
Conversely, if USD/MXN rises back above the 50-day SMA, the next resistance would be 20.50, followed by the January 17 high of 20.90, the 21.00 figure, and the year-to-date (YTD) high of 21.29.
Mexican Peso FAQs
The Mexican Peso (MXN) is the most traded currency among its Latin American peers. Its value is broadly determined by the performance of the Mexican economy, the country’s central bank’s policy, the amount of foreign investment in the country and even the levels of remittances sent by Mexicans who live abroad, particularly in the United States. Geopolitical trends can also move MXN: for example, the process of nearshoring – or the decision by some firms to relocate manufacturing capacity and supply chains closer to their home countries – is also seen as a catalyst for the Mexican currency as the country is considered a key manufacturing hub in the American continent. Another catalyst for MXN is Oil prices as Mexico is a key exporter of the commodity.
The main objective of Mexico’s central bank, also known as Banxico, is to maintain inflation at low and stable levels (at or close to its target of 3%, the midpoint in a tolerance band of between 2% and 4%). To this end, the bank sets an appropriate level of interest rates. When inflation is too high, Banxico will attempt to tame it by raising interest rates, making it more expensive for households and businesses to borrow money, thus cooling demand and the overall economy. Higher interest rates are generally positive for the Mexican Peso (MXN) as they lead to higher yields, making the country a more attractive place for investors. On the contrary, lower interest rates tend to weaken MXN.
Macroeconomic data releases are key to assess the state of the economy and can have an impact on the Mexican Peso (MXN) valuation. A strong Mexican economy, based on high economic growth, low unemployment and high confidence is good for MXN. Not only does it attract more foreign investment but it may encourage the Bank of Mexico (Banxico) to increase interest rates, particularly if this strength comes together with elevated inflation. However, if economic data is weak, MXN is likely to depreciate.
As an emerging-market currency, the Mexican Peso (MXN) tends to strive during risk-on periods, or when investors perceive that broader market risks are low and thus are eager to engage with investments that carry a higher risk. Conversely, MXN tends to weaken at times of market turbulence or economic uncertainty as investors tend to sell higher-risk assets and flee to the more-stable safe havens.
-
18:08
Canadian Dollar flatlines on holiday Monday
- Canadian Dollar markets are shuttered for a federal holiday.
- US markets are also quiet, further crimping volume flow from the Greenback side.
- Canadian CPI inflation figures due this week, as well as FOMC Meeting Minutes.
The Canadian Dollar (CAD) was flat on Monday, driven into the middle by a complete lack of market volume. Canadian and US money markets are dark for matching federal holidays, and trading volumes have dried up at the start of the new trading week.
Canadian Consumer Price Index (CPI) inflation figures will be the key print for Loonie traders this week. The US Federal Reserve (Fed) Meeting Minutes from the Federal Open Market Committee’s (FOMC) latest rate call will also be dropping this week.
Daily digest market movers: Double-header market holidays dry out USD/CAD flows
- The Canadian Dollar remains overwhelmingly unchanged on Monday.
- Most of Canada’s money markets are dark for synchronized provincial holidays, and US markets are shuttered to celebrate President’s Day.
- Canadian CPI inflation is due on Tuesday. Canada’s annualized CPI print is expected to hold steady at 1.8% YoY, though a slight uptick in January’s MoM figure is expected.
- The Fed’s latest Meeting Minutes will be published on Wednesday.
- Key US Purchasing Managers Index (PMI) business activity survey results are due later this week.
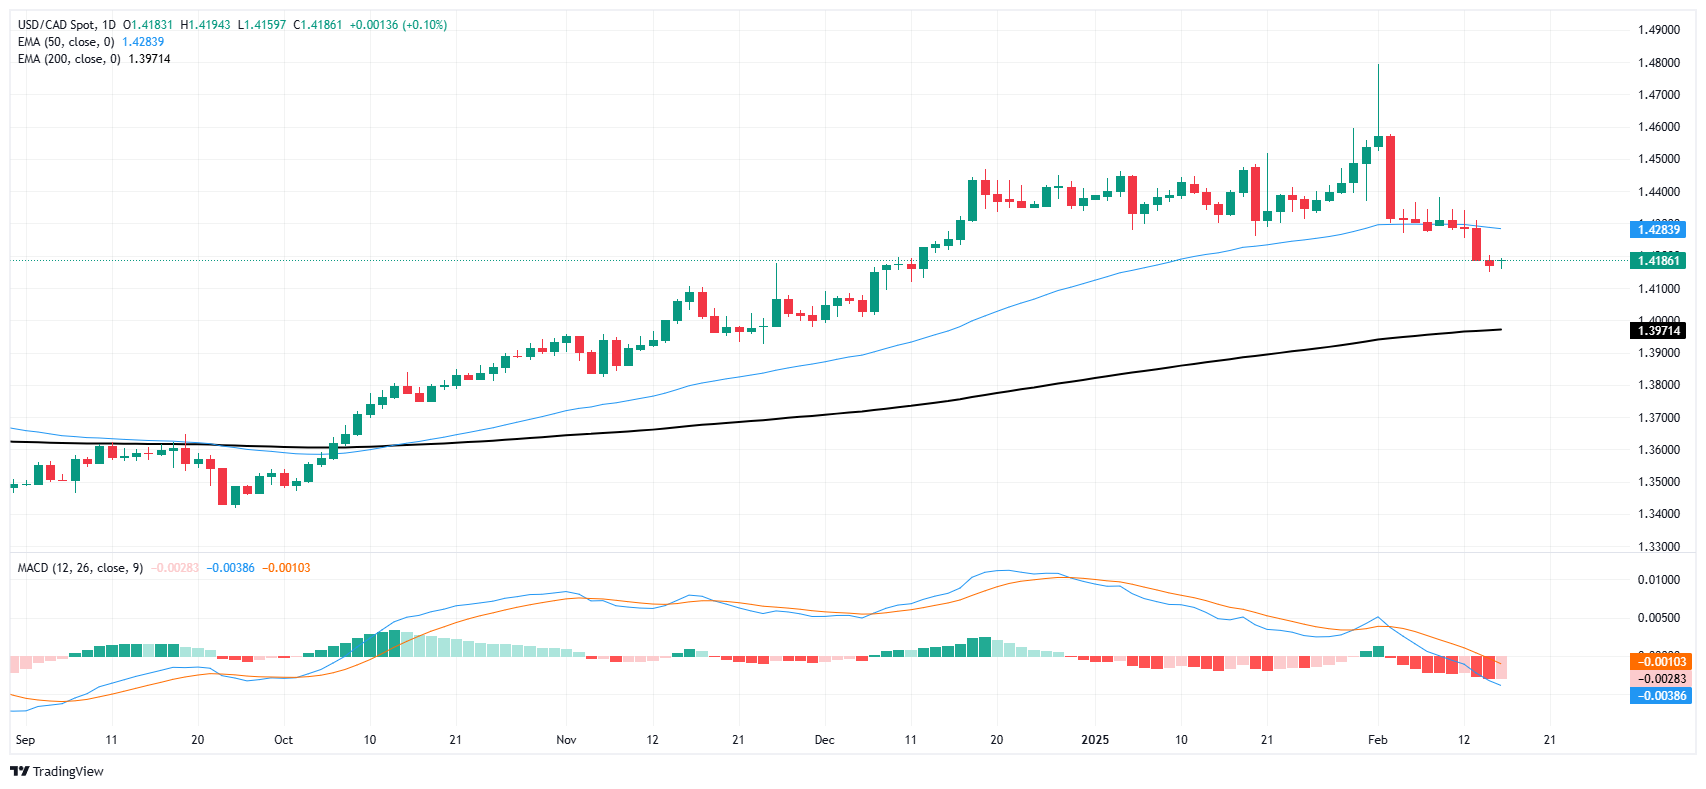
Canadian Dollar price forecast
After catching its fourth straight daily gain against the Greenback last week, the Canadian Dollar has lost all momentum on Monday. Overall bullish momentum remains limited, and USD/CAD has waffled further back below the 50-day Exponential Moving Average (EMA) near 1.4280. A firm technical floor is still priced in at the 200-day EMA just south of 1.4000.
USD/CAD daily chart
Canadian Dollar FAQs
The key factors driving the Canadian Dollar (CAD) are the level of interest rates set by the Bank of Canada (BoC), the price of Oil, Canada’s largest export, the health of its economy, inflation and the Trade Balance, which is the difference between the value of Canada’s exports versus its imports. Other factors include market sentiment – whether investors are taking on more risky assets (risk-on) or seeking safe-havens (risk-off) – with risk-on being CAD-positive. As its largest trading partner, the health of the US economy is also a key factor influencing the Canadian Dollar.
The Bank of Canada (BoC) has a significant influence on the Canadian Dollar by setting the level of interest rates that banks can lend to one another. This influences the level of interest rates for everyone. The main goal of the BoC is to maintain inflation at 1-3% by adjusting interest rates up or down. Relatively higher interest rates tend to be positive for the CAD. The Bank of Canada can also use quantitative easing and tightening to influence credit conditions, with the former CAD-negative and the latter CAD-positive.
The price of Oil is a key factor impacting the value of the Canadian Dollar. Petroleum is Canada’s biggest export, so Oil price tends to have an immediate impact on the CAD value. Generally, if Oil price rises CAD also goes up, as aggregate demand for the currency increases. The opposite is the case if the price of Oil falls. Higher Oil prices also tend to result in a greater likelihood of a positive Trade Balance, which is also supportive of the CAD.
While inflation had always traditionally been thought of as a negative factor for a currency since it lowers the value of money, the opposite has actually been the case in modern times with the relaxation of cross-border capital controls. Higher inflation tends to lead central banks to put up interest rates which attracts more capital inflows from global investors seeking a lucrative place to keep their money. This increases demand for the local currency, which in Canada’s case is the Canadian Dollar.
Macroeconomic data releases gauge the health of the economy and can have an impact on the Canadian Dollar. Indicators such as GDP, Manufacturing and Services PMIs, employment, and consumer sentiment surveys can all influence the direction of the CAD. A strong economy is good for the Canadian Dollar. Not only does it attract more foreign investment but it may encourage the Bank of Canada to put up interest rates, leading to a stronger currency. If economic data is weak, however, the CAD is likely to fall.
-
17:55
ECB's Holzmann: The case for another rate cut is getting harder to make
European Central Bank (ECB) Governing Council member and head of the Austrian central bank, Oesterreichische Nationalbank (OeNB) noted on Monday that warning signs that the ECB may undershoot inflation targets are growing, but overall inflation figures are still lopsided and make policy moves difficult.
Key highlights
Danger of undershooting 2% is not a reason to cut.
With core at 2.7%, ECB is already moving into neutral or slightly expansionary territory.
Below 2.5% there would be even fewer questions that we are no longer restrictive.
There is some possibility that we'll cut, and there is some possibility that we won't.
A decision in favour of another cut gets harder and harder, both now and beyond March.
I can't count too much on services inflation coming down.
-
17:18
EUR/USD Price Analysis: Pair pulls back after strong rally, signaling a technical correction
- EUR/USD slips to 1.0475 on Monday, pausing after last week's sharp rally.
- The pullback appears to be a technical correction, with key support levels in focus.
EUR/USD took a step back on Monday, edging down 0.15% to 1.0475 after last week's impressive rally of over 1.50% which marked four-day winning streak. The decline appears to be a natural breather rather than a structural shift, as technical indicators still favor the bullish trend. The pair remains comfortably above the 20-day Simple Moving Average (SMA), suggesting that dips might attract renewed buying interest.
Momentum indicators reflect a slight slowdown but do not signal an imminent reversal. The Relative Strength Index (RSI) has eased to 59 but stays in positive territory, indicating that the rally may not be over yet. Meanwhile, the Moving Average Convergence Divergence (MACD) histogram remains flat with green bars, suggesting consolidation rather than a strong bearish move.
For bulls to regain full control, EUR/USD needs to reclaim 1.0500 and establish itself above this psychological level. On the downside, immediate support lies at 1.0450, followed by 1.0420. A deeper correction could see the pair retesting the 20-day SMA near 1.0400, where buyers are likely to step in.
EUR/USD daily chart
-
16:59
Fed's Bowman: High asset prices may have impeded inflation progress
Federal Reserve (Fed) Board of Governors member Michelle Bowman noted on Monday that the Fed's recent progress on inflation may have been hampered by rising asset prices.
Key highlights
High asset prices may have impeded progress on inflation.
I expect inflation to decline but upside risks remain.
More certainty needed on declining inflation before reducing rates.
Patience on rate cuts will allow more clarity on impact of administration policies.
Labor market not tight due to slowed hiring, but unemployment remains below full employment estimates.
Wage growth above level consistent with Fed inflation target.
I'm also monitoring supply chains, signs of pent-up demand for inflation risk.
Fed regulations focusing on fundamental banking problems ready for reassessment.
-
16:59
Colombia Gross Domestic Product (YoY) in line with forecasts (2.3%) in 4Q
-
16:25
GBP/USD holds gains near 1.2600 in quiet US holiday trade
- GBP/USD maintains last week’s gains after upbeat UK GDP data.
- BoE’s Catherine Mann signals dovish shift, weighing on sentiment.
- Traders eye UK jobs, inflation data; Fed speakers and FOMC minutes ahead.
The Pound Sterling registered modest gains versus the US Dollar on Monday in thin liquidity trade due to the observance of US President's Day. At the time of writing, the GBP/USD exchanged hands shy of 1.2600, up 0.05%.
Sterling steadies, but dovish BoE tilt may cap upside
Cable maintained its profits from last week, following better-than-expected Gross Domestic Product (GDP) figures for the last quarter of 2024. However, a dovish tilt by Bank of England (BoE) member Catherine Mann could weigh on the GBP/USD pair and push it lower.
Recently, BoE Governor Andrew Bailey reiterated that inflation is slowing and added that an expected increase in prices would be short-lived. Traders are eyeing the release of UK labor market data on February 18, followed by inflation figures, with the Consumer Price Index (CPI) expected to rise from 2.5% to 2.8%.
Aside from this, Philadelphia Fed Patrick Harker said the status of the economy warrants a steady rate policy for now, with monetary policy in a good place right now. He added that inflation is elevated and has been sticky for recent months and that the Fed policy stance should continue to lower inflation.
The US economic docket will feature further Fed speakers, housing data, the latest FOMC meeting minutes, Initial Jobless Claims, and S&P Global Flash PMIs.
GBP/USD Price Forecast: Technical outlook
Given the fundamental backdrop, the GBP/USD surges, as momentum favors further upside as the Relative Strength Index (RSI) remains bullish. Nevertheless, the pair remains below last Friday’s peak of 1.2629, with buyers unable to crack the latter and if sellers drive the exchange rate below 1.2600, further downside lies ahead.
Key support levels would be the February 5 high turned support at 1.2549, followed by the 50-day Simple Moving Average (SMA) at 1.2468. Conversely, if GBP/USD clears the February 14 high of 1.2629, the pair could aim to the 100-day SMA at 1.2686, ahead of the 200-day SMA at 1.2786.
British Pound PRICE Today
The table below shows the percentage change of British Pound (GBP) against listed major currencies today. British Pound was the strongest against the Swiss Franc.
USD EUR GBP JPY CAD AUD NZD CHF USD 0.13% -0.05% -0.53% 0.06% -0.24% -0.28% 0.13% EUR -0.13% -0.02% -0.71% 0.04% -0.28% -0.31% 0.10% GBP 0.05% 0.02% -0.57% 0.06% -0.20% -0.29% 0.13% JPY 0.53% 0.71% 0.57% 0.59% 0.32% 0.46% 0.64% CAD -0.06% -0.04% -0.06% -0.59% -0.28% -0.34% 0.07% AUD 0.24% 0.28% 0.20% -0.32% 0.28% -0.03% 0.39% NZD 0.28% 0.31% 0.29% -0.46% 0.34% 0.03% 0.42% CHF -0.13% -0.10% -0.13% -0.64% -0.07% -0.39% -0.42% The heat map shows percentage changes of major currencies against each other. The base currency is picked from the left column, while the quote currency is picked from the top row. For example, if you pick the British Pound from the left column and move along the horizontal line to the US Dollar, the percentage change displayed in the box will represent GBP (base)/USD (quote).
-
15:36
USD/JPY slides to near 151.50 as Japanese Yen strengthens on robust GDP growth
- USD/JPY falls sharply to near 151.40 as Yen performs strongly across the board on upbeat Q4 Japan GDP data.
- Flash Q4 Japan’s GDP data showed that the economy expanded by 0.7%.
- A delay in Trump’s reciprocal tariff plan and poor Retail Sales data would keep the US Dollar on the backfoot.
The USD/JPY pair slumps to near 151.40 in Monday’s North American session. The asset tumbles as the Japanese Yen (JPY) strengthens across the board after the release of the flash Q4 Gross Domestic Product (GDP) data, which showed that the economy surprisingly expanded at a robust pace.
Japanese Yen PRICE Today
The table below shows the percentage change of Japanese Yen (JPY) against listed major currencies today. Japanese Yen was the strongest against the Euro.
USD EUR GBP JPY CAD AUD NZD CHF USD 0.20% -0.03% -0.53% 0.07% -0.23% -0.27% 0.18% EUR -0.20% -0.08% -0.76% -0.03% -0.34% -0.36% 0.08% GBP 0.03% 0.08% -0.57% 0.05% -0.21% -0.28% 0.16% JPY 0.53% 0.76% 0.57% 0.59% 0.33% 0.47% 0.68% CAD -0.07% 0.03% -0.05% -0.59% -0.28% -0.33% 0.11% AUD 0.23% 0.34% 0.21% -0.33% 0.28% -0.02% 0.43% NZD 0.27% 0.36% 0.28% -0.47% 0.33% 0.02% 0.44% CHF -0.18% -0.08% -0.16% -0.68% -0.11% -0.43% -0.44% The heat map shows percentage changes of major currencies against each other. The base currency is picked from the left column, while the quote currency is picked from the top row. For example, if you pick the Japanese Yen from the left column and move along the horizontal line to the US Dollar, the percentage change displayed in the box will represent JPY (base)/USD (quote).
Japanese Cabinet Office reported that the economy expanded at a robust pace of 0.7%, against 0.4% growth seen in the third quarter of 2024. Economists expected the GDP data to have grown by 0.3%.
On an annualized basis, the economy rose strongly by 2.8% compared to the same quarter of the previous year and faster than the 1.7% growth seen in the July-September period. Upbeat GDP data is expected to boost the Bank of Japan's (BoJ) hawkish bets.
Meanwhile, the US Dollar (USD) finds ground temporarily after facing a sharp sell-off last week. The US Dollar Index (DXY), which tracks the Greenback’s value against six major currencies, gauges cushion near 106.60 after posting a fresh two-month low.
However, investors are cautious over the USD’s outlook as United States (US) President Donald Trump has not unveiled a detailed reciprocal tariff plan, while he was expected to do so on Thursday.
Above that, poor Retail Sales data for January has also weighed on the US Dollar. The Retail Sales data, a key measure of consumer spending, declined at a robust pace of 0.9%.
Japanese Yen FAQs
The Japanese Yen (JPY) is one of the world’s most traded currencies. Its value is broadly determined by the performance of the Japanese economy, but more specifically by the Bank of Japan’s policy, the differential between Japanese and US bond yields, or risk sentiment among traders, among other factors.
One of the Bank of Japan’s mandates is currency control, so its moves are key for the Yen. The BoJ has directly intervened in currency markets sometimes, generally to lower the value of the Yen, although it refrains from doing it often due to political concerns of its main trading partners. The BoJ ultra-loose monetary policy between 2013 and 2024 caused the Yen to depreciate against its main currency peers due to an increasing policy divergence between the Bank of Japan and other main central banks. More recently, the gradually unwinding of this ultra-loose policy has given some support to the Yen.
Over the last decade, the BoJ’s stance of sticking to ultra-loose monetary policy has led to a widening policy divergence with other central banks, particularly with the US Federal Reserve. This supported a widening of the differential between the 10-year US and Japanese bonds, which favored the US Dollar against the Japanese Yen. The BoJ decision in 2024 to gradually abandon the ultra-loose policy, coupled with interest-rate cuts in other major central banks, is narrowing this differential.
The Japanese Yen is often seen as a safe-haven investment. This means that in times of market stress, investors are more likely to put their money in the Japanese currency due to its supposed reliability and stability. Turbulent times are likely to strengthen the Yen’s value against other currencies seen as more risky to invest in.
-
15:34
Fed's Harker: Current economy argues for steady rate policy for now
Federal Reserve Bank of Philadelphia President Patrick Harker said on Monday that the current economy argues for a steady policy for now, as reported by Reuters.
Key takeaways
"Monetary policy is in good place right now."
"Future Fed rate policy choices will be data driven."
"Fed policy stance should continue to lower inflation."
"Inflation elevated and has been sticky over recent months."
"Inflation seen back to 2% target over next two years."
"Labor market is largely in balance."
"The economy is functioning from a position of strength."
"Unsure what impact new government policies will have on the economy."
Fed FAQs
Monetary policy in the US is shaped by the Federal Reserve (Fed). The Fed has two mandates: to achieve price stability and foster full employment. Its primary tool to achieve these goals is by adjusting interest rates. When prices are rising too quickly and inflation is above the Fed’s 2% target, it raises interest rates, increasing borrowing costs throughout the economy. This results in a stronger US Dollar (USD) as it makes the US a more attractive place for international investors to park their money. When inflation falls below 2% or the Unemployment Rate is too high, the Fed may lower interest rates to encourage borrowing, which weighs on the Greenback.
The Federal Reserve (Fed) holds eight policy meetings a year, where the Federal Open Market Committee (FOMC) assesses economic conditions and makes monetary policy decisions. The FOMC is attended by twelve Fed officials – the seven members of the Board of Governors, the president of the Federal Reserve Bank of New York, and four of the remaining eleven regional Reserve Bank presidents, who serve one-year terms on a rotating basis.
In extreme situations, the Federal Reserve may resort to a policy named Quantitative Easing (QE). QE is the process by which the Fed substantially increases the flow of credit in a stuck financial system. It is a non-standard policy measure used during crises or when inflation is extremely low. It was the Fed’s weapon of choice during the Great Financial Crisis in 2008. It involves the Fed printing more Dollars and using them to buy high grade bonds from financial institutions. QE usually weakens the US Dollar.
Quantitative tightening (QT) is the reverse process of QE, whereby the Federal Reserve stops buying bonds from financial institutions and does not reinvest the principal from the bonds it holds maturing, to purchase new bonds. It is usually positive for the value of the US Dollar.
-
15:30
Risks around the RBA and RBNZ meetings – Standard Chartered
We and the market expect RBA to cut the cash rate by 25bps at the 18 February meeting. However, there is a risk that RBA delivers a hawkish surprise amid a tight labour market and elevated CPI. RBNZ is likely to cut rates by 50bps at the 19 February meeting, with surprises unlikely. We see upside risks to AUD/NZD and AUD/USD, especially if the RBA surprises with a hawkish hold, Standard Chartered's economists report.
Positioning for fat tails
"We and the market expect the Reserve Bank of Australia (RBA) to cut the cash rate by 25bps to 4.10% at the 18 February meeting. However, we acknowledge the risk of a hawkish surprise by the RBA, either by keeping the cash rate unchanged at 4.35% or via cautious guidance from Governor Bullock at the press conference. Despite weak private-sector job creation, the RBA may cite a still-tight labour market and elevated underlying price pressures to signal a shallower rate-cutting cycle in 2025."
"On the Reserve Bank of New Zealand (RBNZ), our baseline is for the central bank to reduce its cash rate by 50bps at the 19 February meeting. The move has been well-communicated by the central bank previously, and we see a low probability of a surprise in either direction. Where risks are concerned, we think the RBNZ may ease more aggressively in Q2 (relative to our baseline of a single 25bps cut) if economic data remains lacklustre, to get rates back to neutral (2.5-3.5%) more quickly."
"On FX implications, we see upside risk to AUD/NZD at current levels, particularly if the RBA surprises the market with a hawkish hold at the February meeting. Put differently, we see scope for end-2025 RBA-RBNZ rate differentials to widen beyond 50bps at present, which should keep AUD/NZD well-supported above the 1.11-level. On AUD/USD, a hawkish cut by the RBA may nudge the pair above the 0.64 level, especially if cuts in Q2 or beyond get priced out."
-
14:41
USD/CAD steadies below 1.4200 as USD finds support near two-month low
- USD/CAD holds below 1.4200 as the US Dollar gains ground temporarily.
- The outlook of the US Dollar is uncertain due to multiple headwinds.
- Investors await the Canadian CPI data, which will influence the BoC's monetary policy outlook.
The USD/CAD pair ticks higher to near 1.4190 in Monday’s North American session after rebounding from a two-month low of 1.4150, which it posted on Friday. The Loonie pair edges higher as the US Dollar (USD) gains ground, with the US Dollar Index (DXY) holding the two-month low of 106.60. Investors should brace for thin trading volume as the United States (US) and Canada equity markets are closed on account of Family Day and President's Day, respectively.
However, the outlook of the US Dollar is still uncertain as its safe-haven appeal has diminished, with investors seeing US President Donald Trump’s tariff agenda as less fearful than thought.
On Thursday, Donald Trump didn’t reveal a detailed reciprocal tariff plan and asked his teams to work on them. However, the hype from his tweet at Truth Social indicated that he is ready with the plan and will impose it as early as possible.
“Three great weeks, perhaps the best ever, but today is the big one: reciprocal tariffs!!! Make America great again!!!", Trump said in the early North American trading hours on Thursday.
On the economic data front, poor US Retail Sales data has also weighed on the US Dollar. The Retail Sales data, a key measure of consumer spending, declined at a faster-than-expected pace of 0.9% in January.
Meanwhile, the Canadian Dollar (CAD) is expected to perform sideways as investors await the Canadian Consumer Price Index (CPI) data for January, which will be released on Tuesday. Month-on-month headline CPI is estimated to have grown by 0.1% after deflating 0.4% in December. The inflation data will influence market speculation about whether the Bank of Canada (BoC) will cut interest rates again in the March policy meeting.
US Dollar FAQs
The US Dollar (USD) is the official currency of the United States of America, and the ‘de facto’ currency of a significant number of other countries where it is found in circulation alongside local notes. It is the most heavily traded currency in the world, accounting for over 88% of all global foreign exchange turnover, or an average of $6.6 trillion in transactions per day, according to data from 2022. Following the second world war, the USD took over from the British Pound as the world’s reserve currency. For most of its history, the US Dollar was backed by Gold, until the Bretton Woods Agreement in 1971 when the Gold Standard went away.
The most important single factor impacting on the value of the US Dollar is monetary policy, which is shaped by the Federal Reserve (Fed). The Fed has two mandates: to achieve price stability (control inflation) and foster full employment. Its primary tool to achieve these two goals is by adjusting interest rates. When prices are rising too quickly and inflation is above the Fed’s 2% target, the Fed will raise rates, which helps the USD value. When inflation falls below 2% or the Unemployment Rate is too high, the Fed may lower interest rates, which weighs on the Greenback.
In extreme situations, the Federal Reserve can also print more Dollars and enact quantitative easing (QE). QE is the process by which the Fed substantially increases the flow of credit in a stuck financial system. It is a non-standard policy measure used when credit has dried up because banks will not lend to each other (out of the fear of counterparty default). It is a last resort when simply lowering interest rates is unlikely to achieve the necessary result. It was the Fed’s weapon of choice to combat the credit crunch that occurred during the Great Financial Crisis in 2008. It involves the Fed printing more Dollars and using them to buy US government bonds predominantly from financial institutions. QE usually leads to a weaker US Dollar.
Quantitative tightening (QT) is the reverse process whereby the Federal Reserve stops buying bonds from financial institutions and does not reinvest the principal from the bonds it holds maturing in new purchases. It is usually positive for the US Dollar.
-
14:30
Canada Canadian Portfolio Investment in Foreign Securities fell from previous $17.85B to $3.77B in December
-
14:30
Canada Foreign Portfolio Investment in Canadian Securities above forecasts ($14.23B) in December: Actual ($14.37B)
-
14:15
Canada Housing Starts s.a (YoY) below forecasts (250K) in January: Actual (239.7K)
-
13:25
US Dollar consolidates with US markets closed for President’s Day
- The US Dollar consolidates ahead of a very important week in geopolitics.
- Traders brace for headlines that could emerge from Riyadh on a possible breakthrough.
- The US Dollar Index (DXY) resides and looks for a direction in the mid-106 region.
The US Dollar Index (DXY), which tracks the performance of the US Dollar (USD) against six major currencies, consolidates last week’s losses and trades flat at around 106.80 at the time of writing on Monday. The United States (US) economy is no longer an outlier, with several data points and the blood-red January Retail Sales data released last week pointing to slower economic growth. All eyes this week will be on Riyadh, in Saudi Arabia, where US and Russian officials are set to meet ahead of a meeting between US President Donald Trump and Russian President Vladimir Putin.
The economic calendar is very calm this week in the run-up to the S&P Purchasing Managers Index (PMI) data on Friday. Although the US bond market is closed due to the President’s Day bank holiday, the Federal Reserve (Fed) has three policymakers lined up to speak on Monday.
Daily digest market movers: All eyes on Riyadh
- US bond markets are closed on Monday due to the President’s Day bank holidays.
- Traders will need to be vigilant for any headlines coming out of Riyadh, where US and Russian officials are meeting in the runup to the meeting between US President Donald Trump and Russian President Vladimir Putin to agree on a deal for Ukraine.
- At 14:30 GMT, Federal Reserve Bank of Philadelphia Patrick Harker delivers a speech on the economic outlook at the Central Banking Series Conference at the University of the Bahamas in Nassau.
- At 15:20 GMT, Fed Governor Michelle W. Bowman delivers brief remarks on the economy and bank regulation at the American Bankers Association (ABA) Conference for Community Bankers in Phoenix, Arizona.
- Closing off this Monday, at 23:00 GMT, Fed Governor Christopher J. Waller speaks on the economic outlook at the UNSW Macroeconomic Workshop in Sydney, Australia.
- Equities start off this week with some small and cautious gains.
- The CME FedWatch tool shows a 46.7% chance that interest rates will remain unchanged at current levels in June.
- The US 10-year yield is trading around 4.48%, and will remain closed for trading this Monday
US Dollar Index Technical Analysis: There it goes
The US Dollar Index (DXY) is not expected to go anywhere this Monday with most US markets closed due to President’s Day. The main focus will be on headlines around Ukraine, where the question will be what kind of deal will be put on the table. Be on the lookout thus for false breaks on a peace deal being reached, with the aftermath resulting in a knee jerk reaction and seeing the DXY possibly rally from there on out.
On the upside, the previous support at 107.35 has now turned into a firm resistance. Further up, the 55-day SMA at 107.91 must be regained before reclaiming 108.00.
On the downside, look for 106.52 (April 16, 2024, high), 106.40 (100-day SMA), or even 105.89 (resistance in June 2024) as support levels. As the Relative Strength Index (RSI) momentum indicator in the daily chart shows room for more downside, the 200-day SMA at 104.93 could be a possible outcome.
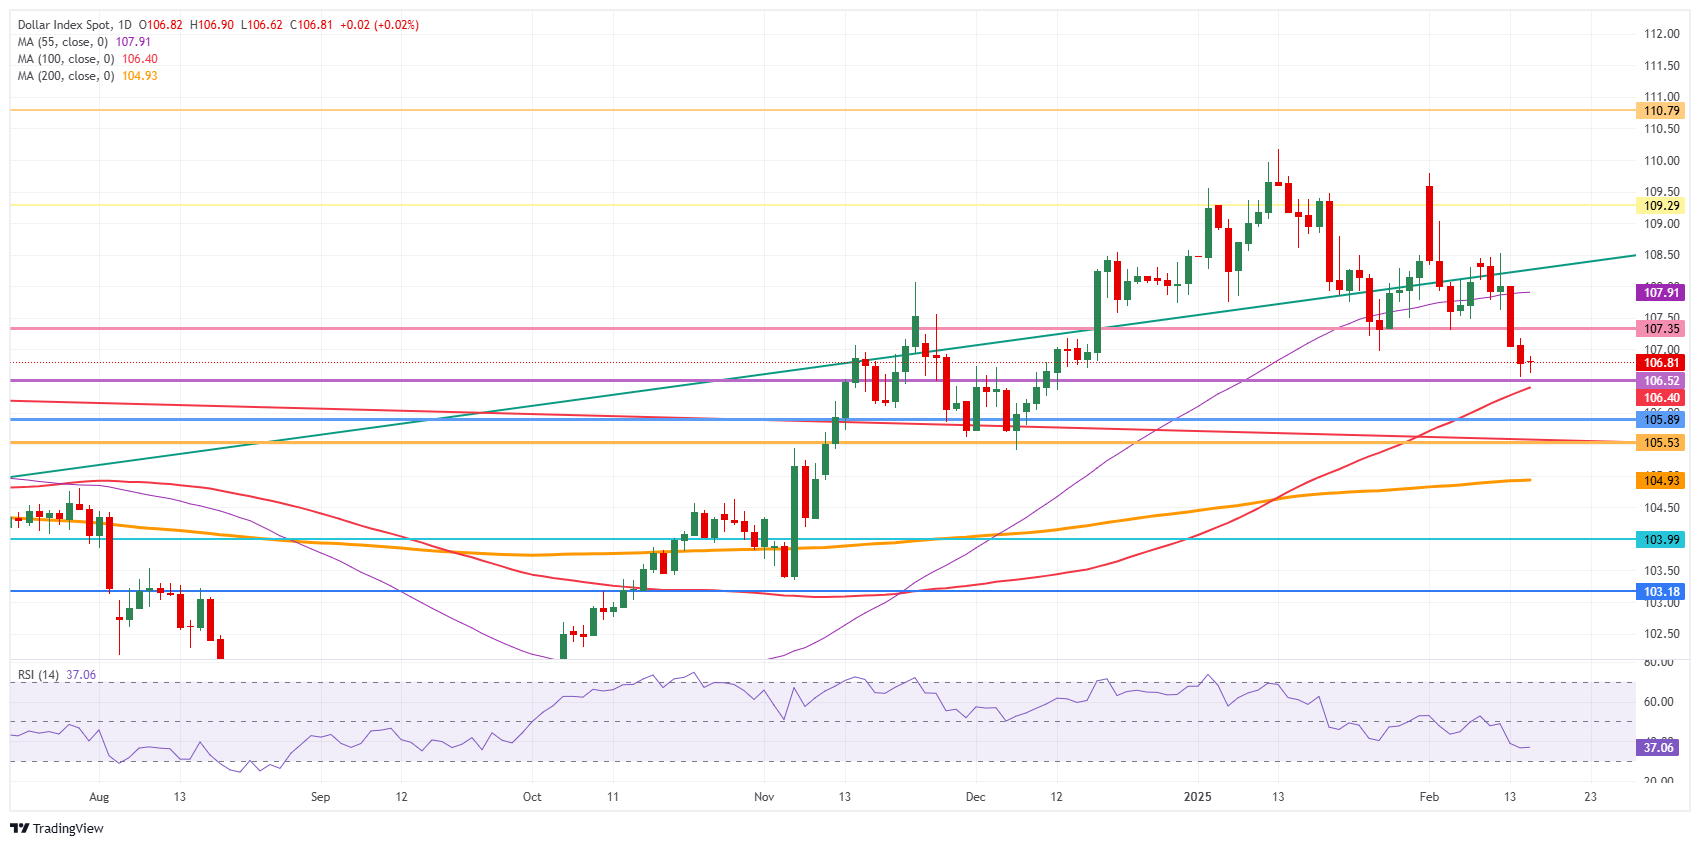
US Dollar Index: Daily Chart
US Dollar FAQs
The US Dollar (USD) is the official currency of the United States of America, and the ‘de facto’ currency of a significant number of other countries where it is found in circulation alongside local notes. It is the most heavily traded currency in the world, accounting for over 88% of all global foreign exchange turnover, or an average of $6.6 trillion in transactions per day, according to data from 2022. Following the second world war, the USD took over from the British Pound as the world’s reserve currency. For most of its history, the US Dollar was backed by Gold, until the Bretton Woods Agreement in 1971 when the Gold Standard went away.
The most important single factor impacting on the value of the US Dollar is monetary policy, which is shaped by the Federal Reserve (Fed). The Fed has two mandates: to achieve price stability (control inflation) and foster full employment. Its primary tool to achieve these two goals is by adjusting interest rates. When prices are rising too quickly and inflation is above the Fed’s 2% target, the Fed will raise rates, which helps the USD value. When inflation falls below 2% or the Unemployment Rate is too high, the Fed may lower interest rates, which weighs on the Greenback.
In extreme situations, the Federal Reserve can also print more Dollars and enact quantitative easing (QE). QE is the process by which the Fed substantially increases the flow of credit in a stuck financial system. It is a non-standard policy measure used when credit has dried up because banks will not lend to each other (out of the fear of counterparty default). It is a last resort when simply lowering interest rates is unlikely to achieve the necessary result. It was the Fed’s weapon of choice to combat the credit crunch that occurred during the Great Financial Crisis in 2008. It involves the Fed printing more Dollars and using them to buy US government bonds predominantly from financial institutions. QE usually leads to a weaker US Dollar.
Quantitative tightening (QT) is the reverse process whereby the Federal Reserve stops buying bonds from financial institutions and does not reinvest the principal from the bonds it holds maturing in new purchases. It is usually positive for the US Dollar.
-
12:52
WTI trades cautiously above $70 as investors await Russia-Ukraine peace talks
- WTI is cautiously steady above $70.00 as investors stare at the Trump-Putin meeting.
- The impact of the Russia-Ukraine truce would be negative for the Oil price.
- OPEC will likely delay its planned monthly supply increase.
West Texas Intermediate (WTI), futures on NYMEX, trades with caution above the seven-week low of $70.15 in Monday’s European session. The Oil price trades cautiously as investors seek more development in the Russia-Ukraine peace talks.
Last week, United States (US) President Donald Trump confirmed that both leaders of Russia and Ukraine have agreed to peace negotiations.
Donald Trump said that he had a “lengthy and highly productive” conversation with Russian leader Vladimir Putin, and he agreed to start peace negotiations with Ukraine. Also, he ordered his team to begin peace talks.
Over the weekend, Trump also said that he is expected to discuss ending the three-year-long war in Ukraine in the coming days.
Analysts at Philip Nova expect, "If negotiations lead to a resolution, more Russian barrels would enter global supplies, which could significantly impact oil prices negatively."
Meanwhile, reports that OPEC is planning to delay its planned monthly supply increases, which were expected to begin in April, have offered a temporary relief to the Oil price, Bloomberg reported.
The decision is contrary to President Donald Trump’s urge to Saudi Arabia to increase Oil output by two million barrels last month.
Brent Crude Oil FAQs
Brent Crude Oil is a type of Crude Oil found in the North Sea that is used as a benchmark for international Oil prices. It is considered ‘light’ and ‘sweet’ because of its high gravity and low sulfur content, making it easier to refine into gasoline and other high-value products. Brent Crude Oil serves as a reference price for approximately two-thirds of the world's internationally traded Oil supplies. Its popularity rests on its availability and stability: the North Sea region has well-established infrastructure for Oil production and transportation, ensuring a reliable and consistent supply.
Like all assets supply and demand are the key drivers of Brent Crude Oil price. As such, global growth can be a driver of increased demand and vice versa for weak global growth. Political instability, wars, and sanctions can disrupt supply and impact prices. The decisions of OPEC, a group of major Oil-producing countries, is another key driver of price. The value of the US Dollar influences the price of Brent Crude Oil, since Oil is predominantly traded in US Dollars, thus a weaker US Dollar can make Oil more affordable and vice versa.
The weekly Oil inventory reports published by the American Petroleum Institute (API) and the Energy Information Agency (EIA) impact the price of Brent Crude Oil. Changes in inventories reflect fluctuating supply and demand. If the data shows a drop in inventories it can indicate increased demand, pushing up Oil price. Higher inventories can reflect increased supply, pushing down prices. API’s report is published every Tuesday and EIA’s the day after. Their results are usually similar, falling within 1% of each other 75% of the time. The EIA data is considered more reliable, since it is a government agency.
OPEC (Organization of the Petroleum Exporting Countries) is a group of 12 Oil producing nations who collectively decide production quotas for member countries at twice-yearly meetings. Their decisions often impact Brent Crude Oil prices. When OPEC decides to lower quotas, it can tighten supply, pushing up Oil prices. When OPEC increases production, it has the opposite effect. OPEC+ refers to an expanded group that includes ten extra non-OPEC members, the most notable of which is Russia.
-
12:29
USD/CNH can dip below 7.2500 before stabilisation is likely – UOB Group
As long as US Dollar (USD) remains below 7.2800 vs Chinese Yuan (CNH), it could dip below 7.2500 before stabilisation is likely. In the longer run, increase in momentum suggests USD could decline to the major support at 7.2300, UOB Group’s FX analysts Quek Ser Leang and Peter Chia note.
USD has a chance to decline to the major support at 7.2300
24-HOUR VIEW: "USD plummeted to a low of 7.2685 last Thursday. On Friday, when USD was at 7.2785, we pointed out, 'provided that 7.2950 is not breached, there is a chance for USD to dip below the 7.2685 low before stabilisation is likely.' We added, 'the next support at 7.2500 is unlikely to come into view.' USD subsequently rose to 7.2904 and then, in a surprising move, plunged and almost reached 7.2500 (low of 7.2512). Unsurprisingly, the price action has resulted in a sharp and rapid increase in downward momentum. Today, as long as USD remains below 7.2800 (minor resistance is at 7.2710), it could dip below 7.2500 before stabilisation is likely. This time around, the major support at 7.2300 is unlikely to come into view."
1-3 WEEKS VIEW: "Last Friday (14 Feb, spot at 7.2785), we highlighted that 'there has been an increase in momentum, but not enough to indicate the start of a sustained decline.' We also highlighted that, 'to continue to decline, USD must break and remain below 7.2500.' We added, 'the likelihood of USD breaking clearly below 7.2500 will increase in the next few days as long as 7.3070 is not breached.' USD subsequently dropped to a low of 7.2512. While the 7.2500 level has not been clearly breached yet, the increase in momentum suggests USD could decline to the next major support level, at 7.2300. On the upside, the ‘strong resistance’ level has moved lower to 7.2960 from 7.3070."
-
12:29
Gold of to a calm start to the week with US markets closed
- Gold tris to pop back above $2,900 after a downbeat performance on Friday.
- A flood of geopolitical headlines are driving markets on Monday.
- A daily close above $2,900 would support more upside in Gold this week.
Gold’s price (XAU/USD) is trying to reclaim $2,900 again at the time of writing on Monday after its steep correction on Friday. While United States (US) markets are closed due to the President’s Day bank holiday, the Federal Reserve (Fed) is not. On a rather windstill trading day, no less than three Fed speakers will issue comments in an otherwise empty macroeconomic calendar.
Meanwhile, the weekend was filled again with several geopolitical news and comments. US President Donald Trump and Russian President Vladimir Putin are set to meet each other in Saudi Arabia to discuss peace within Ukraine. Neither Ukraine nor Europe are invited to these talks, while both US and Russian officials are already underway.
Daily digest market movers: All eyes on Saudi Arabia
- Market participants are waiting for more insights on President Trump’s reciprocal tariff plans, which could heighten global trade tensions. Next to that, levies on automobiles would be coming as soon as April 2, Bloomberg reports.
- If Senator Cynthia Lummis’ proposal becomes more concrete, Bitcoin could join Gold. The senator suggested adding Bitcoin to the US reserves on Sunday, highlighting the blockchain network's transparency and accessibility.
- At 14:30 GMT, Federal Reserve Bank of Philadelphia Patrick Harker delivers a speech on the economic outlook at the Central Banking Series Conference at the University of the Bahamas in Nassau.
- At 15:20 GMT, Fed Governor Michelle W. Bowman delivers brief remarks on the economy and bank regulation at the American Bankers Association (ABA) Conference for Community Bankers in Phoenix, Arizona.
- Closing off this Monday, at 23:00 GMT, Fed Governor Christopher J. Waller speaks on the economic outlook at the UNSW Macroeconomic Workshop in Sydney, Australia.
Technical Analysis: Headline risks could snap
Gold recovers and trades back above $2,900 on Monday following the near 1.5% decline on Friday. However, keep in mind that US bond markets are closed on Monday due to the President’s Day bank holiday. Look out for the headlines on Ukraine and possible new announcements on tariffs.
The first support level on Monday, the S1 support, stands at $2,859. Further down, the S2 support at $2,836 should act as a safeguard and prevent any additional declines to the more significant $2,790 level (October 31, 2024, high).
On the upside, the Daily Pivot at $2,899 is the first level to reclaim again. Next, the R1 resistance at $2,922 is the first level that needs to be recovered, followed by the R2 resistance at $2,962. Further up, the $3,000 psychological level could be next.

XAU/USD: Daily Chart
Interest rates FAQs
Interest rates are charged by financial institutions on loans to borrowers and are paid as interest to savers and depositors. They are influenced by base lending rates, which are set by central banks in response to changes in the economy. Central banks normally have a mandate to ensure price stability, which in most cases means targeting a core inflation rate of around 2%. If inflation falls below target the central bank may cut base lending rates, with a view to stimulating lending and boosting the economy. If inflation rises substantially above 2% it normally results in the central bank raising base lending rates in an attempt to lower inflation.
Higher interest rates generally help strengthen a country’s currency as they make it a more attractive place for global investors to park their money.
Higher interest rates overall weigh on the price of Gold because they increase the opportunity cost of holding Gold instead of investing in an interest-bearing asset or placing cash in the bank. If interest rates are high that usually pushes up the price of the US Dollar (USD), and since Gold is priced in Dollars, this has the effect of lowering the price of Gold.
The Fed funds rate is the overnight rate at which US banks lend to each other. It is the oft-quoted headline rate set by the Federal Reserve at its FOMC meetings. It is set as a range, for example 4.75%-5.00%, though the upper limit (in that case 5.00%) is the quoted figure. Market expectations for future Fed funds rate are tracked by the CME FedWatch tool, which shapes how many financial markets behave in anticipation of future Federal Reserve monetary policy decisions.
-
12:24
USD/JPY: Unlikely to reach the major support at 151.00 – UOB Group
US Dollar (USD) is likely to edge lower vs Japanese Yen (USD), but it is unlikely to reach the major support at 151.00. In the longer run, upward momentum has largely faded; USD is likely to trade in a 151.00/155.00 range for the time being, UOB Group’s FX analysts Quek Ser Leang and Peter Chia note.
Upward momentum has largely faded
24-HOUR VIEW: "We indicated last Friday that 'the outlook is unclear after the sharp swings.' We expected USD to trade in a choppy manner between 152.00 and 154.00.' USD then traded in a 152.01/153.15 range, closing lower by 0.33% at 152.33. There has been a tentative buildup in downward momentum. Today, USD is likely to edge lower, but it is unlikely to reach the major support at 151.00 (there is another support level at 151.60. Resistance is at 152.50; a breach of 152.85 would indicate that the buildup in momentum has faded."
1-3 WEEKS VIEW: "There is not much to add to our update from last Friday (14 Feb, spot at 152.70). As noted, the recent 'upward momentum has largely faded.' For the time being, USD 'is likely to trade in a 151.00/155.00 range'."
-
12:19
NZD/USD: Major resistance at 0.5790 is unlikely to come under threat – UOB Group
New Zealand Dollar (NZD) could test 0.5755 vs US Dollar (USD) before levelling off; the major resistance at 0.5790 is unlikely to come under threat. In the longer run, price action suggests further NZD strength, potentially to 0.5790, UOB Group’s FX analysts Quek Ser Leang and Peter Chia note.
Price action suggests further NZD strength
24-HOUR VIEW: "We did not anticipate the strong rally in NZD that sent it to a high of 0.5738 (we were expecting range trading). Although the rapid rise appears to be overdone, NZD could test 0.5755 before levelling off. The major resistance at 0.5790 is unlikely to come under threat. Support is at 0.5715; a breach of 0.5690 would suggest NZD is likely to trade in a range instead of rising further."
1-3 WEEKS VIEW: "Our most recent narrative was from last Tuesday (11 Feb, spot at 0.5640), wherein 'for the time being, NZD is likely to trade in a range between 0.5595 and 0.5720.' After trading in a range for a few days, NZD lifted off last Friday and soared to 0.5738. The price action suggests further NZD strength, potentially to 0.5790. To sustain the buildup in momentum, NZD must remain above the ‘strong support’ level, currently at 0.5665."
-
12:15
RBA is expected to deliver its first 25bp rate cut – Danske Bank
Both AUD and NZD ended last week on a strong footing amid broadly positive risk sentiment, but this week might bring more mixed winds for the antipodeans, Danske Bank's FX analyst Mohamad Al-Saraf reports.
RBNZ to continue its cutting cycle with another 50bp reduction
"The Reserve Bank of Australia (RBA) is expected to deliver its first 25bp rate cut early Tuesday morning. Markets price in about 90% probability for the move, but especially if paired with guidance of more cuts to come, the start of the easing cycle could weigh on AUD FX."
"Less than 24 hours later the Reserve Bank of New Zealand (RBNZ) is set to continue its cutting cycle with another 50bp reduction according to both consensus and markets. But having already reduced policy restraint by 125bp before this week, any hawkish forward guidance about slowing the pace of cuts in the coming meetings could provide some tailwind to NZD."
"We remain short AUD/NZD as part of our FX Top Trades 2025." -
11:53
AUD/USD: Unlikely to rise much further – UOB Group
Australian Dollar (AUD) is unlikely to rise much further; it is expected to trade in a 0.6325/0.6375 range. In the longer run, momentum remains strong; AUD could continue to advance, potentially to 0.6410, UOB Group’s FX analysts Quek Ser Leang and Peter Chia note.
Long term momentum remains strong
24-HOUR VIEW: "Last Friday, we indicated that 'as long as AUD remains above 0.6270, there is a chance for it to rise above 0.6330.' However, we were of the view that 'the major resistance at 0.6355 is likely out of reach for now.' While AUD did not threaten the 0.6270 support level (low has been 0.6311), it rose more than expected, reaching a high of 0.6368 before settling at 0.6353 (+0.56%). The rally appears to be overdone, and AUD is unlikely to rise much further. Today, we expect AUD to trade in a 0.6325/0.6375 range."
1-3 WEEKS VIEW: "Earlier this month on 06 Feb (spot at 0.6280), we indicated that 'if AUD closes above 0.6310, it could trigger an advance to 0.6355.' After AUD closed above 0.6310, we highlighted last Friday (14 Feb, spot at 0.6315) that 'as long as 0.6250 (‘strong support’ level) is not breached, AUD is likely to rise to 0.6355.' AUD subsequently rose above 0.6355 and reached a high of 0.6368. Momentum remains strong, and we continue to expect AUD to advance, potentially to 0.6410. On the downside, the ‘strong support’ level has moved higher to 0.6290 from 0.6250."
-
11:49
EUR/USD to consolidate around current levels this week – Danske Bank
EUR/USD has edged higher to just below the 1.05 mark, supported by renewed momentum in Ukraine peace talks, Danske Bank's FX analyst Mohamad Al-Saraf reports.
All eyes on euro area PMIs this week
"Markets largely shrugged off last week's hot US January CPI print, with tariff and geopolitical headlines driving price action instead. This week is relatively quiet on the economic data front, making it likely that political developments will continue to generate some FX volatility."
"On tariffs, there has been significant rhetoric but little immediate action, aligning with our view that Trump will ultimately underdeliver on tariffs. The broad EUR has gained support from optimism surrounding a potential resolution to the Ukraine war."
"We expect EUR/USD to consolidate around current levels this week, with the key focus on PMI releases for major economies toward the end of the week. Notably, euro area PMIs showed some positive momentum in January, and it will be important to see if this trend continues."
-
11:44
Gas prices still remain elevated – ING
European gas prices fell by a little more than 9% last week, the largest weekly decline since early January. However, prices still remain elevated, with TTF trading above EUR50/MWh, ING’s commodity analysts Warren Patterson and Ewa Manthey notes.
Russia and Ukraine peace talks may weigh on sentiment
"US and Russia talks working towards a peace deal between Russia and Ukraine will weigh on sentiment. In addition, there are ongoing discussions around flexibility with regards to storage refill targets. There is still little clarity over whether Germany will subsidise storage refills and, if so, how it will be done."
"Although, the backwardation between summer 2025 and winter 2025/26 prices has flattened somewhat over the last week. If this trend continues, it obviously reduces the likelihood of new subsidies. However, storage levels are a concern for Europe."
"Gas storage levels fell at a fairly quick pace last week, leaving them at a little under 45% full, compared to a 5-year average of 54% full. Colder weather forecasts for the next couple of days mean that these stronger storage draws will likely continue until weather turns milder later in the week."
-
11:41
USD/JPY: Lower on BoJ hike prospects – OCBC
USD/JPY extended its decline as stronger 4Q GDP print (2.8% QoQ, saar) solidified expectations for another BoJ hike to be in due course. USD/JPY was last seen at 151.71 levels, OCBC's FX analysts Frances Cheung and Christopher Wong note.
Slight risks to the downside in the interim
"There were also chatters of a 8% increase in wages for large Japanese bank, adding to the list that a handful of Japanese corporates are likely to see another year of wage increases, meeting one of BoJ’s pre-requisites for policy normalisation."
"Daily momentum is flat while RSI fell. Consolidation likely, with slight risks to the downside in the interim. Support at 151.50 (38.2% fibo retracement of Sep low to Jan high), 150 levels. Resistance at 152.70 (200 DMA), 153.40 (100 DMA) and 154.30 levels."
"Elsewhere, tariff concerns remain but it appears that Japan is attempting to seek exemptions with regards to Trump’s proposed reciprocal tariffs. Ministry of Foreign Affairs Takeshi Iwaya also raised the issue of automobile tariffs and sought exclusion from the 25% tariff on imported steel and aluminium products at the Munich Security Conference last Fri."
-
11:40
EUR/USD tussles as investors assess Trump tariffs threats on the Eurozone
- EUR/USD gives a tough fight to psychological resistance of 1.0500 as the outlook of the US Dollar is uncertain.
- ECB’s Panetta is worried about growing risks of inflation undershooting the 2% target.
- US President Donald announced on Friday that he plans to impose tariffs on imported cars.
EUR/USD struggles to extend its upside move above the psychological resistance of 1.0500 in Monday’s European session. The major currency pair is broadly sideways as investors assess the likely impact of United States (US) President Donald Trump’s tariffs on the Eurozone.
On Friday, President Trump announced that he plans to impose tariffs on imported cars around April 2. Reciprocal tariffs are also planned in the same period.
Market participants expect the major impact of levies on autos will be on Germany, Japan, and South Korea, which are leading exporters of cars to the US. According to OEC data, the German economy exported $24.3 billion worth of vehicles to the US in 2023.
Over the weekend, European Central Bank (ECB) policymaker and Governor of Bank of Italy Fabio Panetta said in a speech at Italy's annual Assiom-Forex financial conference that the net effect of the tariffs on inflation in Eurozone would be “limited, if not slightly negative”.
Panetta’s views are based on the assumption that potential weakness in the Euro (EUR), due to higher US tariffs and any retaliation from Europe, would be countered by a global economic slowdown and China dumping goods hit by the tariffs into European markets.
Fabio Panetta guided a dovish monetary policy outlook, arguing that the predominant risk for the old continent is “inflation falling below the 2% target over the medium term.”
Daily digest market movers: EUR/USD struggles as US Dollar gains ground temporarily
- EUR/USD faces pressure to extend last week’s strength as the US Dollar (USD) is cautiously steady near its fresh two-month low, posted on Friday. The US Dollar Index (DXY), which tracks the Greenback’s value against six major currencies, trades near 106.80.
- The USD Index witnessed a sharp sell-off on Friday after the release of the poor US Retail Sales data for January. The Retail Sales data, a key measure of consumer spending, declined at a faster pace of 0.9% in the month. Economists expected the consumer spending measure to have contracted by 0.1%.
- The outlook for the US Dollar was already bearish as fears of immediate reciprocal tariffs by President Trump had waned. On Thursday, Donald Trump asked the Commerce and Treasury Department to prepare a reciprocal tariff plan. However, investors anticipated that Trump would unveil the detailed reciprocal tariff plan immediately.
- These expectations were based on Trump’s tweet on Truth Social, “Three great weeks, perhaps the best ever, but today is the big one: reciprocal tariffs!!! Make America great again!!!", which came in early North American trading hours on Thursday.
- This week, the US Dollar will be influenced by speeches from a slew of Federal Reserve (Fed) officials who will guide the monetary policy outlook. On the economic front, investors will focus on the preliminary S&P Global Purchasing Managers Index (PMI) data for February, which will be released on Friday.
Technical Analysis: EUR/USD faces resistance near 1.0500
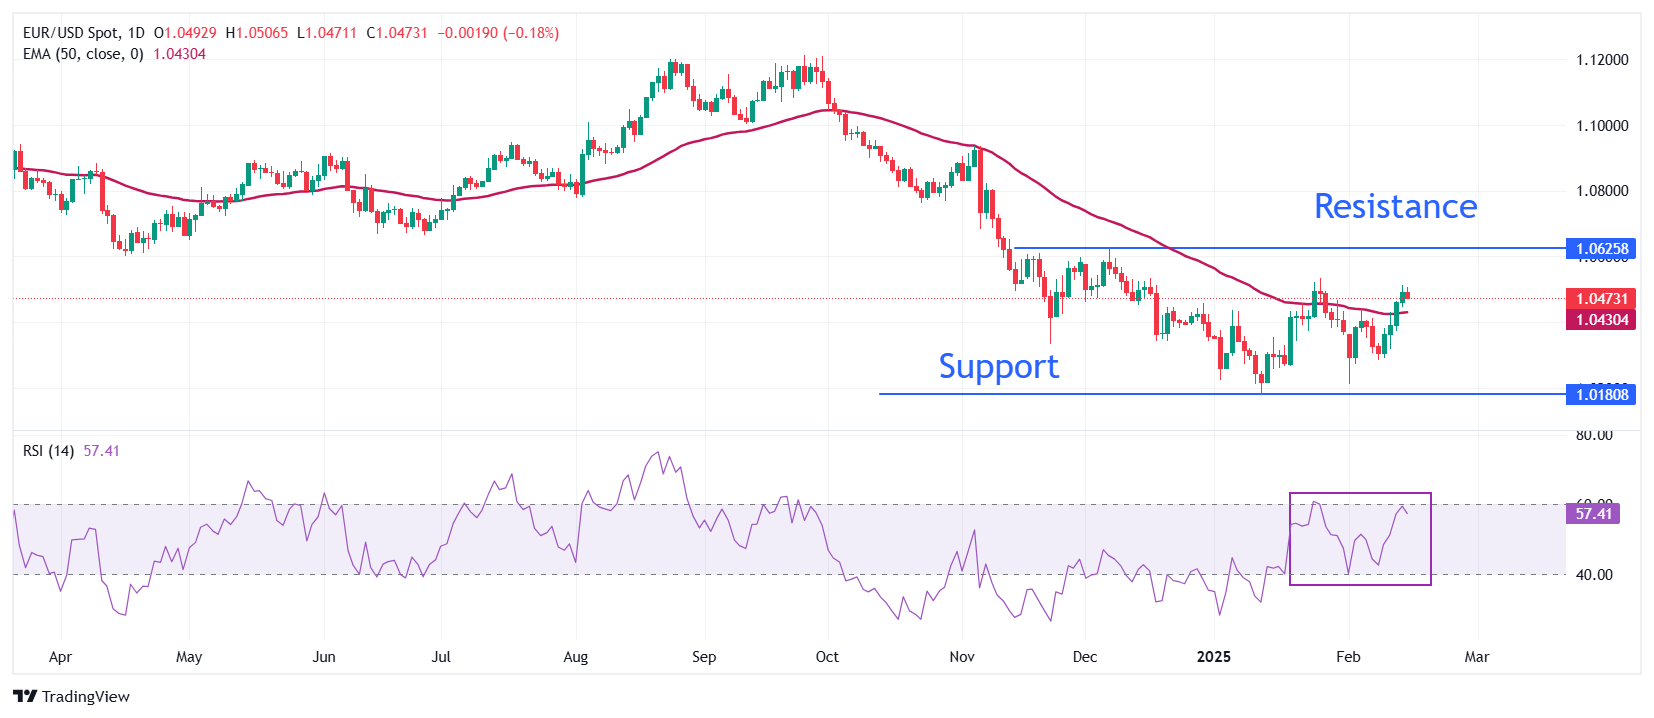
EUR/USD struggles to break above the key resistance of 1.0500 in European trading hours on Monday. The outlook of the major currency pair has turned bullish as it holds above the 50-day Exponential Moving Average (EMA), which stands at around 1.0430.
The 14-day Relative Strength Index (RSI) advances to near 60.00. A bullish momentum would be activated if the RSI (14) manages to sustain above that level.
Looking down, the February 10 low of 1.0285 will act as the major support zone for the pair. Conversely, the December 6 high of 1.0630 will be the key barrier for the Euro bulls.
Euro FAQs
The Euro is the currency for the 19 European Union countries that belong to the Eurozone. It is the second most heavily traded currency in the world behind the US Dollar. In 2022, it accounted for 31% of all foreign exchange transactions, with an average daily turnover of over $2.2 trillion a day. EUR/USD is the most heavily traded currency pair in the world, accounting for an estimated 30% off all transactions, followed by EUR/JPY (4%), EUR/GBP (3%) and EUR/AUD (2%).
The European Central Bank (ECB) in Frankfurt, Germany, is the reserve bank for the Eurozone. The ECB sets interest rates and manages monetary policy. The ECB’s primary mandate is to maintain price stability, which means either controlling inflation or stimulating growth. Its primary tool is the raising or lowering of interest rates. Relatively high interest rates – or the expectation of higher rates – will usually benefit the Euro and vice versa. The ECB Governing Council makes monetary policy decisions at meetings held eight times a year. Decisions are made by heads of the Eurozone national banks and six permanent members, including the President of the ECB, Christine Lagarde.
Eurozone inflation data, measured by the Harmonized Index of Consumer Prices (HICP), is an important econometric for the Euro. If inflation rises more than expected, especially if above the ECB’s 2% target, it obliges the ECB to raise interest rates to bring it back under control. Relatively high interest rates compared to its counterparts will usually benefit the Euro, as it makes the region more attractive as a place for global investors to park their money.
Data releases gauge the health of the economy and can impact on the Euro. Indicators such as GDP, Manufacturing and Services PMIs, employment, and consumer sentiment surveys can all influence the direction of the single currency. A strong economy is good for the Euro. Not only does it attract more foreign investment but it may encourage the ECB to put up interest rates, which will directly strengthen the Euro. Otherwise, if economic data is weak, the Euro is likely to fall. Economic data for the four largest economies in the euro area (Germany, France, Italy and Spain) are especially significant, as they account for 75% of the Eurozone’s economy.
Another significant data release for the Euro is the Trade Balance. This indicator measures the difference between what a country earns from its exports and what it spends on imports over a given period. If a country produces highly sought after exports then its currency will gain in value purely from the extra demand created from foreign buyers seeking to purchase these goods. Therefore, a positive net Trade Balance strengthens a currency and vice versa for a negative balance.
-
11:24
Oil prices are under pressure this morning – ING
Despite the downward pressure on oil prices through much of last week, the market still managed to eke out a small gain with ICE Brent settling 0.11% higher on the week. However, timespreads have weakened significantly since peaking in January, suggesting that the tightness in the physical market is easing. While the prompt ICE Brent spread is still in backwardation, the NYMEX WTI prompt spread has flipped back to a small contango, ING’s commodity analysts Warren Patterson and Ewa Manthey notes.
Possible restart in oil exports from Iraq’s Kurdistan region
"Pressure on the flat price has continued this morning with suggestions that oil exports from Iraq’s Kurdistan region could resume in March, which could see exports of around 300k b/d through the Ceyhan pipeline. Flows were halted in early 2023 after a payment dispute between Iraq and Turkey."
"However, this is not the first time we have heard suggestions that exports could restart. In addition, if flows were to resume it would complicate issues around Iraqi output and its compliance with production targets under the OPEC+ deal."
"Positioning data also shows that speculators are relatively more bearish towards the oil market. The managed money net long in NYMEX WTI fell by 18,303 lots WoW to 122,237 lots as of last Tuesday. This move was driven more by fresh shorts entering the market than longs liquidating. Meanwhile, there was little change in speculative positioning in ICE Brent, with the net long cut by just 569 lots to 289,154 lots."
-
11:21
DXY: Bearish crossover on the day – OCBC
US Dollar (USD) longs continue to unwind as tariff concerns fade. DXY was last at 106.84 levels, OCBC's FX analysts Frances Cheung and Christopher Wong note.
Risk remains skewed to the downside
"Prospects of a Ukraine peace deal as well as a re-rating of Chinese tech stocks also helped to support sentiments while counter-cyclical USD comes under pressure. A potential meeting between President Xi and prominent Chinese tech entrepreneurs, Jack Ma and DeepSeek founder Liang Wenfeng is perceived as a positive signal."
"Markets are hoping that the outcome of the meeting shows Xi’s support for private sector and/or AI developments. Last Fri, US retail sales disappointed, further adding to USD woes."
"Daily momentum is bearish while RSI fell. Bearish crossover observed (21 DMA cuts 50 DMA to the downside). Risk remains skewed to the downside. Support at 106.20/40 levels (100 DMA, 38.2% fibo retracement of Oct low to Jan high). Resistance at 107.80 (23.6% fibo), 108.00/10 (21, 50 DMAs), and 108.50 levels."
-
11:16
GBP/USD: Likely to trade in a range between 1.2540 and 1.2620 – UOB Group
The Pound Sterling (GBP) is likely to trade in a range between 1.2540 and 1.2620 vs the US Dollar (USD). In the longer run, further GBP strength appears likely; the focus is at 1.2655, UOB Group’s FX analysts Quek Ser Leang and Peter Chia note.
Further GBP strength appears likely
24-HOUR VIEW: "GBP soared and closed higher by 0.99% at 1.2569 last Thursday. On Friday, we highlighted that 'while there appears to be enough momentum for GBP to rise further today, deeply overbought conditions suggest any advance is likely part of a higher 1.2480/1.2600 range.' However, GBP rose more than expected to 1.2631, pulling back to close at 1.2585 (+0.13%). The pullback in overbought conditions suggests that GBP is unlikely to rise much further. Today, it is more likely to trade in a range, probably between 1.2540 and 1.2620."
1-3 WEEKS VIEW: "We highlighted last Friday (14 Feb, spot at 1.2560) that 'the sharp increase in momentum is likely to lead to further GBP strength.' We pointed out that 'the levels to watch are 1.2600 and 1.2655.' We did not quite expect GBP to breach 1.2600 so soon as it rose to 1.2631. Further GBP strength appears likely, and the focus now is at 1.2655. On the downside, should GBP breach 1.2480 (‘strong support’ level was at 1.2450 last Friday), it would mean the current upward momentum has faded."
-
11:15
AUD/USD refreshes two-month high near 0.6370 ahead of RBA monetary policy
- AUD/USD gains to near 0.6370 as the market sentiment is favorable for risk-sensitive assets.
- Delayed Trump’s reciprocal tariffs and hope of a Russia-Ukraine truce have improved the market mood.
- The RBA is expected to cut its OCR by 25 bps to 4.1% on Tuesday.
The AUD/USD pair posts a fresh two-month low at 0.6373 in Monday’s European session. The Aussie pair strengthens as the Australian Dollar (AUD) performs strongly on upbeat market mood. Market sentiment is favorable for risky assets as investors expect United States (US) President Donald Trump’s tariff agenda won’t be as impactful as anticipated.
A delay in Trump’s reciprocal tariffs has eased fears of an immediate global trade war. Apart from that, growing optimism towards Russia-Ukraine peace has also kept risky assets on the frontfoot.
Meanwhile, the major trigger for the Australian Dollar is the Reserve Bank of Australia’s (RBA) monetary policy meeting, which is scheduled for Tuesday. The RBA is almost certain to cut its Official Cash Rate (OCR) by 25 basis points (bps) to 4.10%. This would be the first interest rate cut by the RBA in almost five years.
Amid firm expectations that the RBA will reduce its borrowing rates, investors will pay close to RBA Governor Michele Bullock’s press conference to get cues about the inflation and the interest rate outlook.
The US Dollar (USD) ticks higher but trades cautiously amid risk-on market mood and poor US Retail Sales data for January. The US Dollar Index (DXY), which tracks the Greenback’s value against six major currencies, wobbles around the two-month low near 106.80.
On Friday, the US Census Bureau reported that Retail Sales, a key measure of consumer spending, declined by 0.9% on month. Economists expected the consumer spending measure to have contracted marginally by 0.1%.
Australian Dollar FAQs
One of the most significant factors for the Australian Dollar (AUD) is the level of interest rates set by the Reserve Bank of Australia (RBA). Because Australia is a resource-rich country another key driver is the price of its biggest export, Iron Ore. The health of the Chinese economy, its largest trading partner, is a factor, as well as inflation in Australia, its growth rate and Trade Balance. Market sentiment – whether investors are taking on more risky assets (risk-on) or seeking safe-havens (risk-off) – is also a factor, with risk-on positive for AUD.
The Reserve Bank of Australia (RBA) influences the Australian Dollar (AUD) by setting the level of interest rates that Australian banks can lend to each other. This influences the level of interest rates in the economy as a whole. The main goal of the RBA is to maintain a stable inflation rate of 2-3% by adjusting interest rates up or down. Relatively high interest rates compared to other major central banks support the AUD, and the opposite for relatively low. The RBA can also use quantitative easing and tightening to influence credit conditions, with the former AUD-negative and the latter AUD-positive.
China is Australia’s largest trading partner so the health of the Chinese economy is a major influence on the value of the Australian Dollar (AUD). When the Chinese economy is doing well it purchases more raw materials, goods and services from Australia, lifting demand for the AUD, and pushing up its value. The opposite is the case when the Chinese economy is not growing as fast as expected. Positive or negative surprises in Chinese growth data, therefore, often have a direct impact on the Australian Dollar and its pairs.
Iron Ore is Australia’s largest export, accounting for $118 billion a year according to data from 2021, with China as its primary destination. The price of Iron Ore, therefore, can be a driver of the Australian Dollar. Generally, if the price of Iron Ore rises, AUD also goes up, as aggregate demand for the currency increases. The opposite is the case if the price of Iron Ore falls. Higher Iron Ore prices also tend to result in a greater likelihood of a positive Trade Balance for Australia, which is also positive of the AUD.
The Trade Balance, which is the difference between what a country earns from its exports versus what it pays for its imports, is another factor that can influence the value of the Australian Dollar. If Australia produces highly sought after exports, then its currency will gain in value purely from the surplus demand created from foreign buyers seeking to purchase its exports versus what it spends to purchase imports. Therefore, a positive net Trade Balance strengthens the AUD, with the opposite effect if the Trade Balance is negative.
-
11:08
GBP: Focus on Tuesday's jobs data – ING
This year's FX markets have told not to chase big definitive headlines or range breakouts, and this applies to GBP/USD at 1.2600/2610, ING’s FX analysts Chris Turner notes.
GBP/USD to be back at 1.24 by the end of March
"We think this is an important resistant area. Rather than pushing strongly ahead, we suspect GBP/USD gains will fade and these levels will be looked back on as an area to increase sterling hedge ratios for the year."
"Away from the politics of US foreign policy, sterling's focus this week will be on jobs data, CPI and a speech from Bank of England Governor, Andrew Bailey, tomorrow morning. Expect more focus on the jobs data given Monetary Policy Committee former hawk Catherine Mann's focus on a 'non-linear' adjustment in UK employment."
"We continue to doubt that GBP/USD can sustain gains over 1.26 and expect it to be trading back at 1.24 by the end of March."
-
11:07
Bailey speech: Q4 GDP figures do not change general story on the UK economy
Bank of England (BoE) Governor Andrew Bailey said on Monday that the fourth quarter Gross Domestic Product (GDP) figures do not change general story on the UK economy.
Additional quotes
Question of whether supply or demand is behind the UK economic weakness will take some time to resolve.
Impact of US trade tariffs on inflation is much more ambiguous than their impact on growth if they lead to fragmentation of world economy.
We still see the gradual disinflation going on.
The economic context is not really supporting the view that we will get more persistence in inflation.
Encouraged by Fed Chairman Powell saying he expects US to implement basel 3.1 bank rules.
Market reaction
At the time of writing, GBP/USD hold steady below 1.2600, unperturbed by Bailey’s comments.
BoE FAQs
The Bank of England (BoE) decides monetary policy for the United Kingdom. Its primary goal is to achieve ‘price stability’, or a steady inflation rate of 2%. Its tool for achieving this is via the adjustment of base lending rates. The BoE sets the rate at which it lends to commercial banks and banks lend to each other, determining the level of interest rates in the economy overall. This also impacts the value of the Pound Sterling (GBP).
When inflation is above the Bank of England’s target it responds by raising interest rates, making it more expensive for people and businesses to access credit. This is positive for the Pound Sterling because higher interest rates make the UK a more attractive place for global investors to park their money. When inflation falls below target, it is a sign economic growth is slowing, and the BoE will consider lowering interest rates to cheapen credit in the hope businesses will borrow to invest in growth-generating projects – a negative for the Pound Sterling.
In extreme situations, the Bank of England can enact a policy called Quantitative Easing (QE). QE is the process by which the BoE substantially increases the flow of credit in a stuck financial system. QE is a last resort policy when lowering interest rates will not achieve the necessary result. The process of QE involves the BoE printing money to buy assets – usually government or AAA-rated corporate bonds – from banks and other financial institutions. QE usually results in a weaker Pound Sterling.
Quantitative tightening (QT) is the reverse of QE, enacted when the economy is strengthening and inflation starts rising. Whilst in QE the Bank of England (BoE) purchases government and corporate bonds from financial institutions to encourage them to lend; in QT, the BoE stops buying more bonds, and stops reinvesting the principal maturing on the bonds it already holds. It is usually positive for the Pound Sterling.
-
11:03
JPY: Higher odds of a 1.25% BOJ terminal rate over next two years – BBH
Japanese Yen (JPY) is outperforming. Japan’s preliminary real GDP increased four ticks more than expected by 0.7% q/q in Q4 vs. 0.3% in Q3. But the details were unimpressive, BBH's FX analysts report.
Japan rate expectations are adjusted higher
"Net exports added 0.7pts to growth on slumping imports. The growth contributions from household spending and non-residential business investment were subdued at 0.1pts each while inventory destocking shaved -0.2pts from growth."
"Japan rate expectations adjusted higher to imply higher odds of a 1.25% Bank of Japan (BOJ) terminal rate over next two years vs. 1.00% previously. Japan’s January CPI print on Thursday will either reinforce a more aggressive BOJ normalization cycle or curtail current rate hike expectations."
-
11:00
Eurozone Trade Balance s.a.: €14.6B (December) vs €12.9B
-
11:00
Eurozone Trade Balance n.s.a. came in at €15.5B, above expectations (€14.4B) in December
-
10:58
USD: Sizing the correction – ING
The Dollar Index (DXY) is down just over 3% from its early January high. There is a sense that US President Donald Trump's bark is worse than his bite when it comes to trade (Mexico and Canada given a temporary reprieve on tariffs) plus Friday's release of January US retail sales data warns that US growth is starting 2025 on a softer footing. At the same time, some overseas economies – such as Japan – have been showing better-than-expected growth, ING’s FX analysts Chris Turner notes.
The 106.00/106.35 area to mark the low point for DXY
"The question is: how much further does the dollar need to correct? We are in the camp answering: 'not much'. It is clear that the threat of tariffs has not receded and that the broad foundations laid for 'reciprocal' tariffs announced last week mean that substantial tariffs will be coming probably in the second quarter. Tariffs are positive for the dollar – even though the dollar already rallied 10% between October and January."
"Unless you have a strong conviction that US activity data is going to decelerate sharply from here, to us it looks like we're getting towards the end of this dollar correction. We suspect that something like the 106.00/106.35 area will mark the low point for DXY in the first quarter."
"In terms of events this week and after today's Presidents' Day US public holiday, attention will turn to events in Saudi Arabia and Europe as US, Russian, and European leaders discuss how to end the war in Ukraine. The US data calendar is pretty light this week, with just FOMC minutes on Wednesday and business and consumer confidence figures on Friday standing out."
-
10:33
ECB has scope to deliver on rate cut expectations – BBH
EUR/USD is consolidating just under 1.0500. Over the weekend, ECB Governing Council member Fabio Panetta argued for looser monetary policy , BBH's FX analysts report.
ECB stance can pull EUR/USD lower
"Panetta said that monetary policy continues to exert downward pressure on economic activity and on inflation, an effect that is less and less necessary with near-target inflation and persistently weak domestic demand. A less decisive easing of monetary policy could lead to excessively low inflation in the medium term."
"Markets imply another 75bps of ECB cuts in the next 12 months which would see the policy rate bottom at 2.00%. Unlike the Fed, the ECB has scope to deliver on rate cut expectations which can pull EUR/USD lower. ECB Governing Council member Joachim Nagel speaks today (11:00am London). Contrary to Panetta, Nagel has cautioned against easing aggressively."
-
10:30
Silver price today: Silver rises, according to FXStreet data
Silver prices (XAG/USD) rose on Monday, according to FXStreet data. Silver trades at $32.33 per troy ounce, up 0.48% from the $32.18 it cost on Friday.
Silver prices have increased by 11.91% since the beginning of the year.
Unit measure Silver Price Today in USD Troy Ounce 32.33 1 Gram 1.04
The Gold/Silver ratio, which shows the number of ounces of Silver needed to equal the value of one ounce of Gold, stood at 89.68 on Monday, broadly unchanged from 89.67 on Friday.
Silver FAQs
Silver is a precious metal highly traded among investors. It has been historically used as a store of value and a medium of exchange. Although less popular than Gold, traders may turn to Silver to diversify their investment portfolio, for its intrinsic value or as a potential hedge during high-inflation periods. Investors can buy physical Silver, in coins or in bars, or trade it through vehicles such as Exchange Traded Funds, which track its price on international markets.
Silver prices can move due to a wide range of factors. Geopolitical instability or fears of a deep recession can make Silver price escalate due to its safe-haven status, although to a lesser extent than Gold's. As a yieldless asset, Silver tends to rise with lower interest rates. Its moves also depend on how the US Dollar (USD) behaves as the asset is priced in dollars (XAG/USD). A strong Dollar tends to keep the price of Silver at bay, whereas a weaker Dollar is likely to propel prices up. Other factors such as investment demand, mining supply – Silver is much more abundant than Gold – and recycling rates can also affect prices.
Silver is widely used in industry, particularly in sectors such as electronics or solar energy, as it has one of the highest electric conductivity of all metals – more than Copper and Gold. A surge in demand can increase prices, while a decline tends to lower them. Dynamics in the US, Chinese and Indian economies can also contribute to price swings: for the US and particularly China, their big industrial sectors use Silver in various processes; in India, consumers’ demand for the precious metal for jewellery also plays a key role in setting prices.
Silver prices tend to follow Gold's moves. When Gold prices rise, Silver typically follows suit, as their status as safe-haven assets is similar. The Gold/Silver ratio, which shows the number of ounces of Silver needed to equal the value of one ounce of Gold, may help to determine the relative valuation between both metals. Some investors may consider a high ratio as an indicator that Silver is undervalued, or Gold is overvalued. On the contrary, a low ratio might suggest that Gold is undervalued relative to Silver.
(An automation tool was used in creating this post.)
-
10:27
EUR/USD: Cautious optimism over a Ukraine peace deal – OCBC
Euro (EUR) continued to drift higher vs the US Dollar (USD) on prospects of a Ukraine peace deal and on news of a delay in reciprocal tariffs. EUR was last seen at 1.0479. Tariff concerns remain and appears to open up EU’s willingness to negotiate, OCBC's FX analysts Frances Cheung and Christopher Wong note.
Daily momentum is mild bullish
"At the Munich Security Conference on Fri, European Commissioner for Trade and Economic Security, Maroš Šefčovič said that Brussels is ready to discuss 'anything' to avoid Trump’s tariff on European exports. He mentioned that Brussels is willing to reduce its substantial surplus in goods and services with the US, which reached €50 billion last year and has also signalled that the EU is ready to reduce its 10% tariff rate on cars, which is four times higher than the US rate."
"He also indicated that the EU could boost purchases of US goods such as LNG and soybeans. EU officials confirmed that Šefčovič will travel to Washington on Monday to hold talks with senior Trump administration officials, including Commerce Secretary nominee Howard Lutnick, trade representative nominee Jamieson Greer, and National Economic Council chief Kevin Hassett. "
"Daily momentum is mild bullish while RSI rose. Immediate resistance at 1.05, 1.0540 levels. Break-out puts next resistance at 1.0570 (38.2% fibo retracement of Sep high to Jan low, 100 DMA), 1.0620 levels. Support at 1.0390 (21, 50 DMAs), 1.03 levels."
-
10:20
EUR: The focus on the run-up to the weekend elections in Germany – ING
There is a lot of soul-searching underway in European capitals as leaders come to terms with last week's shock new direction for US foreign policy. Having been shut out of negotiations in Saudi Arabia this week, European leaders are meeting in Paris to define a position. One of the big questions will be what to do about defense spending, ING’s FX analysts Chris Turner notes.
EUR/USD set to be back at 1.03 in a month's time
"If so, that should mean higher long-term European interest rates, and perhaps there were some early signs of that on Friday when European bond yields did not follow US Treasury yields lower on the softer US retail sales data. While moves towards a ceasefire in Ukraine have been helping EUR/USD at the margin, the prospect of increased US isolationism certainly does not look a positive for the euro."
"And a much higher EUR/USD from here probably requires a conviction on some much softer US activity data – a conviction we do not have. We remain of the view that this EUR/USD correction will probably peter out somewhere in the 1.0535/75 area and stick with the view that EUR/USD will be back at 1.03 in a month's time."
"On the eurozone calendar this week are consumer confidence on Thursday and the flash February PMIs on Friday. The focus will also be on the run-up to the weekend elections in Germany, where a very tight result and a delay in forming a coalition would likely be seen as a euro negative given the lack of leadership in Europe currently."
-
10:13
EUR/USD: More likely to consolidate within a 1.0455/1.0515 range – UOB Group
Instead of continuing to rise, Euro (EUR) is more likely to consolidate within a 1.0455/1.0515 range vs US Dollar (USD). In the longer run, outlook for EUR is positive, with a technical target of 1.0530, UOB Group’s FX analysts Quek Ser Leang and Peter Chia note.
EUR is positive, with a technical target of 1.0530
24-HOUR VIEW: "Following the strong rise in EUR last Thursday, we pointed out on Friday that 'the rapid rise appears to be overdone.' However, we held the view that 'there is scope for EUR to test 1.0495.' We were also of the view that 'the major resistance at 1.0530 is unlikely to come under threat.' Our view was not wrong, as USD rose to 1.0514, easing off to close at 1.0491 (+0.26%). The combination of slowing momentum and overbought conditions suggests that instead of continuing to rise, EUR is more likely to consolidate within a 1.0455/1.0515 range today."
1-3 WEEKS VIEW: "Our update from last Friday (14 Feb, spot at 1.0460) remains valid. As highlighted, 'the outlook for EUR is positive, with a technical target of 1.0530.' To keep the momentum going, EUR must remain above 1.0400 (‘strong support’ level was at 1.0365 last Friday). Note that above 1.0530, there is another significant resistance level at 1.0560."
-
10:07
Silver Price Forecast: XAG/USD sticks to gains around $32.35 area, bullish bias remains
- Silver regains positive traction following an Asian session dip to sub-$32.00 levels.
- Acceptance above the 100-day SMA and positive oscillators favor bullish traders.
- Any corrective pullback could be seen as a buying opportunity and remain limited.
Silver (XAG/USD) attracts dip-buyers near the $31.90 region at the start of a new week and stalls its retracement slide from the highest level since October 30, around the $33.35-$33.40 area touched on Friday. The white metal sticks to positive bias through the first half of the European session and currently trades around the $32.35 zone, up nearly 0.50% for the day.
From a technical perspective, the recent breakout through the 100-day Simple Moving Average (SMA) and the emergence of fresh buying on Monday favor bullish traders. Moreover, positive oscillators on the daily chart suggest that the path of least resistance for the XAG/USD remains to the upside. That said, it will still be prudent to wait for some follow-through strength beyond the $32.55 horizontal barrier before positioning for any further gains.
The XAG/USD might then aim to conquer the $33.00 round figure and climb further towards retesting Friday's swing high, around the $33.35-$33.40 region. The momentum could extend further towards the $34.00 mark en route to the next relevant hurdle near the $34.45 zone and the $35.00 neighborhood, or the multi-year peak touched in October.
On the flip side, weakness below the Asian session low, around the $31.90 area, might still be seen as a buying opportunity and remain limited near the 100-day SMA, currently pegged near the $31.20 region. Some follow-through selling, leading to a slide below the $31.00 mark, might shift the near-term bias in favor of bearish traders and pave the way for deeper losses. The XAG/USD might then test the $30.25 support before eventually dropping to the $30.00 psychological mark en route to the $29.55-$29.50 horizontal zone.
Silver daily chart
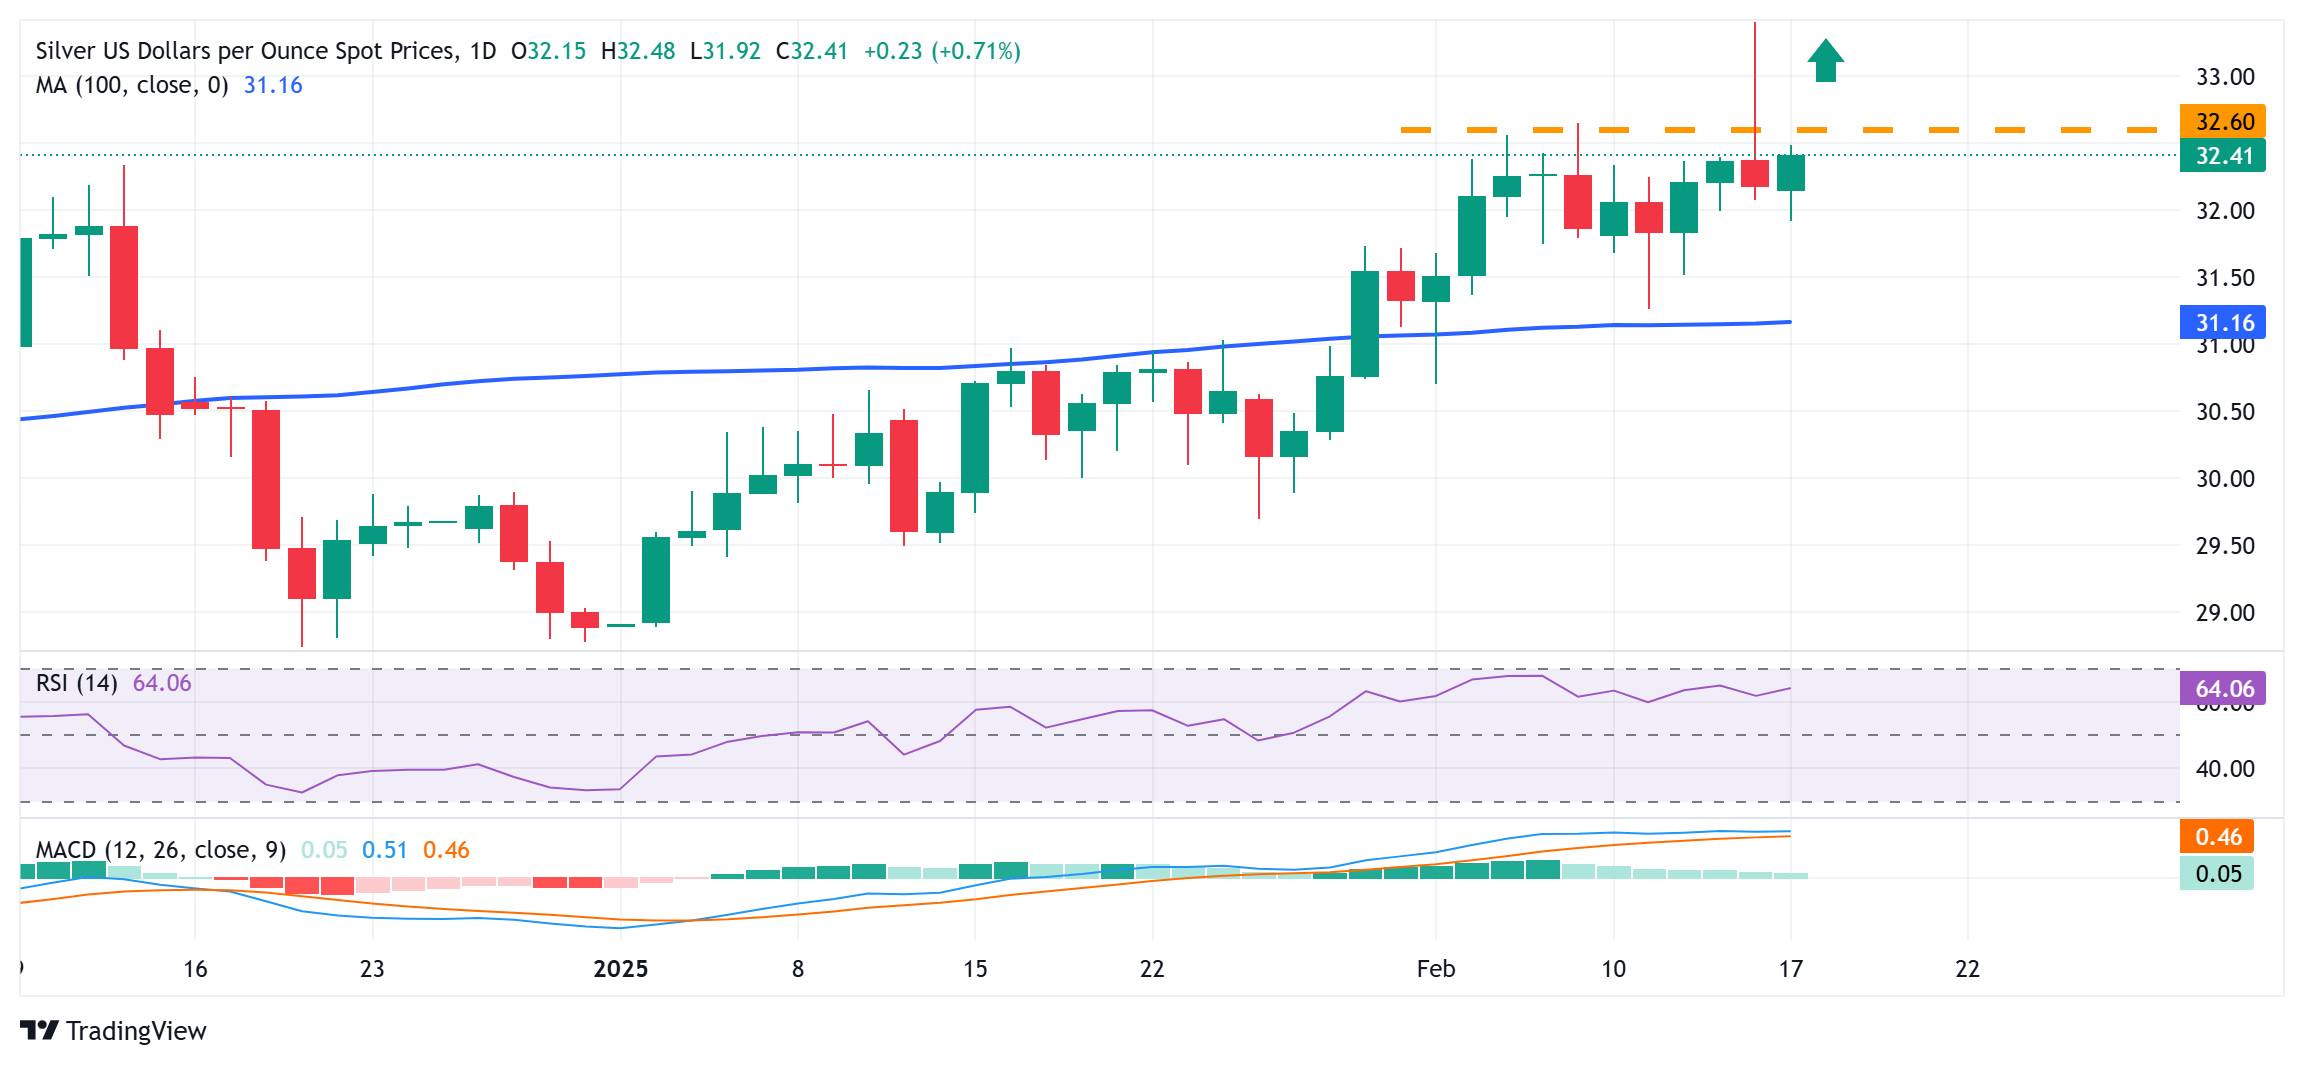
Silver FAQs
Silver is a precious metal highly traded among investors. It has been historically used as a store of value and a medium of exchange. Although less popular than Gold, traders may turn to Silver to diversify their investment portfolio, for its intrinsic value or as a potential hedge during high-inflation periods. Investors can buy physical Silver, in coins or in bars, or trade it through vehicles such as Exchange Traded Funds, which track its price on international markets.
Silver prices can move due to a wide range of factors. Geopolitical instability or fears of a deep recession can make Silver price escalate due to its safe-haven status, although to a lesser extent than Gold's. As a yieldless asset, Silver tends to rise with lower interest rates. Its moves also depend on how the US Dollar (USD) behaves as the asset is priced in dollars (XAG/USD). A strong Dollar tends to keep the price of Silver at bay, whereas a weaker Dollar is likely to propel prices up. Other factors such as investment demand, mining supply – Silver is much more abundant than Gold – and recycling rates can also affect prices.
Silver is widely used in industry, particularly in sectors such as electronics or solar energy, as it has one of the highest electric conductivity of all metals – more than Copper and Gold. A surge in demand can increase prices, while a decline tends to lower them. Dynamics in the US, Chinese and Indian economies can also contribute to price swings: for the US and particularly China, their big industrial sectors use Silver in various processes; in India, consumers’ demand for the precious metal for jewellery also plays a key role in setting prices.
Silver prices tend to follow Gold's moves. When Gold prices rise, Silver typically follows suit, as their status as safe-haven assets is similar. The Gold/Silver ratio, which shows the number of ounces of Silver needed to equal the value of one ounce of Gold, may help to determine the relative valuation between both metals. Some investors may consider a high ratio as an indicator that Silver is undervalued, or Gold is overvalued. On the contrary, a low ratio might suggest that Gold is undervalued relative to Silver.
-
10:05
India Trade Deficit Government climbed from previous $21.94B to $22.99B in January
-
10:02
Italy Trade Balance EU: €-1.861B (December) vs previous €-1.816B
-
10:01
Italy Global Trade Balance came in at €5.98B, above expectations (€4.35B) in December
-
09:57
US Dollar Index Price Forecast: Remains near 107.00, lower descending channel boundary
- The US Dollar Index may find key support near the descending channel’s lower boundary at 106.30.
- The 14-day RSI is below 50, signaling increasing bearish momentum.
- The primary resistance appears at the nine-day EMA at 107.47
The US Dollar Index (DXY) edges higher after registering losses in the previous two consecutive sessions, trading around 106.90 during the European hours on Monday. A review of the daily chart suggests a prevailing bearish bias as the index consolidates within the descending channel pattern.
However, the 14-day Relative Strength Index (RSI) is positioned below the 50 level, indicating a strengthening bearish momentum. Furthermore, the US Dollar Index remains positioned below the nine- and 14-day Exponential Moving Averages (EMAs), confirming the short-term price momentum is weaker.
On the downside, the DXY could approach the lower boundary of the descending channel at 106.30 level, followed by the psychological level of 106.00. A break below this level could reinforce the bearish bias and put downward pressure on the index to test the three-month low at 105.41, which was recorded on December 6.
Regarding resistance, the DXY could find its primary resistance at nine-day EMA at 107.47, followed by 107.66. A decisive break above these levels would improve the short-term price momentum and support the pair to explore the region around the descending channel’s upper boundary at 109.50 level, followed by the five-week high of 109.80, last tested on February 3.
US Dollar Index: Daily Chart
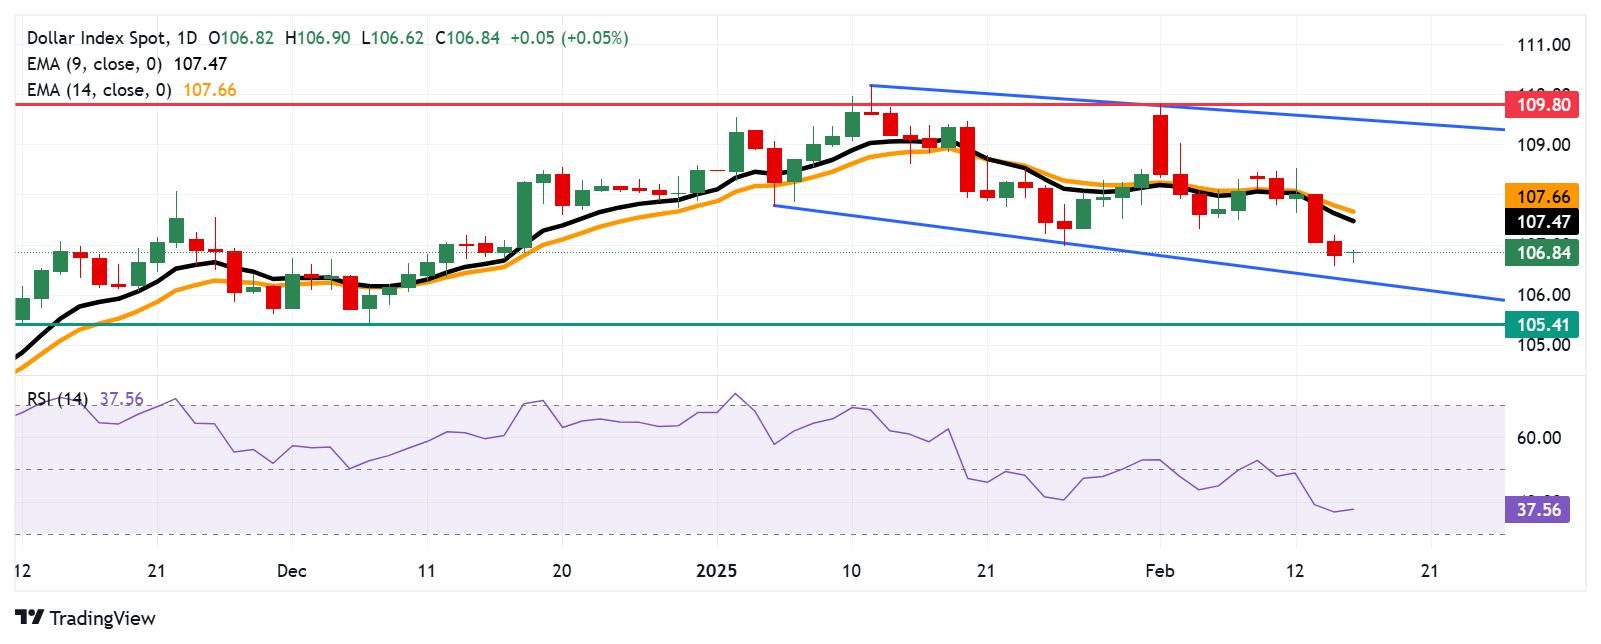
-
09:48
Pound Sterling steadies at the start of UK data-packed week
- The Pound Sterling steadies against its major peers on Monday amid uncertainty ahead of UK employment and inflation data.
- BoE Governor Bailey could hint at fresh cues about the monetary policy outlook in a speech on Tuesday.
- Fed’s Logan reiterates her view of maintaining caution on interest rate cuts.
The Pound Sterling (GBP) trades steady against its major peers at the start of the week as investors turn cautious ahead of the United Kingdom (UK) employment data for three months ending December, which will be released on Tuesday.
Investors will pay close attention to the UK labor market data to know whether business owners are still upset with Chancellor of the Exchequer Rachel Reeves’s announcement of raising employers’ contribution to National Insurance (NI). In the Autumn Budget, Reeves increased employers' social security contributions by 1.2% to 15%, which will come into effect from April.
Since the announcement, the private sector's hiring pace has sharply slowed, indicating dissatisfaction among business owners. In the three months ending November, the economy added 35K workers, significantly lower than the 173K addition seen in the August-October period.
The UK Office for National Statistics (ONS) is expected to show that the ILO Unemployment Rate accelerated to 4.5% in December from the former reading of 4.4%.
Market participants will also focus on the UK Average Earnings data, which is a key measure of wage growth that has been a major contributor to high inflation in the service sector. Average Earnings (Including and Excluding bonuses) are expected to accelerate at a robust pace to 5.9% compared to the prior release of 5.6%. Hot wage growth measures would boost fears of price pressures remaining stubborn. In February's monetary policy statement, the Bank of England (BoE) stated that inflationary pressures could accelerate before resuming its journey to the 2% target due to higher energy prices.
Therefore, soft employment conditions and high inflation expectations due to strong wage growth could stem the risks of stagflation.
Along with the employment data, investors await BoE Governor Andrew Bailey’s speech, which is also scheduled for Tuesday.
Later this week, investors will also focus on the UK Consumer Price Index (CPI) and Retail Sales data for January, which will be released on Wednesday and Friday, respectively.
Daily digest market movers: Pound Sterling is broadly sideways against US Dollar
- The Pound Sterling ticks higher to near 1.2600 against the US Dollar (USD) in Monday’s European session. The GBP/USD pair is broadly sideways while the US Dollar Index (DXY) struggles to hold the immediate support of 106.70, which is over a two-month low.
- The US Dollar remains on the back foot amid an improvement in market mood. Last week, market sentiment became favorable for risky assets due to a delay in United States (US) President Donald Trump's imposition of reciprocal tariffs, which is unlikely to come into effect before April 1. This scenario diminished fears of an immediate global trade war, as investors anticipated President Trump would announce reciprocal levies on Thursday.
- Last week, the US CPI and the Producer Price Index (PPI) data for January came in hotter than expected. Dallas Federal Reserve Bank President Lorie Logan reiterated on Friday that the central bank should remain cautious on interest rates. "I think we're in a good position right now to watch the data over the coming months and taking our time to really go look at the data and see how these potential changes are to evolve," Logan said. She also added that the central bank is also keeping an eye on the geopolitics and economic policies of President Donald Trump.
Technical Analysis: Pound Sterling oscillates inside Friday’s range
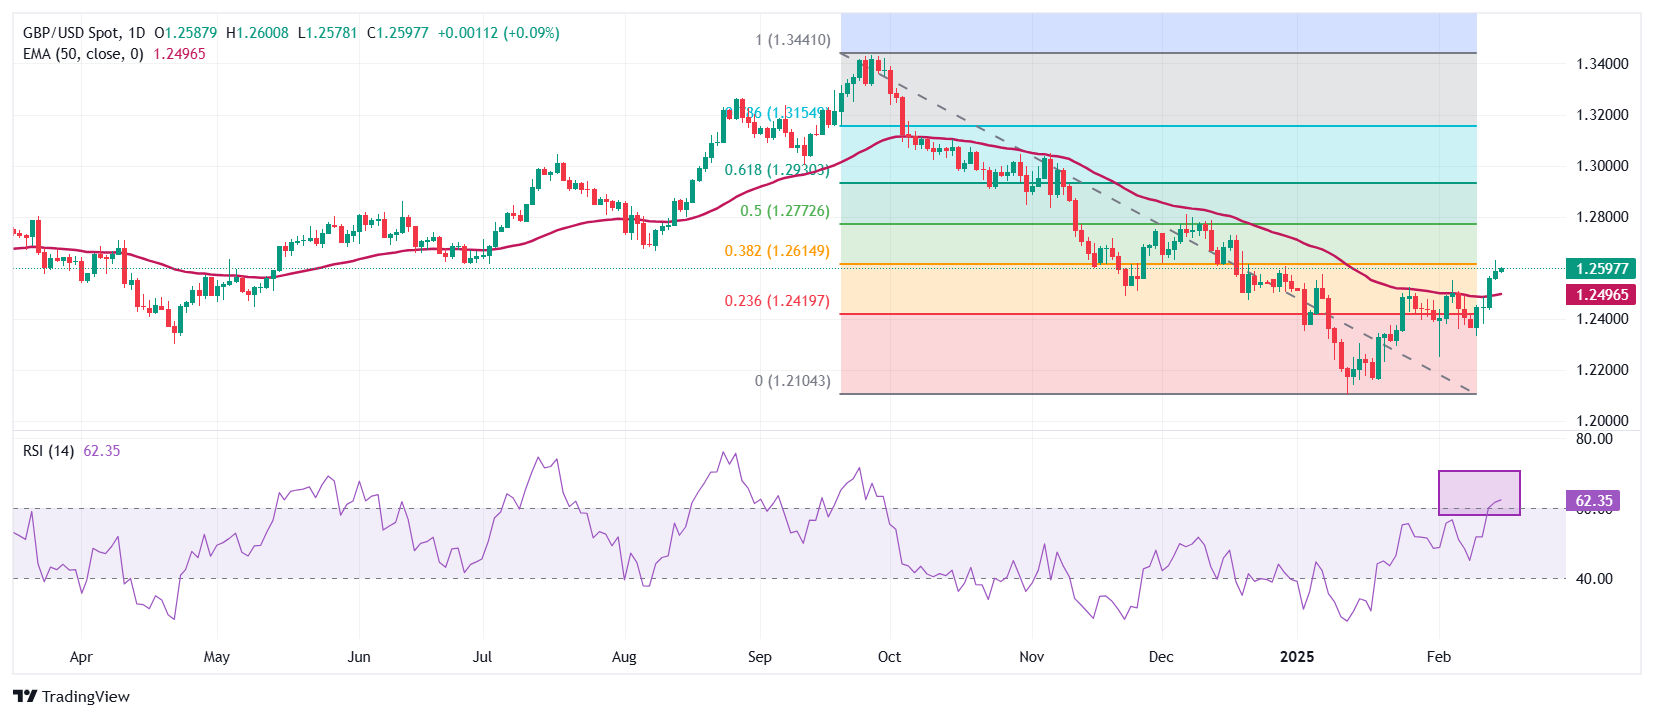
The Pound Sterling trades inside Friday’s trading range but aims to break decisively above the 38.2% Fibonacci retracement around 1.2620. The near-term outlook of the GBP/USD pair has turned bullish as it holds above the 50-day Exponential Moving Average (EMA), which stands at around 1.2500.
The 14-day Relative Strength Index (RSI) advances above 60.00. A bullish momentum would activate if the RSI (14) sustains above that level.
Looking down, the February 3 low of 1.2250 will act as a key support zone for the pair. On the upside, the 50% Fibonacci retracement at 1.2767 will act as a key resistance zone.
Pound Sterling FAQs
The Pound Sterling (GBP) is the oldest currency in the world (886 AD) and the official currency of the United Kingdom. It is the fourth most traded unit for foreign exchange (FX) in the world, accounting for 12% of all transactions, averaging $630 billion a day, according to 2022 data. Its key trading pairs are GBP/USD, also known as ‘Cable’, which accounts for 11% of FX, GBP/JPY, or the ‘Dragon’ as it is known by traders (3%), and EUR/GBP (2%). The Pound Sterling is issued by the Bank of England (BoE).
The single most important factor influencing the value of the Pound Sterling is monetary policy decided by the Bank of England. The BoE bases its decisions on whether it has achieved its primary goal of “price stability” – a steady inflation rate of around 2%. Its primary tool for achieving this is the adjustment of interest rates. When inflation is too high, the BoE will try to rein it in by raising interest rates, making it more expensive for people and businesses to access credit. This is generally positive for GBP, as higher interest rates make the UK a more attractive place for global investors to park their money. When inflation falls too low it is a sign economic growth is slowing. In this scenario, the BoE will consider lowering interest rates to cheapen credit so businesses will borrow more to invest in growth-generating projects.
Data releases gauge the health of the economy and can impact the value of the Pound Sterling. Indicators such as GDP, Manufacturing and Services PMIs, and employment can all influence the direction of the GBP. A strong economy is good for Sterling. Not only does it attract more foreign investment but it may encourage the BoE to put up interest rates, which will directly strengthen GBP. Otherwise, if economic data is weak, the Pound Sterling is likely to fall.
Another significant data release for the Pound Sterling is the Trade Balance. This indicator measures the difference between what a country earns from its exports and what it spends on imports over a given period. If a country produces highly sought-after exports, its currency will benefit purely from the extra demand created from foreign buyers seeking to purchase these goods. Therefore, a positive net Trade Balance strengthens a currency and vice versa for a negative balance.
-
09:01
Turkey Budget Balance increased to -139.26B in January from previous -829.2B
-
08:55
Forex Today: US Dollar consolidates losses, markets await comments from Fed officials
Here is what you need to know on Monday, February 17:
Major currency pairs trade near the previous week's closing levels on Monday as trading conditions remain thin, with financial markets in the US remaining closed in observance of the Presidents' Day holiday. The economic calendar will not offer any high-tier data releases but investors will pay close attention to comments from Federal Reserve (Fed) officials later in the day.
US Dollar PRICE Last 7 days
The table below shows the percentage change of US Dollar (USD) against listed major currencies last 7 days. US Dollar was the weakest against the British Pound.
USD EUR GBP JPY CAD AUD NZD CHF USD -1.50% -1.55% 0.38% -0.74% -1.38% -1.24% -1.00% EUR 1.50% 0.02% 2.02% 0.89% 0.12% 0.35% 0.60% GBP 1.55% -0.02% 1.84% 0.84% 0.10% 0.29% 0.56% JPY -0.38% -2.02% -1.84% -1.16% -1.69% -1.63% -1.37% CAD 0.74% -0.89% -0.84% 1.16% -0.62% -0.54% -0.30% AUD 1.38% -0.12% -0.10% 1.69% 0.62% 0.23% 0.47% NZD 1.24% -0.35% -0.29% 1.63% 0.54% -0.23% 0.24% CHF 1.00% -0.60% -0.56% 1.37% 0.30% -0.47% -0.24% The heat map shows percentage changes of major currencies against each other. The base currency is picked from the left column, while the quote currency is picked from the top row. For example, if you pick the US Dollar from the left column and move along the horizontal line to the Japanese Yen, the percentage change displayed in the box will represent USD (base)/JPY (quote).
The data published by the US Census Bureau announced on Friday that Retail Sales declined by 0.9% on a monthly basis in January, coming in worse than the market expectation for a decline of 0.1%. The US Dollar (USD) Index struggled to gain traction heading into the weekend and lost more than 1% on a weekly basis. In the European morning on Monday, the USD Index stays virtually unchanged on the day, slightly below 107.00.
During the Asian trading hours on Monday, the data from Japan showed that Industrial Production contracted by 0.2% in December, following the 0.3% growth recorded in November. Meanwhile, Japanese Chief Cabinet Secretary Yoshimasa Hayashi said that Japan faces significant challenges if its companies become targets amid US President Donald Trump's policies. He added that the government will respond carefully to potential impacts. USD/JPY stays under modest bearish pressure to start the new week and trades below 152.00.
EUR/USD benefited from the broad-based selling pressure surrounding the USD and rose more than 1.5% in the previous week. The pair moves sideways in a tight range below 1.0500 in the European morning on Monday.
GBP/USD reached its strongest level since December 19 at 1.2630 on Friday but erased a portion of its daily gains in the second half of the day. Nevertheless, the pair rose 1.5% and closed the second consecutive week in the positive territory. In the early European session, GBP/USD stays quiet at around 1.2600.
The Reserve Bank of Australia (RBA) will announce monetary policy decisions in the early Asian session on Tuesday. Investors expect the RBA to lower the policy rate by 25 basis points (bps) to 4.1% from 4.35%. AUD/USD holds its ground early Monday and trades at its highest level since mid-December above 0.6350.
Gold corrected sharply lower on Friday and lost more than 1.5% on the day. XAU/USD regains its traction on Monday and trades modestly higher on the day near $2,890.
US Dollar FAQs
The US Dollar (USD) is the official currency of the United States of America, and the ‘de facto’ currency of a significant number of other countries where it is found in circulation alongside local notes. It is the most heavily traded currency in the world, accounting for over 88% of all global foreign exchange turnover, or an average of $6.6 trillion in transactions per day, according to data from 2022. Following the second world war, the USD took over from the British Pound as the world’s reserve currency. For most of its history, the US Dollar was backed by Gold, until the Bretton Woods Agreement in 1971 when the Gold Standard went away.
The most important single factor impacting on the value of the US Dollar is monetary policy, which is shaped by the Federal Reserve (Fed). The Fed has two mandates: to achieve price stability (control inflation) and foster full employment. Its primary tool to achieve these two goals is by adjusting interest rates. When prices are rising too quickly and inflation is above the Fed’s 2% target, the Fed will raise rates, which helps the USD value. When inflation falls below 2% or the Unemployment Rate is too high, the Fed may lower interest rates, which weighs on the Greenback.
In extreme situations, the Federal Reserve can also print more Dollars and enact quantitative easing (QE). QE is the process by which the Fed substantially increases the flow of credit in a stuck financial system. It is a non-standard policy measure used when credit has dried up because banks will not lend to each other (out of the fear of counterparty default). It is a last resort when simply lowering interest rates is unlikely to achieve the necessary result. It was the Fed’s weapon of choice to combat the credit crunch that occurred during the Great Financial Crisis in 2008. It involves the Fed printing more Dollars and using them to buy US government bonds predominantly from financial institutions. QE usually leads to a weaker US Dollar.
Quantitative tightening (QT) is the reverse process whereby the Federal Reserve stops buying bonds from financial institutions and does not reinvest the principal from the bonds it holds maturing in new purchases. It is usually positive for the US Dollar.
-
08:52
GBP/JPY Price Analysis: Finds support around nine-day EMA at 191.00
- GBP/JPY tests immediate support at the nine-day EMA at 191.00.
- The 14-day RSI falls below 50, signaling increasing bearish momentum.
- The currency cross could test immediate resistance at the 14-day EMA at 191.17.
GBP/JPY continues its losing streak for the third consecutive session, trading around 191.00 during the European hours on Monday. An analysis of the daily chart showed the pair remains within the descending channel pattern, indicating a prevailing bearish bias.
Additionally, the 14-day Relative Strength Index (RSI), a key momentum indicator, falls below the 50 level, strengthening the bearish momentum. However, the GBP/JPY cross trades around the nine- and 14-day Exponential Moving Averages (EMAs), suggesting short-term price momentum is neutral.
Regarding its support, the nine-day EMA at the 191.00 level acts as immediate support for the GBP/JPy cross. A break below this level could weaken the short-term price momentum and lead the currency cross to navigate the region around a five-month low at 187.05, which was recorded on February 7, followed by the lower boundary of the descending channel around the psychological level of 186.00.
On the upside, the GBP/JPY cross could test immediate resistance at the 14-day EMA at 191.17. A break above these levels could weaken the bearish bias and support the pair to test the descending channel’s upper boundary at the 192.50 level.
GBP/JPY: Daily Chart
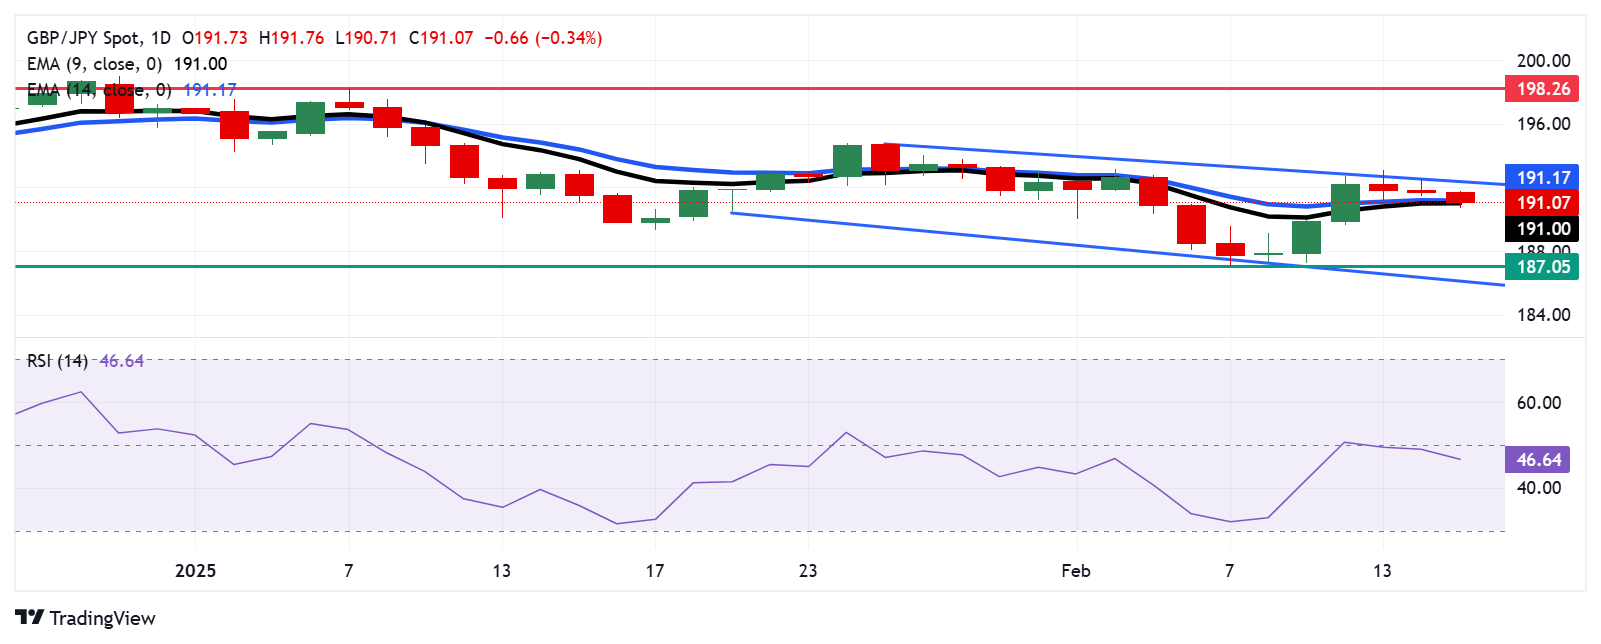
British Pound PRICE Today
The table below shows the percentage change of British Pound (GBP) against listed major currencies today. British Pound was the weakest against the Japanese Yen.
USD EUR GBP JPY CAD AUD NZD CHF USD 0.08% -0.04% -0.24% 0.03% -0.18% -0.23% 0.09% EUR -0.08% 0.03% -0.37% 0.05% -0.17% -0.21% 0.12% GBP 0.04% -0.03% -0.29% 0.02% -0.15% -0.24% 0.08% JPY 0.24% 0.37% 0.29% 0.28% 0.10% 0.22% 0.32% CAD -0.03% -0.05% -0.02% -0.28% -0.18% -0.26% 0.07% AUD 0.18% 0.17% 0.15% -0.10% 0.18% -0.04% 0.29% NZD 0.23% 0.21% 0.24% -0.22% 0.26% 0.04% 0.32% CHF -0.09% -0.12% -0.08% -0.32% -0.07% -0.29% -0.32% The heat map shows percentage changes of major currencies against each other. The base currency is picked from the left column, while the quote currency is picked from the top row. For example, if you pick the British Pound from the left column and move along the horizontal line to the US Dollar, the percentage change displayed in the box will represent GBP (base)/USD (quote).
-
08:19
Crude Oil price today: WTI price bullish, according to FXStreet data
West Texas Intermediate (WTI) Oil price advances on Monday, according to FXStreet data. WTI trades at $70.75 per barrel, up from Friday’s close at $70.70.
Brent Oil Exchange Rate (Brent crude) is also up, advancing from the $74.54 price posted on Friday, and trading at $74.60.
WTI Oil FAQs
WTI Oil is a type of Crude Oil sold on international markets. The WTI stands for West Texas Intermediate, one of three major types including Brent and Dubai Crude. WTI is also referred to as “light” and “sweet” because of its relatively low gravity and sulfur content respectively. It is considered a high quality Oil that is easily refined. It is sourced in the United States and distributed via the Cushing hub, which is considered “The Pipeline Crossroads of the World”. It is a benchmark for the Oil market and WTI price is frequently quoted in the media.
Like all assets, supply and demand are the key drivers of WTI Oil price. As such, global growth can be a driver of increased demand and vice versa for weak global growth. Political instability, wars, and sanctions can disrupt supply and impact prices. The decisions of OPEC, a group of major Oil-producing countries, is another key driver of price. The value of the US Dollar influences the price of WTI Crude Oil, since Oil is predominantly traded in US Dollars, thus a weaker US Dollar can make Oil more affordable and vice versa.
The weekly Oil inventory reports published by the American Petroleum Institute (API) and the Energy Information Agency (EIA) impact the price of WTI Oil. Changes in inventories reflect fluctuating supply and demand. If the data shows a drop in inventories it can indicate increased demand, pushing up Oil price. Higher inventories can reflect increased supply, pushing down prices. API’s report is published every Tuesday and EIA’s the day after. Their results are usually similar, falling within 1% of each other 75% of the time. The EIA data is considered more reliable, since it is a government agency.
OPEC (Organization of the Petroleum Exporting Countries) is a group of 12 Oil-producing nations who collectively decide production quotas for member countries at twice-yearly meetings. Their decisions often impact WTI Oil prices. When OPEC decides to lower quotas, it can tighten supply, pushing up Oil prices. When OPEC increases production, it has the opposite effect. OPEC+ refers to an expanded group that includes ten extra non-OPEC members, the most notable of which is Russia.
(An automation tool was used in creating this post.)
-
08:11
NZD/USD rises to near 0.5750 following postponement of Trump's reciprocal tariffs
- NZD/USD appreciates as market sentiment improves following the postponement of Trump’s reciprocal tariffs.
- Weaker US Retail Sales data has intensified speculation that the Fed may lower interest rates only later in the year.
- The RBNZ is widely anticipated to lower its interest rates by 50 basis points to 3.75% on Wednesday.
NZD/USD extends its winning streak for the third successive day, trading around 0.5740 during the early European hours on Monday. Liquidity during the North American session may remain thin as all major US financial markets will be closed on Monday for the federal holiday, Presidents' Day.
This upside of the NZD/USD pair is attributed to improved market sentiment, supported by US President Donald Trump's decision to delay the implementation of reciprocal tariffs. Additionally, the US Dollar (USD) weakens as a disappointing US retail sales report has reignited speculation that the Federal Reserve (Fed) may cut interest rates later this year, despite ongoing inflation concerns.
Data from the US Census Bureau on Friday showed that US Retail Sales fell by 0.9% in January, following a revised 0.7% increase in December (previously reported as 0.4%). This decline was sharper than the market’s expectation of a 0.1% drop.
The US Dollar Index (DXY), which tracks the US Dollar's performance against six major currencies, remains under pressure for the third consecutive session due to weaker US Treasury yields. As of writing, the DXY hovers around 106.70, while yields on 2-year and 10-year US Treasury bonds stand at 4.26% and 4.47%, respectively.
The Reserve Bank of New Zealand (RBNZ) is scheduled to meet on Wednesday and is expected to lower interest rates by 50 basis points to 3.75%. The central bank is also likely to signal a more gradual pace of further reductions, aiming for a rate of 3.0% or 3.25% by the end of the year. Meanwhile, the Business NZ Performance of Services Index (PSI) increased to 50.4 in January, up from a revised 48.1 in December, marking a return to a slight expansion in the services sector after ten months of contraction.
New Zealand Dollar FAQs
The New Zealand Dollar (NZD), also known as the Kiwi, is a well-known traded currency among investors. Its value is broadly determined by the health of the New Zealand economy and the country’s central bank policy. Still, there are some unique particularities that also can make NZD move. The performance of the Chinese economy tends to move the Kiwi because China is New Zealand’s biggest trading partner. Bad news for the Chinese economy likely means less New Zealand exports to the country, hitting the economy and thus its currency. Another factor moving NZD is dairy prices as the dairy industry is New Zealand’s main export. High dairy prices boost export income, contributing positively to the economy and thus to the NZD.
The Reserve Bank of New Zealand (RBNZ) aims to achieve and maintain an inflation rate between 1% and 3% over the medium term, with a focus to keep it near the 2% mid-point. To this end, the bank sets an appropriate level of interest rates. When inflation is too high, the RBNZ will increase interest rates to cool the economy, but the move will also make bond yields higher, increasing investors’ appeal to invest in the country and thus boosting NZD. On the contrary, lower interest rates tend to weaken NZD. The so-called rate differential, or how rates in New Zealand are or are expected to be compared to the ones set by the US Federal Reserve, can also play a key role in moving the NZD/USD pair.
Macroeconomic data releases in New Zealand are key to assess the state of the economy and can impact the New Zealand Dollar’s (NZD) valuation. A strong economy, based on high economic growth, low unemployment and high confidence is good for NZD. High economic growth attracts foreign investment and may encourage the Reserve Bank of New Zealand to increase interest rates, if this economic strength comes together with elevated inflation. Conversely, if economic data is weak, NZD is likely to depreciate.
The New Zealand Dollar (NZD) tends to strengthen during risk-on periods, or when investors perceive that broader market risks are low and are optimistic about growth. This tends to lead to a more favorable outlook for commodities and so-called ‘commodity currencies’ such as the Kiwi. Conversely, NZD tends to weaken at times of market turbulence or economic uncertainty as investors tend to sell higher-risk assets and flee to the more-stable safe havens.
-
08:05
USD/CAD remains capped below 1.4200, investors brace for Canadian CPI release
- USD/CAD struggles to gain ground near 1.4175 in Monday’s early Asian session.
- US tariff delays and weaker US Retail Sales data exert some selling pressure on the USD.
- Lower crude oil prices might weigh on the commodity-linked Loonie and create a tailwind for USD/CAD.
The USD/CAD pair remains on the defensive around 1.4175 on Monday during the early European session. The US Dollar (USD) weakens due to the delay in the US President Donald Trump administration's tariff plans and the disappointing US January Retail Sales data. Investors will closely monitor the Canadian Consumer Price Index (CPI) inflation data for January, which is due later on Tuesday.
The weaker-than-expected US Retail Sales undermine the US Dollar (USD) broadly. The downtick in the statistic is likely weighted down by frigid temperatures, wildfires and motor vehicle shortages, suggesting a sharp slowdown in economic growth early in the first quarter.
Additionally, US President Donald Trump approved a proposal for reciprocal tariffs on Thursday but delayed their implementation as his administration conducts one-on-one negotiations with nations that could be impacted. This, in turn, contributes to the USD’s downside. Nonetheless, the rising expectation that the US Federal Reserve (Fed) would stick to its hawkish stance amid elevated inflation might act as a tailwind for the pair.
The decline in crude oil prices to a nearly two-month low amid hopes for a peace deal between Russia and Ukraine might drag the commodity-linked Canadian Dollar (CAD) lower against the Greenback. It's worth noting that Canada is the largest oil exporter to the United States (US), and lower crude oil prices tend to have a negative impact on the CAD value.Canadian Dollar FAQs
The key factors driving the Canadian Dollar (CAD) are the level of interest rates set by the Bank of Canada (BoC), the price of Oil, Canada’s largest export, the health of its economy, inflation and the Trade Balance, which is the difference between the value of Canada’s exports versus its imports. Other factors include market sentiment – whether investors are taking on more risky assets (risk-on) or seeking safe-havens (risk-off) – with risk-on being CAD-positive. As its largest trading partner, the health of the US economy is also a key factor influencing the Canadian Dollar.
The Bank of Canada (BoC) has a significant influence on the Canadian Dollar by setting the level of interest rates that banks can lend to one another. This influences the level of interest rates for everyone. The main goal of the BoC is to maintain inflation at 1-3% by adjusting interest rates up or down. Relatively higher interest rates tend to be positive for the CAD. The Bank of Canada can also use quantitative easing and tightening to influence credit conditions, with the former CAD-negative and the latter CAD-positive.
The price of Oil is a key factor impacting the value of the Canadian Dollar. Petroleum is Canada’s biggest export, so Oil price tends to have an immediate impact on the CAD value. Generally, if Oil price rises CAD also goes up, as aggregate demand for the currency increases. The opposite is the case if the price of Oil falls. Higher Oil prices also tend to result in a greater likelihood of a positive Trade Balance, which is also supportive of the CAD.
While inflation had always traditionally been thought of as a negative factor for a currency since it lowers the value of money, the opposite has actually been the case in modern times with the relaxation of cross-border capital controls. Higher inflation tends to lead central banks to put up interest rates which attracts more capital inflows from global investors seeking a lucrative place to keep their money. This increases demand for the local currency, which in Canada’s case is the Canadian Dollar.
Macroeconomic data releases gauge the health of the economy and can have an impact on the Canadian Dollar. Indicators such as GDP, Manufacturing and Services PMIs, employment, and consumer sentiment surveys can all influence the direction of the CAD. A strong economy is good for the Canadian Dollar. Not only does it attract more foreign investment but it may encourage the Bank of Canada to put up interest rates, leading to a stronger currency. If economic data is weak, however, the CAD is likely to fall.
-
06:48
FX option expiries for Feb 17 NY cut
FX option expiries for Feb 17 NY cut at 10:00 Eastern Time via DTCC can be found below.
EUR/USD: EUR amounts
- 1.0300 466m
- 1.0500 4.7b
- 1.0525 538m
- 1.0530 480m
GBP/USD: GBP amounts
- 1.2450 503m
USD/JPY: USD amounts
- 148.20 986m
- 152.00 680m
- 152.05 660m
- 152.20 710m
USD/CHF: USD amounts
- 0.9000 502m
AUD/USD: AUD amounts
- 1.4285 559m
USD/CAD: USD amounts
- 0.6300 495m
-
06:35
USD/CHF extends downside below 0.9000 as US Retail Sales drop by most in two years
- USD/CHF edges lower to around 0.8990 in Monday’s early Asian session.
- The weaker US Retail Sales undermine the US Dollar.
- The uncertainty and geopolitical risks might boost the safe-haven flows, benefiting the Swiss Franc.
The USD/CHF pair extends its decline to around 0.8990 during the early European session, pressured by the weaker US Dollar (USD). The Federal Reserve (Fed) Patrick Harker and Michelle Bowman are set to speak later on Monday. On Tuesday, the Swiss Industrial Production will be released.
US Retail Sales dropped by the most in nearly two years in January, weighing on the Greenback. Data released by the US Census Bureau on Friday showed that US Retail Sales dropped by 0.9% in January versus a 0.7% increase (revised from 0.4%) prior This figure came in weaker than the estimation for a decrease of 0.1%. Traders raised bets that the Fed would cut interest rates again as soon as June.
Meanwhile, US Industrial Production rose by 0.5% MoM in January, compared to 1.0% (revised from 0.9%) in December. This reading came in better than the estimation of a 0.3% rise.
Trump administration officials are preparing to meet with Russian officials on Tuesday in Saudi Arabia to discuss a possible agreement on ending the war in Ukraine. If talks between U.S. and Russian officials improve the odds of a peace deal being reached that ends the war, safe-haven buying demand may diminish. However, the uncertainty and geopolitical concerns are likely to boost the Swiss Franc (CHF).Swiss Franc FAQs
The Swiss Franc (CHF) is Switzerland’s official currency. It is among the top ten most traded currencies globally, reaching volumes that well exceed the size of the Swiss economy. Its value is determined by the broad market sentiment, the country’s economic health or action taken by the Swiss National Bank (SNB), among other factors. Between 2011 and 2015, the Swiss Franc was pegged to the Euro (EUR). The peg was abruptly removed, resulting in a more than 20% increase in the Franc’s value, causing a turmoil in markets. Even though the peg isn’t in force anymore, CHF fortunes tend to be highly correlated with the Euro ones due to the high dependency of the Swiss economy on the neighboring Eurozone.
The Swiss Franc (CHF) is considered a safe-haven asset, or a currency that investors tend to buy in times of market stress. This is due to the perceived status of Switzerland in the world: a stable economy, a strong export sector, big central bank reserves or a longstanding political stance towards neutrality in global conflicts make the country’s currency a good choice for investors fleeing from risks. Turbulent times are likely to strengthen CHF value against other currencies that are seen as more risky to invest in.
The Swiss National Bank (SNB) meets four times a year – once every quarter, less than other major central banks – to decide on monetary policy. The bank aims for an annual inflation rate of less than 2%. When inflation is above target or forecasted to be above target in the foreseeable future, the bank will attempt to tame price growth by raising its policy rate. Higher interest rates are generally positive for the Swiss Franc (CHF) as they lead to higher yields, making the country a more attractive place for investors. On the contrary, lower interest rates tend to weaken CHF.
Macroeconomic data releases in Switzerland are key to assessing the state of the economy and can impact the Swiss Franc’s (CHF) valuation. The Swiss economy is broadly stable, but any sudden change in economic growth, inflation, current account or the central bank’s currency reserves have the potential to trigger moves in CHF. Generally, high economic growth, low unemployment and high confidence are good for CHF. Conversely, if economic data points to weakening momentum, CHF is likely to depreciate.
As a small and open economy, Switzerland is heavily dependent on the health of the neighboring Eurozone economies. The broader European Union is Switzerland’s main economic partner and a key political ally, so macroeconomic and monetary policy stability in the Eurozone is essential for Switzerland and, thus, for the Swiss Franc (CHF). With such dependency, some models suggest that the correlation between the fortunes of the Euro (EUR) and the CHF is more than 90%, or close to perfect.
-
06:22
EUR/USD Price Forecast: Stuck in a range near multi-week high, below 1.0500 mark
- EUR/USD consolidates last week’s strong gains to a nearly three-week high.
- The technical setup favors bulls and supports prospects for additional gains.
- Weakness below the 1.0465 support could pave the way for deeper losses.
The EUR/USD pair struggles to capitalize on its gains registered over the past four days and oscillates in a narrow trading band, just below the 1.0500 psychological mark during the Asian session on Monday. Spot prices, however, remain close to a nearly three-week high touched on Friday amid a weaker US Dollar (USD).
From a technical perspective, acceptance above the 38.2% Fibonacci retracement level of the November-January fall and positive oscillators on the daily chart favor bullish traders. Hence, a subsequent strength towards testing the 1.0545-1.0555 confluence, comprising the 50% retracement level and the 100-day Exponential Moving Average (EMA), looks like a distinct possibility.
Some follow-through buying should pave the way for additional gains and assist the EUR/USD pair to reclaim the 1.0600 mark. Spot prices might then climb to the December 2024 swing high, around the 1.0630 area, which nears the 61.8% Fibo. level. A sustained strength beyond will set the stage for an extension of the recent recovery from over a two-year low touched in January.
On the flip side, the 38.2% Fibo. level, around the 1.0465 region, now seems to protect the immediate downside. A convincing break below could drag the EUR/USD pair towards the 1.0400 round figure en route to mid-1.0300s (23.6% Fibo. level). Failure to defend the said support levels might shift the bias back in favor of bearish traders and expose the 1.0200 round-figure mark.
EUR/USD daily chart
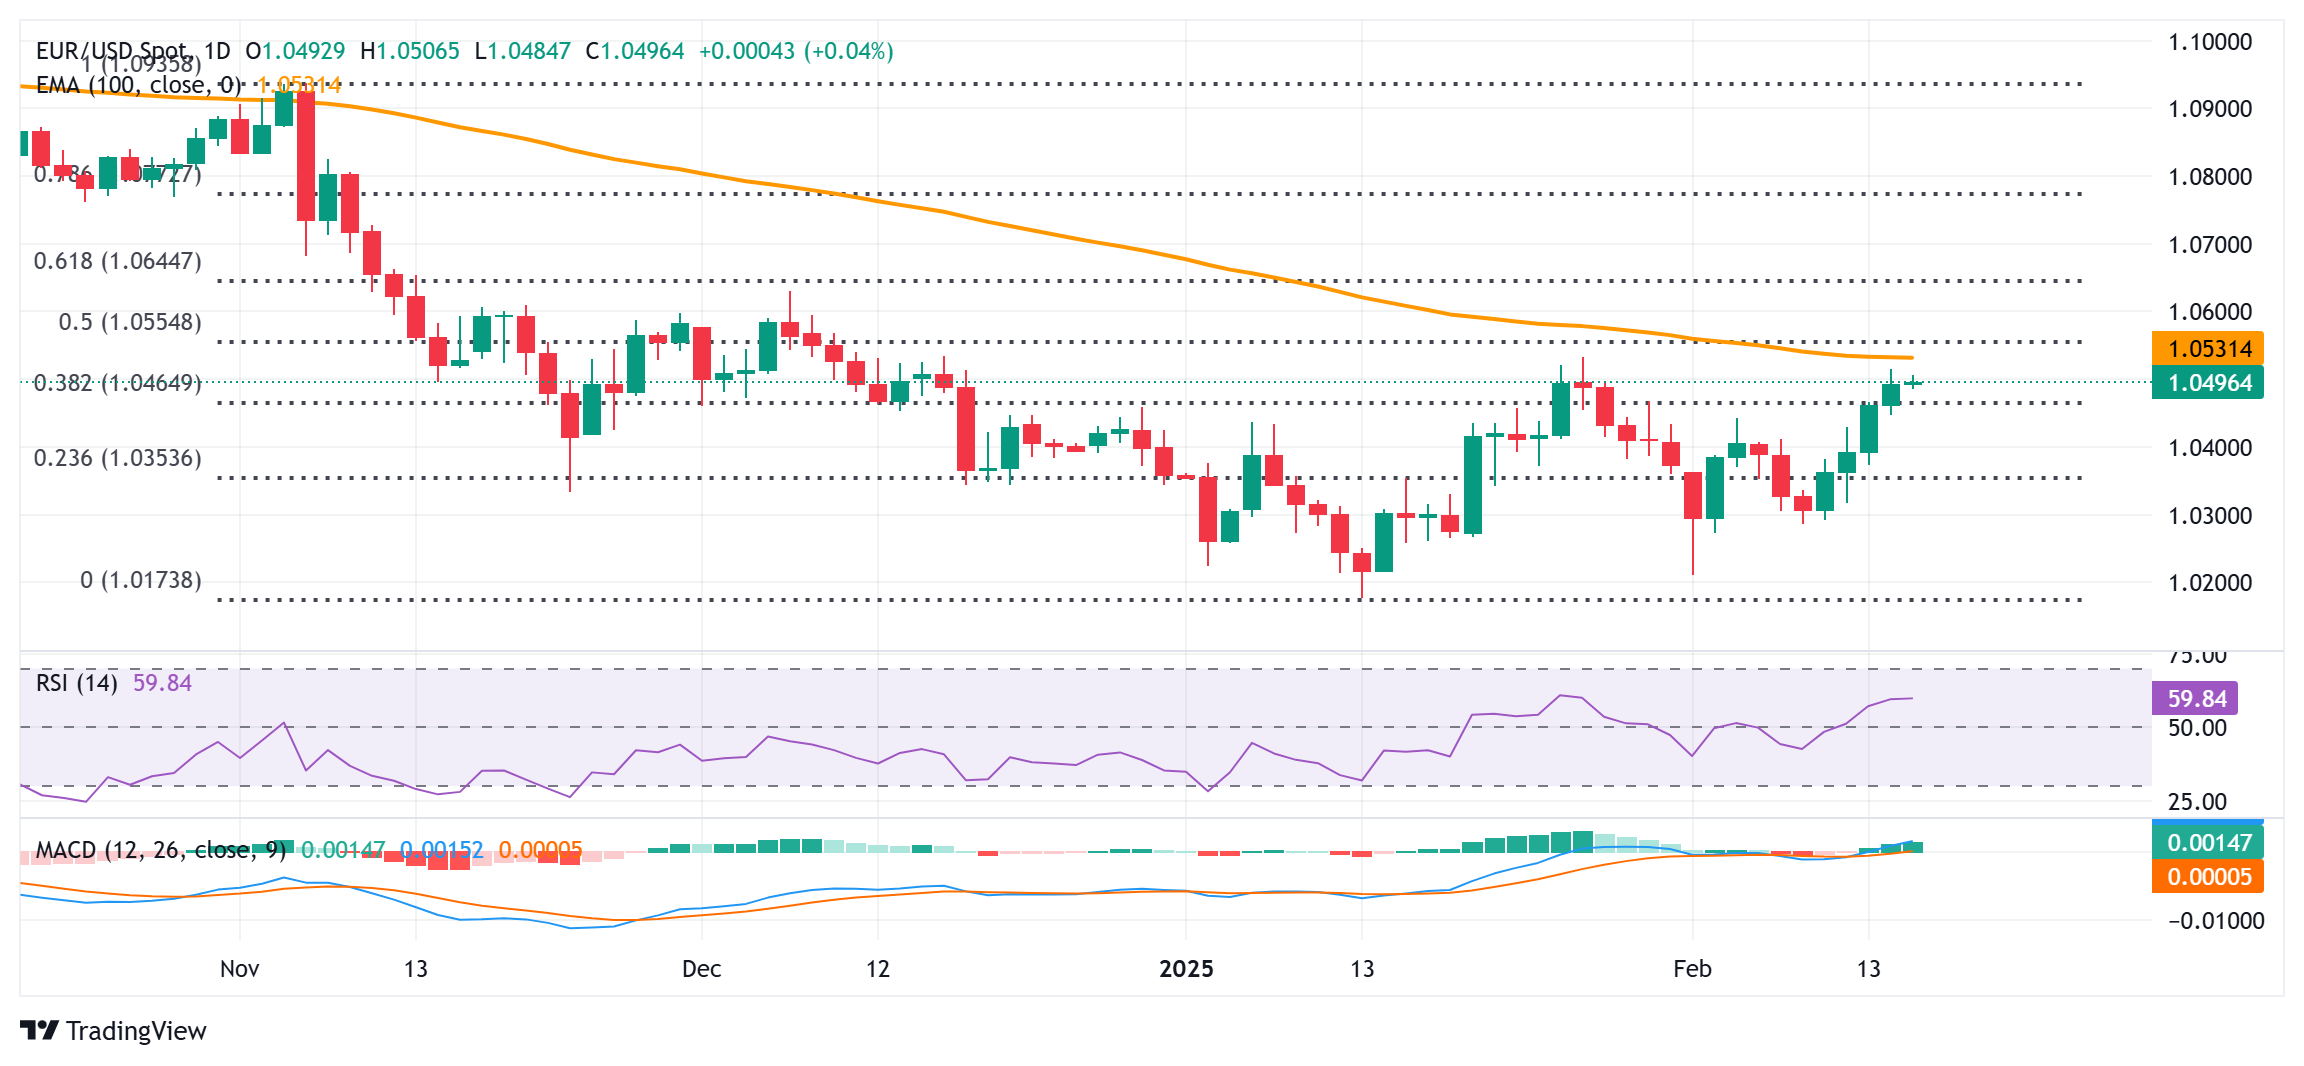
Euro FAQs
The Euro is the currency for the 19 European Union countries that belong to the Eurozone. It is the second most heavily traded currency in the world behind the US Dollar. In 2022, it accounted for 31% of all foreign exchange transactions, with an average daily turnover of over $2.2 trillion a day. EUR/USD is the most heavily traded currency pair in the world, accounting for an estimated 30% off all transactions, followed by EUR/JPY (4%), EUR/GBP (3%) and EUR/AUD (2%).
The European Central Bank (ECB) in Frankfurt, Germany, is the reserve bank for the Eurozone. The ECB sets interest rates and manages monetary policy. The ECB’s primary mandate is to maintain price stability, which means either controlling inflation or stimulating growth. Its primary tool is the raising or lowering of interest rates. Relatively high interest rates – or the expectation of higher rates – will usually benefit the Euro and vice versa. The ECB Governing Council makes monetary policy decisions at meetings held eight times a year. Decisions are made by heads of the Eurozone national banks and six permanent members, including the President of the ECB, Christine Lagarde.
Eurozone inflation data, measured by the Harmonized Index of Consumer Prices (HICP), is an important econometric for the Euro. If inflation rises more than expected, especially if above the ECB’s 2% target, it obliges the ECB to raise interest rates to bring it back under control. Relatively high interest rates compared to its counterparts will usually benefit the Euro, as it makes the region more attractive as a place for global investors to park their money.
Data releases gauge the health of the economy and can impact on the Euro. Indicators such as GDP, Manufacturing and Services PMIs, employment, and consumer sentiment surveys can all influence the direction of the single currency. A strong economy is good for the Euro. Not only does it attract more foreign investment but it may encourage the ECB to put up interest rates, which will directly strengthen the Euro. Otherwise, if economic data is weak, the Euro is likely to fall. Economic data for the four largest economies in the euro area (Germany, France, Italy and Spain) are especially significant, as they account for 75% of the Eurozone’s economy.
Another significant data release for the Euro is the Trade Balance. This indicator measures the difference between what a country earns from its exports and what it spends on imports over a given period. If a country produces highly sought after exports then its currency will gain in value purely from the extra demand created from foreign buyers seeking to purchase these goods. Therefore, a positive net Trade Balance strengthens a currency and vice versa for a negative balance.
-
06:09
EUR/GBP remains subdued near 0.8350 due to dovish mood surrounding ECB
- EUR/GBP declines as several ECB officials remain comfortable with the outlook for three more rate cuts in 2025.
- The Euro may gain if a ceasefire in Ukraine is agreed upon and gas supplies resume.
- Traders await the upcoming UK labor market and Consumer Price Index inflation data set to be released later this week.
EUR/GBP retraces its recent gains from the previous session, trading around 0.8330 during Monday's Asian hours. The Euro faces downward pressure as several European Central Bank (ECB) officials remain comfortable with the outlook for three more rate cuts this year, following a 25 basis point reduction to 2.75% last month.
However, the downside for EUR/GBP may be limited, as the Euro could find support if a ceasefire in Ukraine is reached and gas supplies resume. Reports indicate that US President Donald Trump and Russian President Vladimir Putin have agreed to begin negotiations to end the conflict, with Trump administration officials set to meet Russian counterparts in Saudi Arabia on Tuesday for talks on a potential peace deal.
Additionally, the EUR/GBP pair faces challenges following strong UK economic data released on Thursday. The UK economy grew by 1.4% year-on-year in Q4 2024, accelerating from an upwardly revised 1.0% in the previous quarter and exceeding market expectations of 1.1%, according to preliminary estimates. This marks the fastest GDP growth since Q4 2022. For the full year 2024, the British economy expanded by 0.9%, up from 0.4% in 2023, driven by a 1.3% increase in the services sector, compared to 0.4% growth the previous year.
Traders will be watching the upcoming UK labor market and Consumer Price Index (CPI) inflation data, due on Tuesday and Wednesday, respectively. Both economic indicators will play a key role in shaping market speculation about whether the Bank of England (BoE) will lower interest rates again at its March meeting. The BoE recently reduced its key borrowing rate by 25 basis points (bps) to 4.5% on February 6.
Interest rates FAQs
Interest rates are charged by financial institutions on loans to borrowers and are paid as interest to savers and depositors. They are influenced by base lending rates, which are set by central banks in response to changes in the economy. Central banks normally have a mandate to ensure price stability, which in most cases means targeting a core inflation rate of around 2%. If inflation falls below target the central bank may cut base lending rates, with a view to stimulating lending and boosting the economy. If inflation rises substantially above 2% it normally results in the central bank raising base lending rates in an attempt to lower inflation.
Higher interest rates generally help strengthen a country’s currency as they make it a more attractive place for global investors to park their money.
Higher interest rates overall weigh on the price of Gold because they increase the opportunity cost of holding Gold instead of investing in an interest-bearing asset or placing cash in the bank. If interest rates are high that usually pushes up the price of the US Dollar (USD), and since Gold is priced in Dollars, this has the effect of lowering the price of Gold.
The Fed funds rate is the overnight rate at which US banks lend to each other. It is the oft-quoted headline rate set by the Federal Reserve at its FOMC meetings. It is set as a range, for example 4.75%-5.00%, though the upper limit (in that case 5.00%) is the quoted figure. Market expectations for future Fed funds rate are tracked by the CME FedWatch tool, which shapes how many financial markets behave in anticipation of future Federal Reserve monetary policy decisions.
-
05:35
India Gold price today: Gold rises, according to FXStreet data
Gold prices rose in India on Monday, according to data compiled by FXStreet.
The price for Gold stood at 8,100.19 Indian Rupees (INR) per gram, up compared with the INR 8,048.59 it cost on Friday.
The price for Gold increased to INR 94,479.07 per tola from INR 93,877.18 per tola on friday.
Unit measure Gold Price in INR 1 Gram 8,100.19 10 Grams 81,001.94 Tola 94,479.07 Troy Ounce 251,944.40 FXStreet calculates Gold prices in India by adapting international prices (USD/INR) to the local currency and measurement units. Prices are updated daily based on the market rates taken at the time of publication. Prices are just for reference and local rates could diverge slightly.
Gold FAQs
Gold has played a key role in human’s history as it has been widely used as a store of value and medium of exchange. Currently, apart from its shine and usage for jewelry, the precious metal is widely seen as a safe-haven asset, meaning that it is considered a good investment during turbulent times. Gold is also widely seen as a hedge against inflation and against depreciating currencies as it doesn’t rely on any specific issuer or government.
Central banks are the biggest Gold holders. In their aim to support their currencies in turbulent times, central banks tend to diversify their reserves and buy Gold to improve the perceived strength of the economy and the currency. High Gold reserves can be a source of trust for a country’s solvency. Central banks added 1,136 tonnes of Gold worth around $70 billion to their reserves in 2022, according to data from the World Gold Council. This is the highest yearly purchase since records began. Central banks from emerging economies such as China, India and Turkey are quickly increasing their Gold reserves.
Gold has an inverse correlation with the US Dollar and US Treasuries, which are both major reserve and safe-haven assets. When the Dollar depreciates, Gold tends to rise, enabling investors and central banks to diversify their assets in turbulent times. Gold is also inversely correlated with risk assets. A rally in the stock market tends to weaken Gold price, while sell-offs in riskier markets tend to favor the precious metal.
The price can move due to a wide range of factors. Geopolitical instability or fears of a deep recession can quickly make Gold price escalate due to its safe-haven status. As a yield-less asset, Gold tends to rise with lower interest rates, while higher cost of money usually weighs down on the yellow metal. Still, most moves depend on how the US Dollar (USD) behaves as the asset is priced in dollars (XAU/USD). A strong Dollar tends to keep the price of Gold controlled, whereas a weaker Dollar is likely to push Gold prices up.
(An automation tool was used in creating this post.)
-
05:34
Gold price retakes $2,900 mark amid broadly weaker USD
- Gold regained positive traction on Monday amid sustained USD weakness.
- Concerns about Trump’s tariffs further benefit the safe-haven XAU/USD pair.
- The fundamental and technical setup underpin prospects for additional gains.
Gold price (XAU/USD) attracts some dip-buying at the start of a new week and reverses a part of Friday's retracement slide from the vicinity of the all-time peak. The intraday positive move lifts the commodity back above the $2,900 mark and is sponsored by a broadly weaker US Dollar (USD). Apart from this, concerns that US President Donald Trump's reciprocal tariffs could heighten global trade tensions further benefit the safe-haven bullion.
Meanwhile, the optimism over talks between the US and Russia aimed at ending the war in Ukraine does little to dent demand for the Gold price. Even the growing market acceptance that the Federal Reserve (Fed) would stick to its hawkish stance and keep interest rates on hold for an extended period fails to hinder the positive move. This, in turn, suggests that the path of least resistance for the non-yielding yellow metal remains to the upside.
Gold price continues to draw support from a weaker USD, trade war fears
- The US Dollar languishes near its lowest level since December 17 touched in reaction to disappointing US Retail Sales data on Friday and helps revive demand for the Gold price.
- The US Census Bureau reported that Retail Sales declined by 0.9% in January, worse than the decrease of 0.1% expected and the 0.7% increase (revised from 0.4%) in December.
- The markets were quick to react and are now pricing in a rate cut by the Federal Reserve in September, rather than at the end of the year, further benefiting the precious metal.
- Kevin Hassett, Director of the US National Economic Council (NEC) said that a 40 basis points drop in 10-year US Treasury yield could be a sign the market expects lower inflation.
- US President Donald Trump ordered officials to formulate plans for reciprocal tariffs on countries that impose taxes on US imports, though he stopped short of announcing levies.
- Adding to this, Trump threatened that levies on automobiles would be coming as soon as April 2, fueling concerns about a global trade war and underpinning the XAU/USD.
- With US and Russian officials expected to hold talks in Saudi Arabia, Russian troops step up their attacks in eastern Ukraine, further boosting demand for the safe-haven commodity.
Gold price remains on track to retest all-time peak, around the $2,942-2,943 area

From a technical perspective, the Relative Strength Index (RSI) on the daily chart has eased from overbought territory, while other oscillators retain their positive bias. This, in turn, validates the near-term constructive outlook for the Gold price and supports prospects for a further appreciating move. That said, any subsequent strength might face a barrier near the $2,925 horizontal zone ahead of the all-time peak, around the $2,942-2,943 region. Some follow-through buying beyond the latter would be seen as a fresh trigger for bulls and pave the way for an extension of the recent well-established uptrend witnessed over the past two months or so.
On the flip side, the $2,885 region could offer immediate support ahead of last week's swing low, around the $2,855 zone. Any further decline could be seen as a buying opportunity near the $2,834 area, which, in turn, should help limit the downside for the Gold price near the $2,815 region. This is followed by the $2,800 mark and the $2,785-2,784 support, which if broken decisively would set the stage for a meaningful corrective fall.
Gold FAQs
Gold has played a key role in human’s history as it has been widely used as a store of value and medium of exchange. Currently, apart from its shine and usage for jewelry, the precious metal is widely seen as a safe-haven asset, meaning that it is considered a good investment during turbulent times. Gold is also widely seen as a hedge against inflation and against depreciating currencies as it doesn’t rely on any specific issuer or government.
Central banks are the biggest Gold holders. In their aim to support their currencies in turbulent times, central banks tend to diversify their reserves and buy Gold to improve the perceived strength of the economy and the currency. High Gold reserves can be a source of trust for a country’s solvency. Central banks added 1,136 tonnes of Gold worth around $70 billion to their reserves in 2022, according to data from the World Gold Council. This is the highest yearly purchase since records began. Central banks from emerging economies such as China, India and Turkey are quickly increasing their Gold reserves.
Gold has an inverse correlation with the US Dollar and US Treasuries, which are both major reserve and safe-haven assets. When the Dollar depreciates, Gold tends to rise, enabling investors and central banks to diversify their assets in turbulent times. Gold is also inversely correlated with risk assets. A rally in the stock market tends to weaken Gold price, while sell-offs in riskier markets tend to favor the precious metal.
The price can move due to a wide range of factors. Geopolitical instability or fears of a deep recession can quickly make Gold price escalate due to its safe-haven status. As a yield-less asset, Gold tends to rise with lower interest rates, while higher cost of money usually weighs down on the yellow metal. Still, most moves depend on how the US Dollar (USD) behaves as the asset is priced in dollars (XAU/USD). A strong Dollar tends to keep the price of Gold controlled, whereas a weaker Dollar is likely to push Gold prices up.
Tariffs FAQs
Tariffs are customs duties levied on certain merchandise imports or a category of products. Tariffs are designed to help local producers and manufacturers be more competitive in the market by providing a price advantage over similar goods that can be imported. Tariffs are widely used as tools of protectionism, along with trade barriers and import quotas.
Although tariffs and taxes both generate government revenue to fund public goods and services, they have several distinctions. Tariffs are prepaid at the port of entry, while taxes are paid at the time of purchase. Taxes are imposed on individual taxpayers and businesses, while tariffs are paid by importers.
There are two schools of thought among economists regarding the usage of tariffs. While some argue that tariffs are necessary to protect domestic industries and address trade imbalances, others see them as a harmful tool that could potentially drive prices higher over the long term and lead to a damaging trade war by encouraging tit-for-tat tariffs.
During the run-up to the presidential election in November 2024, Donald Trump made it clear that he intends to use tariffs to support the US economy and American producers. In 2024, Mexico, China and Canada accounted for 42% of total US imports. In this period, Mexico stood out as the top exporter with $466.6 billion, according to the US Census Bureau. Hence, Trump wants to focus on these three nations when imposing tariffs. He also plans to use the revenue generated through tariffs to lower personal income taxes.
-
05:31
Japan Industrial Production (YoY) rose from previous -1.1% to 1.6% in December
-
05:31
Japan Industrial Production (MoM) registered at -0.2%, below expectations (0.3%) in December
-
05:31
Japan Capacity Utilization increased to -0.2% in December from previous -1.9%
-
05:30
Japan Tertiary Industry Index (MoM) registered at 0.1%, below expectations (0.2%) in December
-
05:25
AUD/JPY Price Forecast: Bearish outlook remains intact near 96.50
- AUD/JPY weakens to around 96.55 in Monday’s early Asian session, down 0.24% on the day.
- The cross keeps the negative outlook below the 100-day EMA with a bearish RSI indicator.
- The initial support emerges at 94.72; the first upside barrier is located at 98.02.
The AUD/JPY cross attracts some sellers to near 96.55 during the Asian trading hours on Monday. The Japanese Yen (JPY) strengthens as Japan's economy grew faster than expected in the fourth quarter (Q4), triggering the expectation that the Bank of Japan (BoJ) will hike interest rates further.
Japan’s Gross Domestic Product (GDP) expanded by 0.7% QoQ in Q4, compared to the previous reading of 0.3%, preliminary data showed on Monday. This figure came in stronger than the expectation of 0.3%.
According to the daily chart, the bearish outlook of AUD/JPY remains in play as the cross remains capped below the key 100-day Exponential Moving Average (EMA). Furthermore, the downward momentum is supported by the Relative Strength Index (RSI), which is located below the midline, suggesting that the path of least resistance is to the downside.
The first downside target for the cross emerges at 94.72, the lower limit of the Bollinger Band. Extended losses could see a drop to 93.59, the low of September 11, 2024. A decisive break below the mentioned level could pave the way to 92.79, the low of August 18, 2023.
On the bright side, the 100-day EMA at 98.02 acts as an immediate resistance level for the cross. Sustained trading above this level could attract some buyers to 98.53, the upper boundary of the Bollinger Band. Further north, the next hurdle is seen at 99.17, the high of January 7.AUD/JPY daily chart
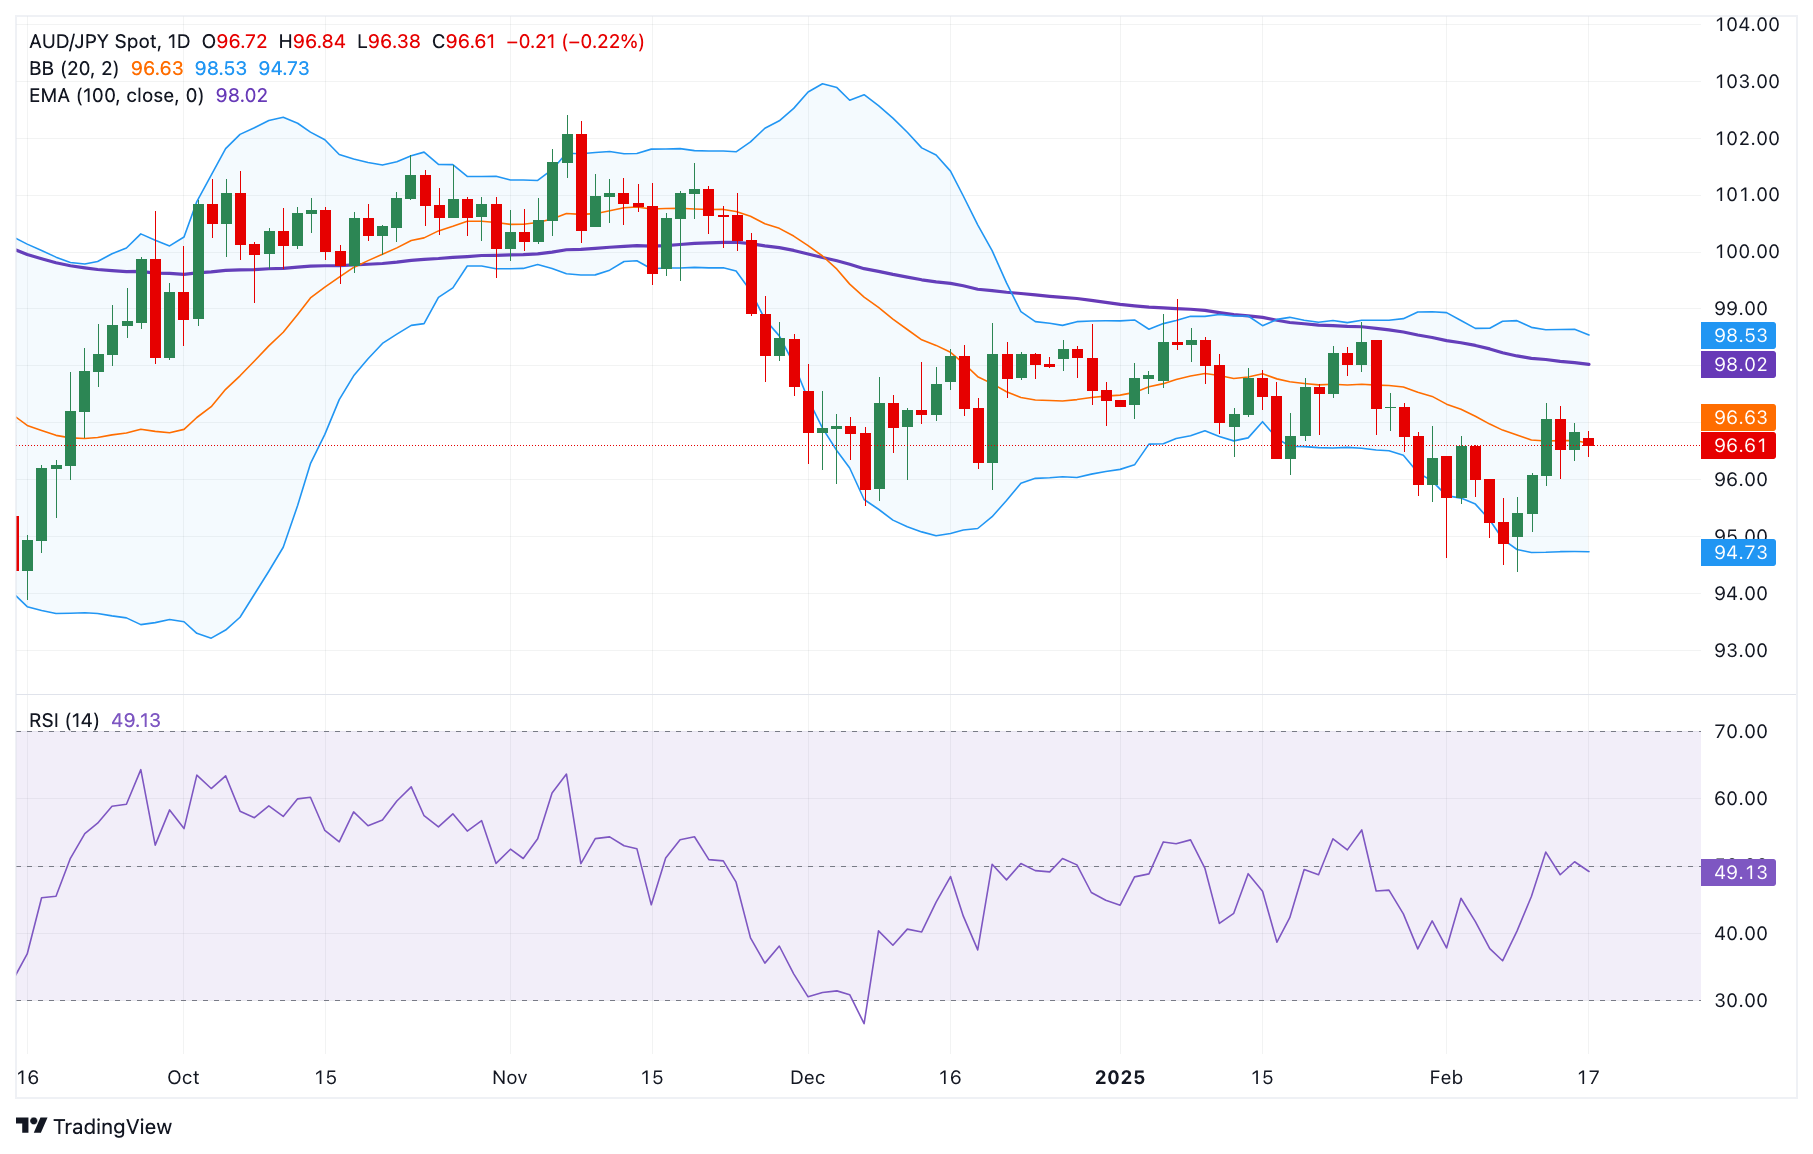
Japanese Yen FAQs
The Japanese Yen (JPY) is one of the world’s most traded currencies. Its value is broadly determined by the performance of the Japanese economy, but more specifically by the Bank of Japan’s policy, the differential between Japanese and US bond yields, or risk sentiment among traders, among other factors.
One of the Bank of Japan’s mandates is currency control, so its moves are key for the Yen. The BoJ has directly intervened in currency markets sometimes, generally to lower the value of the Yen, although it refrains from doing it often due to political concerns of its main trading partners. The BoJ ultra-loose monetary policy between 2013 and 2024 caused the Yen to depreciate against its main currency peers due to an increasing policy divergence between the Bank of Japan and other main central banks. More recently, the gradually unwinding of this ultra-loose policy has given some support to the Yen.
Over the last decade, the BoJ’s stance of sticking to ultra-loose monetary policy has led to a widening policy divergence with other central banks, particularly with the US Federal Reserve. This supported a widening of the differential between the 10-year US and Japanese bonds, which favored the US Dollar against the Japanese Yen. The BoJ decision in 2024 to gradually abandon the ultra-loose policy, coupled with interest-rate cuts in other major central banks, is narrowing this differential.
The Japanese Yen is often seen as a safe-haven investment. This means that in times of market stress, investors are more likely to put their money in the Japanese currency due to its supposed reliability and stability. Turbulent times are likely to strengthen the Yen’s value against other currencies seen as more risky to invest in.
-
05:24
EUR/JPY falls to near 159.00 following robust Japan’s GDP data
- EUR/JPY declined following the release of Japan's Gross Domestic Product report on Monday.
- Japan's GDP rose by 0.7% QoQ in Q4, marking the third straight quarter of growth.
- The Euro may gain if a ceasefire in Ukraine is agreed upon and gas supplies resume.
EUR/JPY gives up gains from the previous session, trading around 159.10 during the Asian hours on Monday. This decline is linked to a stronger Japanese Yen (JPY), driven by a robust Japan’s Gross Domestic Product (GDP) report that exceeded expectations, reinforcing market speculation that the Bank of Japan (BoJ) will continue to raise interest rates.
Japan's economy grew by 0.7% in the fourth quarter, compared to the revised 0.4% increase in the previous quarter. This marks the third consecutive quarter of growth, fueled by a strong rebound in business investment. Yearly growth accelerated from a revised 1.7% in Q3 to 2.8%, supporting the BoJ's stance on further rate hikes amid signs of broadening inflation.
Japanese Chief Cabinet Secretary Yoshimasa Hayashi remarked on Monday that Japan faces significant risks if its companies become targets due to US President Donald Trump's policies, and the government will respond cautiously to potential impacts.
The Euro could strengthen against its peers if a ceasefire in Ukraine is reached and gas supplies resume. Reports suggest that Trump and Russian President Vladimir Putin have agreed to start negotiations to end the conflict. BBC sources indicate that Trump administration officials are set to meet with Russian counterparts in Saudi Arabia on Tuesday to discuss a potential peace agreement.
However, any upside for the Euro may be capped as several European Central Bank (ECB) officials remain comfortable with expectations that the central bank will lower its Deposit Facility rate three more times this year. The ECB already reduced interest rates by 25 basis points (bps) to 2.75% last month.
Economic Indicator
Gross Domestic Product (QoQ)
The Gross Domestic Product (GDP), released by Japan’s Cabinet Office on a quarterly basis, is a measure of the total value of all goods and services produced in Japan during a given period. The GDP is considered as the main measure of Japan’s economic activity. The QoQ reading compares economic activity in the reference quarter to the previous quarter. Generally, a high reading is seen as bullish for the Japanese Yen (JPY), while a low reading is seen as bearish.
Read more.Last release: Sun Feb 16, 2025 23:50 (Prel)
Frequency: Quarterly
Actual: 0.7%
Consensus: 0.3%
Previous: 0.3%
Source: Japanese Cabinet Office
-
05:15
Indonesia Trade Balance above forecasts ($1.91B) in January: Actual ($3.45B)
-
05:15
Indonesia Imports below forecasts (9.95%) in January: Actual (-2.67%)
-
05:07
Indonesia Exports registered at 4.68%, below expectations (6.99%) in January
-
04:40
Silver Price Forecast: XAG/USD advances to near $32.50 after rebounding from nine-day EMA
- Silver price gains ground as the daily chart analysis suggests a persistent bullish bias.
- The pair may find its primary resistance around the upper boundary of the ascending channel at the $33.10 level.
- The initial support appears at the nine-day EMA of $32.08.
Silver price (XAG/USD) recovers its recent losses registered in the previous session, trading near $32.40 per troy ounce during Monday's Asian session. A daily chart analysis suggests a continued bullish trend, as the metal price moves upward within an ascending channel.
The XAG/USD pair continues to trade above the nine-day and 14-day Exponential Moving Averages (EMAs), indicating robust short-term momentum. Moreover, the 14-day Relative Strength Index (RSI) remains above the 50 level, reinforcing the overall bullish outlook.
Silver price may face initial resistance near the upper boundary of the ascending channel at the $33.10 level, followed by the four-month high of $33.40, which was reached on February 14.
On the downside, support is located at the nine-day EMA around $32.08, followed by the 14-day EMA at $31.85, and the lower boundary of the ascending channel at $31.60. A break below this critical support zone could undermine the bullish outlook, potentially exposing the XAG/USD pair to further declines toward its five-month low of $28.74, which was recorded on December 19.
XAG/USD: Daily Chart
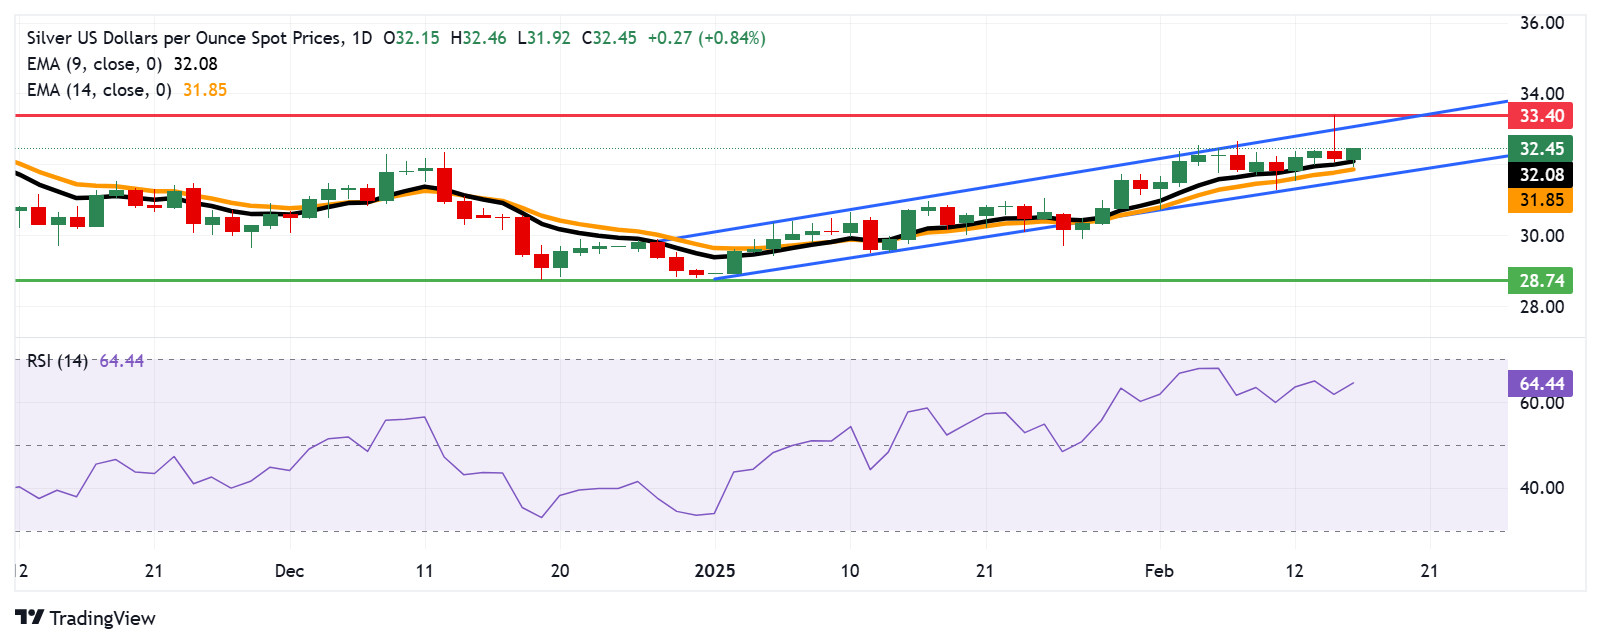
Silver FAQs
Silver is a precious metal highly traded among investors. It has been historically used as a store of value and a medium of exchange. Although less popular than Gold, traders may turn to Silver to diversify their investment portfolio, for its intrinsic value or as a potential hedge during high-inflation periods. Investors can buy physical Silver, in coins or in bars, or trade it through vehicles such as Exchange Traded Funds, which track its price on international markets.
Silver prices can move due to a wide range of factors. Geopolitical instability or fears of a deep recession can make Silver price escalate due to its safe-haven status, although to a lesser extent than Gold's. As a yieldless asset, Silver tends to rise with lower interest rates. Its moves also depend on how the US Dollar (USD) behaves as the asset is priced in dollars (XAG/USD). A strong Dollar tends to keep the price of Silver at bay, whereas a weaker Dollar is likely to propel prices up. Other factors such as investment demand, mining supply – Silver is much more abundant than Gold – and recycling rates can also affect prices.
Silver is widely used in industry, particularly in sectors such as electronics or solar energy, as it has one of the highest electric conductivity of all metals – more than Copper and Gold. A surge in demand can increase prices, while a decline tends to lower them. Dynamics in the US, Chinese and Indian economies can also contribute to price swings: for the US and particularly China, their big industrial sectors use Silver in various processes; in India, consumers’ demand for the precious metal for jewellery also plays a key role in setting prices.
Silver prices tend to follow Gold's moves. When Gold prices rise, Silver typically follows suit, as their status as safe-haven assets is similar. The Gold/Silver ratio, which shows the number of ounces of Silver needed to equal the value of one ounce of Gold, may help to determine the relative valuation between both metals. Some investors may consider a high ratio as an indicator that Silver is undervalued, or Gold is overvalued. On the contrary, a low ratio might suggest that Gold is undervalued relative to Silver.
-
04:05
NZD/USD advances to two-month peak, around mid-0.5700s amid weaker USD
- NZD/USD gains positive traction for the third straight day amid sustained USD selling.
- The divergent Fed-RBNZ expectations warrant caution for aggressive bullish traders.
- Last week’s breakout above the 0.5700 mark supports prospects for additional gains.
The NZD/USD pair attracts buyers for the third successive day on Monday and climbs to a two-month peak, around the 0.5750 area during the Asian session amid the prevalent US Dollar (USD) selling bias.
The global risk sentiment gets a minor lift from the latest optimism led by US President Donald Trump's approach to ending the protracted Russia-Ukraine war. Apart from this, a delay in Trump’s reciprocal tariffs keeps the USD depressed near its lowest level since 17 touched on Friday and acts as a tailwind for the NZD/USD pair.
The Greenback is further undermined by Friday's disappointing US Retail Sales, which dropped by the most in nearly two years in January. In fact, The US Census Bureau reported that Retail Sales declined by 0.9% during the reported month, worse than the decrease of 0.1% expected and the 0.7% increase (revised from 0.4%) in December.
That said, the growing acceptance that the Federal Reserve (Fed) would stick to its hawkish stance amid still-sticky inflation could help limit further USD losses. Apart from this, the increasing likelihood that the Reserve Bank of New Zealand (RBNZ) will deliver a third supersized rate cut later this month might cap the NZD/USD pair.
From a technical perspective, last week's breakout through the 0.5700 round figure favors bullish traders and supports prospects for a further near-term appreciating move for spot prices. Hence, any corrective pullback might still be seen as a buying opportunity and remain limited ahead of the crucial RNNZ meeting on Wednesday.
New Zealand Dollar FAQs
The New Zealand Dollar (NZD), also known as the Kiwi, is a well-known traded currency among investors. Its value is broadly determined by the health of the New Zealand economy and the country’s central bank policy. Still, there are some unique particularities that also can make NZD move. The performance of the Chinese economy tends to move the Kiwi because China is New Zealand’s biggest trading partner. Bad news for the Chinese economy likely means less New Zealand exports to the country, hitting the economy and thus its currency. Another factor moving NZD is dairy prices as the dairy industry is New Zealand’s main export. High dairy prices boost export income, contributing positively to the economy and thus to the NZD.
The Reserve Bank of New Zealand (RBNZ) aims to achieve and maintain an inflation rate between 1% and 3% over the medium term, with a focus to keep it near the 2% mid-point. To this end, the bank sets an appropriate level of interest rates. When inflation is too high, the RBNZ will increase interest rates to cool the economy, but the move will also make bond yields higher, increasing investors’ appeal to invest in the country and thus boosting NZD. On the contrary, lower interest rates tend to weaken NZD. The so-called rate differential, or how rates in New Zealand are or are expected to be compared to the ones set by the US Federal Reserve, can also play a key role in moving the NZD/USD pair.
Macroeconomic data releases in New Zealand are key to assess the state of the economy and can impact the New Zealand Dollar’s (NZD) valuation. A strong economy, based on high economic growth, low unemployment and high confidence is good for NZD. High economic growth attracts foreign investment and may encourage the Reserve Bank of New Zealand to increase interest rates, if this economic strength comes together with elevated inflation. Conversely, if economic data is weak, NZD is likely to depreciate.
The New Zealand Dollar (NZD) tends to strengthen during risk-on periods, or when investors perceive that broader market risks are low and are optimistic about growth. This tends to lead to a more favorable outlook for commodities and so-called ‘commodity currencies’ such as the Kiwi. Conversely, NZD tends to weaken at times of market turbulence or economic uncertainty as investors tend to sell higher-risk assets and flee to the more-stable safe havens.
-
03:53
WTI holds steady above $70.50, eyes on Russia-Ukraine peace deal
- WTI price may decline as supply concerns ease amid optimism over a potential Russia-Ukraine peace deal.
- Trump administration officials are set to meet with their Russian counterparts in Saudi Arabia on Tuesday.
- Global Oil demand has risen to 103.4 million barrels per day, up 1.4 million bpd from the previous year.
West Texas Intermediate (WTI) Oil price rebounds from losses in the previous session, trading around $70.60 per barrel during Monday’s Asian hours. However, crude Oil prices faced headwinds as optimism surrounding a potential peace deal between Russia and Ukraine eased supply concerns. The possible removal of sanctions on Moscow could boost global energy supplies.
According to BBC sources, Trump administration officials are scheduled to meet with their Russian counterparts in Saudi Arabia on Tuesday to discuss a potential peace agreement. This meeting marks a significant step in restoring US-Russia relations, following last week’s breakthrough phone call between President Donald Trump and Russian leader Vladimir Putin.
Meanwhile, delays in United States (US) reciprocal tariffs helped stabilize Oil prices as investors grew more optimistic about potential trade agreements. Last week, Trump directed commerce and economic officials to evaluate reciprocal tariffs on countries that impose duties on US goods, with recommendations due by April 1.
Reuters cited JPMorgan analysts that global Oil demand has surged to 103.4 million barrels per day (bpd), an increase of 1.4 million bpd from the previous year. Analysts also said, “Initially sluggish demand for mobility and heating fuels picked up in the second week of February, suggesting the gap between actual and projected demand will soon narrow.”
Additionally, US Treasury Secretary Scott Bessent told Fox Business on Friday that the US intends to cut Iran’s Oil exports to less than 10% of current levels as President Trump intensifies his “maximum pressure” campaign on Tehran’s nuclear program. “We are committed to reducing Iran’s Oil exports back to the 100,000 barrels per day level seen during Trump’s first term,” Bessent stated.
WTI Oil FAQs
WTI Oil is a type of Crude Oil sold on international markets. The WTI stands for West Texas Intermediate, one of three major types including Brent and Dubai Crude. WTI is also referred to as “light” and “sweet” because of its relatively low gravity and sulfur content respectively. It is considered a high quality Oil that is easily refined. It is sourced in the United States and distributed via the Cushing hub, which is considered “The Pipeline Crossroads of the World”. It is a benchmark for the Oil market and WTI price is frequently quoted in the media.
Like all assets, supply and demand are the key drivers of WTI Oil price. As such, global growth can be a driver of increased demand and vice versa for weak global growth. Political instability, wars, and sanctions can disrupt supply and impact prices. The decisions of OPEC, a group of major Oil-producing countries, is another key driver of price. The value of the US Dollar influences the price of WTI Crude Oil, since Oil is predominantly traded in US Dollars, thus a weaker US Dollar can make Oil more affordable and vice versa.
The weekly Oil inventory reports published by the American Petroleum Institute (API) and the Energy Information Agency (EIA) impact the price of WTI Oil. Changes in inventories reflect fluctuating supply and demand. If the data shows a drop in inventories it can indicate increased demand, pushing up Oil price. Higher inventories can reflect increased supply, pushing down prices. API’s report is published every Tuesday and EIA’s the day after. Their results are usually similar, falling within 1% of each other 75% of the time. The EIA data is considered more reliable, since it is a government agency.
OPEC (Organization of the Petroleum Exporting Countries) is a group of 12 Oil-producing nations who collectively decide production quotas for member countries at twice-yearly meetings. Their decisions often impact WTI Oil prices. When OPEC decides to lower quotas, it can tighten supply, pushing up Oil prices. When OPEC increases production, it has the opposite effect. OPEC+ refers to an expanded group that includes ten extra non-OPEC members, the most notable of which is Russia.
-
03:42
Japan’s Hayashi: Will respond carefully to potential impacts of Trump’s tariffs
Japanese Chief Cabinet Secretary Yoshimasa Hayashi noted on Monday that “Japan faces significant challenges if its companies become targets amid US President Donald Trump's policies; the government will respond carefully to potential impacts.”
Additional quotes
Exports, particularly in services, demonstrated growth, counterbalancing the decline in domestic demand, while the year's value rose by 2.9% year-on-year, exceeding 609.3 trillion yen for the first time.
Domestic demand showed positive trends over the past three and a third quarters, despite personal consumption experiencing negative growth due to reduced disaster-related storage needs and a decline in beverage demand.
Domestic demand is increasing, primarily driven by equipment investment, despite the impact of a stock market crash and pauses in production and delivery by some automakers.
Looking ahead, continued improvement in employment and income is expected to support economic recovery.
Market reaction
At the press time, USD/JPY is falling further toward 151.50, losing 0.39% on the day, undermined by stronger-than-expected Japanese Q4 Gross Domestic Product (GDP) data.
-
03:33
Japanese Yen builds on upbeat GDP-inspired gains; USD/JPY slides further below 152.00
- The Japanese Yen attracts strong follow-through buying in reaction to the upbeat Q4 GDP.
- Optimism over the delay of Trump’s reciprocal tariffs provides an additional boost to the JPY.
- The USD languishes near a two-month low and further contributes to the USD/JPY pair’s slide.
The Japanese Yen (JPY) strengthened across the board following the release of a strong Gross Domestic Product (GDP) report, which showed that Japan’s economic growth blew past expectations in the fourth quarter. This comes on top of signs of broadening inflationary pressure in Japan and reaffirms market bets that the Bank of Japan (BoJ) will hike interest rates further, which, in turn, provides a goodish lift to the JPY.
Apart from this, the optimism over a delay in US President Donald Trump's reciprocal tariffs and the narrowing of the US-Japan rate differential turn out to be other factors lending support to the lower-yielding JPY. The US Dollar (USD), on the other hand, languishes near a two-month low touched on Friday, which drags the USD/JPY pair lower for the third successive day, to the 152.75 region during the Asian session.
Japanese Yen bulls retain control amid rising bets for additional BoJ rate hikes
- Data released earlier this Monday showed that Japan's economy expanded by 0.7% in the October-December quarter compared to the previous quarter's upwardly revised reading of 0.4%.
- The yearly growth rate accelerated from a revised 1.7% in the third quarter to 2.8%, which supports the Bank of Japan's plan to keep hiking rates amid signs of broadening inflation in Japan.
- Japan's Economy Minister Ryosei Akazawa said that he expects the economy to continue making a modest recovery, though he noted the need to be mindful of overseas economic downside risks.
- Tokyo-based Kyodo News reported on Sunday that Japan had asked to be exempted from US President Donald Trump's 25% tariffs on steel and aluminum, and the so-called reciprocal tariffs.
- This follows Trump’s order on Thursday to formulate plans for reciprocal tariffs on every country that imposes taxes on US imports, though he stopped short of announcing immediate levies.
- This, along with the dismal US Retail Sales figures released on Friday, keeps the US Dollar depressed near its lowest level since December 17 and weighs on the USD/JPY pair.
- The US Census Bureau reported that Retail Sales declined by 0.9% in January, worse than the decrease of 0.1% expected and the 0.7% increase (revised from 0.4%) in December.
- US Secretary of State Marco Rubio signaled on Sunday that talks with Russia this week were a chance to see how serious Russian President Vladimir Putin is about peace.
- Adding to this, Trump said that he was working hard to achieve peace and that he believed he could meet Putin very soon to discuss ending the protracted war in Ukraine.
USD/JPY seems vulnerable while below the 200-day SMA, around 152.70 area
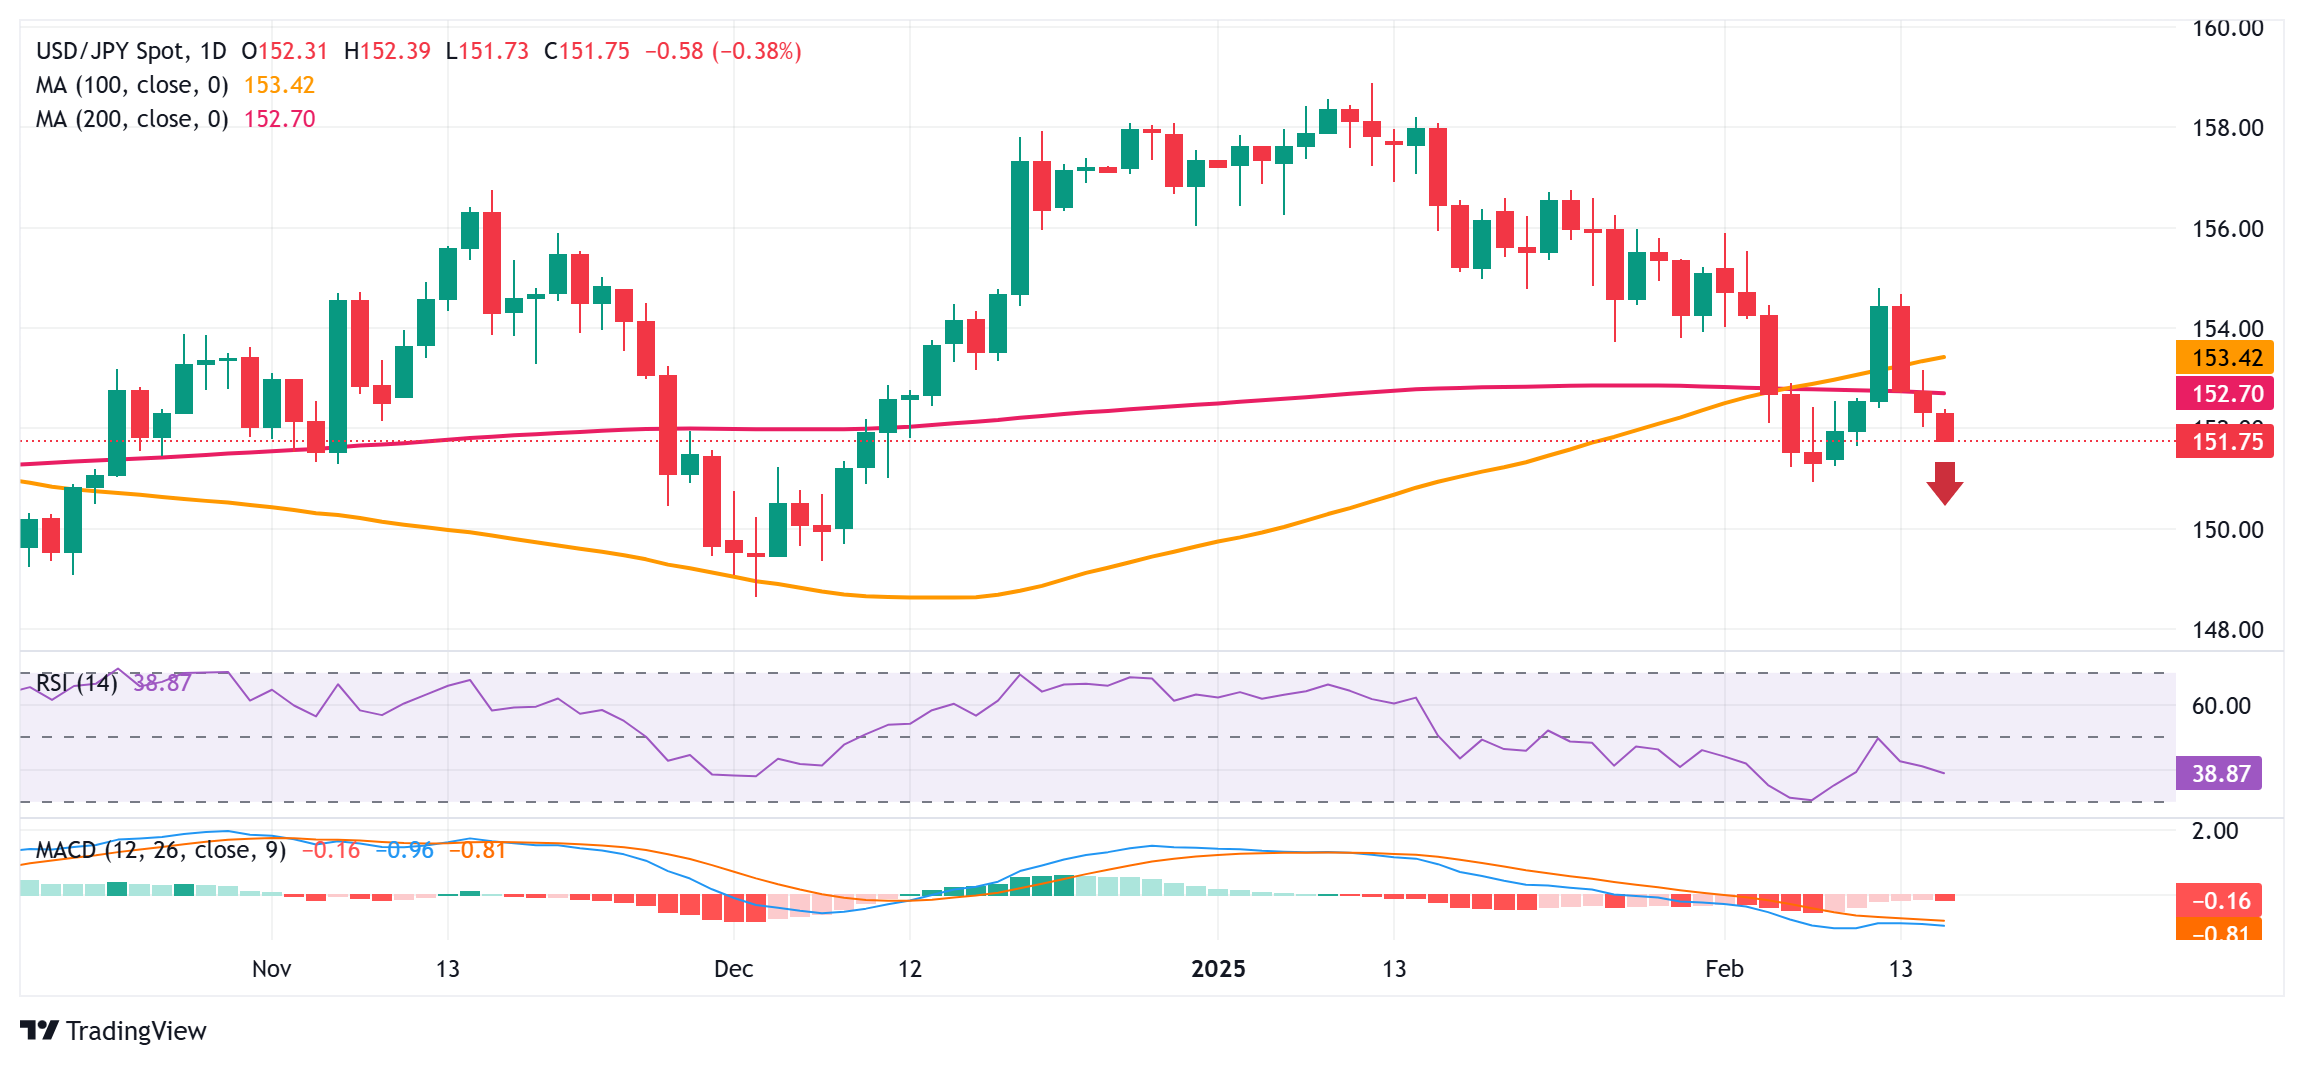
From current levels, the 151.45-151.40 area could offer immediate support ahead of the 150.95-150.90 region, or the lowest level since December 10 touched earlier this month. Given that oscillators on the daily chart are holding in negative territory, some follow-through selling would be seen as a fresh trigger for bearish traders. The USD/JPY pair might then accelerate the fall towards the 150.00 psychological mark en route to the 149.60-149.55 zone, the 149.00 round figure, and the December 2024 swing low, around the 148.65 region.
On the flip side, any meaningful recovery beyond the 152.00 mark might confront a strong hurdle near the 152.70 area, or the 200-day Simple Moving Average (SMA). This is followed by the 100-day SMA, currently pegged near the 153.15 region, which if cleared decisively could trigger a short-covering rally. The subsequent move up has the potential to lift the USD/JPY pair beyond the 154.00 round figure, towards the 154.45-154.50 supply zone en route to last week's swing high, around the 154.75-154.80 region.
Economic Indicator
Gross Domestic Product Annualized
The Gross Domestic Product (GDP), released by Japan’s Cabinet Office on a quarterly basis, is a measure of the total value of all goods and services produced in Japan during a given period. The GDP is considered as the main measure of Japan’s economic activity. The data is expressed at an annualized rate, which means that the rate has been adjusted to reflect the amount GDP would have changed over a year’s time, had it continued to grow at that specific rate. Generally, a high reading is seen as bullish for the Japanese Yen (JPY), while a low reading is seen as bearish.
Read more.Last release: Sun Feb 16, 2025 23:50 (Prel)
Frequency: Quarterly
Actual: 2.8%
Consensus: 1%
Previous: 1.2%
Source: Japanese Cabinet Office
Tariffs FAQs
Tariffs are customs duties levied on certain merchandise imports or a category of products. Tariffs are designed to help local producers and manufacturers be more competitive in the market by providing a price advantage over similar goods that can be imported. Tariffs are widely used as tools of protectionism, along with trade barriers and import quotas.
Although tariffs and taxes both generate government revenue to fund public goods and services, they have several distinctions. Tariffs are prepaid at the port of entry, while taxes are paid at the time of purchase. Taxes are imposed on individual taxpayers and businesses, while tariffs are paid by importers.
There are two schools of thought among economists regarding the usage of tariffs. While some argue that tariffs are necessary to protect domestic industries and address trade imbalances, others see them as a harmful tool that could potentially drive prices higher over the long term and lead to a damaging trade war by encouraging tit-for-tat tariffs.
During the run-up to the presidential election in November 2024, Donald Trump made it clear that he intends to use tariffs to support the US economy and American producers. In 2024, Mexico, China and Canada accounted for 42% of total US imports. In this period, Mexico stood out as the top exporter with $466.6 billion, according to the US Census Bureau. Hence, Trump wants to focus on these three nations when imposing tariffs. He also plans to use the revenue generated through tariffs to lower personal income taxes.
-
03:30
Commodities. Daily history for Friday, February 14, 2025
Raw materials Closed Change, % Silver 32.152 -0.5 Gold 2882.68 -1.55 Palladium 969.69 -2.91 -
03:25
USD/INR recovers as traders await Indian Trade Balance, US tariff details
- The Indian Rupee trades in negative territory on Monday.
- Indian economic slowdown, foreign outflows and RBI rate cuts continue to undermine the INR.
- The RBI intervention and lower crude oil prices might cap the downside for local currency.
The Indian Rupee (INR) weakens on Monday, snapping the two-day winning streak. The sluggish growth in the Indian economy, continued Foreign Institutional Investors (FIIs) outflows, and the Reserve Bank of India (RBI) rate cut dragged the local currency lower against the USD.
Nonetheless, the intervention from the RBI by selling the USD might help limit the INR’s losses. Additionally, the decline in crude oil prices is likely to support the Indian Rupee, as India is the world's third-largest consumer of crude oil. The Indian Trade Balance will be released later on Monday. On the US front, the Federal Reserve (Fed) Patrick Harker and Michelle Bowman are scheduled to speak. The US market will be closed on Monday in observance of President's Day.Indian Rupee remains weak amid sluggish growth, RBI rate cuts
- India's Wholesale Price Index (WPI) inflation slightly decreased to 2.31% in January from 2.37% in December, softer than the 2.50% expected.
- "A sustained domestic market rally is unlikely since the FIIs continue to be on sell mode. Only a decline in dollar and US bond yields will turn the FIIs into buyers," said V K Vijayakumar, Chief Investment Strategist, Geojit Financial Services.
- US President Donald Trump said last week that Indian Prime Minister Narendra Modi offered to talk about easing tariffs and importing more US oil and gas to shrink the trade deficit between the two countries.
- US Retail Sales declined by 0.9% in January from the 0.7% increase (revised from 0.4%) in December, according to the US Census Bureau on Friday. This figure came in weaker than the market expectation for a decrease of 0.1%.
- Industrial Production increased by 0.5% MoM in January, compared to 1.0% (revised from 0.9%) in December, beating the estimation of a 0.3% rise.
USD/INR maintains a positive tone, further sideways expected in the near term
The Indian Rupee trades softer on the day. Technically, the bullish outlook of the USD/INR pair prevails, characterized by the price being well-supported above the key 100-day Exponential Moving Average (EMA) on the daily timeframe. Nonetheless, further consolidation cannot be ruled out as the 14-day Relative Strength Index (RSI) hovers around the midline.
The 87.00 psychological level acts as an immediate resistance level for USD/INR. Sustained gains past the mentioned level could allow bulls to set their sights on the next targets at an all-time high near 88.00, en route to 88.50.
On the downside, the initial support level is seen at 86.35, the low of February 12. A breach of this level could send the pair back down to 86.14, the low of January 27.Indian Rupee FAQs
The Indian Rupee (INR) is one of the most sensitive currencies to external factors. The price of Crude Oil (the country is highly dependent on imported Oil), the value of the US Dollar – most trade is conducted in USD – and the level of foreign investment, are all influential. Direct intervention by the Reserve Bank of India (RBI) in FX markets to keep the exchange rate stable, as well as the level of interest rates set by the RBI, are further major influencing factors on the Rupee.
The Reserve Bank of India (RBI) actively intervenes in forex markets to maintain a stable exchange rate, to help facilitate trade. In addition, the RBI tries to maintain the inflation rate at its 4% target by adjusting interest rates. Higher interest rates usually strengthen the Rupee. This is due to the role of the ‘carry trade’ in which investors borrow in countries with lower interest rates so as to place their money in countries’ offering relatively higher interest rates and profit from the difference.
Macroeconomic factors that influence the value of the Rupee include inflation, interest rates, the economic growth rate (GDP), the balance of trade, and inflows from foreign investment. A higher growth rate can lead to more overseas investment, pushing up demand for the Rupee. A less negative balance of trade will eventually lead to a stronger Rupee. Higher interest rates, especially real rates (interest rates less inflation) are also positive for the Rupee. A risk-on environment can lead to greater inflows of Foreign Direct and Indirect Investment (FDI and FII), which also benefit the Rupee.
Higher inflation, particularly, if it is comparatively higher than India’s peers, is generally negative for the currency as it reflects devaluation through oversupply. Inflation also increases the cost of exports, leading to more Rupees being sold to purchase foreign imports, which is Rupee-negative. At the same time, higher inflation usually leads to the Reserve Bank of India (RBI) raising interest rates and this can be positive for the Rupee, due to increased demand from international investors. The opposite effect is true of lower inflation.
-
03:20
PBOC Governor Pan: Will continue to let the market play a decisive role in deciding the Yuan exchange rate
Speaking at the AlUla Conference for Emerging Market Economies in Saudi Arabia on Sunday, People's Bank of China (PBOC) Governor Pan Gongsheng said that the central bank “will continue to let the market play a decisive role in deciding the Yuan exchange rate.”
Additional quotes
Emphasized that a stable yuan is crucial for global financial and economic stability.
Highlighted that while many currencies have depreciated against a stronger us dollar, the Yuan has remained stable despite market volatility.
Noted China’s focus on boosting domestic consumption through policies such as raising household incomes and offering subsidies.
China will implement a proactive fiscal policy and an accommodative monetary policy, with stronger counter-cyclical adjustments to support the economy.
-
03:07
South Korea Trade Balance climbed from previous $-1.89B to $-1.86B in January
-
02:53
US’ NEC Director Hasset: Having regular meetings with Fed Chair Jerome Powell
Kevin Hassett, Director of the US National Economic Council (NEC), revealed in an interview with CBS' Face The Nation early Monday he is having regular meetings with Federal Reserve (Fed) Chairman Jerome Powell.
Additional takeaways
Denied that these meetings were intended to influence interest rates, emphasizing that Powell's independence is respected, though the president’s views can still be voiced.
Long-term interest yields have declined, citing the 40 bp drop in 10-year Treasury yields, says it's a sign the market expects lower inflation.
Market reaction
The US Dollar Index (DXY) licks its wounds near two-week lows of 106.57, still down 0.07% so far.
Fed FAQs
Monetary policy in the US is shaped by the Federal Reserve (Fed). The Fed has two mandates: to achieve price stability and foster full employment. Its primary tool to achieve these goals is by adjusting interest rates. When prices are rising too quickly and inflation is above the Fed’s 2% target, it raises interest rates, increasing borrowing costs throughout the economy. This results in a stronger US Dollar (USD) as it makes the US a more attractive place for international investors to park their money. When inflation falls below 2% or the Unemployment Rate is too high, the Fed may lower interest rates to encourage borrowing, which weighs on the Greenback.
The Federal Reserve (Fed) holds eight policy meetings a year, where the Federal Open Market Committee (FOMC) assesses economic conditions and makes monetary policy decisions. The FOMC is attended by twelve Fed officials – the seven members of the Board of Governors, the president of the Federal Reserve Bank of New York, and four of the remaining eleven regional Reserve Bank presidents, who serve one-year terms on a rotating basis.
In extreme situations, the Federal Reserve may resort to a policy named Quantitative Easing (QE). QE is the process by which the Fed substantially increases the flow of credit in a stuck financial system. It is a non-standard policy measure used during crises or when inflation is extremely low. It was the Fed’s weapon of choice during the Great Financial Crisis in 2008. It involves the Fed printing more Dollars and using them to buy high grade bonds from financial institutions. QE usually weakens the US Dollar.
Quantitative tightening (QT) is the reverse process of QE, whereby the Federal Reserve stops buying bonds from financial institutions and does not reinvest the principal from the bonds it holds maturing, to purchase new bonds. It is usually positive for the value of the US Dollar.
-
02:45
Australian Dollar appreciates due to improved market sentiment
- The Australian Dollar strengthens amid risk-on sentiment following the postponement of Trump’s reciprocal tariffs.
- The AUD could encounter pressure as the RBA is widely expected to announce a rate cut on Tuesday.
- Weaker US Retail Sales data has intensified speculation that the Fed may lower interest rates later this year.
The Australian Dollar (AUD) continues its upward momentum against the US Dollar (USD) for the third straight day on Monday, supported by US President Donald Trump's decision to delay the implementation of reciprocal tariffs.
The AUD/USD pair also appreciates as the US Dollar (USD) weakens as disappointing US retail sales report has reignited speculation that the Federal Reserve (Fed) may cut interest rates later this year, despite ongoing inflation concerns.
The upside of the AUD/USD pair could be restrained amid rising speculation of the Reserve Bank of Australia (RBA) rate cut on Tuesday. The RBA is expected to cut its Official Cash Rate (OCR) by 25 basis points (bps) to 4.10%, the first-rate reduction in four years.
Australian Dollar advances as US Dollar loses ground weaker Treasury yields
- The US Dollar Index (DXY), which tracks the US Dollar's performance against six major currencies, remains under pressure for the third consecutive session due to weaker US Treasury yields. As of writing, the DXY hovers around 106.70, while yields on 2-year and 10-year US Treasury bonds stand at 4.26% and 4.47%, respectively.
- Data from the US Census Bureau on Friday showed that US Retail Sales fell by 0.9% in January, following a revised 0.7% increase in December (previously reported as 0.4%). This decline was sharper than the market’s expectation of a 0.1% drop.
- Core PPI inflation in the United States (US) rose to 3.6% YoY in January, exceeding the expected 3.3% but slightly below the revised 3.7% (previously reported as 3.5%). This has reinforced expectations that the Federal Reserve (Fed) will delay rate cuts until the second half of the year.
- US Consumer Price Index (CPI) rose 3.0% year-over-year in January, exceeding expectations of 2.9%. The core CPI, which excludes food and energy, increased to 3.3% from 3.2%, surpassing the forecast of 3.1%. On a monthly basis, headline inflation jumped to 0.5% in January from 0.4% in December, while core CPI rose to 0.4% from 0.2% over the same period.
- In his semi-annual report to Congress, Fed’s Powell said the Fed officials “do not need to be in a hurry" to cut interest rates due to strength in the job market and solid economic growth. He added that US President Donald Trump's tariff policies could put more upward pressure on prices, making it harder for the central bank to lower rates.
- A Reuters poll of economists now suggests the Federal Reserve will delay cutting interest rates until next quarter amid rising inflation concerns. Many who had previously expected a March rate cut have revised their forecasts. The majority of economists surveyed between February 4-10 anticipate at least one rate cut by June, though opinions on the exact timing remain divided.
- Federal Reserve Bank of Cleveland President Beth Hammack stated on Tuesday that keeping interest rates steady for an extended period will likely be appropriate. Hammack emphasized that a patient approach will allow the Fed to assess economic conditions and noted that the central bank is well-positioned to respond to any shifts in the economy, according to Reuters.
- The dovish sentiment regarding the RBA rate cut remains intact following fresh inflation outlook data. Consumer inflation expectations climbed to 4.6% in February from 4.0% in January, reaching their highest level since April 2024.
Australian Dollar rises toward ascending channel’s upper boundary near 0.6400
The AUD/USD pair hovers near 0.6360 on Monday, moving upwards within the ascending channel pattern. This suggests that market bias is bullish. Additionally, the 14-day Relative Strength Index (RSI) maintains its position above the 50 mark, reinforcing a bullish bias.
On the upside, the AUD/USD pair may test the upper boundary of the ascending channel at 0.6380 level, followed by the psychological level of 0.6400.
The AUD/USD pair could find its primary support at the nine-day EMA of 0.6310 level, followed by the 14-day EMA of 0.6294. A break below these levels could weaken the short-term price momentum, potentially pushing the pair toward the ascending channel’s lower boundary at the 0.6270 level.
AUD/USD: Daily Chart
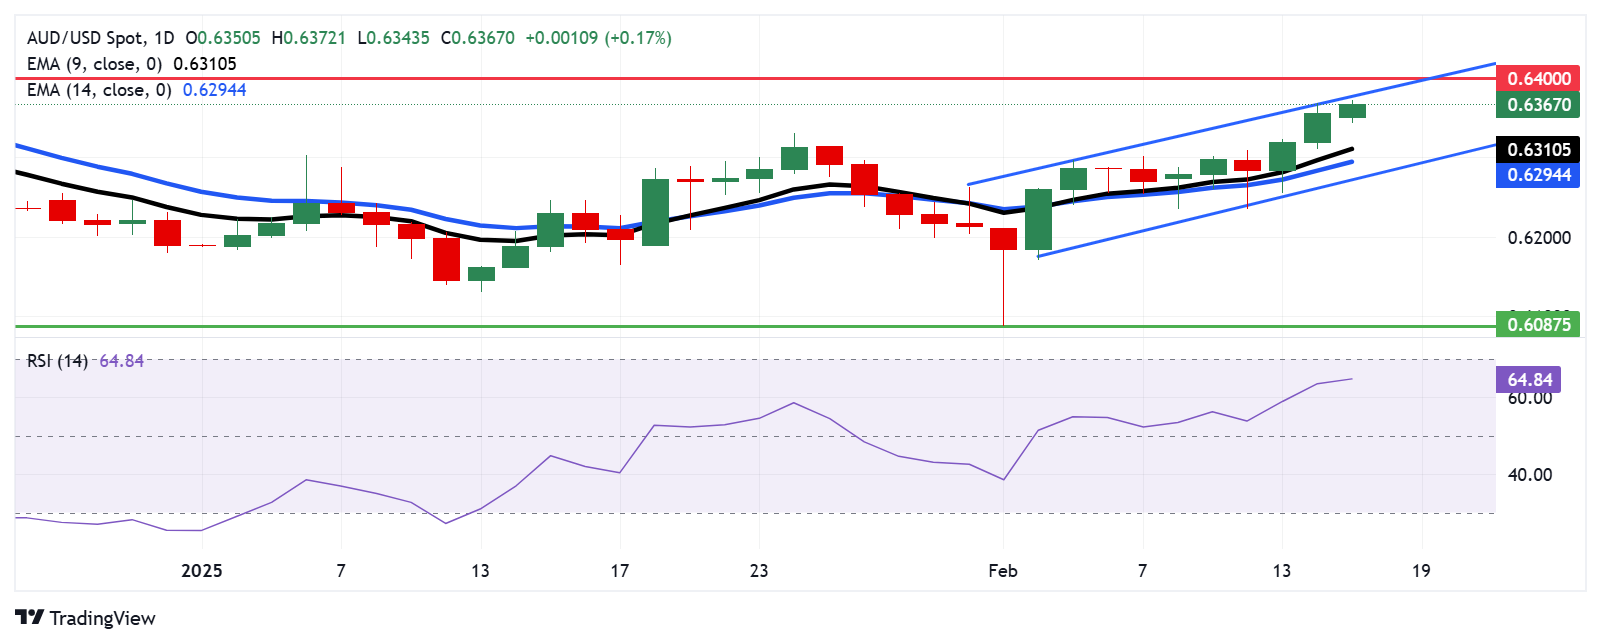
Australian Dollar PRICE Today
The table below shows the percentage change of Australian Dollar (AUD) against listed major currencies today. Australian Dollar was the strongest against the US Dollar.
USD EUR GBP JPY CAD AUD NZD CHF USD -0.10% -0.07% -0.32% -0.10% -0.24% -0.48% -0.02% EUR 0.10% 0.18% -0.24% 0.09% -0.06% -0.28% 0.18% GBP 0.07% -0.18% -0.33% -0.09% -0.19% -0.47% -0.00% JPY 0.32% 0.24% 0.33% 0.20% 0.09% 0.03% 0.25% CAD 0.10% -0.09% 0.09% -0.20% -0.12% -0.37% 0.08% AUD 0.24% 0.06% 0.19% -0.09% 0.12% -0.23% 0.24% NZD 0.48% 0.28% 0.47% -0.03% 0.37% 0.23% 0.46% CHF 0.02% -0.18% 0.00% -0.25% -0.08% -0.24% -0.46% The heat map shows percentage changes of major currencies against each other. The base currency is picked from the left column, while the quote currency is picked from the top row. For example, if you pick the Australian Dollar from the left column and move along the horizontal line to the US Dollar, the percentage change displayed in the box will represent AUD (base)/USD (quote).
Australian Dollar FAQs
One of the most significant factors for the Australian Dollar (AUD) is the level of interest rates set by the Reserve Bank of Australia (RBA). Because Australia is a resource-rich country another key driver is the price of its biggest export, Iron Ore. The health of the Chinese economy, its largest trading partner, is a factor, as well as inflation in Australia, its growth rate and Trade Balance. Market sentiment – whether investors are taking on more risky assets (risk-on) or seeking safe-havens (risk-off) – is also a factor, with risk-on positive for AUD.
The Reserve Bank of Australia (RBA) influences the Australian Dollar (AUD) by setting the level of interest rates that Australian banks can lend to each other. This influences the level of interest rates in the economy as a whole. The main goal of the RBA is to maintain a stable inflation rate of 2-3% by adjusting interest rates up or down. Relatively high interest rates compared to other major central banks support the AUD, and the opposite for relatively low. The RBA can also use quantitative easing and tightening to influence credit conditions, with the former AUD-negative and the latter AUD-positive.
China is Australia’s largest trading partner so the health of the Chinese economy is a major influence on the value of the Australian Dollar (AUD). When the Chinese economy is doing well it purchases more raw materials, goods and services from Australia, lifting demand for the AUD, and pushing up its value. The opposite is the case when the Chinese economy is not growing as fast as expected. Positive or negative surprises in Chinese growth data, therefore, often have a direct impact on the Australian Dollar and its pairs.
Iron Ore is Australia’s largest export, accounting for $118 billion a year according to data from 2021, with China as its primary destination. The price of Iron Ore, therefore, can be a driver of the Australian Dollar. Generally, if the price of Iron Ore rises, AUD also goes up, as aggregate demand for the currency increases. The opposite is the case if the price of Iron Ore falls. Higher Iron Ore prices also tend to result in a greater likelihood of a positive Trade Balance for Australia, which is also positive of the AUD.
The Trade Balance, which is the difference between what a country earns from its exports versus what it pays for its imports, is another factor that can influence the value of the Australian Dollar. If Australia produces highly sought after exports, then its currency will gain in value purely from the surplus demand created from foreign buyers seeking to purchase its exports versus what it spends to purchase imports. Therefore, a positive net Trade Balance strengthens the AUD, with the opposite effect if the Trade Balance is negative.
-
02:20
Japan’s Akazawa expects economy to continue making modest recovery
Japan's Economy Minister Ryosei Akazawa said on Monday that he expects the Japanese economy to continue making a modest recovery.
Key quotes
Expect the economy to continue making modest recovery.
Need to be mindful of overseas economic downside risks, including China and the impact of US policy.
Need to be mindful that rising prices of food and other daily products may dampen consumer sentiment and slow consumption.
The government will implement thorough measures to counter rising prices.Market reaction
At the press time, the USD/JPY pair is down 0.36% on the day to trade at 151.77.
Japanese Yen FAQs
The Japanese Yen (JPY) is one of the world’s most traded currencies. Its value is broadly determined by the performance of the Japanese economy, but more specifically by the Bank of Japan’s policy, the differential between Japanese and US bond yields, or risk sentiment among traders, among other factors.
One of the Bank of Japan’s mandates is currency control, so its moves are key for the Yen. The BoJ has directly intervened in currency markets sometimes, generally to lower the value of the Yen, although it refrains from doing it often due to political concerns of its main trading partners. The BoJ ultra-loose monetary policy between 2013 and 2024 caused the Yen to depreciate against its main currency peers due to an increasing policy divergence between the Bank of Japan and other main central banks. More recently, the gradually unwinding of this ultra-loose policy has given some support to the Yen.
Over the last decade, the BoJ’s stance of sticking to ultra-loose monetary policy has led to a widening policy divergence with other central banks, particularly with the US Federal Reserve. This supported a widening of the differential between the 10-year US and Japanese bonds, which favored the US Dollar against the Japanese Yen. The BoJ decision in 2024 to gradually abandon the ultra-loose policy, coupled with interest-rate cuts in other major central banks, is narrowing this differential.
The Japanese Yen is often seen as a safe-haven investment. This means that in times of market stress, investors are more likely to put their money in the Japanese currency due to its supposed reliability and stability. Turbulent times are likely to strengthen the Yen’s value against other currencies seen as more risky to invest in.
-
02:15
PBOC sets USD/CNY reference rate at 7.1702 vs. 7.1706 previous
On Monday, the People’s Bank of China (PBOC) set the USD/CNY central rate for the trading session ahead at 7.1702 as compared to Friday's fix of 7.1706 and 7.2617 Reuters estimates.
PBOC FAQs
The primary monetary policy objectives of the People's Bank of China (PBoC) are to safeguard price stability, including exchange rate stability, and promote economic growth. China’s central bank also aims to implement financial reforms, such as opening and developing the financial market.
The PBoC is owned by the state of the People's Republic of China (PRC), so it is not considered an autonomous institution. The Chinese Communist Party (CCP) Committee Secretary, nominated by the Chairman of the State Council, has a key influence on the PBoC’s management and direction, not the governor. However, Mr. Pan Gongsheng currently holds both of these posts.
Unlike the Western economies, the PBoC uses a broader set of monetary policy instruments to achieve its objectives. The primary tools include a seven-day Reverse Repo Rate (RRR), Medium-term Lending Facility (MLF), foreign exchange interventions and Reserve Requirement Ratio (RRR). However, The Loan Prime Rate (LPR) is China’s benchmark interest rate. Changes to the LPR directly influence the rates that need to be paid in the market for loans and mortgages and the interest paid on savings. By changing the LPR, China’s central bank can also influence the exchange rates of the Chinese Renminbi.
Yes, China has 19 private banks – a small fraction of the financial system. The largest private banks are digital lenders WeBank and MYbank, which are backed by tech giants Tencent and Ant Group, per The Straits Times. In 2014, China allowed domestic lenders fully capitalized by private funds to operate in the state-dominated financial sector.
-
01:58
GBP/USD holds positive ground above 1.2550 on weaker US Retail Sales data
- GBP/USD posts modest gains around 1.2585 in Monday’s early Asian session.
- The US Retail Sales dropped 0.9% in January, weaker than expected.
- Investors brace for the UK labor market data and CPI inflation data, which are due later this week.
The GBP/USD pair trades with mild gains near 1.2585 during the early Asian session on Monday. The major pair edges higher amid the upbeat UK Gross Domestic Product (GDP) report and weaker US Retail Sales data. The US market will be closed on Monday in observance of President's Day.
US Retail Sales posted the biggest drop in nearly two years, dragging the Greenback lower. Retail Sales dropped 0.9% in January after an upwardly revised 0.7% increase in December, the Commerce Department's Census Bureau reported Friday. This figure came in weaker than the estimation of a 0.1% decline. On a yearly basis, Retail Sales increased 4.2% during the same reported period.
The better-than-expected UK GDP provides some support to the Pound Sterling (GBP). The UK economy grew by 0.1% QoQ in the fourth quarter (Q4) of 2024, beating expectations, according to a preliminary estimate from the UK Office for National Statistics (ONS) on Thursday.
Traders will keep an eye on the UK labor market data and Consumer Price Index (CPI) inflation data, which will be published on Tuesday and Wednesday, respectively. These reports could offer some hints as to whether the Bank of England (BoE) will cut its interest rates again in the March meeting.Pound Sterling FAQs
The Pound Sterling (GBP) is the oldest currency in the world (886 AD) and the official currency of the United Kingdom. It is the fourth most traded unit for foreign exchange (FX) in the world, accounting for 12% of all transactions, averaging $630 billion a day, according to 2022 data. Its key trading pairs are GBP/USD, also known as ‘Cable’, which accounts for 11% of FX, GBP/JPY, or the ‘Dragon’ as it is known by traders (3%), and EUR/GBP (2%). The Pound Sterling is issued by the Bank of England (BoE).
The single most important factor influencing the value of the Pound Sterling is monetary policy decided by the Bank of England. The BoE bases its decisions on whether it has achieved its primary goal of “price stability” – a steady inflation rate of around 2%. Its primary tool for achieving this is the adjustment of interest rates. When inflation is too high, the BoE will try to rein it in by raising interest rates, making it more expensive for people and businesses to access credit. This is generally positive for GBP, as higher interest rates make the UK a more attractive place for global investors to park their money. When inflation falls too low it is a sign economic growth is slowing. In this scenario, the BoE will consider lowering interest rates to cheapen credit so businesses will borrow more to invest in growth-generating projects.
Data releases gauge the health of the economy and can impact the value of the Pound Sterling. Indicators such as GDP, Manufacturing and Services PMIs, and employment can all influence the direction of the GBP. A strong economy is good for Sterling. Not only does it attract more foreign investment but it may encourage the BoE to put up interest rates, which will directly strengthen GBP. Otherwise, if economic data is weak, the Pound Sterling is likely to fall.
Another significant data release for the Pound Sterling is the Trade Balance. This indicator measures the difference between what a country earns from its exports and what it spends on imports over a given period. If a country produces highly sought-after exports, its currency will benefit purely from the extra demand created from foreign buyers seeking to purchase these goods. Therefore, a positive net Trade Balance strengthens a currency and vice versa for a negative balance.
-
01:52
USD/CAD struggles to build on modest bounce from two-month low, remains below 1.4200
- USD/CAD attracts some buyers at the start of a new week, though it lacks follow-through.
- Bearish Crude Oil prices undermine the Loonie and act as a tailwind for the currency pair.
- Subdued USD price action holds back bulls from placing aggressive bets around the major.
The USD/CAD pair kicks off the new week on a positive note and reverses a major part of Friday's slide to mid-1.4100s, or its lowest level since December 12. Spot prices, however, struggle to capitalize on the uptick and remain below the 1.4200 round-figure mark through the Asian session.
Crude Oil prices drop to a nearly two-month low amid hopes for a peace deal between Russia and Ukraine, which, in turn, could end sanctions against Russia and ease global supply disruptions. This is seen undermining the commodity-linked Loonie and turns out to be a key factor lending some support to the USD/CAD pair. That said, reduced bets for another rate cut by the Bank of Canada (BoC) in March help limit the downside for the Canadian Dollar (CAD).
Apart from this, the recent US Dollar (USD) decline further contributes to capping the upside for the USD/CAD pair. In fact, the USD Index (DXY), which tracks the Greenback against a basket of currencies, registered hefty losses last week amid easing worries about the potential economic fallout from US President Donald Trump's trade tariffs. Trump directed officials on Thursday to formulate plans for reciprocal tariffs, though he stopped short of announcing levies immediately.
Moreover, Friday's disappointing release of US monthly Retail Sales, which dropped by the most in nearly two years in January, keeps the USD bulls on the defensive. That said, the growing acceptance that the Federal Reserve (Fed) would stick to its hawkish stance amid still-sticky inflation acts as a tailwind for the buck and the USD/CAD pair. The fundamental backdrop, however, warrants caution before positioning for any further gains for the currency pair.
Canadian Dollar FAQs
The key factors driving the Canadian Dollar (CAD) are the level of interest rates set by the Bank of Canada (BoC), the price of Oil, Canada’s largest export, the health of its economy, inflation and the Trade Balance, which is the difference between the value of Canada’s exports versus its imports. Other factors include market sentiment – whether investors are taking on more risky assets (risk-on) or seeking safe-havens (risk-off) – with risk-on being CAD-positive. As its largest trading partner, the health of the US economy is also a key factor influencing the Canadian Dollar.
The Bank of Canada (BoC) has a significant influence on the Canadian Dollar by setting the level of interest rates that banks can lend to one another. This influences the level of interest rates for everyone. The main goal of the BoC is to maintain inflation at 1-3% by adjusting interest rates up or down. Relatively higher interest rates tend to be positive for the CAD. The Bank of Canada can also use quantitative easing and tightening to influence credit conditions, with the former CAD-negative and the latter CAD-positive.
The price of Oil is a key factor impacting the value of the Canadian Dollar. Petroleum is Canada’s biggest export, so Oil price tends to have an immediate impact on the CAD value. Generally, if Oil price rises CAD also goes up, as aggregate demand for the currency increases. The opposite is the case if the price of Oil falls. Higher Oil prices also tend to result in a greater likelihood of a positive Trade Balance, which is also supportive of the CAD.
While inflation had always traditionally been thought of as a negative factor for a currency since it lowers the value of money, the opposite has actually been the case in modern times with the relaxation of cross-border capital controls. Higher inflation tends to lead central banks to put up interest rates which attracts more capital inflows from global investors seeking a lucrative place to keep their money. This increases demand for the local currency, which in Canada’s case is the Canadian Dollar.
Macroeconomic data releases gauge the health of the economy and can have an impact on the Canadian Dollar. Indicators such as GDP, Manufacturing and Services PMIs, employment, and consumer sentiment surveys can all influence the direction of the CAD. A strong economy is good for the Canadian Dollar. Not only does it attract more foreign investment but it may encourage the Bank of Canada to put up interest rates, leading to a stronger currency. If economic data is weak, however, the CAD is likely to fall.
Tariffs FAQs
Tariffs are customs duties levied on certain merchandise imports or a category of products. Tariffs are designed to help local producers and manufacturers be more competitive in the market by providing a price advantage over similar goods that can be imported. Tariffs are widely used as tools of protectionism, along with trade barriers and import quotas.
Although tariffs and taxes both generate government revenue to fund public goods and services, they have several distinctions. Tariffs are prepaid at the port of entry, while taxes are paid at the time of purchase. Taxes are imposed on individual taxpayers and businesses, while tariffs are paid by importers.
There are two schools of thought among economists regarding the usage of tariffs. While some argue that tariffs are necessary to protect domestic industries and address trade imbalances, others see them as a harmful tool that could potentially drive prices higher over the long term and lead to a damaging trade war by encouraging tit-for-tat tariffs.
During the run-up to the presidential election in November 2024, Donald Trump made it clear that he intends to use tariffs to support the US economy and American producers. In 2024, Mexico, China and Canada accounted for 42% of total US imports. In this period, Mexico stood out as the top exporter with $466.6 billion, according to the US Census Bureau. Hence, Trump wants to focus on these three nations when imposing tariffs. He also plans to use the revenue generated through tariffs to lower personal income taxes.
-
01:51
EUR/USD trades below 1.0500 after pausing winning streak
- EUR/USD remains subdued despite a positive market mood.
- A weaker US retail sales report has fueled speculation that the Fed could cut interest rates later this year.
- The EUR/USD pair could further rise if a Ukraine ceasefire is reached and gas supplies resume.
EUR/USD halts its four-day winning streak, hovering around 1.0490 during Asian trading hours. Liquidity during the North American session may remain thin as all major US financial markets will be closed on Monday for the federal holiday, Presidents' Day.
The EUR/USD pair gained ground recently due to delays in implementing US President Donald Trump’s reciprocal tariffs, which are taking longer than analysts had anticipated. Additionally, disappointing US economic data has pressured the US Dollar (USD), providing further support for the EUR/USD pair. A weaker-than-expected US retail sales report has reignited speculation that the Federal Reserve (Fed) may cut interest rates later this year, despite ongoing inflation concerns.
Data from the US Census Bureau on Friday showed that US Retail Sales fell by 0.9% in January, following a revised 0.7% increase in December (previously reported as 0.4%). This decline was sharper than the market’s expectation of a 0.1% drop.
Meanwhile, a JP Morgan note suggests that the EUR/USD pair could gain as much as 5% if a ceasefire in Ukraine is agreed upon and gas supplies resume. Reports indicate that Trump and Russian President Vladimir Putin have agreed to initiate negotiations to end the conflict. Sources cited by the BBC suggest that Trump administration officials are set to meet with their Russian counterparts in Saudi Arabia on Tuesday to discuss a potential peace agreement.
Euro FAQs
The Euro is the currency for the 19 European Union countries that belong to the Eurozone. It is the second most heavily traded currency in the world behind the US Dollar. In 2022, it accounted for 31% of all foreign exchange transactions, with an average daily turnover of over $2.2 trillion a day. EUR/USD is the most heavily traded currency pair in the world, accounting for an estimated 30% off all transactions, followed by EUR/JPY (4%), EUR/GBP (3%) and EUR/AUD (2%).
The European Central Bank (ECB) in Frankfurt, Germany, is the reserve bank for the Eurozone. The ECB sets interest rates and manages monetary policy. The ECB’s primary mandate is to maintain price stability, which means either controlling inflation or stimulating growth. Its primary tool is the raising or lowering of interest rates. Relatively high interest rates – or the expectation of higher rates – will usually benefit the Euro and vice versa. The ECB Governing Council makes monetary policy decisions at meetings held eight times a year. Decisions are made by heads of the Eurozone national banks and six permanent members, including the President of the ECB, Christine Lagarde.
Eurozone inflation data, measured by the Harmonized Index of Consumer Prices (HICP), is an important econometric for the Euro. If inflation rises more than expected, especially if above the ECB’s 2% target, it obliges the ECB to raise interest rates to bring it back under control. Relatively high interest rates compared to its counterparts will usually benefit the Euro, as it makes the region more attractive as a place for global investors to park their money.
Data releases gauge the health of the economy and can impact on the Euro. Indicators such as GDP, Manufacturing and Services PMIs, employment, and consumer sentiment surveys can all influence the direction of the single currency. A strong economy is good for the Euro. Not only does it attract more foreign investment but it may encourage the ECB to put up interest rates, which will directly strengthen the Euro. Otherwise, if economic data is weak, the Euro is likely to fall. Economic data for the four largest economies in the euro area (Germany, France, Italy and Spain) are especially significant, as they account for 75% of the Eurozone’s economy.
Another significant data release for the Euro is the Trade Balance. This indicator measures the difference between what a country earns from its exports and what it spends on imports over a given period. If a country produces highly sought after exports then its currency will gain in value purely from the extra demand created from foreign buyers seeking to purchase these goods. Therefore, a positive net Trade Balance strengthens a currency and vice versa for a negative balance.
-
01:30
Stocks. Daily history for Friday, February 14, 2025
Index Change, points Closed Change, % NIKKEI 225 -312.04 39149.43 -0.79 Hang Seng 805.96 22620.33 3.69 KOSPI 7.88 2591.05 0.31 ASX 200 15.8 8555.8 0.19 DAX -98.6 22513.42 -0.44 CAC 40 14.43 8178.54 0.18 Dow Jones -165.35 44546.08 -0.37 S&P 500 -0.44 6114.63 -0.01 NASDAQ Composite 81.13 20026.77 0.41 -
01:15
Currencies. Daily history for Friday, February 14, 2025
Pare Closed Change, % AUDUSD 0.63562 0.65 EURJPY 159.848 -0.04 EURUSD 1.04929 0.29 GBPJPY 191.746 -0.06 GBPUSD 1.25868 0.33 NZDUSD 0.57342 1.13 USDCAD 1.41702 -0.13 USDCHF 0.89965 -0.25 USDJPY 152.335 -0.29 -
01:12
Gold Price Forecast: XAU/USD drifts lower below $2,900 amid profit-taking
- Gold price trades in negative territory around $2,880 in Monday’s early Asian session.
- Trump tariff delay eases panic in markets, weighing on the Gold price.
- The uncertainty, rising trade tensions and weaker USD could lift the XAU/USD price.
Gold price (XAU/USD) edges lower to near $2,880 due to profit-taking during the early Asian session on Monday. However, fears of a global trade war in the wake of US President Donald Trump's push for reciprocal tariffs might help limit the precious metal’s losses.
The delay in the Trump administration's tariff proposals being implemented and profit-taking by traders cap the upside for the yellow metal. Trump on Thursday signed a presidential memorandum laying out his plan to impose “reciprocal tariffs” on foreign nations. However, he delayed their implementation as his administration launched negotiations on a one-by-one basis with nations that could be impacted. The easing fear of a global trade war weighs on the Gold price, a traditional safe-haven asset.
Investors will closely monitor the developments surrounding further Trump’s tariff policies. Any signs of escalating trade tension and uncertainty could boost safe-haven flows, benefiting the precious metal.
The downbeat US economic data drag the US Dollar (USD) lower, which could provide some support to the USD-denominated commodities price. Retail Sales in the United States fell by 0.9% in January from the 0.7% increase (revised from 0.4%) in December, the US Census Bureau showed Friday. This figure came in below the market consensus of -0.1%.Gold FAQs
Gold has played a key role in human’s history as it has been widely used as a store of value and medium of exchange. Currently, apart from its shine and usage for jewelry, the precious metal is widely seen as a safe-haven asset, meaning that it is considered a good investment during turbulent times. Gold is also widely seen as a hedge against inflation and against depreciating currencies as it doesn’t rely on any specific issuer or government.
Central banks are the biggest Gold holders. In their aim to support their currencies in turbulent times, central banks tend to diversify their reserves and buy Gold to improve the perceived strength of the economy and the currency. High Gold reserves can be a source of trust for a country’s solvency. Central banks added 1,136 tonnes of Gold worth around $70 billion to their reserves in 2022, according to data from the World Gold Council. This is the highest yearly purchase since records began. Central banks from emerging economies such as China, India and Turkey are quickly increasing their Gold reserves.
Gold has an inverse correlation with the US Dollar and US Treasuries, which are both major reserve and safe-haven assets. When the Dollar depreciates, Gold tends to rise, enabling investors and central banks to diversify their assets in turbulent times. Gold is also inversely correlated with risk assets. A rally in the stock market tends to weaken Gold price, while sell-offs in riskier markets tend to favor the precious metal.
The price can move due to a wide range of factors. Geopolitical instability or fears of a deep recession can quickly make Gold price escalate due to its safe-haven status. As a yield-less asset, Gold tends to rise with lower interest rates, while higher cost of money usually weighs down on the yellow metal. Still, most moves depend on how the US Dollar (USD) behaves as the asset is priced in dollars (XAU/USD). A strong Dollar tends to keep the price of Gold controlled, whereas a weaker Dollar is likely to push Gold prices up.
-
01:03
United Kingdom Rightmove House Price Index (YoY) down to 1.4% in February from previous 1.8%
-
01:02
United Kingdom Rightmove House Price Index (MoM) declined to 0.5% in February from previous 1.7%
-
00:52
Japan Gross Domestic Product Deflator (YoY) in line with forecasts (2.8%) in 4Q
-
00:50
Japan Gross Domestic Product (QoQ) came in at 0.7%, above forecasts (0.3%) in 4Q
-
00:50
Japan Gross Domestic Product Annualized above forecasts (1%) in 4Q: Actual (2.8%)
-
00:22
US and Russian officials to discuss Ukraine peace talks
Trump administration officials are preparing to meet with Russian officials on Tuesday in Saudi Arabia to discuss a possible agreement on ending the war in Ukraine, two sources with direct knowledge said.
The meeting will be a key step in mending U.S.-Russia ties, after the breakthrough last week with US President Donald Trump's phone call with Russian leader Vladimir Putin.
Ukrainian officials will not attend the Russia-US meeting to be held in Saudi Arabia on Tuesday, per the BBC.Market reaction
At the time of writing, the US Dollar Index (DXY) is trading unchanged on the day to trade at 106.78.
Risk sentiment FAQs
In the world of financial jargon the two widely used terms “risk-on” and “risk off'' refer to the level of risk that investors are willing to stomach during the period referenced. In a “risk-on” market, investors are optimistic about the future and more willing to buy risky assets. In a “risk-off” market investors start to ‘play it safe’ because they are worried about the future, and therefore buy less risky assets that are more certain of bringing a return, even if it is relatively modest.
Typically, during periods of “risk-on”, stock markets will rise, most commodities – except Gold – will also gain in value, since they benefit from a positive growth outlook. The currencies of nations that are heavy commodity exporters strengthen because of increased demand, and Cryptocurrencies rise. In a “risk-off” market, Bonds go up – especially major government Bonds – Gold shines, and safe-haven currencies such as the Japanese Yen, Swiss Franc and US Dollar all benefit.
The Australian Dollar (AUD), the Canadian Dollar (CAD), the New Zealand Dollar (NZD) and minor FX like the Ruble (RUB) and the South African Rand (ZAR), all tend to rise in markets that are “risk-on”. This is because the economies of these currencies are heavily reliant on commodity exports for growth, and commodities tend to rise in price during risk-on periods. This is because investors foresee greater demand for raw materials in the future due to heightened economic activity.
The major currencies that tend to rise during periods of “risk-off” are the US Dollar (USD), the Japanese Yen (JPY) and the Swiss Franc (CHF). The US Dollar, because it is the world’s reserve currency, and because in times of crisis investors buy US government debt, which is seen as safe because the largest economy in the world is unlikely to default. The Yen, from increased demand for Japanese government bonds, because a high proportion are held by domestic investors who are unlikely to dump them – even in a crisis. The Swiss Franc, because strict Swiss banking laws offer investors enhanced capital protection.
-
00:01
AUD/USD holds below 0.6350 ahead of RBA rate decision
- AUD/USD softens to around 0.6345 in Monday’s early Asian session.
- The RBA poises to deliver the first rate cut in four years.
- The Aussie is benefiting from an easing of worst-case fears of US tariffs
The AUD/USD pair weakens to near 0.6345 during the early Asian session on Monday. The rising speculation of the Reserve Bank of Australia (RBA) rate cut drags the Australian Dollar (AUD) lower against the Greenback. All eyes will be on the RBA interest rate decision on Tuesday.
The Australian central bank is expected to cut its Official Cash Rate (OCR) by 25 basis points (bps) to 4.10%, the first rate reduction in four years, at the end of its two-day policy meeting on Tuesday. The RBA dovish bets are likely to weigh on the Aussie against the US Dollar (USD) for the time being.
"The prudent action for the RBA now would be to cut, but cut slowly and just see how data evolves through time. The worst thing they could possibly do is cut hard and then have to reverse. That's the clear risk case for them," said Craig Vardy, head of fixed income, BlackRock Australasia.
On the other hand, the downside of the AUD might be capped due to the delay in the implementation of US President Donald Trump's tariff proposals. The process of Trump's ultimate tariff policies might take longer than many analysts had expected. Westpac analysts are leaning toward further gains in the AUD in the near term.
Additionally, the disappointing US economic data could exert some selling pressure on the Greenback. Data released by the US Census Bureau on Friday showed that US Retail Sales declined by 0.9% in January from the 0.7% increase (revised from 0.4%) in December. This figure came in weaker than the market expectation for a decrease of 0.1%.Australian Dollar FAQs
One of the most significant factors for the Australian Dollar (AUD) is the level of interest rates set by the Reserve Bank of Australia (RBA). Because Australia is a resource-rich country another key driver is the price of its biggest export, Iron Ore. The health of the Chinese economy, its largest trading partner, is a factor, as well as inflation in Australia, its growth rate and Trade Balance. Market sentiment – whether investors are taking on more risky assets (risk-on) or seeking safe-havens (risk-off) – is also a factor, with risk-on positive for AUD.
The Reserve Bank of Australia (RBA) influences the Australian Dollar (AUD) by setting the level of interest rates that Australian banks can lend to each other. This influences the level of interest rates in the economy as a whole. The main goal of the RBA is to maintain a stable inflation rate of 2-3% by adjusting interest rates up or down. Relatively high interest rates compared to other major central banks support the AUD, and the opposite for relatively low. The RBA can also use quantitative easing and tightening to influence credit conditions, with the former AUD-negative and the latter AUD-positive.
China is Australia’s largest trading partner so the health of the Chinese economy is a major influence on the value of the Australian Dollar (AUD). When the Chinese economy is doing well it purchases more raw materials, goods and services from Australia, lifting demand for the AUD, and pushing up its value. The opposite is the case when the Chinese economy is not growing as fast as expected. Positive or negative surprises in Chinese growth data, therefore, often have a direct impact on the Australian Dollar and its pairs.
Iron Ore is Australia’s largest export, accounting for $118 billion a year according to data from 2021, with China as its primary destination. The price of Iron Ore, therefore, can be a driver of the Australian Dollar. Generally, if the price of Iron Ore rises, AUD also goes up, as aggregate demand for the currency increases. The opposite is the case if the price of Iron Ore falls. Higher Iron Ore prices also tend to result in a greater likelihood of a positive Trade Balance for Australia, which is also positive of the AUD.
The Trade Balance, which is the difference between what a country earns from its exports versus what it pays for its imports, is another factor that can influence the value of the Australian Dollar. If Australia produces highly sought after exports, then its currency will gain in value purely from the surplus demand created from foreign buyers seeking to purchase its exports versus what it spends to purchase imports. Therefore, a positive net Trade Balance strengthens the AUD, with the opposite effect if the Trade Balance is negative.
-
