Noticias del mercado
-
23:02
USD/CHF Price Forecast: Dips below 0.9100 on soft US Dollar
- USD/CHF continues downward, breaking below key SMAs, signaling potential for further consolidation.
- Persistent downtrend may test critical support at 0.9000 after breaching October trendline.
- Recovery above 50-day SMA at 0.9082 could push towards 20-day SMA at 0.9110 and 0.9150.
The USD/CHF reverses course and drops below 0.9100 for the fourth consecutive day. Broad US Dollar weakness keeps most G8 FX currencies in the green territory as US President Donald Trump begins his second term. The pair trades at 0.9068, down 0.87%.
USD/CHF Price Forecast: Technical outlook
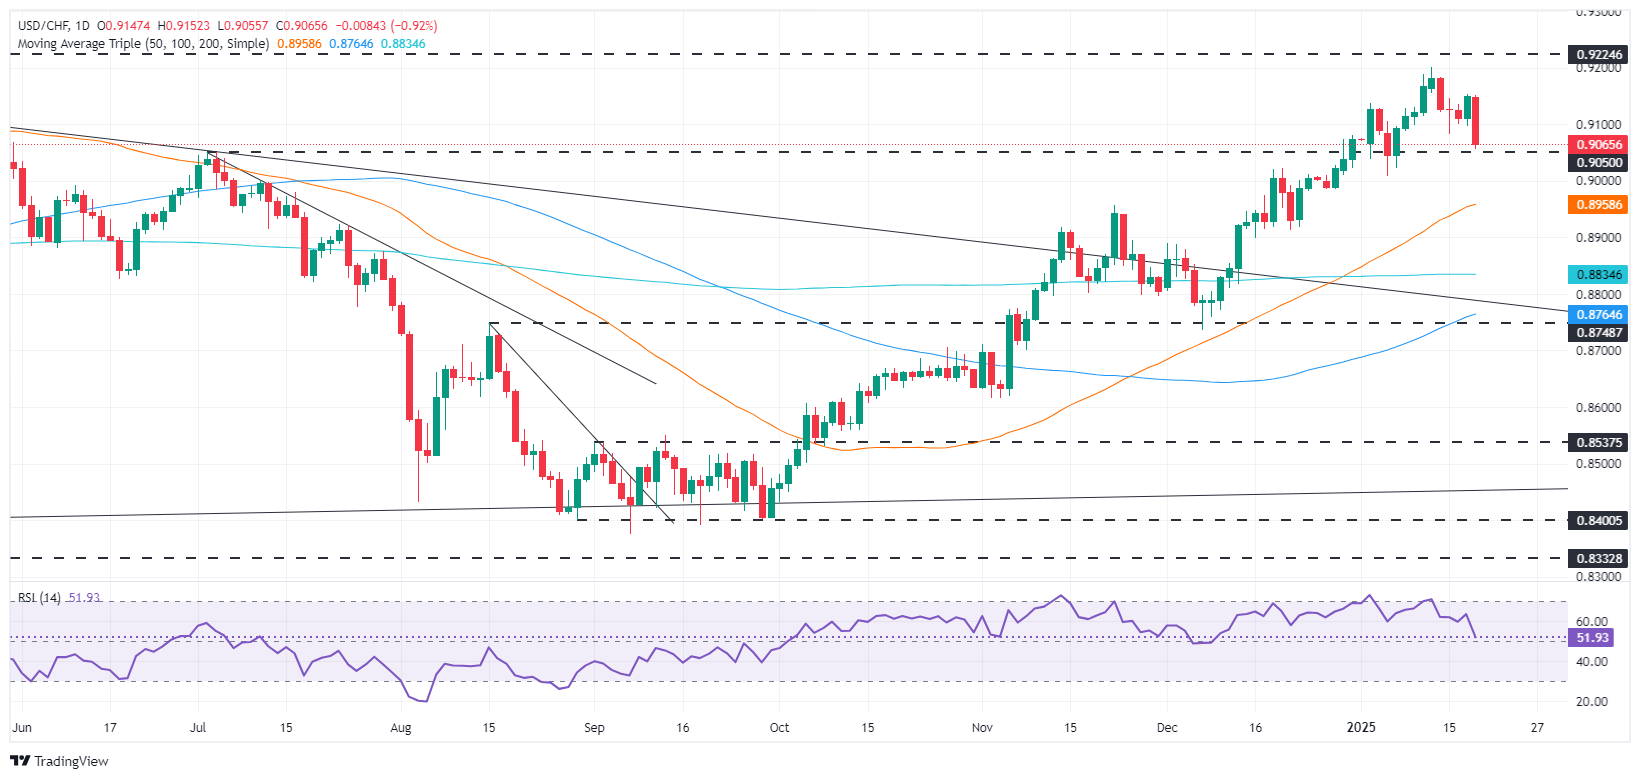
The USD/CHF has fallen below the 20 and 50-day Simple Moving Averages (SMAs) each at 0.9110 and 0.9082, respectively, an indication that some consolidation lies ahead. If sellers regain control, they could challenge a support trendline drawn from October lows, which if broken opens the door for testing 0.9000.
On the other hand, if USD/CHF edges above the 50-day SMA at 0.9082, buyers could target the 20-day SMA at 0.9110. If cleared, the next stop would be the 0.9150.
USD/CHF Price Chart - Daily
Swiss Franc FAQs
The Swiss Franc (CHF) is Switzerland’s official currency. It is among the top ten most traded currencies globally, reaching volumes that well exceed the size of the Swiss economy. Its value is determined by the broad market sentiment, the country’s economic health or action taken by the Swiss National Bank (SNB), among other factors. Between 2011 and 2015, the Swiss Franc was pegged to the Euro (EUR). The peg was abruptly removed, resulting in a more than 20% increase in the Franc’s value, causing a turmoil in markets. Even though the peg isn’t in force anymore, CHF fortunes tend to be highly correlated with the Euro ones due to the high dependency of the Swiss economy on the neighboring Eurozone.
The Swiss Franc (CHF) is considered a safe-haven asset, or a currency that investors tend to buy in times of market stress. This is due to the perceived status of Switzerland in the world: a stable economy, a strong export sector, big central bank reserves or a longstanding political stance towards neutrality in global conflicts make the country’s currency a good choice for investors fleeing from risks. Turbulent times are likely to strengthen CHF value against other currencies that are seen as more risky to invest in.
The Swiss National Bank (SNB) meets four times a year – once every quarter, less than other major central banks – to decide on monetary policy. The bank aims for an annual inflation rate of less than 2%. When inflation is above target or forecasted to be above target in the foreseeable future, the bank will attempt to tame price growth by raising its policy rate. Higher interest rates are generally positive for the Swiss Franc (CHF) as they lead to higher yields, making the country a more attractive place for investors. On the contrary, lower interest rates tend to weaken CHF.
Macroeconomic data releases in Switzerland are key to assessing the state of the economy and can impact the Swiss Franc’s (CHF) valuation. The Swiss economy is broadly stable, but any sudden change in economic growth, inflation, current account or the central bank’s currency reserves have the potential to trigger moves in CHF. Generally, high economic growth, low unemployment and high confidence are good for CHF. Conversely, if economic data points to weakening momentum, CHF is likely to depreciate.
As a small and open economy, Switzerland is heavily dependent on the health of the neighboring Eurozone economies. The broader European Union is Switzerland’s main economic partner and a key political ally, so macroeconomic and monetary policy stability in the Eurozone is essential for Switzerland and, thus, for the Swiss Franc (CHF). With such dependency, some models suggest that the correlation between the fortunes of the Euro (EUR) and the CHF is more than 90%, or close to perfect.
-
22:48
NZD/USD Price Analysis: Pair surges, strengthening bullish signals
- NZD/USD jumps 1.65% on Monday, reaching 0.5675 on fresh buying interest.
- RSI climbs to positive terrain, reflecting steady bullish momentum and room for further gains.
- MACD histogram shows rising green bars, indicating an accelerating upward trajectory.
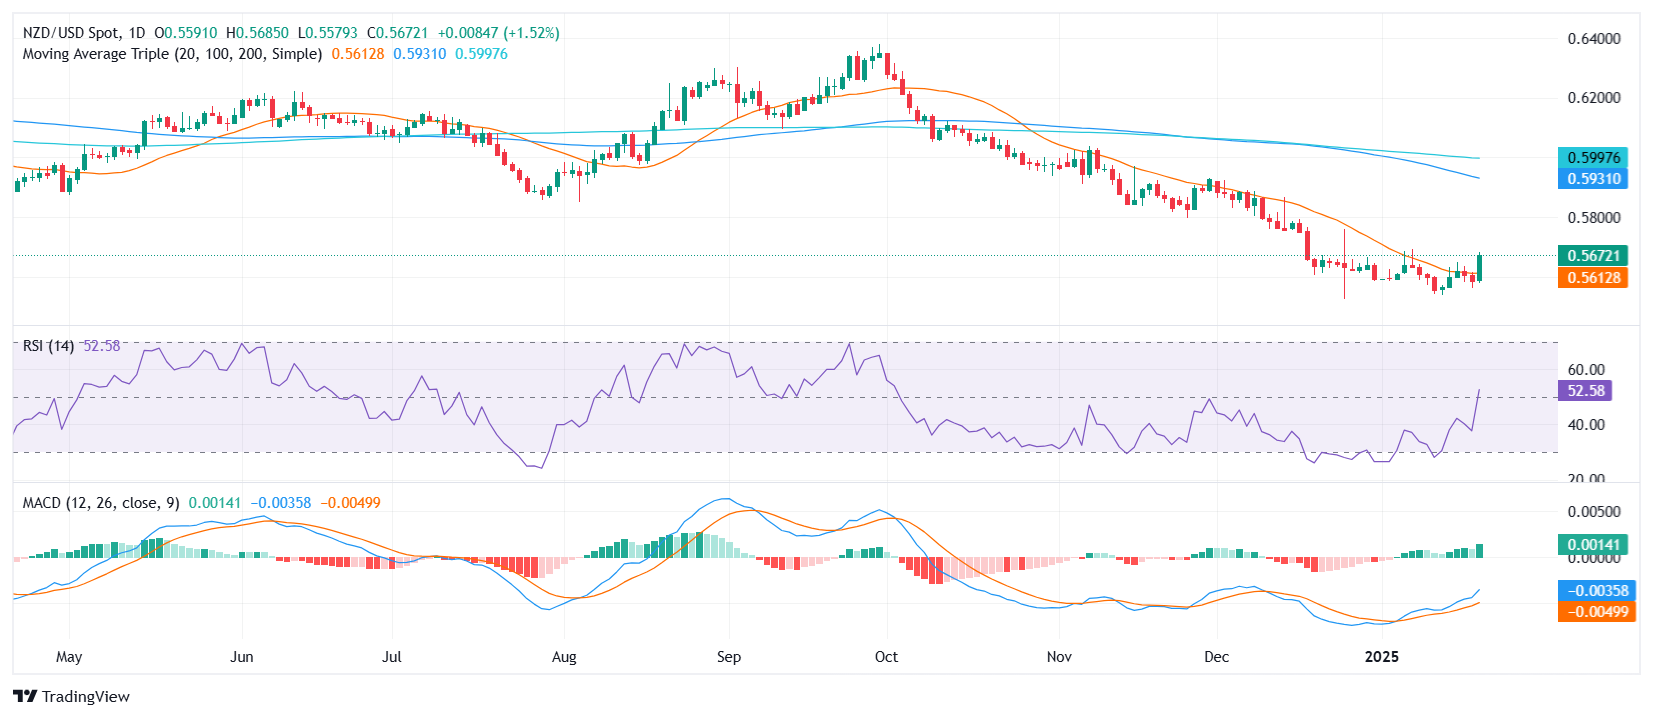
NZD/USD rallied on Monday, notching a 1.65% advance to settle around the 0.5675 mark. This robust performance comes amid a notable shift in sentiment, with traders appearing more inclined to favor the Kiwi dollar after its recent stretch of subdued price action. The mood has turned convincingly bullish, supported by technical studies pointing to ongoing upside potential.
According to the Relative Strength Index (RSI), which has pushed up to 52 and crossed the 50 middle point, the pair still has room to extend its climb despite trending on the higher side of the scale. In the meantime, the Moving Average Convergence Divergence (MACD) histogram continues to print progressively taller green bars, confirming that buying pressure remains intact. Together, these indicators hint at a market biased toward additional gains in the near term.
On the immediate horizon, any pullback may initially target the 0.5650 region, with stronger support near 0.5620 if the pair faces stronger selling. To the upside, a break beyond 0.5700 could open the door toward 0.5730, further reinforcing the pair’s shift in favor of the bulls.
NZD/USD daily chart
-
22:45
New Zealand Electronic Card Retail Sales (MoM) climbed from previous 0% to 2% in December
-
22:45
New Zealand Electronic Card Retail Sales (YoY) climbed from previous -2.3% to -1% in December
-
22:35
New Zealand Business NZ PSI declined to 47.9 in December from previous 49.5
-
22:00
South Korea Producer Price Index Growth (MoM) climbed from previous 0.1% to 0.3% in December
-
22:00
South Korea Producer Price Index Growth (YoY) increased to 1.7% in December from previous 1.4%
-
21:59
Australian Dollar climbs as USD slides following Trump inauguration speech
- Aussie pair surges 1% to 0.6255 on Monday.
- Trump administration unveils a measured approach to tariffs.
- Softer USD underpins global equities, bolstering risk appetite.
The marked sell-off in the US Dollar on Monday paved the way for the AUD/USD to gain notable momentum, allowing it to reach multi-day peaks just below the 0.6300 threshold at the start of the week. The movement was part and parcel of markets digesting Donald Trump’s inauguration speech signals. This sharp rally came despite lingering questions over the Reserve Bank of Australia’s (RBA) policy path and mixed domestic fundamentals, highlighting the influence of a broadly weaker Greenback on high-beta currencies like the Aussie.
Daily digest market movers: Aussie recovers mainly due to a softer USD
- The Aussie is gaining traction as the US Dollar loses traders’ interest at the start of the week. The US Dollar Index revisited levels beneath 108.00 on Monday, reflecting a pronounced bout of risk-on sentiment.
- Following his inauguration, President Donald Trump directed federal agencies to examine persistent trade imbalances and consider corrective actions — particularly toward nations like China, Canada and Mexico, although a taskforce will first evaluate potential tariffs.
- Global stocks hold firm, buoyed by hopes that the new administration’s initially measured stance on trade may avert major upheavals.
- Market speculation concerning a Fed rate cut by mid-year grows with the CME FedWatch Tool assigning a 55% chance to a hold in May before a possible move by June.
- On the local front, the Aussie may suffer from a mixed economic outlook, or if the RBA eventually gives hints that it will start cutting rates in Q1 of 2025.
AUD/USD technical outlook: Bulls eye higher ground amid choppy swings
The AUD/USD pair jumped by 1% to 0.6255 on Monday, extending its recovery from previous setbacks. The Moving Average Convergence Divergence (MACD) histogram continues printing green bars, hinting at building bullish momentum.
Meanwhile, the Relative Strength Index (RSI) stands in the upper 50s near 59, having climbed sharply and reinforcing a positive tone. If the pair can consolidate above the mid-0.6200s, it could set its sights on the psychological 0.6300 barrier, although persistent policy and growth concerns may still temper any further upside.
Australian Dollar FAQs
One of the most significant factors for the Australian Dollar (AUD) is the level of interest rates set by the Reserve Bank of Australia (RBA). Because Australia is a resource-rich country another key driver is the price of its biggest export, Iron Ore. The health of the Chinese economy, its largest trading partner, is a factor, as well as inflation in Australia, its growth rate and Trade Balance. Market sentiment – whether investors are taking on more risky assets (risk-on) or seeking safe-havens (risk-off) – is also a factor, with risk-on positive for AUD.
The Reserve Bank of Australia (RBA) influences the Australian Dollar (AUD) by setting the level of interest rates that Australian banks can lend to each other. This influences the level of interest rates in the economy as a whole. The main goal of the RBA is to maintain a stable inflation rate of 2-3% by adjusting interest rates up or down. Relatively high interest rates compared to other major central banks support the AUD, and the opposite for relatively low. The RBA can also use quantitative easing and tightening to influence credit conditions, with the former AUD-negative and the latter AUD-positive.
China is Australia’s largest trading partner so the health of the Chinese economy is a major influence on the value of the Australian Dollar (AUD). When the Chinese economy is doing well it purchases more raw materials, goods and services from Australia, lifting demand for the AUD, and pushing up its value. The opposite is the case when the Chinese economy is not growing as fast as expected. Positive or negative surprises in Chinese growth data, therefore, often have a direct impact on the Australian Dollar and its pairs.
Iron Ore is Australia’s largest export, accounting for $118 billion a year according to data from 2021, with China as its primary destination. The price of Iron Ore, therefore, can be a driver of the Australian Dollar. Generally, if the price of Iron Ore rises, AUD also goes up, as aggregate demand for the currency increases. The opposite is the case if the price of Iron Ore falls. Higher Iron Ore prices also tend to result in a greater likelihood of a positive Trade Balance for Australia, which is also positive of the AUD.
The Trade Balance, which is the difference between what a country earns from its exports versus what it pays for its imports, is another factor that can influence the value of the Australian Dollar. If Australia produces highly sought after exports, then its currency will gain in value purely from the surplus demand created from foreign buyers seeking to purchase its exports versus what it spends to purchase imports. Therefore, a positive net Trade Balance strengthens the AUD, with the opposite effect if the Trade Balance is negative.
-
21:34
Gold prices edge higher as Trump assumes Presidency
- Gold rises as US Dollar dips to nine-day low during Trump's inauguration speech.
- Trump declares a national emergency on energy and immigration, aiming to reshape US policies.
- Upcoming US Jobless Claims and Flash PMIs expected to provide direction for the US economy.
Gold prices climbed moderately on Monday amid thin liquidity conditions after Donald Trump was sworn in as the 47th President of the United States (US). The Greenback weakened during his speech as he set aside his aggressive tariff policies, which could stoke inflation and prevent the Federal Reserve (Fed) from easing policy. At the time of writing, XAU/USD trades at $2,709, up 0.27%.
US President Donald Trump declared a national emergency on energy and at the southern border to overhaul energy and immigration policies. The former is aimed at filling up strategic reserves and exporting American oil, while the immigration policy proposes to return millions of “criminal aliens to the places from which they came.”
In the meantime, his speech eased his rhetoric on trade, but an article in The Wall Street Journal mentioned the issuance of a broad memorandum that directs federal agencies to study trade policies and evaluate US trading relationships with China, Canada and Mexico.
The US Dollar weakened to a nine-day low during the inauguration speech, according to the US Dollar Index (DXY), which measures the buck’s performance against a basket of peers. The DXY tumbled to 107.95 before matching those earlier losses and recovering above the 108.00 figure.
This week, the US economic docket will feature Initial Jobless Claims data, S&P Global Flash PMIs and housing data.
Daily digest market movers: Gold price ticks higher amid weaker US Dollar
- Gold fell as real yields edged lower one basis point on Friday. Measured by the 10-year Treasury Inflation-Protected Securities (TIPS) yield, it was virtually unchanged at 2.20%.
- The US 10-year Treasury bond yield was unchanged at 4.611%, which halted the advance in Gold.
- Geopolitical risks had eased amid a ceasefire in the Middle East, with Hamas releasing three female hostages in exchange for 90 Palestinians held in Israeli prisons, reported Reuters.
- Market participants are pricing in near-even odds that the Fed will cut rates twice by the end of 2025, with the first reduction occurring in June.
XAU/USD technical outlook: Gold price consolidates above $2,700
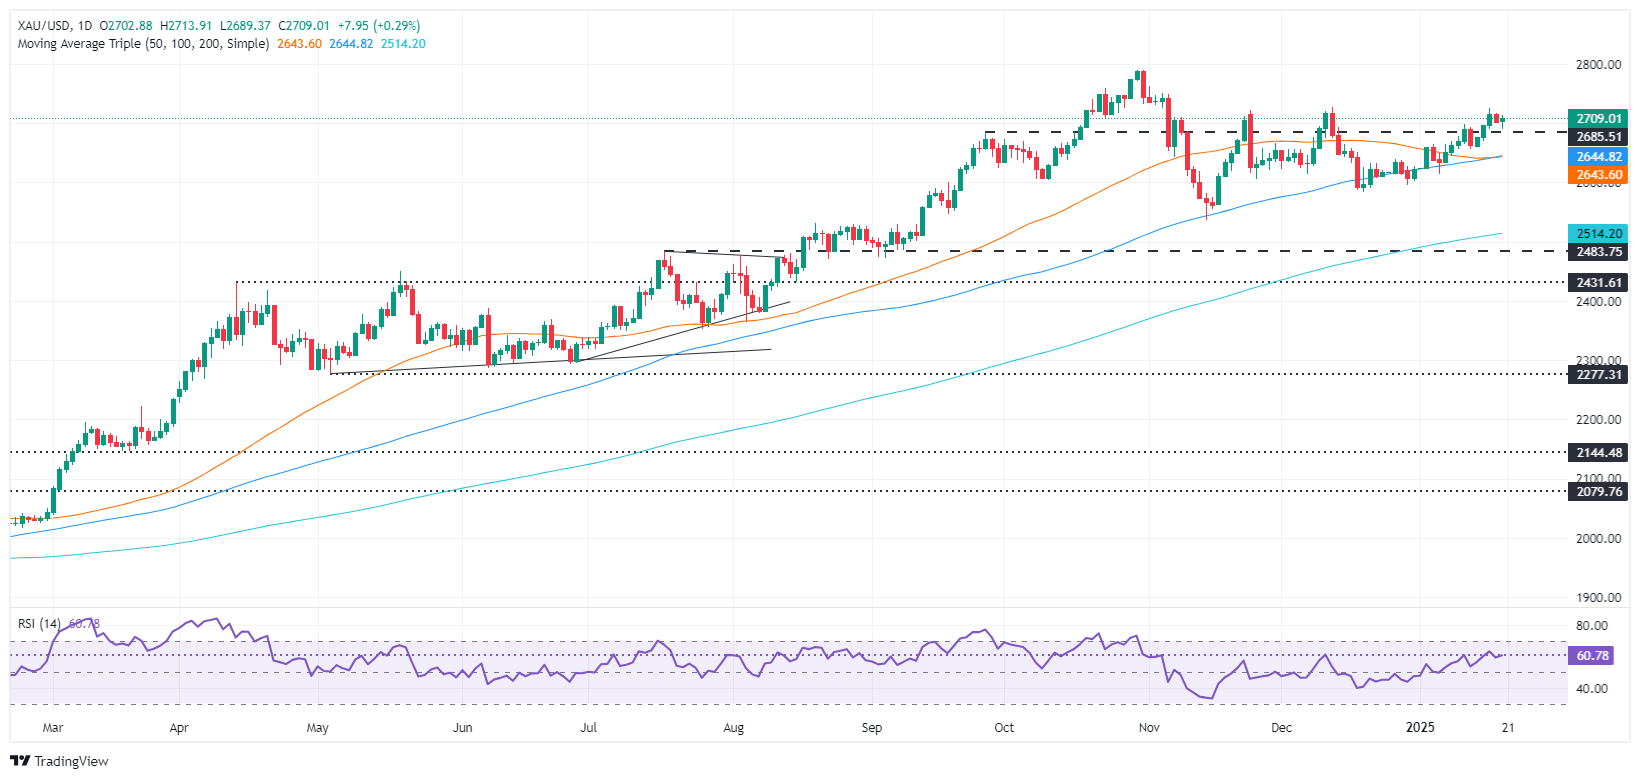
Gold price remains sideways trading, yet above the $2,700 mark but unable to crack the December 12 daily high of $2,725 which would clear the path for buyers to test the psychological $2,750 figure. If those levels are surpassed, Gold could aim towards the record high at $2,790 ahead of $2,800.
Conversely, if sellers drive XAU/USD below $2,700, the first support would be the January 13 swing low of $2,656, followed by the confluence of the 50 and 100-day Simple Moving Averages (SMAs) at $2,642 - $2,644.
Gold FAQs
Gold has played a key role in human’s history as it has been widely used as a store of value and medium of exchange. Currently, apart from its shine and usage for jewelry, the precious metal is widely seen as a safe-haven asset, meaning that it is considered a good investment during turbulent times. Gold is also widely seen as a hedge against inflation and against depreciating currencies as it doesn’t rely on any specific issuer or government.
Central banks are the biggest Gold holders. In their aim to support their currencies in turbulent times, central banks tend to diversify their reserves and buy Gold to improve the perceived strength of the economy and the currency. High Gold reserves can be a source of trust for a country’s solvency. Central banks added 1,136 tonnes of Gold worth around $70 billion to their reserves in 2022, according to data from the World Gold Council. This is the highest yearly purchase since records began. Central banks from emerging economies such as China, India and Turkey are quickly increasing their Gold reserves.
Gold has an inverse correlation with the US Dollar and US Treasuries, which are both major reserve and safe-haven assets. When the Dollar depreciates, Gold tends to rise, enabling investors and central banks to diversify their assets in turbulent times. Gold is also inversely correlated with risk assets. A rally in the stock market tends to weaken Gold price, while sell-offs in riskier markets tend to favor the precious metal.
The price can move due to a wide range of factors. Geopolitical instability or fears of a deep recession can quickly make Gold price escalate due to its safe-haven status. As a yield-less asset, Gold tends to rise with lower interest rates, while higher cost of money usually weighs down on the yellow metal. Still, most moves depend on how the US Dollar (USD) behaves as the asset is priced in dollars (XAU/USD). A strong Dollar tends to keep the price of Gold controlled, whereas a weaker Dollar is likely to push Gold prices up.
-
21:29
Crude Oil takes a knee for a third straight day, WTI taps $76
- Crude Oil markets eased for a third consecutive trading day.
- Monday sees further price declines in fossil fuel barrels.
- US production growth is expected to continue slowing.
West Texas Intermediate (WTI) Crude Oil prices eased for a third straight session on Monday, kicking off the new trading week with a fresh test of the $76/bbl handle. Despite newly-minted President Donald Trump’s insistence that he’s going to create a mandate that will push US Crude Oil producers to ramp up production, slowing growth in that exact space remains subdued as energy producers focus on returning profits to investors instead of going broke on behalf of the US government.
Despite lofty promises from the new US administration, major financial institutions are bracing for Crude Oil prices to continue easing moving forward. Median forecasts are predicting WTI barrel bids will sink to below $60 per barrel by the halfway point of President Donald Trump’s term. Global demand continues to undershoot lofty expectations that were set in 2023 and 2024, and investors are scrambling to walk back their expectations of global demand for energy that has thus far failed to materialize, specifically in mainland China despite the country perfectly nailing overall economic growth mandates established by the government, almost to a suspicious degree.
Crude Oil price forecast
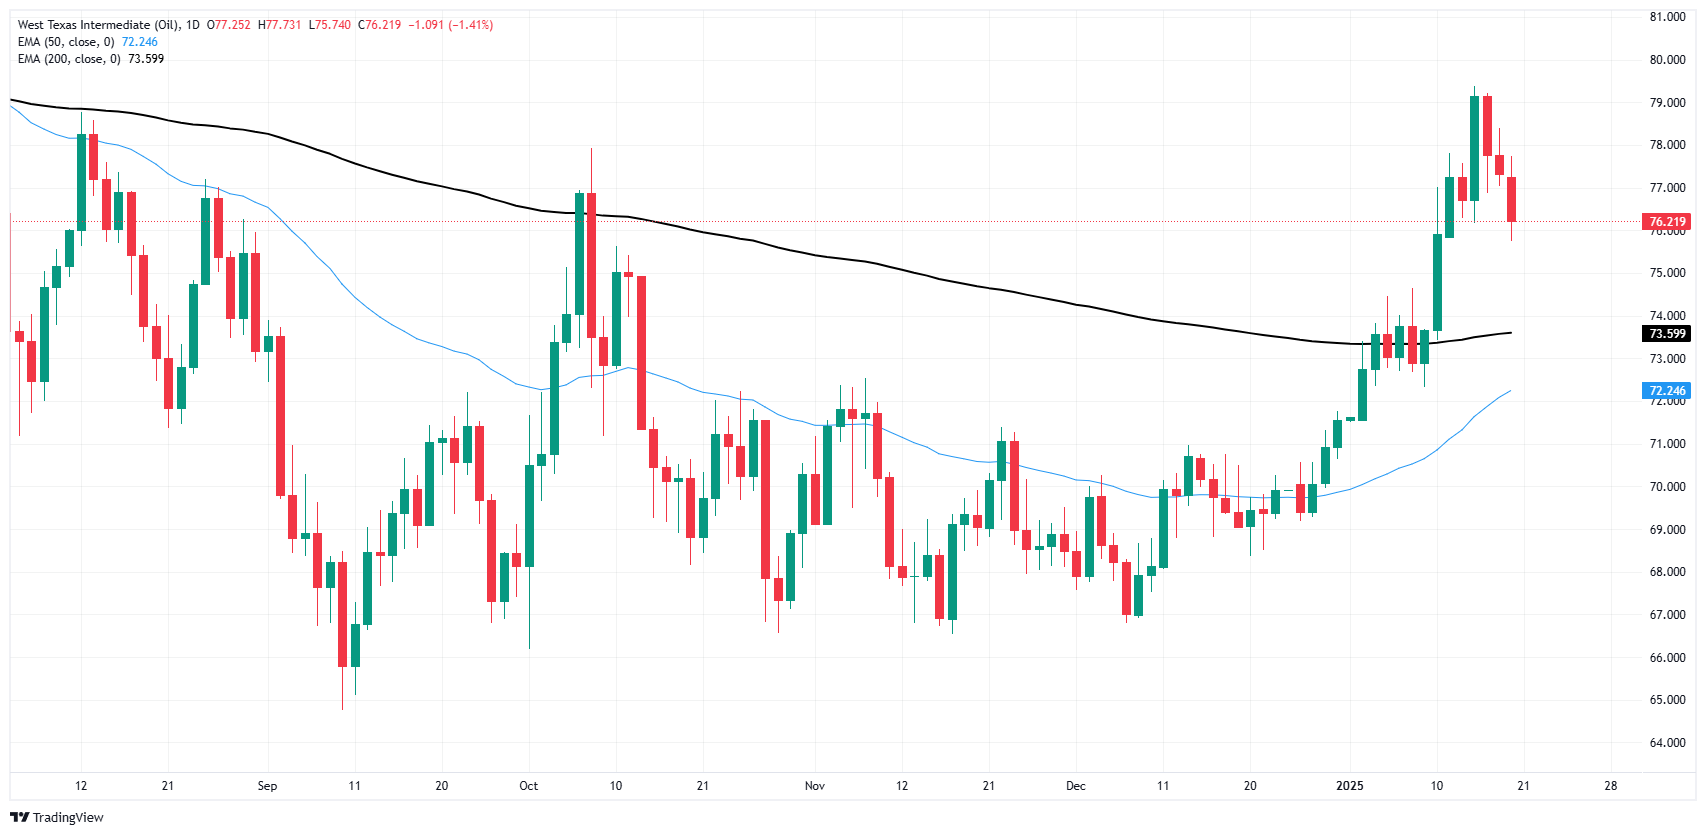
After spending most of the fourth quarter battling it out in a rough technical range cycling the $69.00 handle, WTI prices surged to kick off the 2025 trading season, peaking a little over $79.00 per barrel. US Crude Oil bidding action has eased off the pedal, capping gains and chalking in a three-day losing streak as price action falls back toward the 200-day Exponential Moving Average (EMA) near $73.50.
Despite a near-term swing into a pattern of higher lows, a lack of a sustained pullback and ongoing bullish momentum means 2025’s early bull action could run out of runway and snap back into the low side. The 50-day EMA still remains physically below the 200-day EMA, and a lack of a meaningful crossover of the two key MAs could leave bears open for a chance to take another leg lower.
WTI daily chart
WTI Oil FAQs
WTI Oil is a type of Crude Oil sold on international markets. The WTI stands for West Texas Intermediate, one of three major types including Brent and Dubai Crude. WTI is also referred to as “light” and “sweet” because of its relatively low gravity and sulfur content respectively. It is considered a high quality Oil that is easily refined. It is sourced in the United States and distributed via the Cushing hub, which is considered “The Pipeline Crossroads of the World”. It is a benchmark for the Oil market and WTI price is frequently quoted in the media.
Like all assets, supply and demand are the key drivers of WTI Oil price. As such, global growth can be a driver of increased demand and vice versa for weak global growth. Political instability, wars, and sanctions can disrupt supply and impact prices. The decisions of OPEC, a group of major Oil-producing countries, is another key driver of price. The value of the US Dollar influences the price of WTI Crude Oil, since Oil is predominantly traded in US Dollars, thus a weaker US Dollar can make Oil more affordable and vice versa.
The weekly Oil inventory reports published by the American Petroleum Institute (API) and the Energy Information Agency (EIA) impact the price of WTI Oil. Changes in inventories reflect fluctuating supply and demand. If the data shows a drop in inventories it can indicate increased demand, pushing up Oil price. Higher inventories can reflect increased supply, pushing down prices. API’s report is published every Tuesday and EIA’s the day after. Their results are usually similar, falling within 1% of each other 75% of the time. The EIA data is considered more reliable, since it is a government agency.
OPEC (Organization of the Petroleum Exporting Countries) is a group of 12 Oil-producing nations who collectively decide production quotas for member countries at twice-yearly meetings. Their decisions often impact WTI Oil prices. When OPEC decides to lower quotas, it can tighten supply, pushing up Oil prices. When OPEC increases production, it has the opposite effect. OPEC+ refers to an expanded group that includes ten extra non-OPEC members, the most notable of which is Russia.
-
20:40
US President Donald Trump vows to “take back” Panama Canal in inauguration speech
In his first public appearance as the freshly-declared President of the United States, Donald Trump has reiterated several of his sweeping campaign claims and promises, including seizing control of the Panama Canal, as well as establish an "external revenue service" which will ostensibly be responsible for collecting profits from tariffs his administration intends to impose. Donald Trump also reiterated his promise to refill the US' Strategic Oil Reserve, a commodity stockpile that President Trump famously dipped into during his first term in a bid to shore up a massive funding shortfall in the US government budget caused by lopsided tax cuts which crimped federal funding revenues.
Key highlights
Trump directs US agencies to take emergency measures to reduce the cost of living.
Trump: I will sign a series of executive orders today.
Trump: I will direct the cabinet to defeat record inflation.
Trump: I will also declare a national energy emergency today.
Trump: I will fill strategic reserves again and export American energy all over the world.
Trump: I will revoke the EV mandate.
Trump: I will begin an overhaul of trade system.
Trump: I will tariff and tax foreign countries to enrich our citizens.
Trump: We will establish an external revenue service.
Trump: We will establish a department of government efficiency.
Trump will withdraw from the Paris climate accord
Trump: We will take back Panama canal.
-
20:00
Argentina Trade Balance (MoM) came in at $1666M, above forecasts ($900M) in December
-
19:42
US Dollar slips below key levels as market eyes Trump policy plans
- Many investors lock in profits as trade tensions linger and bond markets pause on the holiday.
- Early signals from the incoming US administration suggest a methodical approach to tariffs and fiscal expansion.
- Upcoming data-dependent Federal Reserve decisions remain in focus with May seen as pivotal for any policy shifts.
The US Dollar is in choppy trading after President-elect Donald Trump’s inauguration. Trading floors in the US will remain closed due to Martin Luther King, Jr. Day, but the US Dollar Index (DXY) plunged toward 108.30 with uncertainty ahead as markets await further details on Trump’s economic plans.
Daily digest market movers: USD sees red on delayed tariff signals
- Policy changes hinge on discussions in Washington: According to multiple sources, the new administration will establish a taskforce to investigate potential tariff impacts on Canada, Mexico and China before implementing any broad measures.
- In fact, during his inaugural speech Donald Trump flirted with the idea of a tariff plan on the mentioned countries but with no specific details.
- Holiday closure slows market action with the US bond market shut down. The 10-year yield holds near 4.60%. Traders will keep watch on Tuesday for fresh signals regarding inflation concerns and interest rate moves.
- CME FedWatch Tool indicates that a hold is priced in for this month’s Federal Reserve meeting, and there are high odds of another hold in May.
DXY technical outlook: 20-day SMA cracks, downside risk builds
The US Dollar Index lost key traction below 109.00 as profit-taking and tempered bond yields took their toll. The breach of the 20-day Simple Moving Average (SMA) near 108.50 underscores rising vulnerability for the Greenback.
Should buying interest fail to emerge, the DXY’s broader uptrend could face a more pronounced setback. Nonetheless, expectations of continued US economic outperformance may eventually attract fresh bids, keeping markets on alert for any policy-driven reversals.
US Dollar FAQs
The US Dollar (USD) is the official currency of the United States of America, and the ‘de facto’ currency of a significant number of other countries where it is found in circulation alongside local notes. It is the most heavily traded currency in the world, accounting for over 88% of all global foreign exchange turnover, or an average of $6.6 trillion in transactions per day, according to data from 2022. Following the second world war, the USD took over from the British Pound as the world’s reserve currency. For most of its history, the US Dollar was backed by Gold, until the Bretton Woods Agreement in 1971 when the Gold Standard went away.
The most important single factor impacting on the value of the US Dollar is monetary policy, which is shaped by the Federal Reserve (Fed). The Fed has two mandates: to achieve price stability (control inflation) and foster full employment. Its primary tool to achieve these two goals is by adjusting interest rates. When prices are rising too quickly and inflation is above the Fed’s 2% target, the Fed will raise rates, which helps the USD value. When inflation falls below 2% or the Unemployment Rate is too high, the Fed may lower interest rates, which weighs on the Greenback.
In extreme situations, the Federal Reserve can also print more Dollars and enact quantitative easing (QE). QE is the process by which the Fed substantially increases the flow of credit in a stuck financial system. It is a non-standard policy measure used when credit has dried up because banks will not lend to each other (out of the fear of counterparty default). It is a last resort when simply lowering interest rates is unlikely to achieve the necessary result. It was the Fed’s weapon of choice to combat the credit crunch that occurred during the Great Financial Crisis in 2008. It involves the Fed printing more Dollars and using them to buy US government bonds predominantly from financial institutions. QE usually leads to a weaker US Dollar.
Quantitative tightening (QT) is the reverse process whereby the Federal Reserve stops buying bonds from financial institutions and does not reinvest the principal from the bonds it holds maturing in new purchases. It is usually positive for the US Dollar.
-
19:39
Forex Today: The UK jobs report takes centre stage
The US Dollar kicked off the new trading week sharply on the defensive as market participants closely followed President Trump’s Inauguration Day amid the inactivity in the US markets due to the MLK Jr. Day.
Here is what you need to know on Tuesday, January 21:
The US Dollar Index (DXY) accelerated its decline and receded to new two-week lows in the sub108.00 region on Monday. Absent relevant data releases on Tuesday, investors are expected to remain focused on announcements from the Trump administration.
EUR/USD climbed strongly and hit two-week peaks just beyond 1.0400 the figure in response to the generalised bid bias in the risk-associated universe. The Economic Sentiment tracked by the ZEW Institute in Germany and the broader Euroland are due, along with an ECOFIN meeting.
GBP/USD reclaimed the area above the key 1.2300 barrier in reponse to the intense sell-off in the Greenback on Monday. The main attraction in the FX world will be the publication of the UK labour market report.
Further repricing of rate hikes by the BoJ lent support to the Japanese yen and sparked a deeper retracement in USD/JPY, this time approaching the 155.00 mark. The Balance of Trade results will be the next salient event in Japan on January 23 seconded by weekly Foreign Bond Investment figures.
Surprisingly, AUD/USD traded on the defensive on Thursday, briefly breaking below the 0.6200 support despite the inconclusive Dollar and a solid jobs report in Oz. Next on tap Down Under will be the release of the Westpac Leading Index in December.
Prices of WTI sold off to multi-day lows and pierced the $76.00 mark per barrel as traders kept weighing potential developments from the Trump administration.
Prices of Gold resumed their move higher on Monday, maintaining the trade above the key $2,700 mark per ounce troy. Silver prices met support around the key 200-day SMA amid quite a positive start to the week.
-
18:55
Canadian Dollar lurches higher on easing market tensions
- The Canadian Dollar traded nearly 1.5% higher at its peak on Monday.
- Canada’s latest BoC outlook reveals nothing particularly noteworthy.
- The Loonie is benefiting from a broad-market easing in the Greenback.
The Canadian Dollar (CAD) caught a rare boost on Monday, dragging USD/CAD back below 1.4400 as investors across the globe find some risk appetite after incoming US President Donald Trump made a last-minute swerve to avoid day-one tariffs via executive order.
The Bank of Canada’s (BoC) latest Business Outlook Survey revealed few surprises, with overall economic sentiment remaining subdued. However, the BoC did note that the overall depth of bearish sentiment appears to be shallowing, with slightly fewer businesses and consumers expecting a recession in the next year.
Daily digest market movers: Canadian Dollar gets a bid as Greenback softens on upbeat market sentiment
- The Canadian Dollar bounced after tapping a fresh 5-year low against the US Dollar.
- Markets opened up the spigots after it was announced that newly-minted US President Donald Trump would not be imposing sweeping day-one tariffs of at least 20% on all of the US’ major trading partners at the same time.
- According to the BoC, only 46.5% of consumers in Q4 expect a recession in the next 12 months, down from Q3’s 49%. 15% of Canadian businesses also expect a recession in the next year, down slightly from 16%.
- Despite the overall easing in recession concerns, Canadian hiring expectations remain soft, and most firms expect someone else to pick up the tab for the forecast increases in consumer spending.
- Canadian firms remain uncertain about the economy’s future in the face of the incoming Trump administration, who have a track record littered with bizarre economic claims and equally-bizarre trade policies.
Canadian Dollar price forecast
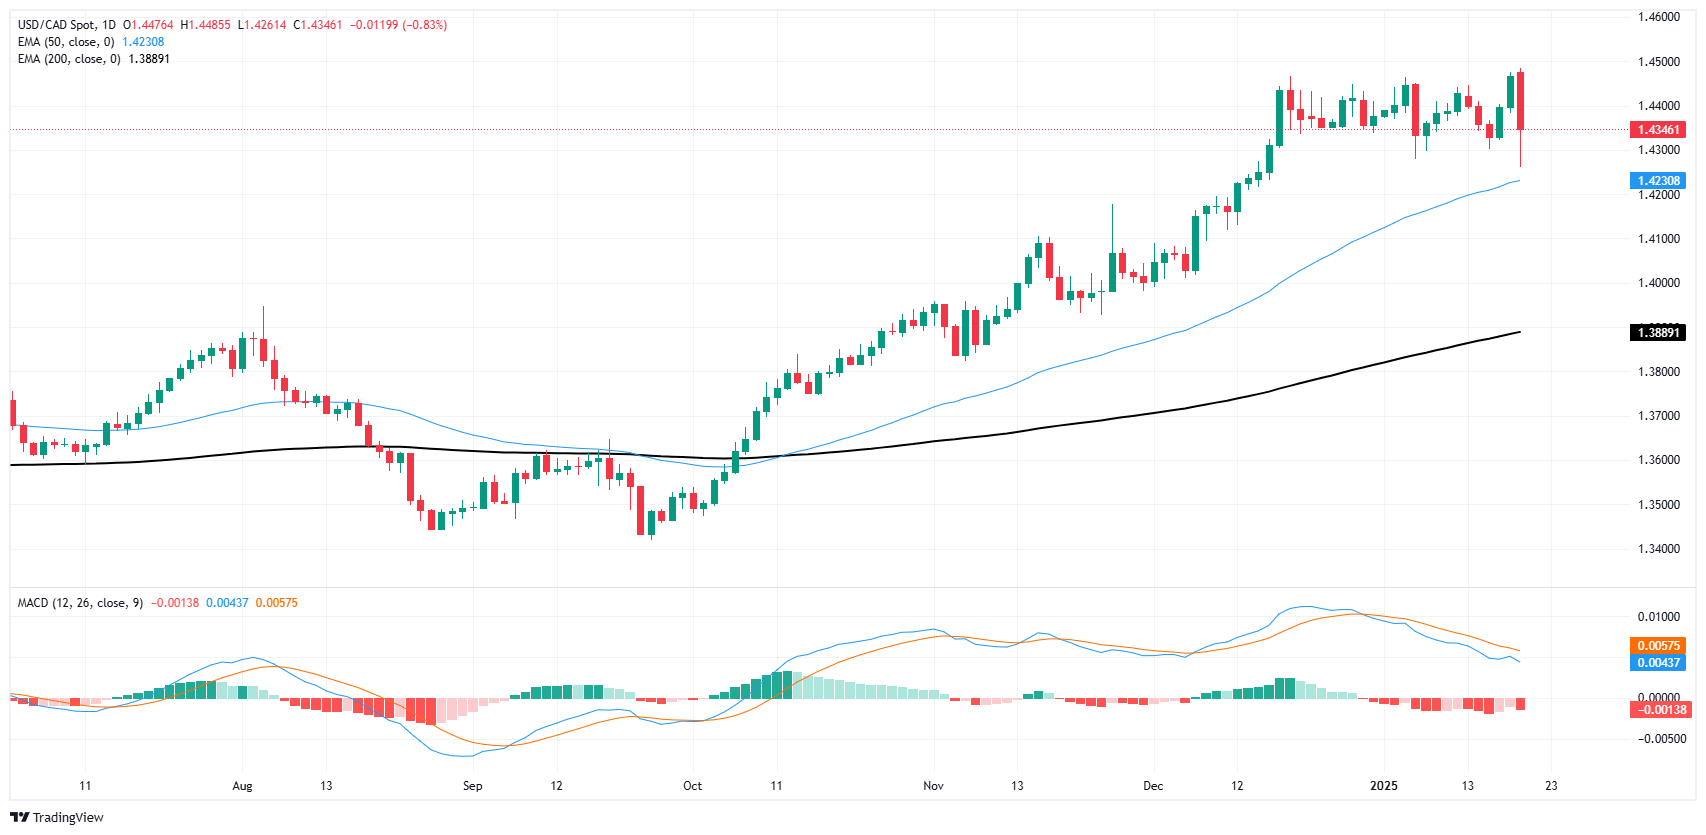
The Canadian Dollar (CAD) found a much-needed bid on Monday, even if it was sparked entirely by outside sources. Markets flows reversed direction out of the US Dollar to kick off the new trading week, sending USD/CAD down back below the 1.4400 handle and inching price action back toward the 50-day Exponential Moving Average (EMA) near 1.4230.
The pair has been trading in a rough range between 1.4400 and 1.4300 since rising into a multi-year high back in December. Loonie traders are looking for reasons to buy after a long, one-sided grind that saw the CAD shed nearly 8% top-to-bottom over a four-month period. However, technical oscillators are beginning to ease out of overbought territory, and a notable lack of progress in building the Canadian Dollar back up against the Greenback could send USD/CAD spiraling into fresh highs.
USD/CAD daily chart
Canadian Dollar FAQs
The key factors driving the Canadian Dollar (CAD) are the level of interest rates set by the Bank of Canada (BoC), the price of Oil, Canada’s largest export, the health of its economy, inflation and the Trade Balance, which is the difference between the value of Canada’s exports versus its imports. Other factors include market sentiment – whether investors are taking on more risky assets (risk-on) or seeking safe-havens (risk-off) – with risk-on being CAD-positive. As its largest trading partner, the health of the US economy is also a key factor influencing the Canadian Dollar.
The Bank of Canada (BoC) has a significant influence on the Canadian Dollar by setting the level of interest rates that banks can lend to one another. This influences the level of interest rates for everyone. The main goal of the BoC is to maintain inflation at 1-3% by adjusting interest rates up or down. Relatively higher interest rates tend to be positive for the CAD. The Bank of Canada can also use quantitative easing and tightening to influence credit conditions, with the former CAD-negative and the latter CAD-positive.
The price of Oil is a key factor impacting the value of the Canadian Dollar. Petroleum is Canada’s biggest export, so Oil price tends to have an immediate impact on the CAD value. Generally, if Oil price rises CAD also goes up, as aggregate demand for the currency increases. The opposite is the case if the price of Oil falls. Higher Oil prices also tend to result in a greater likelihood of a positive Trade Balance, which is also supportive of the CAD.
While inflation had always traditionally been thought of as a negative factor for a currency since it lowers the value of money, the opposite has actually been the case in modern times with the relaxation of cross-border capital controls. Higher inflation tends to lead central banks to put up interest rates which attracts more capital inflows from global investors seeking a lucrative place to keep their money. This increases demand for the local currency, which in Canada’s case is the Canadian Dollar.
Macroeconomic data releases gauge the health of the economy and can have an impact on the Canadian Dollar. Indicators such as GDP, Manufacturing and Services PMIs, employment, and consumer sentiment surveys can all influence the direction of the CAD. A strong economy is good for the Canadian Dollar. Not only does it attract more foreign investment but it may encourage the Bank of Canada to put up interest rates, leading to a stronger currency. If economic data is weak, however, the CAD is likely to fall.
-
18:45
Mexican Peso rises amid delayed Trump tariffs
- Mexican Peso strengthens on news of a postponed tariff plan by the incoming Trump administration.
- The upcoming US-Mexico border emergency declaration could reintroduce tension, impacting Peso's trajectory.
- Banxico's Deputy Governor Heath suggests a dovish inflation stance, manageable without excessive tightening.
The Mexican Peso (MXN) rallied against the US Dollar (USD) on Monday ahead of United States (US) President Donald Trump's inauguration. An article in The Wall Street Journal suggested that tariffs would not be imposed immediately after Trump’s oath as the 47th President of the US. The USD/MXN trades at 20.53, down over 1.20% after reaching a daily peak of 20.89.
The market mood remains slightly positive as investors prepare for Trump's inauguration. The WSJ article mentioned that Trump directed federal agencies to “investigate and remedy persistent trade deficits and address unfair trade and currency policies by other nations.” Moreover, the presidential memo suggests that Trump’s administration would focus directly on China, Canada and Mexico.
In the meantime, once President Trump takes office, he is expected to declare a national emergency on the US-Mexico border, which could weigh on the Mexican Peso as tensions arise in both countries.
Aside from this, Banco de Mexico (Banxico) Deputy Governor Jonathan Heath was dovish, saying that headline and core inflation figures may hit 4% in January, adding that the Central Bank “does not need to exaggerate a restrictive posture.”
In a post in X, Heath noted that the December inflation report was “good news since it is the first time (inflation) comes below the 4.26% logged in October 2023.”
This week, Mexico’s economic docket will feature Retail Sales, mid-month Inflation and a proxy for November's Gross Domestic Product (GDP) Economic Activity.
Daily digest market movers: Mexican Peso climbs ahead of inflation data
- The Mexican Peso could take a breather if Trump does not impose tariffs immediately on Mexican imports.
- However, the Mexican currency is not out of the woods. The divergence between the Banco de Mexico (Banxico) and the Federal Reserve (Fed) hints that further upside in USD/MXN lies ahead.
- Mexico’s Retail Sales in November plunged to 0.3% MoM and 1.2% YoY.
- Mid-month inflation in January is foreseen to drop from 4.44% to 3.93%. Underlying inflation is expected to rise modestly from 3.62% to 3.69%.
- Economists polled by Reuters revealed that GDP will grow 1.2% in 2025, compared to 1.6% last year. Additionally, they foresee Banco de Mexico (Banxico) cutting interest rates by at least 150 basis points to 8.50% by the end of the year.
- In the Fed’s latest Summary of Economic Projections (SEP), officials estimate they will cut interest rates by 50 basis points.
- Money market futures had priced in 42.5 bps of Fed rate cuts in 2025, according to CME FedWatch Tool data.
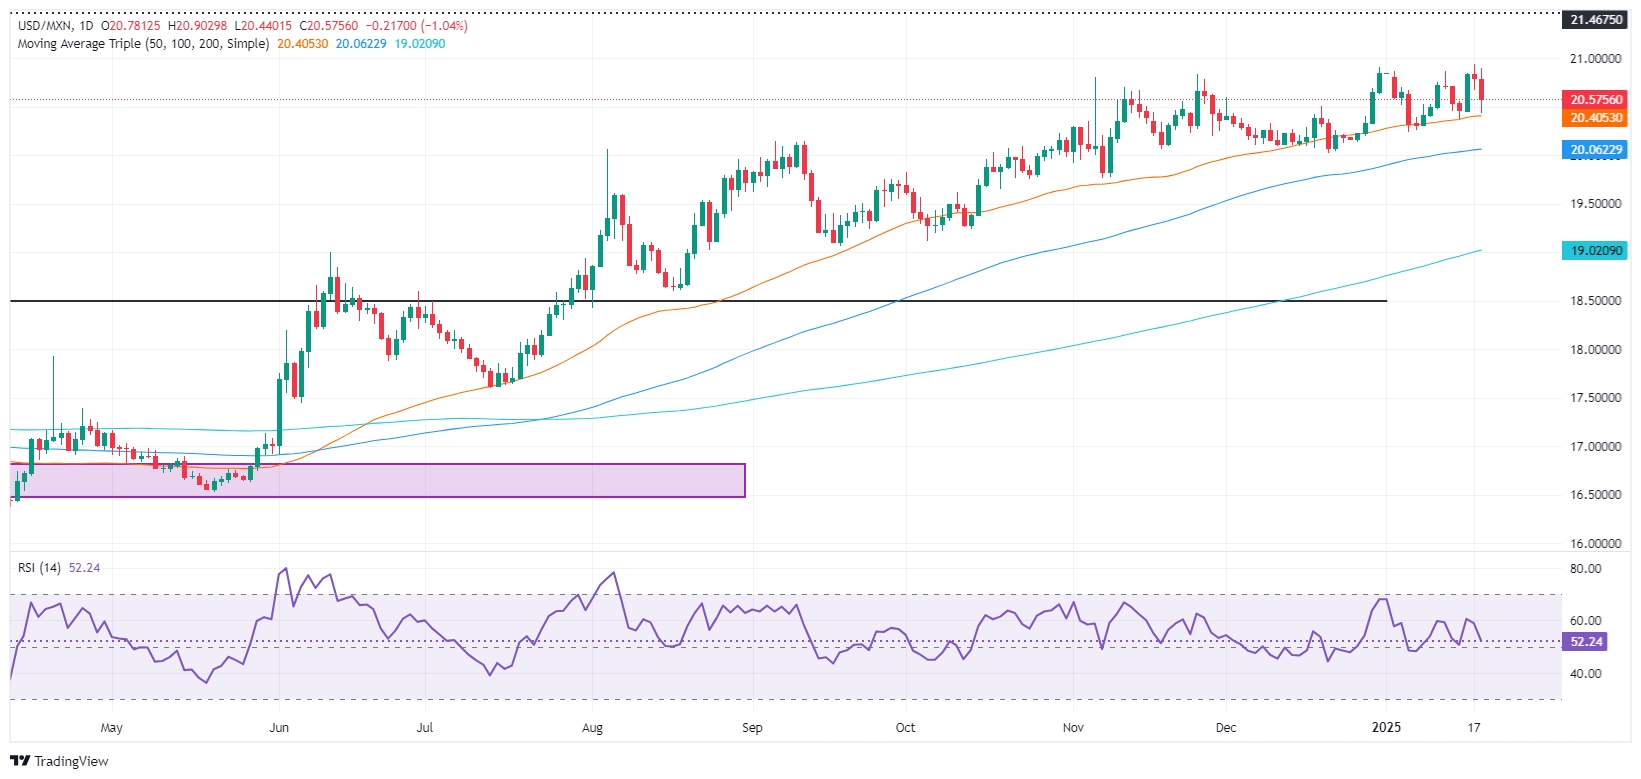
USD/MXN technical outlook: Mexican Peso rises as USD/MXN dips below 20.80
The USD/MXN uptrend remains intact despite the ongoing pullback, which saw the exotic pair reach a daily low of 20.43 near the 50-day Simple Moving Average (SMA) at 20.38 before recovering some ground.
If USD/MXN climbs above the year-to-date (YTD) high of 20.94, it will clear the path to challenge the 21.00 psychological barrier. Once surpassed, the next resistance will be the March 8, 2022 peak at 21.46, followed by 21.50 and the 22.00 psychological level.
Conversely, if the pair tumbles below the 50-day SMA, the next support would be the 100-day SMA at 20.04, which is ahead of the 20.00 mark.
Mexican Peso FAQs
The Mexican Peso (MXN) is the most traded currency among its Latin American peers. Its value is broadly determined by the performance of the Mexican economy, the country’s central bank’s policy, the amount of foreign investment in the country and even the levels of remittances sent by Mexicans who live abroad, particularly in the United States. Geopolitical trends can also move MXN: for example, the process of nearshoring – or the decision by some firms to relocate manufacturing capacity and supply chains closer to their home countries – is also seen as a catalyst for the Mexican currency as the country is considered a key manufacturing hub in the American continent. Another catalyst for MXN is Oil prices as Mexico is a key exporter of the commodity.
The main objective of Mexico’s central bank, also known as Banxico, is to maintain inflation at low and stable levels (at or close to its target of 3%, the midpoint in a tolerance band of between 2% and 4%). To this end, the bank sets an appropriate level of interest rates. When inflation is too high, Banxico will attempt to tame it by raising interest rates, making it more expensive for households and businesses to borrow money, thus cooling demand and the overall economy. Higher interest rates are generally positive for the Mexican Peso (MXN) as they lead to higher yields, making the country a more attractive place for investors. On the contrary, lower interest rates tend to weaken MXN.
Macroeconomic data releases are key to assess the state of the economy and can have an impact on the Mexican Peso (MXN) valuation. A strong Mexican economy, based on high economic growth, low unemployment and high confidence is good for MXN. Not only does it attract more foreign investment but it may encourage the Bank of Mexico (Banxico) to increase interest rates, particularly if this strength comes together with elevated inflation. However, if economic data is weak, MXN is likely to depreciate.
As an emerging-market currency, the Mexican Peso (MXN) tends to strive during risk-on periods, or when investors perceive that broader market risks are low and thus are eager to engage with investments that carry a higher risk. Conversely, MXN tends to weaken at times of market turbulence or economic uncertainty as investors tend to sell higher-risk assets and flee to the more-stable safe havens.
-
16:49
EUR/GBP Price Analysis: Momentum extends as pair nears 0.8475
- EUR/GBP edges 0.23% higher on Monday, climbing to 0.8460 with an intraday high of 0.8475.
- RSI points to overbought conditions yet still allowing further upside.
- MACD histogram features rising green bars, confirming the pair’s sustained bullish momentum.
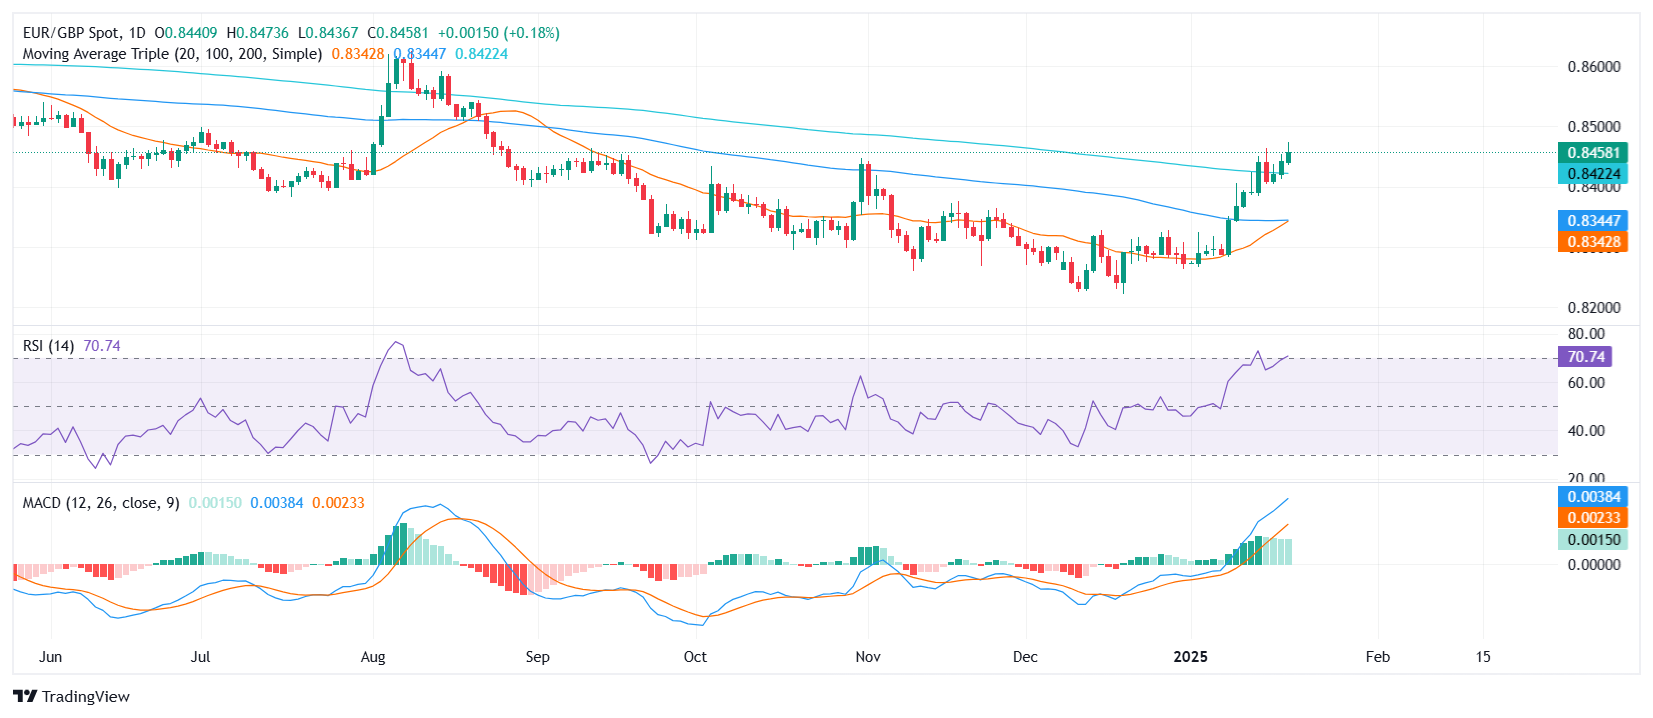
The EUR/GBP cross advanced further on Monday, reaching 0.8460 and briefly peaking at 0.8475. This steady push higher highlights ongoing buyer dominance, as the pair consolidates gains made in recent sessions. Overall sentiment remains tilted toward the upside, with no immediate sign of a pullback.
From a technical standpoint, the Relative Strength Index (RSI) has nudged up to 70, an indication of modestly overbought conditions that could still accommodate additional appreciation if buying persists. Meanwhile, the Moving Average Convergence Divergence (MACD) histogram continues to show expanding green bars, reinforcing the view that bullish forces are gathering pace.
Looking ahead, the pair may find initial resistance around the 0.8480–0.8500 zone, where sellers might begin to test the ongoing rally. On the downside, a slip beneath 0.8430 could open the door to 0.8400, potentially signaling a pause in the current uptrend if sellers gain traction.
EUR/GBP daily chart
-
16:05
USD/JPY weakens on BoJ hike speculation ahead of Trump’s inauguration
- USD/JPY could face pressure as Trump's inauguration nears, with potential impacts from protectionist policies.
- Speculation rises on BoJ rate hike from 0.25% to 0.50%, first since July 2024, lifting yen.
- Hawkish comments from BoJ Governor Ueda and Deputy Governor Himino suggest monetary tightening.
The Japanese Yen gained some ground compared to the US Dollar in early trading on Monday, ahead of US President Donald Trump’s inauguration. Speculations that the Bank of Japan (BoJ) will hike rates kept the USD/JPY lower, trading near 155.60, down over 0.44%.
USD/JPY dips to 155.60; markets anticipate a rate hikefrom BoJ
Interest rates in Japan remain among the lowest in the G8. According to money markets futures, the BoJ would likely increase borrowing costs from 0.25% to 0.50% on Friday, the first since July 2024.
Last week, BoJ Governor Kazuo Ueda and Deputy Governor Ryozo Himino delivered hawkish remarks, laying the ground for the January 23-24 meeting. The December meeting minutes showed that board members favored a rate increase.
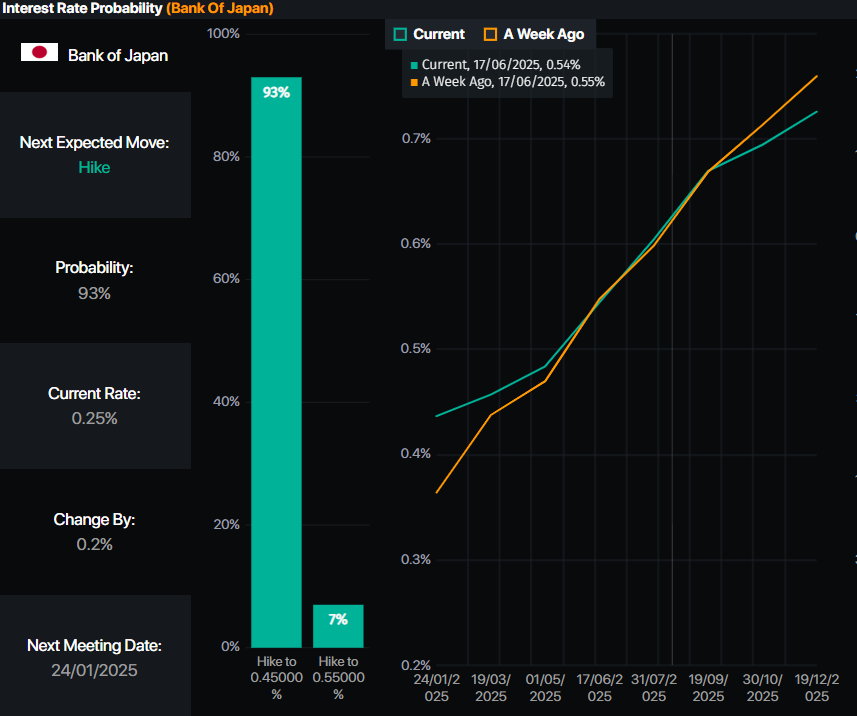
Source: Prime Market Terminal
Therefore, further USD/JPY downside is seen as the interest rate differential between the US and Japan will diminish. However, US President Donald Trump’s taking office could keep traders on their toes due to his protectionist policies, which could be inflation-prone and prevent additional easing to the Federal Reserve.
US financial markets will remain closed on Monday due to Inauguration Day, alongside Martin Luther King Day. Therefore, liquidity conditions will likely remain thin as markets resume their activities on Tuesday.
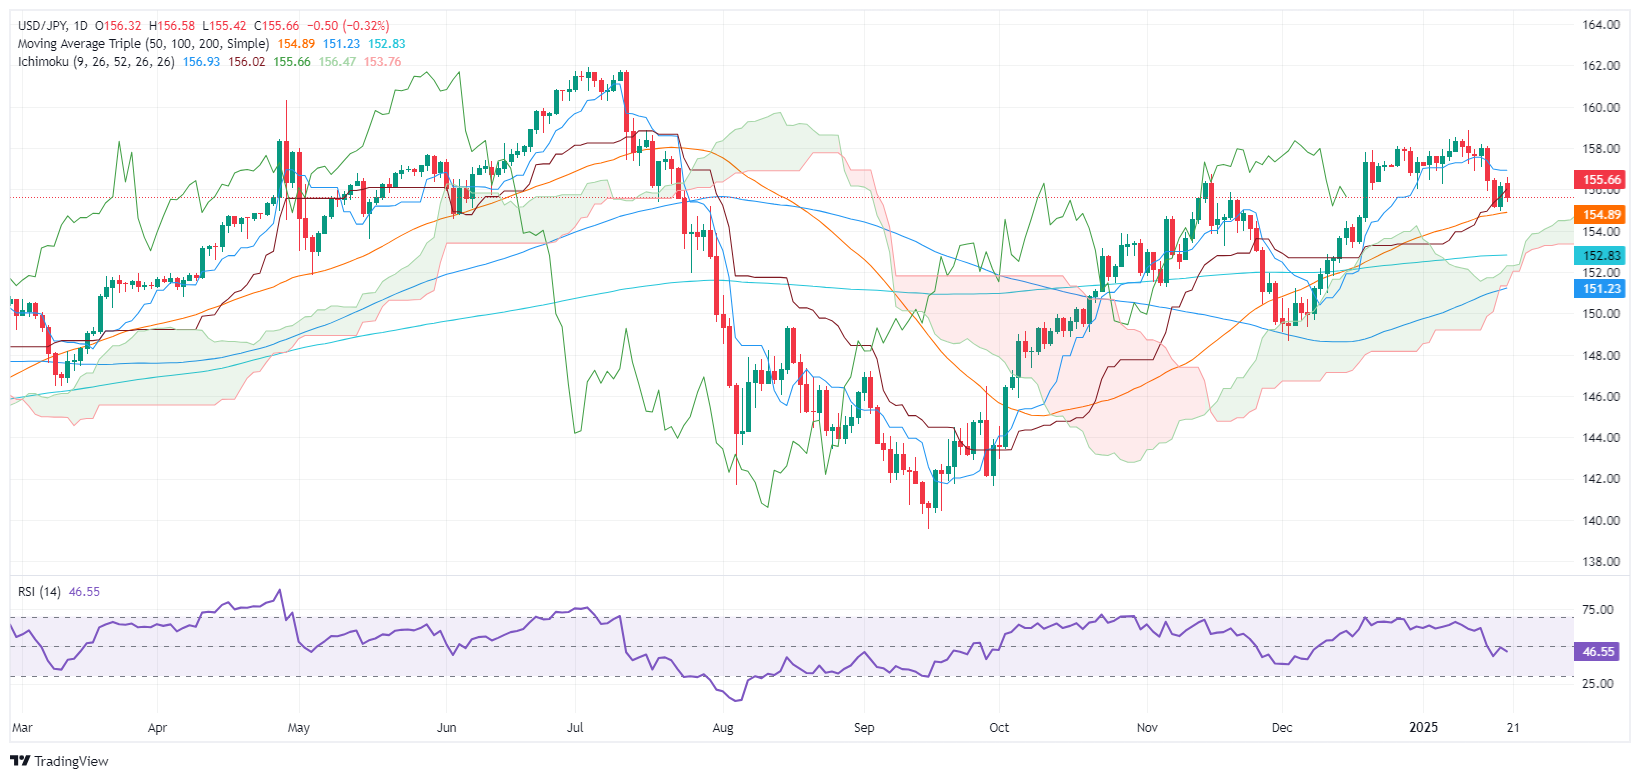
USD/JPY Price Forecast: Technical outlook
The pair remains bullishly biased, though it has fallen below the Tenkan-sen and the 20-day Simple Moving Average (SMA), opening the door for a retracement to the Kijun-sen at 155.65. A breach of the latter will expose the 50-day SMA at 154.88, followed by a support trendline drawn from the September 2024 lows.
On the other hand, if USD/JPY climbs past 156.00, further upside is seen, with buyers eyeing the Tenkan-Sen at 156.92, followed by the 20-day SMA at 157.24.
Japanese Yen PRICE Today
The table below shows the percentage change of Japanese Yen (JPY) against listed major currencies today. Japanese Yen was the strongest against the US Dollar.
USD EUR GBP JPY CAD AUD NZD CHF USD -1.36% -1.11% -0.37% -1.21% -1.29% -1.36% -0.58% EUR 1.36% 0.19% 0.92% 0.05% 0.13% -0.11% 0.66% GBP 1.11% -0.19% 0.65% -0.15% -0.05% -0.31% 0.46% JPY 0.37% -0.92% -0.65% -0.83% -0.87% -1.09% -0.39% CAD 1.21% -0.05% 0.15% 0.83% -0.02% -0.16% 0.61% AUD 1.29% -0.13% 0.05% 0.87% 0.02% -0.34% 0.46% NZD 1.36% 0.11% 0.31% 1.09% 0.16% 0.34% 0.59% CHF 0.58% -0.66% -0.46% 0.39% -0.61% -0.46% -0.59% The heat map shows percentage changes of major currencies against each other. The base currency is picked from the left column, while the quote currency is picked from the top row. For example, if you pick the Japanese Yen from the left column and move along the horizontal line to the US Dollar, the percentage change displayed in the box will represent JPY (base)/USD (quote).
-
16:04
US President Trump to stop short of imposing day-one tariffs – Reuters
US President-elect Donald Trump, who takes office on Monday, will reportedly refrain from announcing day-one tariffs at his inauguration address, per Reuters.
"The official, confirming a Wall Street Journal report, said Trump will direct agencies to investigate and remedy persistent trade deficits and address unfair trade and currency policies by other nations," Reuters further added.
Market reaction
The US Dollar (USD) came under selling pressure following this report. At the time of press, the USD Index was down 1.2% on the day at 108.10.
-
15:50
Starting Trump 2.0 with a firm USD – DBS
US President-elect Donald Trump’s inauguration on Monday should underpin the USD Index (DXY) this week, DBS' Senior FX Strategist Philip Wee notes.
Fed to become more cautious on rate cuts
"Trump had pledged to impose tariffs on his first day of office, particularly on goods entering the US from Canada, Mexico, and China. We expect the Fed to keep rates unchanged at 4.25-4.50% at the FOMC meeting on January 28-29."
"The Fed will likely become more cautious on rate cuts from Trump’s tariffs lifting US inflation expectations. Treasury Secretary Yellen warned that the reinstated statutory debt limit would be reached on January 21, with her agency taking extraordinary measures through March 14."
-
15:27
USD slips ahead of inauguration – Scotiabank
It’s inauguration day and Martin Luther King's Day — a federal holiday which means US markets are closed. The incoming president is reportedly set to sign 100 executive orders right out the gate and some of those are likely to address border security and tariffs. Will tariff action start off aggressively (25%?) and ease back as compliance emerges, Scotiabank's Chief FX Strategist Shaun Osborne notes.
US markets closed for MLK Day
“Or will tariffs start low and ramp up progressively to force the pace of negotiations. The positive price action in the USD since the outcome of the US presidential election suggests to me that markets have already factored in a — very roughly — 10-15% tariff regime being imposed on the US’ major trading partners, so somewhere in the middle of those two extremes which may mean profit-taking if its tariffs lite to start or more gains if it’s a sledgehammer approach.”
“The USD remains quite fully priced and long positioning is crowded which tilts risks towards some decent, corrective action in the USD in response to either a low or slow starting off point for tariffs—or if news on tariffs remains absent in the early days of Trump 2.0.”
“The USD has slipped a little in overnight trade and price action alone suggests the bull run may be tiring a bit; the DXY eased last week overall, for its first weekly loss since the start of December and the index is resting right on seven-week trend support at 108.95 this morning. A break below here may trigger a short-term correction at least in the USD’s recent gains.”
-
15:07
GBP/USD holds last week’s range in quiet trade – Scotiabank
The Pound Sterling (GBP) is up modestly on the day versus a generally softer USD, Scotiabank's Chief FX Strategist Shaun Osborne notes.
GBP/USD modestly firmer
"The UK, like everyone else, is waiting to see what emerges from the early days of the new Trump term on trade. The US is a key export market for the UK but trade flows are strongly services-oriented which may leave the UK a little less susceptible to tariff action."
"Cable is holding last week’s trading range. Intraday price action suggests good support on dips to the upper 1.21 area and broader price action last week suggested the GBP decline may have stalled. A positive week for the GBP this week will lift prospects for a push back towards 1.23/1.24."
-
15:05
USD/CNH: Breaking out of rising wedge – OCBC
USD/CNH fell amid supported risk sentiments. USD/CNH fell; last seen at 7.2853 levels, OCBC's FX analysts Frances Cheung and Christopher Wong note.
Risks are skewed to the downside
"CSI300, HK equities printed 1% and 2%, respectively this morning. Trump said that that the phone call with President Xi on Fri was a very good one for both China and the US may have supported sentiments."
"Daily momentum is bearish bias while RSI fell. Risks are skewed to the downside. Next support at 7.2755 (23.6% fibo retracement of Sep low to Dec high). Resistance at 7.3340 (21 DMA), 7.36 levels."
"A brief respite for RMB is still likely, given that policymakers have taken efforts – both onshore (via the fix) and offshore to maintain the relative stability in RMB. That said, we still expect RMB to depreciate when tariffs ultimately hit."
-
15:01
EUR/USD: Firms but holds range – Scotiabank
The Euro (EUR) has firmed a little in quiet trade, Scotiabank's Chief FX Strategist Shaun Osborne notes.
ECB hawks push back on rate cut bets
"ECB policy hawks continue to push back against the idea that a January rate cut is a done deal—”not a foregone conclusion”, according to Governor Holzmann reiterated in an interview overnight. Note Holzmann and Vujcic speak again this morning. Swaps rather reflect a high degree of certainty that the central bank will ease rates on the 30th, with 25bps fully priced in, however."
"Spot has picked up a little overnight but trading is holding within the range that developed through the latter part of last week. EUR-bullish signals on the daily chart remain intact but spot needs to make some deeper headway—above 1.0350—to develop more upside momentum. Support is 1.0260."
-
15:00
Russia Foreign Trade dipped from previous $9.095B to $6.018B in November
-
14:46
AUD/USD rallies to near 0.6260 before Trump 2.O
- AUD/USD surges to near 0.6260 as the US Dollar plummets in a thin-trading volume day ahead of Trump’s inauguration.
- Donald Trump is expected to clear key policies such as immigration controls, tax cuts, and higher import tariffs soon after returning to the White House.
- The Australian Dollar gains despite the PBoC leaving its LPR unchanged.
The AUD/USD pair soars to near 0.6260 in Monday’s North American session. The Aussie pair rallies as the US Dollar (USD) plunges on a thin-trading volume day, with United States (US) markets remaining closed on account of Martin Luther King's Birthday.
The US Dollar Index (DXY), which tracks the Greenback’s value against six major currencies, dives to near 108.30 as reports from the Wall Street Journal (WSJ) shows President-elect Donald Trump is planning to issue a broad memorandum that directs federal agencies to study trade policies and evaluate US trade relationships with China and America’s continental neighbors—but stops short of imposing new tariffs on the first day of his office.
The Greenback faces pressure as its safe-haven demand diminishes, given that market participants were anticipating that Trump would impose higher tariffs soon after returning to the White House.
Earlier, a report from Fox News Digital showed that Trump would sign over 200 orders in his first day of office that might include policies such as immigration controls, lower tax cuts, and higher tariffs. Market experts believe that Trump’s economic policies would be pro-growth and inflationary for the US.
Still, the event will force the Federal Reserve (Fed) to keep interest rates at their current levels for longer.
Currently, traders are pricing in more than one interest rate cut from the Fed this year, seeing the first in June, according to the CME FedWatch tool.
Meanwhile, the Australian Dollar (AUD) exhibits a mixed performance after the People’s Bank of China (PBoC) monetary policy decision. The PBoC kept its one-year Loan Prime Rate (LPR) unchanged at 3.10%, while the five-year LPR remains at 3.60%.
Since China and Australia are close trading partners, any shifts in China’s economy could have an impact on Australian markets.
Australian Dollar FAQs
One of the most significant factors for the Australian Dollar (AUD) is the level of interest rates set by the Reserve Bank of Australia (RBA). Because Australia is a resource-rich country another key driver is the price of its biggest export, Iron Ore. The health of the Chinese economy, its largest trading partner, is a factor, as well as inflation in Australia, its growth rate and Trade Balance. Market sentiment – whether investors are taking on more risky assets (risk-on) or seeking safe-havens (risk-off) – is also a factor, with risk-on positive for AUD.
The Reserve Bank of Australia (RBA) influences the Australian Dollar (AUD) by setting the level of interest rates that Australian banks can lend to each other. This influences the level of interest rates in the economy as a whole. The main goal of the RBA is to maintain a stable inflation rate of 2-3% by adjusting interest rates up or down. Relatively high interest rates compared to other major central banks support the AUD, and the opposite for relatively low. The RBA can also use quantitative easing and tightening to influence credit conditions, with the former AUD-negative and the latter AUD-positive.
China is Australia’s largest trading partner so the health of the Chinese economy is a major influence on the value of the Australian Dollar (AUD). When the Chinese economy is doing well it purchases more raw materials, goods and services from Australia, lifting demand for the AUD, and pushing up its value. The opposite is the case when the Chinese economy is not growing as fast as expected. Positive or negative surprises in Chinese growth data, therefore, often have a direct impact on the Australian Dollar and its pairs.
Iron Ore is Australia’s largest export, accounting for $118 billion a year according to data from 2021, with China as its primary destination. The price of Iron Ore, therefore, can be a driver of the Australian Dollar. Generally, if the price of Iron Ore rises, AUD also goes up, as aggregate demand for the currency increases. The opposite is the case if the price of Iron Ore falls. Higher Iron Ore prices also tend to result in a greater likelihood of a positive Trade Balance for Australia, which is also positive of the AUD.
The Trade Balance, which is the difference between what a country earns from its exports versus what it pays for its imports, is another factor that can influence the value of the Australian Dollar. If Australia produces highly sought after exports, then its currency will gain in value purely from the surplus demand created from foreign buyers seeking to purchase its exports versus what it spends to purchase imports. Therefore, a positive net Trade Balance strengthens the AUD, with the opposite effect if the Trade Balance is negative.
-
14:46
DXY: Await presidential inauguration – OCBC
US Dollar (USD) started the week on a slightly softer footing ahead of US holiday (Martin L. King Day) and Presidential inauguration today. Trump had promised to sign a host of executive orders on his 1st day as President. DXY was last at 108.48 levels, OCBC's FX analysts Frances Cheung and Christopher Wong note.
Consolidation likely for now
"At a preinauguration rally hours ago, he told the crowd he “will act with historic speed and strength and fix every single crisis”. Trump promised executive orders that will ramp up artificial intelligence, form the Department of Government Efficiency (DOGE), etc. Media reports indicated Trump may issue more than 200 executive actions on Monday. There remains quite a fair bit of expectations that tariffs may soon be announced."
"But we believe tariff uncertainty remains in terms of timing, magnitude and scope of products. A longer delay for tariff announcement may provide a breather for risk proxies, and we do not rule out USD pullback (lower). That said, a swift order for tariff implementation is likely to undermine sentiments and provide a boost to the USD. Last Friday, President-elect Trump and President Xi had a phone call to discuss trade, TikTok and fentanyl."
"Trump said that that the call was a very good one for both China and the US. Separately over the weekend, Gaza ceasefire took effect. Daily momentum is mild bearish but decline in RSI moderated. Consolidation likely for now as we await event risk (signing of executive orders/ actions). Support at 107.43 (50DMA). Resistance at 110.10, 110.90 levels."
-
14:42
USD/CAD: Vols firm in nervous trade ahead of Trump 2.0 – Scotiabank
The Canadian Dollar (CAD) has failed to pick up any support amid a broadly softer USD this morning. It, along with the MXN and JPY, is a relative underperformer on the session after reaching a minor, new 5-year low overnight—just under 1.45. Minor new cycle highs for the USD overnight and spot holding near the recent USD peaks in what is a minor pullback from the overnight high leave the USD in a strong position, Scotiabank's Chief FX Strategist Shaun Osborne notes.
CAD hits new low
"CAD trading is clearly affected by concerns about trade policy under Trump 2.0. CAD vols continues to rise, with O/N vol nearing 20%, 1M implied near 9% and 3M implied vol trading at 7.6%. CAD options volume has been more active today, reports indicate, as traders position for immediate action on tariffs. That might mean a mini-CAD rebound if news on tariffs is limited in the next day or so."
"Crude prices are a little weaker following the president-elect's remark that he will invoke a national energy emergency to boost domestic energy production. The BoC releases the Q1 Business Outlook Survey at 10.30ET; focus here has been on jobs and prices recently but the survey will be a gauge of local business expectations ahead of the new Trump presidency."
"Price moves also scupper technical pointers that had suggested the USD could be peaking after failing to hold intraday gains through the mid-1.44s in recent weeks. Spot closed at a new high on the week (1.4477) on Friday. While the US trend looks stretched, there is no relenting in the bull move, it would seem. The next resistance is 1.47. Support is 1.4385/90 and 1.4300/05."
-
14:38
EUR/USD: 21 DMA holds key – OCBC
Euro (EUR) traded under pressure (sub1.03 levels), OCBC's FX analysts Frances Cheung and Christopher Wong note.
Risks modestly skewed to the upside
"ECB’s Schnabel said ECB has room to lower borrowing costs but also stressed that after the steep rate cuts over the last few months, ECB is getting closer to the point where policymakers have to take a closer look at whether and to what extent they can still reduce rates."
"Daily momentum turned mild bullish while RSI rose. Risks modestly skewed to the upside. EUR bulls to regain some momentum towards 1.0440 (50 DMA). Support at 1.0240, 1.02 (recent low)."
-
13:37
US Dollar focus on Donald Trump's inauguration
- The US Dollar is in choppy trading ahead of President-elect Donald Trump’s inauguration.
- Trading floors in the US will remain closed due to Martin Luther King’s Day.
- The US Dollar Index (DXY) stays afloat near 109.00 with uncertainty ahead.
The US Dollar Index (DXY), which tracks the Greenback’s value against six major currencies, trades roughly flat and holds near 109.00 on Monday ahead of President-elect Donald Trump’s inauguration as the 47th President of the United States (US). Several asset classes in the US will remain closed, such as the Wall Street trading floor and US bond trading, in observance of Martin Luther King’s Day. This means erratic moves could occur in a market with thin liquidity.
All eyes will be on the aftermath of the inauguration, where President-elect Donald Trump has already confirmed in a rally on Sunday that a whole battery of new measures and executive orders will be issued. The main ones are, of course, more tariffs, mass deportation starting in Chicago, and issuing state of emergencies for energy and border security, Bloomberg reported. By issuing those last two, the upcoming President Trump can give the green light for massive drilling and mass deporting illegal immigrants without having to pass through Congress and the House of Representatives.
Daily digest market movers: All eyes on Trump’s first moves
- At 17:00 GMT, the Presidential Inauguration will take place, with Donald Trump being sworn in as the 47th President of the United States.
- Due to Martin Luther King’s Day, several trading floors in the US will remain closed throughout the day.
- Equities are off to a positive start on the day, with green numbers from Asia over Europe and US equity futures.
- The CME FedWatch tool projects a 55.6% chance that interest rates will remain unchanged at current levels in the May meeting, suggesting a rate cut in June. Expectations are that the Federal Reserve (Fed) will remain data-dependent with uncertainties that could influence inflation during President-elect Donald Trump’s term.
- The US 10-year yield is trading around 4.627% and will remain at that level this Monday, as bond trading in the US is closed due to the Martin Luther King’s bank holiday.
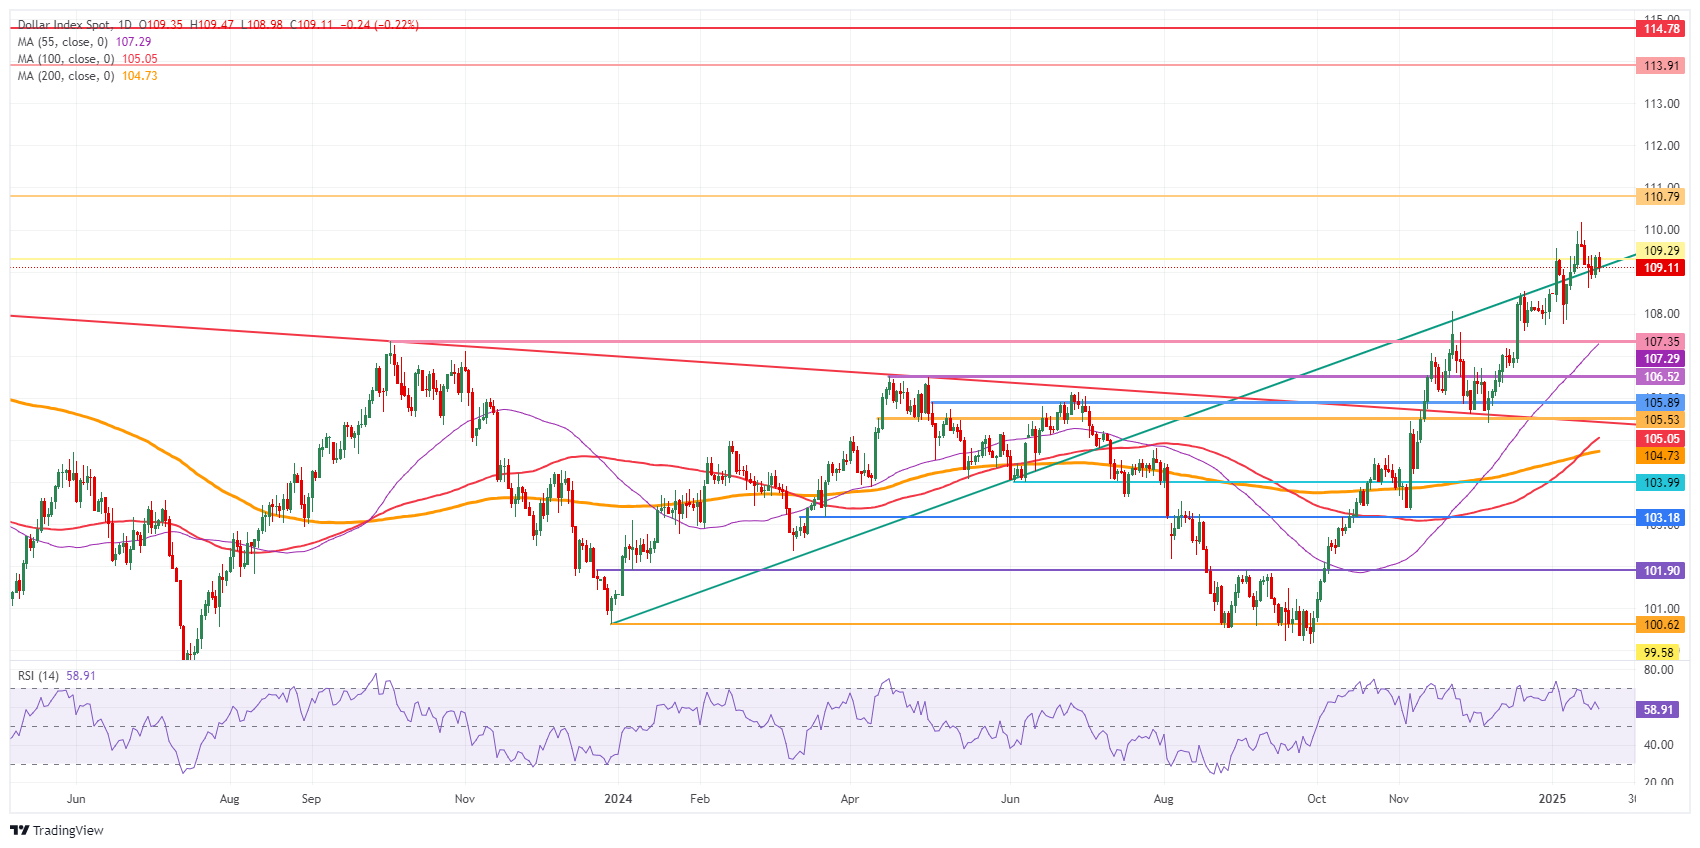
US Dollar Index Technical Analysis: No plan from here
The US Dollar Index (DXY) sees a split division between bears and bulls. The new Trump administration is set to unleash a large number of executive orders, making it hard for markets to assess the impact. With several topics being addressed and communicated in advance, it looks like markets have already priced in a fair bit of inflationary pressure from Trumponomics. The question now will be if the markets are correct and if the DXY index will ease further from current levels on the back of an overestimation of the actual impact of the measures being imposed.
On the upside, the 110.00 psychological level remains the key resistance to beat. Further up, the next big upside level to hit before advancing any further remains at 110.79 (September 7, 2022, high). Once beyond there, it is quite a stretch to 113.91, a double top from October 2022.
On the downside, the DXY is trading alongside the ascending trend line coming from December 2023, which currently comes in around 109.10 as nearby support. In case of more downside, the next support is 107.35 (October 3, 2023, high). Further down, the 55-day Simple Moving Average (SMA) at 107.29 should catch any falling knives.
US Dollar Index: Daily Chart
US Dollar FAQs
The US Dollar (USD) is the official currency of the United States of America, and the ‘de facto’ currency of a significant number of other countries where it is found in circulation alongside local notes. It is the most heavily traded currency in the world, accounting for over 88% of all global foreign exchange turnover, or an average of $6.6 trillion in transactions per day, according to data from 2022. Following the second world war, the USD took over from the British Pound as the world’s reserve currency. For most of its history, the US Dollar was backed by Gold, until the Bretton Woods Agreement in 1971 when the Gold Standard went away.
The most important single factor impacting on the value of the US Dollar is monetary policy, which is shaped by the Federal Reserve (Fed). The Fed has two mandates: to achieve price stability (control inflation) and foster full employment. Its primary tool to achieve these two goals is by adjusting interest rates. When prices are rising too quickly and inflation is above the Fed’s 2% target, the Fed will raise rates, which helps the USD value. When inflation falls below 2% or the Unemployment Rate is too high, the Fed may lower interest rates, which weighs on the Greenback.
In extreme situations, the Federal Reserve can also print more Dollars and enact quantitative easing (QE). QE is the process by which the Fed substantially increases the flow of credit in a stuck financial system. It is a non-standard policy measure used when credit has dried up because banks will not lend to each other (out of the fear of counterparty default). It is a last resort when simply lowering interest rates is unlikely to achieve the necessary result. It was the Fed’s weapon of choice to combat the credit crunch that occurred during the Great Financial Crisis in 2008. It involves the Fed printing more Dollars and using them to buy US government bonds predominantly from financial institutions. QE usually leads to a weaker US Dollar.
Quantitative tightening (QT) is the reverse process whereby the Federal Reserve stops buying bonds from financial institutions and does not reinvest the principal from the bonds it holds maturing in new purchases. It is usually positive for the US Dollar.
-
12:24
USD/CHF consolidates around 0.9150 with Trump 2.O taking center stage
- USD/CHF oscillates around 0.9150 as investors turn cautious ahead of Trump’s inauguration.
- Trump’s economic policies are expected to boost US inflation and growth.
- The SNB is expected to continue reducing interest rates this year.
The USD/CHF pair trades sideways inside Friday’s trading range around 0.9140 in Monday’s European session. The Swiss Franc pair consolidates as investors have sidelined ahead of United States (US) President-elect Donald Trump’s swearing ceremony.
Market participants expect an unprecedented global trading environment under Trump’s administration as he is expected to sign over 200 orders soon after returning to the White House. His initial orders might include immigration controls, higher tariffs, and lower individual taxes. Higher import tariffs are expected to lead to a global trader war, a scenario that will boost demand for US-produced goods and services. While, at the same time, it will make offerings from other economies as expensive.
Trump’s economic policies would be pro-growth and inflationary for the United States (US) economy and favorable for the US Dollar (USD). At the time of writing, the US Dollar Index (DXY), which tracks the Greenback’s value against six major currencies, is down to near 109.00 but is still 10% higher in slightly over three months.
Going forward, Trump’s policies are expected to force the Federal Reserve (Fed) to maintain interest rates elevated for a longer period. According to the CME FedWatch tool, traders are pricing in more than one 25-bps interest rate reduction this year, seeing the first coming in the June meeting.
Meanwhile, the Swiss Franc (CHF) remains broadly weak as investors expect the Swiss National Bank (SNB) could continue reducing interest rates. Swiss interest rates have already come down to 0.5% amid growing risks of inflation undershooting the central bank’s target.
US Dollar FAQs
The US Dollar (USD) is the official currency of the United States of America, and the ‘de facto’ currency of a significant number of other countries where it is found in circulation alongside local notes. It is the most heavily traded currency in the world, accounting for over 88% of all global foreign exchange turnover, or an average of $6.6 trillion in transactions per day, according to data from 2022. Following the second world war, the USD took over from the British Pound as the world’s reserve currency. For most of its history, the US Dollar was backed by Gold, until the Bretton Woods Agreement in 1971 when the Gold Standard went away.
The most important single factor impacting on the value of the US Dollar is monetary policy, which is shaped by the Federal Reserve (Fed). The Fed has two mandates: to achieve price stability (control inflation) and foster full employment. Its primary tool to achieve these two goals is by adjusting interest rates. When prices are rising too quickly and inflation is above the Fed’s 2% target, the Fed will raise rates, which helps the USD value. When inflation falls below 2% or the Unemployment Rate is too high, the Fed may lower interest rates, which weighs on the Greenback.
In extreme situations, the Federal Reserve can also print more Dollars and enact quantitative easing (QE). QE is the process by which the Fed substantially increases the flow of credit in a stuck financial system. It is a non-standard policy measure used when credit has dried up because banks will not lend to each other (out of the fear of counterparty default). It is a last resort when simply lowering interest rates is unlikely to achieve the necessary result. It was the Fed’s weapon of choice to combat the credit crunch that occurred during the Great Financial Crisis in 2008. It involves the Fed printing more Dollars and using them to buy US government bonds predominantly from financial institutions. QE usually leads to a weaker US Dollar.
Quantitative tightening (QT) is the reverse process whereby the Federal Reserve stops buying bonds from financial institutions and does not reinvest the principal from the bonds it holds maturing in new purchases. It is usually positive for the US Dollar.
-
12:16
USD/CNH: Upward momentum has dissipated – UOB Group
Downward momentum is building, but this will likely lead to a lower trading range of 7.3200/7.3500 instead of a sustained decline. In the longer run, upward momentum has dissipated; US Dollar (USD) is likely to trade in a range between 7.3100 and 7.3650. UOB Group's FX analysts Quek Ser Leang and Peter Chia note.
Downward momentum is building
24-HOUR VIEW: "USD traded in a quiet manner last Thursday. On Friday, we indicated that 'flat momentum indicators continue to suggest range trading, most likely between 7.3380 and 7.3550.' USD subsequently traded in a wider range of 7.3338/7.3578. It opened on a soft note in early Asian trade today. While downward momentum is building, this will likely lead to a lower trading range of 7.3200/7.3500 instead of a sustained decline."
1-3 WEEKS VIEW: We have held the view that 'there is room for USD to retest the 7.3700' since early last week. On Tuesday (14 Jan, spot at 7.3410), we noted that 'upward momentum is beginning to fade, and a breach of 7.3250 (‘strong support’ level) would suggest that 7.3700 is not coming into view.' USD traded in a quiet manner over the past few days, and upward momentum has dissipated. There has been a slight increase in downward momentum, but it is not sufficient to indicate a sustained decline. From here, we expect USD to trade in a range, most likely between 7.3100 and 7.3650."
-
12:11
Aluminum continues to rally on China growth – ING
LME aluminum ended last week on a strong footing, boosted by signs of economic recovery in China following a series of stimulus measures over the last couple of months. China’s economic data released last Friday showed China’s GDP in 2024 expanded 5%, meeting the government’s target. The final quarter of the year saw growth of 5.4%, which was the fastest pace in six quarters, ING's commodity analysts Warren Patterson and Ewa Manthey note.
LME aluminum ends last week on a strong footing
"The National Bureau of Statistics (NBS) numbers released last week showed monthly primary aluminum production in China rising 4.2% YoY to 3.8mt in December 2024 primarily due to the additions from new production capacity in the Northwestern region of Xinjiang. Cumulatively, production rose 4.6% YoY to around 44mt over Jan’24 – Dec’24. In other metals, monthly crude steel production rose 11.8% YoY to 76mt last month. However, cumulative output fell 1.7% YoY to 1,005.1mt in 2024, the lowest in five years as weakness in the property market continues to weigh on steel demand."
"Weekly data from the Shanghai Futures Exchange (ShFE) showed inventories for base metals remaining mixed over the last week. Aluminum weekly stocks fell by 3,694 tons for a twelfth consecutive week to 178,474 tons as of last Friday, the lowest since 23 February 2024. Zinc inventories decreased by 294 tons (-1.4% week-on-week) for a ninth straight week to 21,040 tons (the lowest since 30 December 2022), while lead inventories declined by 1,351 tons for a fifth consecutive week to 43,503 tons at the end of last week. Meanwhile, weekly inventories for copper and nickel rose by 12.9% WoW and 5.2% WoW, respectively."
-
12:06
USD/JPY: Unlikely to threaten 156.70 – UOB Group
Sharp bounce in US Dollar (USD) has room to extend; overbought conditions indicate that any advance is unlikely to threaten 156.70. In the longer run, USD remains weak; if it breaks below 154.90, the next objective will be at 154.40, UOB Group's FX analysts Quek Ser Leang and Peter Chia note.
USD remains weak
24-HOUR VIEW: "After USD fell sharply last Thursday, we highlighted on Friday that 'while the sharp drop appears to be excessive, the weakness has not stabilized just yet.' However, we held the view that “any further decline is likely part of a lower range of 154.90/156.15.” USD subsequently dipped to 154.96 before rebounding strongly, reaching a high of 156.37 in NY trade. The sharp bounce has room to extend, but given the overbought conditions, any advance is unlikely to threaten the strong resistance level at 156.70. On the downside, support levels are at 155.90 and 155.40."
1-3 WEEKS VIEW: "Last Friday (17 Jan), when USD was at 155.35, we indicated that USD 'remains weak.' We added, 'if it breaks below 154.90, the next objective will be at 154.40.' USD then dipped to 154.96 before rebounding strongly. Although downward momentum has eased somewhat with the rebound, only a breach of 157.60 (no change in ‘strong resistance’ from last Friday) would indicate that the weakness in USD that started last Thursday has stabilized. To look at it another way, there is still a chance for USD to break below 154.90."
-
11:49
Oil: Specs add to Brent long – ING
Despite the rally in crude oil prices running out of steam towards the end of last week, ICE Brent still managed to settle almost 1.3% higher on the week and remain above US$80/bbl, ING's commodity analysts Warren Patterson and Ewa Manthey note.
Oil markets are weighed on by uncertainty
"There is a fair amount of uncertainty across markets coming into this week given the inauguration of President Trump and the raft of executive orders he reportedly is planning to sign. This combined with it being a US holiday today, means that some market participants may have decided to take some risk off the table."
"The latest positioning data shows that speculators increased their net long in ICE Brent by 27,473 lots over the last reporting week to leave them with a net long of 254,332 lots as of last Tuesday. The move was driven by fresh longs entering the market and left speculators with their largest net long since May. The strong buying reflects supply concerns following the announcement of US sanctions against the Russian energy industry."
"Output data from China on Friday shows that refineries increased the amount of crude oil they processed by 1.3% year-on-year in December. However, for full-year 2024, refinery activity still fell by 3.6% YoY, reflecting weaker domestic demand. Output and trade numbers suggest that apparent oil demand in December came in at a little more than 13.9m b/d, down from 14m b/d the previous month, but up 0.6% YoY."
-
11:43
NZD/USD: Upward momentum has largely faded – UOB Group
New Zealand Dollar (NZD) is likely to trade sideways between 0.5560 and 0.5610. In the longer run, upward momentum has largely faded; NZD is expected to trade in a 0.5540/0.5650 range, UOB Group's FX analysts Quek Ser Leang and Peter Chia note.
NZD to trade in a 0.5540/0.5650 range
24-HOUR VIEW: "Our view for NZD to 'trade in a sideways range between 0.5580 and 0.5630' last Friday was incorrect, as it dropped to a low of 0.5564 before closing at 0.5585 (-0.41%). The decline did not result in a significant increase in momentum, and instead of continuing to decline, NZD is more likely to trade sideways between 0.5560 and 0.5610."
1-3 WEEKS VIEW: "While we noted 'a slight increase in momentum' last Thursday (15 Jan, spot at 0.5620), we pointed out that it 'must break and remain above 0.5650 before a move to 0.5695 is likely.' We added, 'the likelihood of NZD breaking clearly above 0.5650 will remain intact, provided that it remains above 0.5580 (‘strong support’ level).' Last Friday, NZD fell below 0.5580 (low has been 0.5564). Upward momentum has largely faded, and from here, we expect NZD to trade in a 0.5540/0.5650 range."
-
11:38
GBP: Staying offered – ING
EUR/GBP is staying bid near the recent high of 0.8450/60, ING's FX analyst Chris Turner notes.
Above 0.8450/60, EUR/GBP can see 0.8500
"While we (and the UK sovereign credit default swap market) do not think this is a Liz Truss-style moment for UK sovereign risk, we do think the solution to the current challenges is sterling negative. To resolve the risk of breaching the fiscal rule, either the government needs to cut spending, the Bank of England to cut rates (lowering Gilt yields) – or both."
"There is not a lot on the UK data calendar this week apart from the November jobs data tomorrow. We also wonder whether Wednesday's release of the December budget figures will draw greater attention than normal."
"But overall, we see little reason for sterling to recover. Above 0.8450/60, EUR/GBP can see 0.8500. GBP/JPY is very much in focus as well given the prospect of the Bank of Japan hiking 25bp this Friday. 185 looks very possible here."
-
11:25
AUD/USD: Set to trade in a 0.6165/0.6220 range – UOB Group
Australian Dollar (AUD) is expected to trade in a 0.6165/0.6220 range. In the longer run, for the time being, AUD is likely to trade in a 0.6140/0.6245 range, UOB Group's FX analysts Quek Ser Leang and Peter Chia note.
The buildup in momentum seems to have faded
24-HOUR VIEW: "We indicated last Friday that 'the current price movements are likely part of a range trading phase, expected to be between 0.6185 and 0.6230.' However, AUD fluctuated between 0.6165 and 0.6227 in NY trade, closing at 0.6190 (-0.37%). The price action did not result in any increase in either downward or upward momentum, and the current price movements are likely part of a range trading phase. Today, we expect AUD to trade in a 0.6165/0.6220 range."
1-3 WEEKS VIEW: "Last Thursday (16 Jan, spot at 0.6225), we noted that 'upward momentum is building.' However, we pointed out that AUD 'must close above 0.6245 before a move to 0.6300 can be expected.' We also pointed out that 'the probability of AUD closing above 0.6245 will remain intact as long as the ‘strong support’ level, currently at 0.6170, is not breached.' On Friday, AUD dipped briefly below our ‘strong support’ level of 0.6170, reaching a low of 0.6165. The buildup in momentum seems to have faded. For the time being, AUD is likely to trade in a 0.6140/0.6245 range."
-
11:25
Silver Price Forecast: XAG/USD oscillates above $30.00 with Trump’s inauguration on the horizon
- Silver price trades sideways above $30.00, with investors focusing on Trump’s inauguration ceremony.
- US Trump’s policies are expected to be pro-growth and inflationary for the economy.
- Easing geopolitical tensions in the Middle East region trim safe-haven demand.
Silver price (XAG/USD) trades in a tight range near $30.30 in Monday’s European session. The white metal consolidates as investors shift focus to United States (US) President-elect Donald Trump’s swearing ceremony.
Ahead of Trump’s inauguration, the US Dollar Index (DXY), which tracks the Greenback’s value against six major currencies, declines to near 109.00. 10-year US Treasury yields rise to near 4.64%. Higher yields on interest-bearing assets increase the opportunity cost of holding an investment in non-yielding assets, such as Silver. Generally, higher yields limit the upside in the Silver price.
Investors expect Donald Trump to tighten immigration policies, lower taxes, and raise import tariffs under his administration, which would boost growth and inflationary pressures in the United States (US) economy. This would force the Federal Reserve (Fed) to keep interest rates elevated for longer. Historically, the appeal of the Silver improves in a highly inflated environment. However, higher for longer interest rates bode poorly for Silver.
On the geopolitical front, easing tensions between Israel and Hamas in the Middle East has diminished safe-haven demand. Both nations released some hostages on Sunday, which appears to be a meaningful move to an end to the 15-month-old war in Gaza.
Silver technical analysis
Silver price struggles near the upward-sloping trendline around $30.85, which is plotted from the 29 February 2024 low of $22.30 on a daily timeframe.
The white metal discovered strong buying interest near the 200-day Exponential Moving Average (EMA) around $29.45 but struggles to sustain above the 50-day EMA, which is around $30.30.
The 14-day Relative Strength Index (RSI) faces pressure near 60.00. A fresh bullish momentum would trigger if it manages to break above 60.00.
Silver daily chart
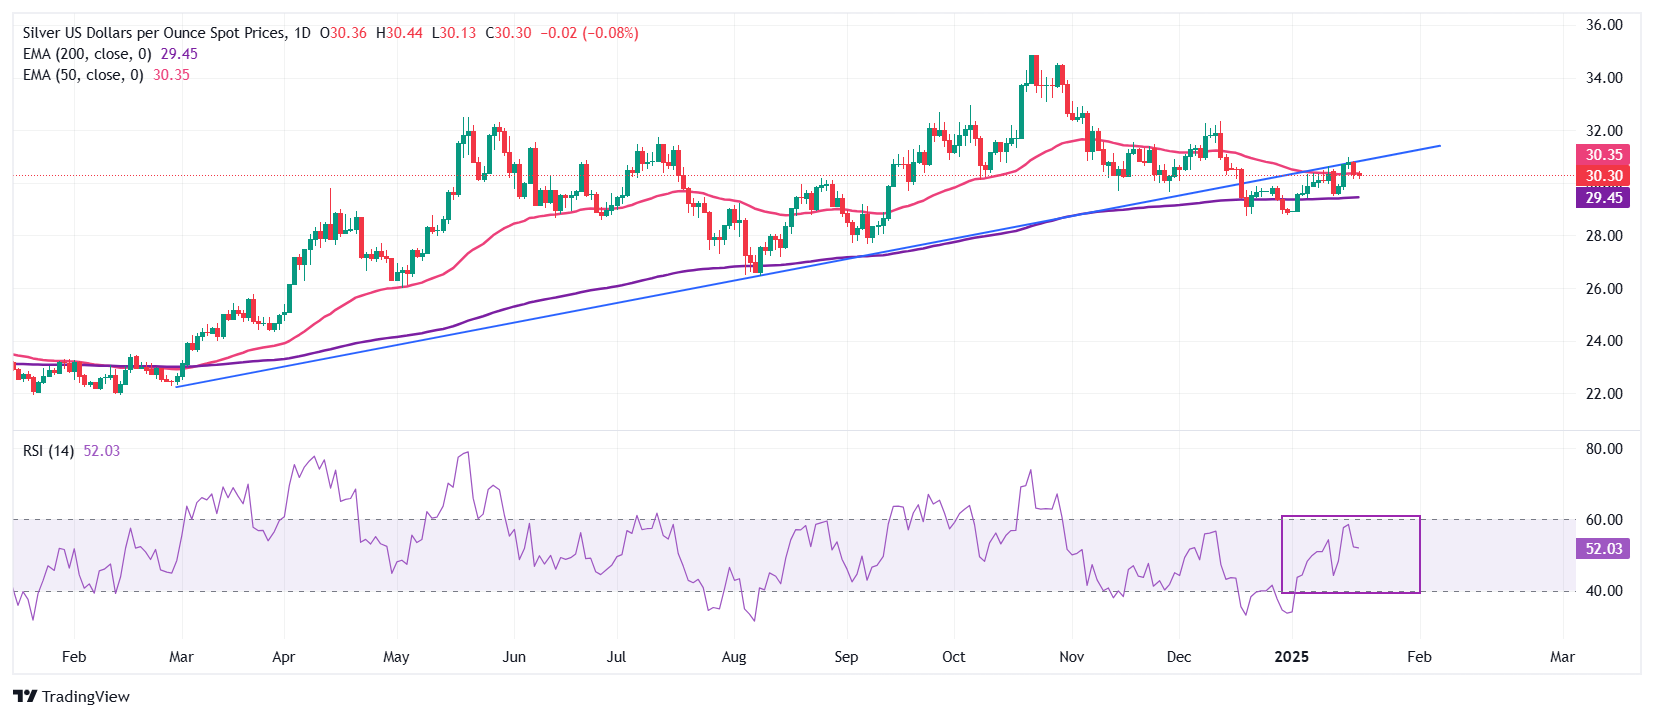
Silver FAQs
Silver is a precious metal highly traded among investors. It has been historically used as a store of value and a medium of exchange. Although less popular than Gold, traders may turn to Silver to diversify their investment portfolio, for its intrinsic value or as a potential hedge during high-inflation periods. Investors can buy physical Silver, in coins or in bars, or trade it through vehicles such as Exchange Traded Funds, which track its price on international markets.
Silver prices can move due to a wide range of factors. Geopolitical instability or fears of a deep recession can make Silver price escalate due to its safe-haven status, although to a lesser extent than Gold's. As a yieldless asset, Silver tends to rise with lower interest rates. Its moves also depend on how the US Dollar (USD) behaves as the asset is priced in dollars (XAG/USD). A strong Dollar tends to keep the price of Silver at bay, whereas a weaker Dollar is likely to propel prices up. Other factors such as investment demand, mining supply – Silver is much more abundant than Gold – and recycling rates can also affect prices.
Silver is widely used in industry, particularly in sectors such as electronics or solar energy, as it has one of the highest electric conductivity of all metals – more than Copper and Gold. A surge in demand can increase prices, while a decline tends to lower them. Dynamics in the US, Chinese and Indian economies can also contribute to price swings: for the US and particularly China, their big industrial sectors use Silver in various processes; in India, consumers’ demand for the precious metal for jewellery also plays a key role in setting prices.
Silver prices tend to follow Gold's moves. When Gold prices rise, Silver typically follows suit, as their status as safe-haven assets is similar. The Gold/Silver ratio, which shows the number of ounces of Silver needed to equal the value of one ounce of Gold, may help to determine the relative valuation between both metals. Some investors may consider a high ratio as an indicator that Silver is undervalued, or Gold is overvalued. On the contrary, a low ratio might suggest that Gold is undervalued relative to Silver.
-
11:21
USD: Looking out for executive orders – ING
The big day has finally arrived. Financial markets are on tenterhooks to see what executive orders newly elected US President Donald Trump will enact on his first day. There's a lot of focus on immigration controls and declaring a national energy emergency to allow more US oil and gas production, ING's FX analyst Chris Turner notes.
DXY to have another test of 110 this week
"FX markets are most interested in what he has to say about tariffs and what kind of pain the Oval Office plans to inflict on major trade partners. At last week's nomination hearings, incoming Treasury Secretary Scott Bessent said that tariffs would be needed to address unfair trade practices, support government revenue, and to be used as a negotiating tool."
"In terms of what is currently priced for tariffs by financial markets, we find the online prediction websites quite useful, such as Polymarket and Kalshi. Polymarket is running a book on which countries will receive US tariffs in Trump's first week. China is priced at 56%, Mexico at 54%, Canada at 45% and the European Union at just 7%. There is also the case – using Scott Bessent's remarks about tariffs as negotiating tools – that the new administration goes in on tariffs hard at the outset."
"Price action could well be muted today since US markets are shut for the Martin Luther King public holiday. And the US data calendar is quiet this week, especially with the Federal Reserve in its blackout period ahead of the next FOMC meeting on 29 January. But overall, we have no confidence in calling the dollar lower on market positioning and instead see scope for DXY to have another test of 110 this week."
-
11:14
Pound Sterling gains as UK yields cool down on fresh acceleration in BoE dovish bets
- The Pound Sterling outperforms its major peers as soft UK data weighs on gilt yields.
- Market experts project a 100 bps interest rate reduction by the BoE this year.
- The risk profile turns favorable for risky assets ahead of Trump’s inauguration.
The Pound Sterling (GBP) bounces back against its major peers at the start of the week. Gains in the British currency are partly driven by a further advancement in demand for United Kingdom (UK) gilts due to weak UK Retail Sales data for December and an increasing demand for risky assets ahead of United States (US) President-elect Donald Trump’s inauguration.
A strong buying interest for UK gilts has weighed heavily on the government’s borrowing costs, pushing 30-year yields further lower to near 5.20% from its more-than-26-year high of 5.47% recorded on January 13. An unexpected decline in the UK Retail Sales data has further accelerated the Bank of England's (BoE) dovish bets. Monthly Retail Sales contracted by 0.3%, while it was expected to grow at a faster rate of 0.4% from a 0.1% increment in November. Analysts at Oxford Economics expect the BoE to cut interest rates by 100 basis points (bps) to 3.75% by the year-end.
UK gilt yields peaked last week after the release of softer-than-expected Consumer Price Index (CPI) data for December, which increased speculation for the BoE to cut its borrowing rates in the coming policy meeting on February 6.
It is worth noting that the size of the decline in UK gilt yields is larger than the recovery in the Pound Sterling as weak UK data has boosted dovish BoE bets, which are technically GBP-negative. Higher bets for lower BoE interest rates bode poorly for the Pound Sterling. Meanwhile, UK equity markets have sharply rallied in the last few trading days as Chancellor of the Exchequer Rachel Reeves won’t be forced to raise taxes or cut public spending to fulfill her economic agenda.
Going forward, the next move in the Pound Sterling will be guided by the UK employment data for the three months ending November, which will be published on Tuesday.
Daily digest market movers: Pound Sterling rises against US Dollar ahead of Trump’s inauguration
- The Pound Sterling rebounds to near 1.2200 against the US Dollar (USD) in Monday’s European Session. The GBP/USD pair rises as the safe-haven appeal of the US Dollar diminishes ahead of Trump’s swearing-in ceremony for the Presidential charge. The US Dollar Index (DXY), which tracks the Greenback’s value against six major currencies, slumps to near 109.00.
- The broader outlook for the US Dollar remains firm as investors expect economic policies under Trump’s administration to be pro-growth and inflationary for the US economy. According to a report from Fox Digital News, Trump is expected to sign over 200 orders on the first day of high return to the White House. His orders might include immigration controls, higher tariffs, and lower taxes.
- The US economic calendar has little to offer this week except for the S&P Global preliminary Purchasing Managers Index (PMI) data for January, which will be published on Friday. Until then, the Greenback will be influenced by market expectations for the Federal Reserve’s (Fed) monetary policy outlook for the entire year.
- According to the CME FedWatch tool, traders are pricing in more than one 25 bps interest rate cut this year, seeing the first in the June meeting.
Technical Analysis: Pound Sterling ranges around 1.2200
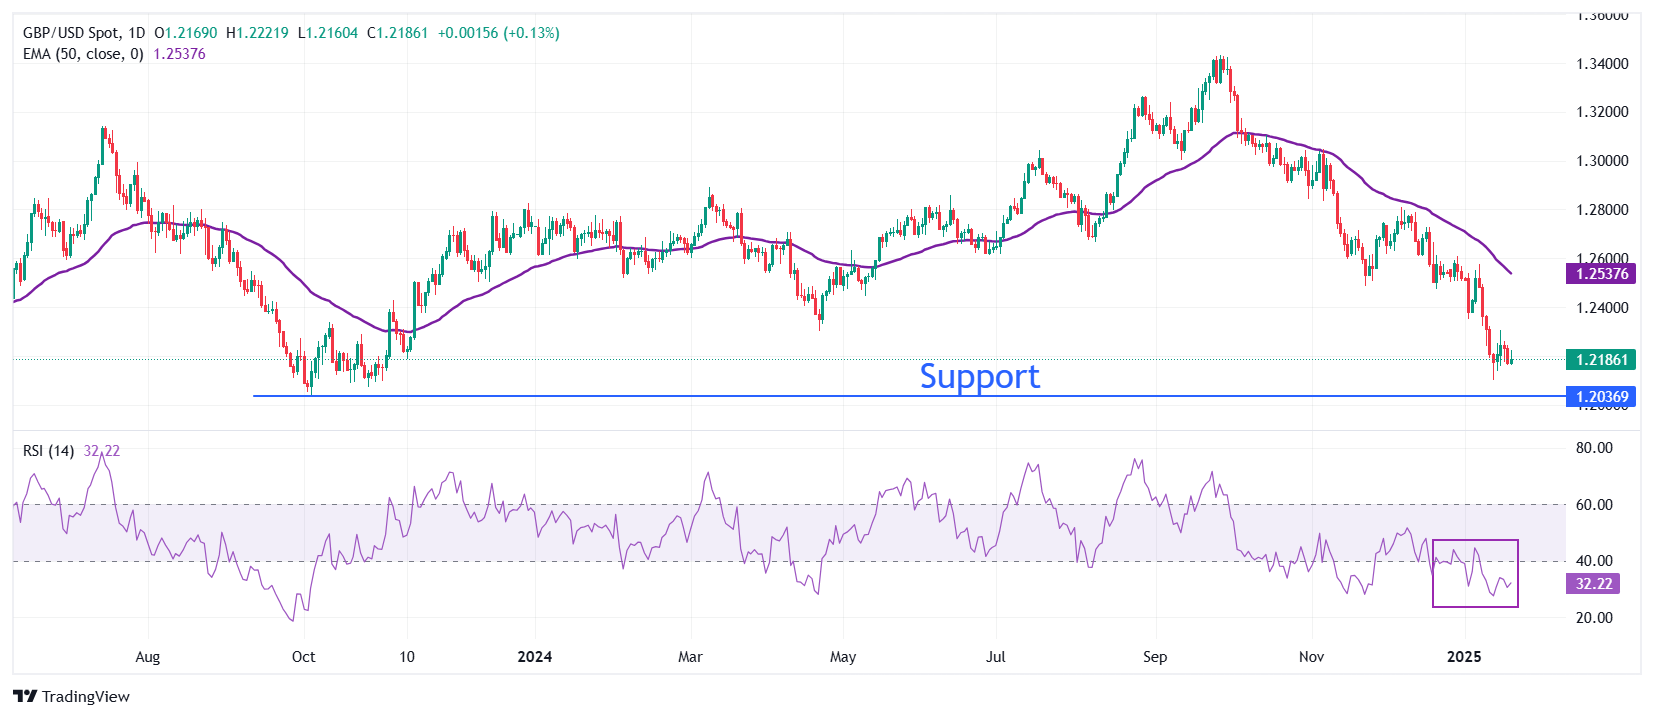
The Pound Sterling trades higher around 1.2200 against the US Dollar on Monday but has been broadly sideways between 1.2100 and 1.2300 for a week. The outlook for the GBP/USD pair remains bearish as the 50-day EMA slopes downwards around 1.2538.
The 14-day Relative Strength Index (RSI) remains inside the 20.00-40.00 range, suggesting a strong bearish momentum.
Looking down, the pair is expected to find support near the October 2023 low of 1.2050. On the upside, the January 15 high of 1.2306 will act as key resistance.
Pound Sterling FAQs
The Pound Sterling (GBP) is the oldest currency in the world (886 AD) and the official currency of the United Kingdom. It is the fourth most traded unit for foreign exchange (FX) in the world, accounting for 12% of all transactions, averaging $630 billion a day, according to 2022 data. Its key trading pairs are GBP/USD, also known as ‘Cable’, which accounts for 11% of FX, GBP/JPY, or the ‘Dragon’ as it is known by traders (3%), and EUR/GBP (2%). The Pound Sterling is issued by the Bank of England (BoE).
The single most important factor influencing the value of the Pound Sterling is monetary policy decided by the Bank of England. The BoE bases its decisions on whether it has achieved its primary goal of “price stability” – a steady inflation rate of around 2%. Its primary tool for achieving this is the adjustment of interest rates. When inflation is too high, the BoE will try to rein it in by raising interest rates, making it more expensive for people and businesses to access credit. This is generally positive for GBP, as higher interest rates make the UK a more attractive place for global investors to park their money. When inflation falls too low it is a sign economic growth is slowing. In this scenario, the BoE will consider lowering interest rates to cheapen credit so businesses will borrow more to invest in growth-generating projects.
Data releases gauge the health of the economy and can impact the value of the Pound Sterling. Indicators such as GDP, Manufacturing and Services PMIs, and employment can all influence the direction of the GBP. A strong economy is good for Sterling. Not only does it attract more foreign investment but it may encourage the BoE to put up interest rates, which will directly strengthen GBP. Otherwise, if economic data is weak, the Pound Sterling is likely to fall.
Another significant data release for the Pound Sterling is the Trade Balance. This indicator measures the difference between what a country earns from its exports and what it spends on imports over a given period. If a country produces highly sought-after exports, its currency will benefit purely from the extra demand created from foreign buyers seeking to purchase these goods. Therefore, a positive net Trade Balance strengthens a currency and vice versa for a negative balance.
-
11:12
GBP/USD: Major support at 1.2100 is unlikely to come into view – UOB Group
The Pound Sterling (GBP) is expected to trade with a downward bias and test 1.2130; the next major support at 1.2100 is unlikely to come into view. In the longer run, there has been a tentative buildup in momentum, but GBP must break clearly below the 1.2100/1.2130 support zone before further weakness can be expected, UOB Group's FX analysts Quek Ser Leang and Peter Chia note.
A tentative buildup in momentum
24-HOUR VIEW: "Our view of GBP trading in a 1.2190/1.2280 range last Friday was incorrect. Instead of trading in a range, GBP fell to a low of 1.2161. Downward momentum appears to be building, albeit tentatively. Today, we expect GBP to trade with a downward bias. While there is a chance for it to test the 1.2130 level, it does not appear to have enough momentum to break clearly below this level. The next major support at 1.2100 is unlikely to come into view. To sustain the buildup in momentum, GBP must remain below 1.2215, with minor resistance at 1.2190."
1-3 WEEKS VIEW: "Our most recent narrative was from last Thursday (16 Jan, spot at 1.2240), wherein 'the recent weakness has stabilised,' and GBP 'is likely to trade in a range between 1.2130 and 1.2390.' Although GBP is still trading within the range, there has been a tentative buildup in momentum. That said, it is not enough to indicate a sustained decline. For a sustained decline, GBP must not only break clearly below 1.2130, but also 1.2100. The likelihood of GBP breaking clearly below this support zone will increase in the next few days, provided that the ‘strong resistance’ level, currently at 1.2305, is not breached."
-
11:02
Eurozone Construction Output w.d.a (YoY) rose from previous 0.2% to 1.4% in November
-
11:00
Eurozone Construction Output s.a (MoM) up to 1.2% in November from previous 1%
-
11:00
Eurozone Construction Output w.d.a (YoY) rose from previous 0.2% to 1.3% in November
-
10:59
EUR: Bracing for a Trump storm – ING
When asked about the chances of an EU trade conflict at the weekend, the European Central Bank's Isabel Schnabel said that it was 'very likely', ING's FX analyst Francesco Pesole notes.
1.0400/0435 range to cap any surprise EUR/USD rally
"Perhaps the euro should be worried that the online prediction markets only have low pricing of tariffs on the EU this week. Equally, we doubt FX markets are fully priced to universal tariffs and EUR/USD would get hit were these to emerge."
"Away from Washington this week, the eurozone's focus will be on a couple of speeches in Davos from ECB President Christine Lagarde. Currently the market prices 100bp of ECB easing this year, while ING's house view is for 125bp. This week also sees the flash PMIs for January. Presumably, there will not have been much of a recovery here as the world awaits Washington's new economic agenda."
"It is hard to know what to expect from the US today, but there is a chance that 1.0400/0435 caps any surprise EUR/USD rally on a softer-than-expected tariff story. And 1.0225 could be the extent of any sell-off should the tariff story come in hot."
-
10:55
Gold clings on to $2,700 ahead of Trump’s inauguration
- Gold price turns flat in European trading after a downbeat Asian session on Monday.
- US markets are closed, though traders brace for an eventful week ahead.
- Gold holds on to $2,700 while red lights are flashing for more downturn.
Gold’s price (XAU/USD) trades flat and holds around $2,700 on Monday after an earlier decline during the Asian session as traders are concerned over President-elect Donald Trump being sworn in as the 47th United States (US) President later in the day. Traders are assessing what to do in their Bullion positioning with concerns about Trump's policies, including tariffs and immigration, which could boost Gold's value as a haven but also lift the US Dollar (USD). Heightened political and trade uncertainties and geopolitical tensions fueled the recent gains in Gold.
Meanwhile, a minority group of bond traders believe the Federal Reserve's (Fed) next move on interest rates will be to increase them instead of a rate cut as most market participants anticipate, Bloomberg reports. Based on options linked to the Secured Overnight Financing Rate (SOFR), those traders see about a 25% chance that the Fed’s next move will be to lift rates by year-end, according to an analysis by Bloomberg Intelligence. That would be disaster news for Gold, which, in normal conditions, has an inverse correlation with yields.
Daily digest market movers: Outright bets are growing against consensus
- State Street Global Advisors, one of the world’s largest investors, says Gold prices could reach $3,100 an ounce this year, extending the 2024 rally that pushed the precious metal to its biggest annual gain in 14 years, Financial Review reported.
- The recent Commitment of Traders (COT) publication from the Commodity Futures Trading Commission (CFTC) reveals that hedge fund managers have boosted their net long Gold and Silver calls to a 5-week high, according to Reuters.
- In the Middle East, a ceasefire in the Gaza region has begun taking hold as Hamas released three female hostages in exchange for 90 Palestinians held in Israeli prisons, Reuters reports.
Technical Analysis: Difficulties ahead due to uncertainty
Gold will be on a path of uncertainty in the coming days and weeks. A large number of instructions and directives are set to be released once President-elect Donald Trump is sworn in as the 47th President on Monday. The main tailwind is that quite a few of the outlined instructions are inflationary or could trigger geopolitical uncertainty, which, in both cases, is not beneficial for Gold.
There is quite some downside risk, with no key pivotal levels nearby. If traders cannot keep the Gold price above $2,700, they should consider the downward-slopping trendline of the broken pennant chart pattern last week at $2,669 as the next support. In case more downside occurs, the 55-day Simple Moving Average (SMA) at $2,647 is next, followed by the 100-day SMA at $2,644.
Looking up, the $2,708 level needs to be regained before considering further upside. Further up, the next level to look at is $2,721, a sort of double top in November and December. In case Bullion powers through that level, the all-time high of $2,790 is the key upside barrier.
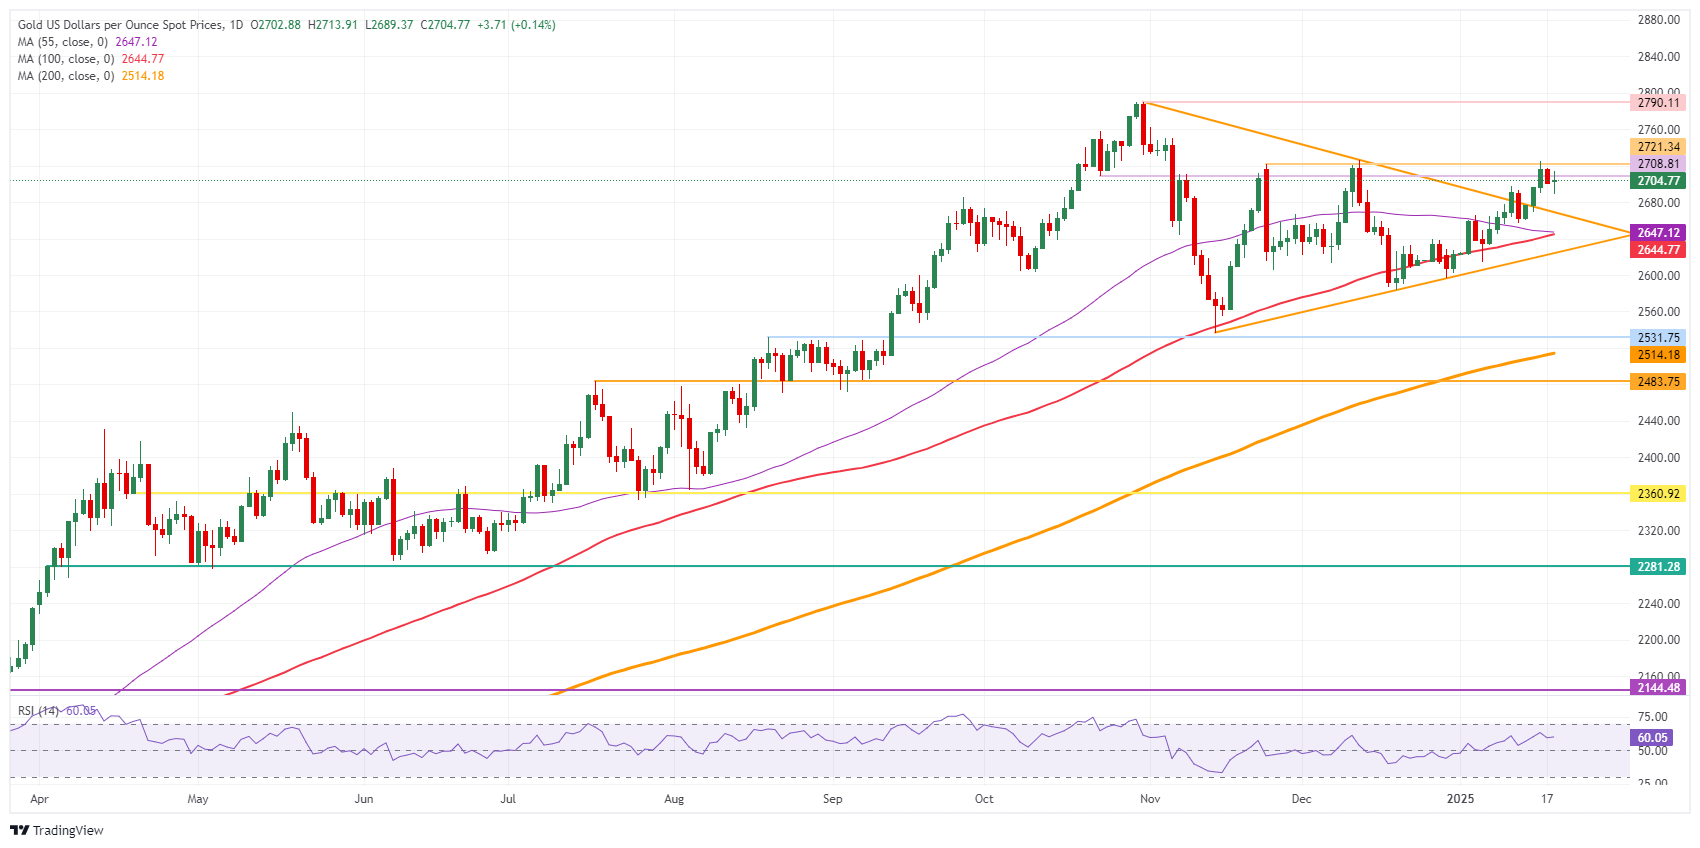
XAU/USD: Daily Chart
Gold FAQs
Gold has played a key role in human’s history as it has been widely used as a store of value and medium of exchange. Currently, apart from its shine and usage for jewelry, the precious metal is widely seen as a safe-haven asset, meaning that it is considered a good investment during turbulent times. Gold is also widely seen as a hedge against inflation and against depreciating currencies as it doesn’t rely on any specific issuer or government.
Central banks are the biggest Gold holders. In their aim to support their currencies in turbulent times, central banks tend to diversify their reserves and buy Gold to improve the perceived strength of the economy and the currency. High Gold reserves can be a source of trust for a country’s solvency. Central banks added 1,136 tonnes of Gold worth around $70 billion to their reserves in 2022, according to data from the World Gold Council. This is the highest yearly purchase since records began. Central banks from emerging economies such as China, India and Turkey are quickly increasing their Gold reserves.
Gold has an inverse correlation with the US Dollar and US Treasuries, which are both major reserve and safe-haven assets. When the Dollar depreciates, Gold tends to rise, enabling investors and central banks to diversify their assets in turbulent times. Gold is also inversely correlated with risk assets. A rally in the stock market tends to weaken Gold price, while sell-offs in riskier markets tend to favor the precious metal.
The price can move due to a wide range of factors. Geopolitical instability or fears of a deep recession can quickly make Gold price escalate due to its safe-haven status. As a yield-less asset, Gold tends to rise with lower interest rates, while higher cost of money usually weighs down on the yellow metal. Still, most moves depend on how the US Dollar (USD) behaves as the asset is priced in dollars (XAU/USD). A strong Dollar tends to keep the price of Gold controlled, whereas a weaker Dollar is likely to push Gold prices up.
-
10:37
EUR/USD: Further range trading is likely – UOB Group
Euro (EUR) is under mild downward pressure; it could dip below 1.0255 but is unlikely to reach the major support at 1.0220. In the longer run, further range trading is likely; decreasing volatility suggests a narrower range of 1.0220/1.0365, UOB Group's FX analysts Quek Ser Leang and Peter Chia note.
EUR is under mild downward pressure
24-HOUR VIEW: " EUR traded in a quiet manner last Thursday, closing largely unchanged at 1.0298. On Friday, when EUR was at 1.0300, we pointed out that 'the price movements still appear to be part of a consolidation phase.' We expected EUR to 'trade in a 1.0270/1.0330 range.' During NY session, EUR swung between 1.0264 and 1.0330 before closing lower by 0.26% at 1.0271. The price action has resulted in a slight increase in downward momentum. Today, EUR could trade with a downward bias. While it could dip below the support at 1.0255, the major support at 1.0220 is likely out of reach. Resistance is at 1.0305; a break above 1.0320 would indicate that the current mild downward pressure has eased."
1-3 WEEKS VIEW: "Our most recent narrative was from last Wednesday (15 Jan, spot at 1.0300), wherein EUR 'has likely entered a range trading phase, and it is likely to trade between 1.0220 and 1.0400 for the time being.' EUR subsequently traded in a range, but given the decreasing volatility, we expect price movements to be confined to a narrower range of 1.0220/1.0365 for now."
-
10:30
Silver price today: Silver broadly unchanged, according to FXStreet data
Silver prices (XAG/USD) broadly unchanged on Monday, according to FXStreet data. Silver trades at $30.33 per troy ounce, broadly unchanged 0.00% from the $30.33 it cost on Friday.
Silver prices have increased by 4.96% since the beginning of the year.
Unit measure Silver Price Today in USD Troy Ounce 30.33 1 Gram 0.98
The Gold/Silver ratio, which shows the number of ounces of Silver needed to equal the value of one ounce of Gold, stood at 89.17 on Monday, up from 89.07 on Friday.
Silver FAQs
Silver is a precious metal highly traded among investors. It has been historically used as a store of value and a medium of exchange. Although less popular than Gold, traders may turn to Silver to diversify their investment portfolio, for its intrinsic value or as a potential hedge during high-inflation periods. Investors can buy physical Silver, in coins or in bars, or trade it through vehicles such as Exchange Traded Funds, which track its price on international markets.
Silver prices can move due to a wide range of factors. Geopolitical instability or fears of a deep recession can make Silver price escalate due to its safe-haven status, although to a lesser extent than Gold's. As a yieldless asset, Silver tends to rise with lower interest rates. Its moves also depend on how the US Dollar (USD) behaves as the asset is priced in dollars (XAG/USD). A strong Dollar tends to keep the price of Silver at bay, whereas a weaker Dollar is likely to propel prices up. Other factors such as investment demand, mining supply – Silver is much more abundant than Gold – and recycling rates can also affect prices.
Silver is widely used in industry, particularly in sectors such as electronics or solar energy, as it has one of the highest electric conductivity of all metals – more than Copper and Gold. A surge in demand can increase prices, while a decline tends to lower them. Dynamics in the US, Chinese and Indian economies can also contribute to price swings: for the US and particularly China, their big industrial sectors use Silver in various processes; in India, consumers’ demand for the precious metal for jewellery also plays a key role in setting prices.
Silver prices tend to follow Gold's moves. When Gold prices rise, Silver typically follows suit, as their status as safe-haven assets is similar. The Gold/Silver ratio, which shows the number of ounces of Silver needed to equal the value of one ounce of Gold, may help to determine the relative valuation between both metals. Some investors may consider a high ratio as an indicator that Silver is undervalued, or Gold is overvalued. On the contrary, a low ratio might suggest that Gold is undervalued relative to Silver.
(An automation tool was used in creating this post.)
-
09:59
Greece Current Account (YoY) declined to €-3.152B in November from previous €-0.383B
-
09:56
GBP/JPY appreciates to near 190.50, lacks bullish mood due to rising odds of BoE rate cuts
- GBP/JPY continues to gain ground due to improved market sentiment.
- The Pound Sterling may struggle due to the increased likelihood of BoE’s rate cuts in 2025.
- Japan’s Core Machinery Orders grew by 3.4% MoM in November, marking the strongest growth in nine months.
GBP/JPY extends its gains for the second consecutive day, trading around 190.30 during the European hours on Monday. The GBP/JPY cross's upside momentum can be linked to risk-on sentiment. However, the British Pound (GBP) may encounter challenges due to weak UK economic data, which have fueled expectations of interest rate cuts by the Bank of England (BoE).
Following last week's weaker-than-expected UK Retail Sales and Gross Domestic Product (GDP) figures, traders anticipate additional rate cuts by the BoE in 2025. These disappointing data points highlight the UK’s gloomy economic outlook, potentially putting downward pressure on the Pound against other currencies.
The BoE is broadly expected to lower interest rates by 25 basis points (bps) at its February meeting. Markets have now priced in over 75 bps of total rate cuts for 2025, an increase from the approximately 65 bps anticipated before the latest data.
However, the upside of GBP/JPY may be capped as the Japanese Yen (JPY) finds modest support from positive domestic data and policy expectations. Japan's Core Machinery Orders rose for the second consecutive month, signaling a continued recovery in capital expenditure. According to government data released earlier on Monday, Core Machinery Orders increased by 3.4% month-on-month in November 2024, the strongest growth in nine months.
Additionally, speculation that the Bank of Japan (BoJ) might raise interest rates later this week has further bolstered the JPY. BoJ Governor Kazuo Ueda recently highlighted optimism surrounding wage growth and emphasized that the central bank could raise the policy rate again this year if economic and price conditions continue to improve.
Central banks FAQs
Central Banks have a key mandate which is making sure that there is price stability in a country or region. Economies are constantly facing inflation or deflation when prices for certain goods and services are fluctuating. Constant rising prices for the same goods means inflation, constant lowered prices for the same goods means deflation. It is the task of the central bank to keep the demand in line by tweaking its policy rate. For the biggest central banks like the US Federal Reserve (Fed), the European Central Bank (ECB) or the Bank of England (BoE), the mandate is to keep inflation close to 2%.
A central bank has one important tool at its disposal to get inflation higher or lower, and that is by tweaking its benchmark policy rate, commonly known as interest rate. On pre-communicated moments, the central bank will issue a statement with its policy rate and provide additional reasoning on why it is either remaining or changing (cutting or hiking) it. Local banks will adjust their savings and lending rates accordingly, which in turn will make it either harder or easier for people to earn on their savings or for companies to take out loans and make investments in their businesses. When the central bank hikes interest rates substantially, this is called monetary tightening. When it is cutting its benchmark rate, it is called monetary easing.
A central bank is often politically independent. Members of the central bank policy board are passing through a series of panels and hearings before being appointed to a policy board seat. Each member in that board often has a certain conviction on how the central bank should control inflation and the subsequent monetary policy. Members that want a very loose monetary policy, with low rates and cheap lending, to boost the economy substantially while being content to see inflation slightly above 2%, are called ‘doves’. Members that rather want to see higher rates to reward savings and want to keep a lit on inflation at all time are called ‘hawks’ and will not rest until inflation is at or just below 2%.
Normally, there is a chairman or president who leads each meeting, needs to create a consensus between the hawks or doves and has his or her final say when it would come down to a vote split to avoid a 50-50 tie on whether the current policy should be adjusted. The chairman will deliver speeches which often can be followed live, where the current monetary stance and outlook is being communicated. A central bank will try to push forward its monetary policy without triggering violent swings in rates, equities, or its currency. All members of the central bank will channel their stance toward the markets in advance of a policy meeting event. A few days before a policy meeting takes place until the new policy has been communicated, members are forbidden to talk publicly. This is called the blackout period.
-
09:15
USD/CAD Price Forecast: Pulls back from multi-year highs near 1.4500
- USD/CAD retreats from 1.4485, the highest level since March 2020, approached on Monday.
- The bullish bias remains intact, with the 14-day RSI holding above the 50 mark, signaling sustained upward momentum.
- The nine-day EMA at the 1.4405 level serves as initial support for the pair.
The USD/CAD pair ends its two-day winning streak, trading near 1.4450 during Monday's European session. From a technical standpoint, the daily chart suggests the pair trading within an ascending channel, indicating a continued bullish bias.
The 14-day Relative Strength Index (RSI) remains above the 50 level, reflecting sustained bullish momentum. If the RSI holds above 50, it could reinforce positive sentiment.
Furthermore, USD/CAD trades above the nine- and 14-day Exponential Moving Averages (EMAs), highlighting a bullish trend and strong short-term price momentum. This alignment signals solid buying interest and suggests the potential for further upside movement.
The USD/CAD pair continues to challenge the 1.4485, the highest level since March 2020, recorded on January 20. A further resistance level is positioned at the upper boundary of the ascending channel, near the key psychological mark of 1.4600.
On the downside, the initial support lies around the nine-day EMA at 1.4405, followed by the 14-day EMA at 1.4392, aligned with the lower boundary of the ascending channel.
USD/CAD: Daily Chart
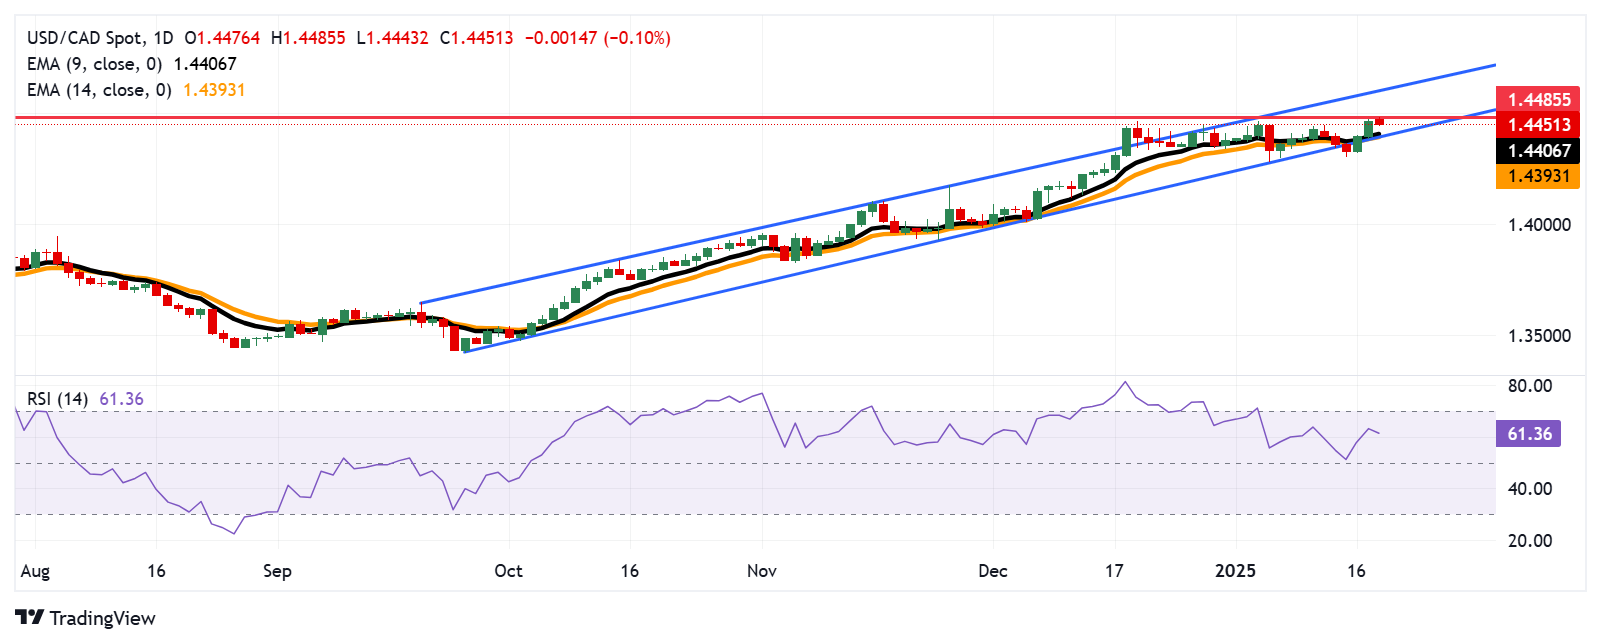
Canadian Dollar PRICE Today
The table below shows the percentage change of Canadian Dollar (CAD) against listed major currencies today. Canadian Dollar was the weakest against the New Zealand Dollar.
USD EUR GBP JPY CAD AUD NZD CHF USD -0.41% -0.35% -0.09% -0.14% -0.46% -0.43% -0.03% EUR 0.41% -0.00% 0.23% 0.16% 0.02% -0.11% 0.25% GBP 0.35% 0.00% 0.17% 0.15% 0.02% -0.13% 0.25% JPY 0.09% -0.23% -0.17% -0.04% -0.32% -0.43% -0.11% CAD 0.14% -0.16% -0.15% 0.04% -0.26% -0.29% 0.09% AUD 0.46% -0.02% -0.02% 0.32% 0.26% -0.24% 0.17% NZD 0.43% 0.11% 0.13% 0.43% 0.29% 0.24% 0.20% CHF 0.03% -0.25% -0.25% 0.11% -0.09% -0.17% -0.20% The heat map shows percentage changes of major currencies against each other. The base currency is picked from the left column, while the quote currency is picked from the top row. For example, if you pick the Canadian Dollar from the left column and move along the horizontal line to the US Dollar, the percentage change displayed in the box will represent CAD (base)/USD (quote).
-
08:49
EUR/USD recovers as market sentiment improves ahead of Trump’s inauguration
- EUR/USD recovers to near 1.0300 as the risk mode is on, with investors focusing on Trump’s inauguration.
- The Fed is expected to keep interest rates at their current levels by the May policy meeting.
- ECB’s Stournaras warns that higher tariffs by the US could drag Eurozone inflation below the central bank’s target.
EUR/USD rises sharply to near 1.0300 in Monday’s European session. The major currency pair gains as the safe-haven appeal of the US Dollar (USD) diminishes ahead of United States (US) President-elect Donald Trump’s inauguration. The US Dollar Index (DXY), which tracks the Greenback’s value against six major currencies, declines to near 109.00.
The Greenback faces pressure as investors digest the assumption that Trump will declare a national emergency soon after taking office. This move would allow him to boost domestic energy production and reverse some climate change policies executed under Joe Biden’s administration, Bloomberg reported.
Also, a report from Fox News Digital shows that Trump would sign over 200 orders on his first day of office, which might include policies such as immigration controls, tax cuts, and higher import tariffs. The impact of these policies will be favorable for the US Dollar as investors expect them to boost growth and inflationary pressures in the United States (US). The scenario will allow the Federal Reserve (Fed) to keep interest rates at their current levels for longer.
According to the CME FedWatch tool, traders expect the Fed to keep borrowing rates in the current range of 4.25%-4.50% in the next three policy meetings. On the contrary, analysts at Morgan Stanley expect that the Fed can cut interest rates in March as the underlying inflation decelerated in December. Last week, the Consumer Price Index (CPI) report for December showed that core inflation – which excludes volatile food and energy prices – rose at a slower pace of 3.2% year-over-year.
Daily digest market movers: EUR/USD gains at the US Dollar’s expense
- EUR/USD gains on risk-on profile, with investors awaiting Trump’s inauguration. However, the Euro (EUR) outlook remains uncertain as investors expect the European Central Bank (ECB) to deliver a series of interest rate cuts in coming policy meetings.
- Traders are fully pricing in an ECB’s 100 basis points (bps) interest rate reduction by mid-summer, which will come in the form of a 25 bps cut in each of the following four meetings. Dovish ECB bets have accelerated partly because of growing expectations that the Eurozone inflation will sustainably return to the central bank’s target of 2% and high uncertainty over incoming tariff policies from the US.
- Market experts are confident about further slower Eurozone inflation as they expect service inflation to slow down this year. Analysts at Capital Economics said in a report that the marginal increase in inflation in the services sector in December, to 4% from 3.9%, was driven by the transport and package holiday categories, which have a dependence on oil prices, while other sectors collectively contributed less to the overall inflation figure. The agency expects that oil prices are projected to drop based on historical patterns, which would soften the Eurozone inflation.
- Meanwhile, ECB officials are also comfortable with dovish bets. On Friday, ECB policymaker and the Governor of the Bank of Greece Yannis Stournaras said that policy should continue with a "series of rate cuts" at the next meetings. His dovish stance was based on the assumption that fresh protectionist measures imposed by the US could lead to "below-target Eurozone inflation."
Technical Analysis: EUR/USD stays sideways around 1.0300
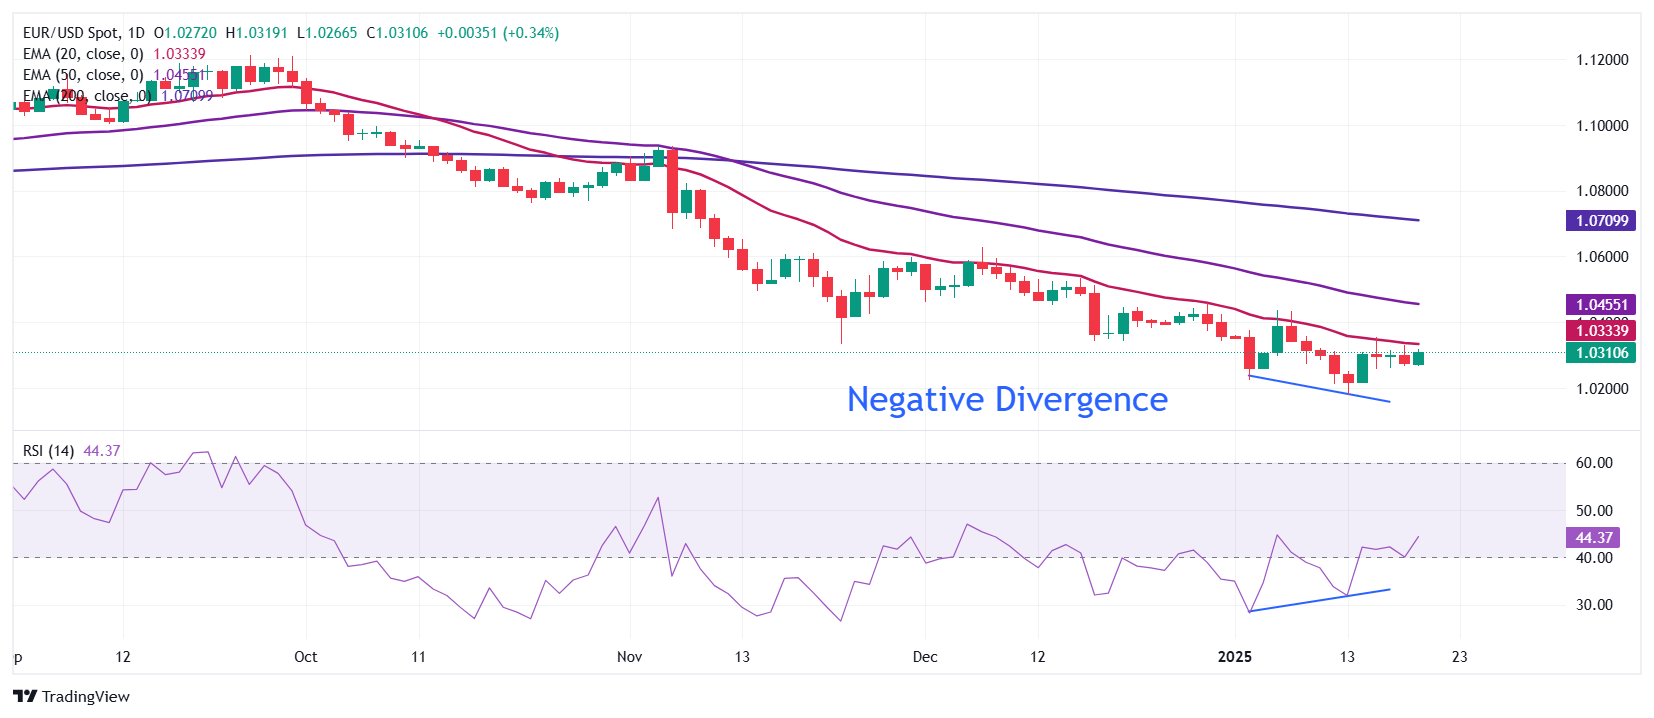
EUR/USD bounces back to near 1.0310 at the start of the week. The shared currency pair has been trading sideways around 1.0300 the last four trading days after recovering from an over two-year low of 1.175 last week. The major currency pair rebounds amid a divergence in momentum and price action. The 14-day Relative Strength Index (RSI) formed a higher low near 35.00, while the pair made lower lows.
However, the outlook of the shared currency pair is still bearish as all short-to-long-term Exponential Moving Averages (EMAs) are sloping downwards.
Looking down, the January 13 low of 1.0175 will be the key support zone for the pair. Conversely, the January 6 high of 1.0437 will be the key barrier for the Euro bulls.
Euro FAQs
The Euro is the currency for the 19 European Union countries that belong to the Eurozone. It is the second most heavily traded currency in the world behind the US Dollar. In 2022, it accounted for 31% of all foreign exchange transactions, with an average daily turnover of over $2.2 trillion a day. EUR/USD is the most heavily traded currency pair in the world, accounting for an estimated 30% off all transactions, followed by EUR/JPY (4%), EUR/GBP (3%) and EUR/AUD (2%).
The European Central Bank (ECB) in Frankfurt, Germany, is the reserve bank for the Eurozone. The ECB sets interest rates and manages monetary policy. The ECB’s primary mandate is to maintain price stability, which means either controlling inflation or stimulating growth. Its primary tool is the raising or lowering of interest rates. Relatively high interest rates – or the expectation of higher rates – will usually benefit the Euro and vice versa. The ECB Governing Council makes monetary policy decisions at meetings held eight times a year. Decisions are made by heads of the Eurozone national banks and six permanent members, including the President of the ECB, Christine Lagarde.
Eurozone inflation data, measured by the Harmonized Index of Consumer Prices (HICP), is an important econometric for the Euro. If inflation rises more than expected, especially if above the ECB’s 2% target, it obliges the ECB to raise interest rates to bring it back under control. Relatively high interest rates compared to its counterparts will usually benefit the Euro, as it makes the region more attractive as a place for global investors to park their money.
Data releases gauge the health of the economy and can impact on the Euro. Indicators such as GDP, Manufacturing and Services PMIs, employment, and consumer sentiment surveys can all influence the direction of the single currency. A strong economy is good for the Euro. Not only does it attract more foreign investment but it may encourage the ECB to put up interest rates, which will directly strengthen the Euro. Otherwise, if economic data is weak, the Euro is likely to fall. Economic data for the four largest economies in the euro area (Germany, France, Italy and Spain) are especially significant, as they account for 75% of the Eurozone’s economy.
Another significant data release for the Euro is the Trade Balance. This indicator measures the difference between what a country earns from its exports and what it spends on imports over a given period. If a country produces highly sought after exports then its currency will gain in value purely from the extra demand created from foreign buyers seeking to purchase these goods. Therefore, a positive net Trade Balance strengthens a currency and vice versa for a negative balance.
-
08:43
AUD/JPY rises to near 97.00 due to stronger commodity prices, risk-on sentiment
- AUD/JPY appreciates as the AUD receives support from rising metals prices.
- The PBoC maintained its one- and five-year Loan Prime Rates at 3.10% and 3.60%, respectively.
- Japan’s Core Machinery Orders increased by 3.4% MoM in November, marking the strongest growth in nine months.
AUD/JPY continues to gain ground for the second successive day, trading around 97.00 during the early European hours on Monday. The Australian Dollar (AUD) receives support from stronger commodity prices and a broader risk-on sentiment.
However, the Aussie Dollar could face challenges as market expectations grow that the Reserve Bank of Australia (RBA) might start cutting rates as early as next month. Traders are now focusing on Australia’s quarterly inflation report, set to be released next week, for clues about the future direction of interest rates.
The People’s Bank of China (PBOC) announced on Monday that it would keep its Loan Prime Rates (LPRs) unchanged. The one-year Loan Prime Rate (LPR) remains at 3.10%, while the five-year LPR stands at 3.60%. Since China and Australia are close trading partners, any shifts in China’s economy could have an impact on Australian markets.
However, the upside of the AUD/JPY could be limited as the Japanese Yen (JPY) gains modest support from a rise in Japan's Core Machinery Orders, which increased for the second consecutive month, indicating a continued recovery in capital expenditure. According to government data released earlier this Monday, Core Machinery Orders grew by 3.4% month-on-month in November 2024, marking the strongest growth in nine months.
Additionally, growing speculation that the Bank of Japan (BoJ) will raise interest rates later this week bolstered the JPY. BoJ Governor Kazuo Ueda stated last week that there has been significant optimism regarding wage growth. He reiterated that the central bank would further raise the policy rate this year if economic and price conditions show continued improvement.
Interest rates FAQs
Interest rates are charged by financial institutions on loans to borrowers and are paid as interest to savers and depositors. They are influenced by base lending rates, which are set by central banks in response to changes in the economy. Central banks normally have a mandate to ensure price stability, which in most cases means targeting a core inflation rate of around 2%. If inflation falls below target the central bank may cut base lending rates, with a view to stimulating lending and boosting the economy. If inflation rises substantially above 2% it normally results in the central bank raising base lending rates in an attempt to lower inflation.
Higher interest rates generally help strengthen a country’s currency as they make it a more attractive place for global investors to park their money.
Higher interest rates overall weigh on the price of Gold because they increase the opportunity cost of holding Gold instead of investing in an interest-bearing asset or placing cash in the bank. If interest rates are high that usually pushes up the price of the US Dollar (USD), and since Gold is priced in Dollars, this has the effect of lowering the price of Gold.
The Fed funds rate is the overnight rate at which US banks lend to each other. It is the oft-quoted headline rate set by the Federal Reserve at its FOMC meetings. It is set as a range, for example 4.75%-5.00%, though the upper limit (in that case 5.00%) is the quoted figure. Market expectations for future Fed funds rate are tracked by the CME FedWatch tool, which shapes how many financial markets behave in anticipation of future Federal Reserve monetary policy decisions.
-
08:31
ECB’s Holzmann: A rate cut is not a foregone conclusion for me at all
European Central Bank (ECB) policymaker Robert Holzmann said in a Politico interview on Monday, “a rate cut is not a foregone conclusion for me at all.”
Additional quotes
Latest data shows inflation well above 2% in December.
That will likely also be the case for January.
ECB risks hurting its credibility if it cuts rates when inflation rises faster than initially thought.
Market reaction
EUR/USD was last seen trading 0.28% higher on the day at 1.0312.
-
08:30
Switzerland Producer and Import Prices (YoY): -0.9% (December) vs -1.5%
-
08:30
Switzerland Producer and Import Prices (MoM) below forecasts (0.2%) in December: Actual (0%)
-
08:05
NZD/USD holds gains above 0.5600 despite a market caution ahead of Trump’s inauguration
- NZD/USD remains stronger despite a cautious mood ahead of President-elect Donald Trump’s inauguration on Monday.
- Traders adopt caution amid uncertainty surrounding Trump’s policy pledges, including imposing tariffs and extending tax cuts.
- The PBoC maintained its one- and five-year Loan Prime Rates at 3.10% and 3.60%, respectively.
The NZD/USD pair pauses its two-day losing streak, trading around 0.5610 during the Asian hours on Monday. This upside of the pair is attributed to the subdued US Dollar (USD) amid cautious market sentiment ahead of President-elect Donald Trump’s inauguration later in the day. Additionally, US markets will remain closed on Monday in observance of Martin Luther King Jr. Day.
The US Dollar Index (DXY), which tracks the performance of the USD against six major currencies, hovers around 109.10 at the time of writing. Despite this, the Greenback finds some support as US Treasury yields rise, fueled by concerns over Trump’s proposed policies, including potential tariffs, extended tax cuts, and stricter immigration measures. Analysts suggest that the Federal Reserve’s (Fed) future interest rate decisions may hinge on how aggressively these policies are implemented.
Market participants will closely monitor Trump’s anticipated executive orders, expected to follow shortly after he takes office. Meanwhile, the Fed is widely expected to maintain current interest rates at its January meeting, with most economists surveyed by Reuters predicting a resumption of rate hikes in March.
The People’s Bank of China (PBOC) announced on Monday that it would keep its Loan Prime Rates (LPRs) unchanged. The one-year Loan Prime Rate (LPR) remains at 3.10%, while the five-year LPR stands at 3.60%. Since China and New Zealand are close trading partners, any shifts in China’s economy could have an impact on Antipodean markets.
The NZD also gained ground due to the robust economic data from China. China’s Gross Domestic Product (GDP) grew 5.4% over the year in the fourth quarter of 2024 after reporting a 4.6% expansion in the third quarter. Data beat the market consensus of 5% in the reported period, by a wide margin. Additionally, the annual December Retail Sales increased by 3.7% vs. the 3.5% expected and 3.0% prior, while Industrial Production arrived at 6.2% vs. the 5.4% forecast and November’s 5.4%.
New Zealand Dollar FAQs
The New Zealand Dollar (NZD), also known as the Kiwi, is a well-known traded currency among investors. Its value is broadly determined by the health of the New Zealand economy and the country’s central bank policy. Still, there are some unique particularities that also can make NZD move. The performance of the Chinese economy tends to move the Kiwi because China is New Zealand’s biggest trading partner. Bad news for the Chinese economy likely means less New Zealand exports to the country, hitting the economy and thus its currency. Another factor moving NZD is dairy prices as the dairy industry is New Zealand’s main export. High dairy prices boost export income, contributing positively to the economy and thus to the NZD.
The Reserve Bank of New Zealand (RBNZ) aims to achieve and maintain an inflation rate between 1% and 3% over the medium term, with a focus to keep it near the 2% mid-point. To this end, the bank sets an appropriate level of interest rates. When inflation is too high, the RBNZ will increase interest rates to cool the economy, but the move will also make bond yields higher, increasing investors’ appeal to invest in the country and thus boosting NZD. On the contrary, lower interest rates tend to weaken NZD. The so-called rate differential, or how rates in New Zealand are or are expected to be compared to the ones set by the US Federal Reserve, can also play a key role in moving the NZD/USD pair.
Macroeconomic data releases in New Zealand are key to assess the state of the economy and can impact the New Zealand Dollar’s (NZD) valuation. A strong economy, based on high economic growth, low unemployment and high confidence is good for NZD. High economic growth attracts foreign investment and may encourage the Reserve Bank of New Zealand to increase interest rates, if this economic strength comes together with elevated inflation. Conversely, if economic data is weak, NZD is likely to depreciate.
The New Zealand Dollar (NZD) tends to strengthen during risk-on periods, or when investors perceive that broader market risks are low and are optimistic about growth. This tends to lead to a more favorable outlook for commodities and so-called ‘commodity currencies’ such as the Kiwi. Conversely, NZD tends to weaken at times of market turbulence or economic uncertainty as investors tend to sell higher-risk assets and flee to the more-stable safe havens.
-
08:02
Forex Today: US Dollar retreats on Trump's Inauguration Day
Here is what you need to know on Monday, January 20:
The US Dollar (USD) stays on the back foot to start the week as investors gear up for Donald Trump's second inauguration. Meanwhile, stock and bond markets in the US will be closed in observance of the Martin Luther King Jr. Day holiday on Monday.
US Dollar PRICE Today
The table below shows the percentage change of US Dollar (USD) against listed major currencies today. US Dollar was the weakest against the British Pound.
USD EUR GBP JPY CAD AUD NZD CHF USD -0.37% -0.38% 0.00% -0.16% -0.35% -0.30% -0.02% EUR 0.37% -0.07% 0.26% 0.11% 0.08% -0.04% 0.24% GBP 0.38% 0.07% 0.29% 0.16% 0.17% 0.02% 0.29% JPY 0.00% -0.26% -0.29% -0.15% -0.29% -0.40% -0.20% CAD 0.16% -0.11% -0.16% 0.15% -0.12% -0.15% 0.12% AUD 0.35% -0.08% -0.17% 0.29% 0.12% -0.22% 0.10% NZD 0.30% 0.04% -0.02% 0.40% 0.15% 0.22% 0.08% CHF 0.02% -0.24% -0.29% 0.20% -0.12% -0.10% -0.08% The heat map shows percentage changes of major currencies against each other. The base currency is picked from the left column, while the quote currency is picked from the top row. For example, if you pick the US Dollar from the left column and move along the horizontal line to the Japanese Yen, the percentage change displayed in the box will represent USD (base)/JPY (quote).
After closing in positive territory on Friday, the USD Index turns south in the European morning on Monday and trades in negative territory at around 109.00. Trump is expected to announce severe restrictions on immigration on his first day in office. More importantly, investors will pay close attention to any comments on his tariff policy and its potential impact on markets and the inflation outlook.
During the Asian trading hours, the People’s Bank of China (PBoC), China's central bank, announced that it left the one-year and five-year Loan Prime Rates unchanged at 3.10% and 3.60%, respectively. This decision came in line with the market expectation.
EUR/USD closed the previous week marginally higher. Supported by the broad-based USD weakness, the pair trades in positive territory above 1.0300 to begin the European session. Later in the session, Eurostat will publish Construction Output data for November.
After suffering large losses to begin the year, GBP/USD failed to gather recovery momentum and closed in the red for the third consecutive week. The pair gains traction early Monday and trades above 1.2200.
USD/JPY registered strong gains on Friday but still lost nearly 1% for the week. The pair stays in a consolidation phase slightly above 156.00 in the European morning.
Despite a bearish start to the previous week, Gold extended its rebound and posted modest gains. XAU/USD stays relatively quiet on Monday but manages to hold comfortably above $2,700.
US Dollar FAQs
The US Dollar (USD) is the official currency of the United States of America, and the ‘de facto’ currency of a significant number of other countries where it is found in circulation alongside local notes. It is the most heavily traded currency in the world, accounting for over 88% of all global foreign exchange turnover, or an average of $6.6 trillion in transactions per day, according to data from 2022. Following the second world war, the USD took over from the British Pound as the world’s reserve currency. For most of its history, the US Dollar was backed by Gold, until the Bretton Woods Agreement in 1971 when the Gold Standard went away.
The most important single factor impacting on the value of the US Dollar is monetary policy, which is shaped by the Federal Reserve (Fed). The Fed has two mandates: to achieve price stability (control inflation) and foster full employment. Its primary tool to achieve these two goals is by adjusting interest rates. When prices are rising too quickly and inflation is above the Fed’s 2% target, the Fed will raise rates, which helps the USD value. When inflation falls below 2% or the Unemployment Rate is too high, the Fed may lower interest rates, which weighs on the Greenback.
In extreme situations, the Federal Reserve can also print more Dollars and enact quantitative easing (QE). QE is the process by which the Fed substantially increases the flow of credit in a stuck financial system. It is a non-standard policy measure used when credit has dried up because banks will not lend to each other (out of the fear of counterparty default). It is a last resort when simply lowering interest rates is unlikely to achieve the necessary result. It was the Fed’s weapon of choice to combat the credit crunch that occurred during the Great Financial Crisis in 2008. It involves the Fed printing more Dollars and using them to buy US government bonds predominantly from financial institutions. QE usually leads to a weaker US Dollar.
Quantitative tightening (QT) is the reverse process whereby the Federal Reserve stops buying bonds from financial institutions and does not reinvest the principal from the bonds it holds maturing in new purchases. It is usually positive for the US Dollar.
-
08:00
Germany Producer Price Index (MoM) below expectations (0.3%) in December: Actual (-0.1%)
-
08:00
Germany Producer Price Index (YoY) came in at 0.8%, below expectations (1.1%) in December
-
07:57
EUR/GBP softens below 0.8450 as weaker UK data boost BoE rate cut bets
- EUR/GBP drifts lower to near 0.8440 in Monday’s early European session.
- ECB policymakers said the central bank must be prudent with rate cuts given high uncertainty.
- Softer inflation and slower growth in the UK economy pave the path for BoE rate cuts.
The EUR/GBP cross trades with mild losses around 0.8440 during the early European session on Monday. The downbeat UK economic data boost the interest rate cut bets from the Bank of England (BoE), weighing on the Pound Sterling (GBP) against the Euro (EUR). Traders will keep an eye on Germany’s December Producer Price Index (PPI), which is due later on Monday. On Tuesday, the UK Employment data will be in the spotlight.
The ECB emphasised gradual and cautious rate cuts amid economic uncertainties. ECB policymaker Joachim Nagel said on Friday that the central bank should not rush to cut the interest rates as inflation remains high and uncertainty great. Meanwhile, ECB Executive Board member Isabel Schnabel noted that the central bank likely has room to continue lowering borrowing costs as inflation converges toward 2% but must proceed carefully.
The ECB slashed interest rates four times last year, and investors expect another three or four reductions in 2025 as inflation could move closer to its 2% objective in the next months, despite global economic uncertainty.
On the GBP’s front, investors bet on more BoE rate cuts in 2025 after the weaker-than-expected UK Retail Sales and Gross Domestic Product (GDP) last week. These disappointing reports add to the dim economic picture in the United Kingdom, which might exert some selling pressure on the GBP and create a tailwind for EUR/GBP. The BoE is widely anticipated to cut the interest rate by 25 bps at its February meeting. Markets priced in a total of more than 75 basis points (bps) worth of interest rate cuts throughout 2025, up from around 65 bps reductions expected before the data.Pound Sterling FAQs
The Pound Sterling (GBP) is the oldest currency in the world (886 AD) and the official currency of the United Kingdom. It is the fourth most traded unit for foreign exchange (FX) in the world, accounting for 12% of all transactions, averaging $630 billion a day, according to 2022 data. Its key trading pairs are GBP/USD, also known as ‘Cable’, which accounts for 11% of FX, GBP/JPY, or the ‘Dragon’ as it is known by traders (3%), and EUR/GBP (2%). The Pound Sterling is issued by the Bank of England (BoE).
The single most important factor influencing the value of the Pound Sterling is monetary policy decided by the Bank of England. The BoE bases its decisions on whether it has achieved its primary goal of “price stability” – a steady inflation rate of around 2%. Its primary tool for achieving this is the adjustment of interest rates. When inflation is too high, the BoE will try to rein it in by raising interest rates, making it more expensive for people and businesses to access credit. This is generally positive for GBP, as higher interest rates make the UK a more attractive place for global investors to park their money. When inflation falls too low it is a sign economic growth is slowing. In this scenario, the BoE will consider lowering interest rates to cheapen credit so businesses will borrow more to invest in growth-generating projects.
Data releases gauge the health of the economy and can impact the value of the Pound Sterling. Indicators such as GDP, Manufacturing and Services PMIs, and employment can all influence the direction of the GBP. A strong economy is good for Sterling. Not only does it attract more foreign investment but it may encourage the BoE to put up interest rates, which will directly strengthen GBP. Otherwise, if economic data is weak, the Pound Sterling is likely to fall.
Another significant data release for the Pound Sterling is the Trade Balance. This indicator measures the difference between what a country earns from its exports and what it spends on imports over a given period. If a country produces highly sought-after exports, its currency will benefit purely from the extra demand created from foreign buyers seeking to purchase these goods. Therefore, a positive net Trade Balance strengthens a currency and vice versa for a negative balance.
-
06:57
Gold price climbs above $2,700; upside seems limited ahead of Trump’s inauguration
- Gold price reverses the Asian session dip amid emergence of mild US Dollar selling on Monday.
- Bets that the Fed will pause its rate-cutting cycle might cap the XAU/USD amid a positive risk tone.
- Traders now keenly await US President-elect Donald Trump’s inaugural address for a fresh impetus.
Gold price (XAU/USD) attracts some dip-buyers near the $2,689 region during the Asian session on Monday and for now, seems to have stalled its retracement slide from over a one-month top touched last week. The US Dollar (USD) kicks off the new week on a softer note and erodes a part of Friday's positive move amid bets that the Federal Reserve (Fed) will cut interest rates twice this year amid signs of abating inflation in the US. This, along with uncertainty over US President-elect Donald Trump's tariff plans, lifts the safe-haven precious metal back above the $2,700 mark in the last hour.
Meanwhile, expectations that Trump's protectionist policies could boost inflation and force the Fed to stick to its hawkish stance might hold back the USD bears from placing aggressive bearish bets. This, along with easing tensions in the Middle East and hopes that Trump could relax curbs on Russia in exchange for a deal to end the Ukraine war, might contribute to capping the upside for the non-yielding Gold price. Traders might also opt to wait for Trump's inaugural speech before positioning for a firm intraday direction amid a US holiday in observance of Martin Luther King Jr. Day.
Gold price draws support from modest USD downtick, bets for further Fed rate cuts in 2025
- Gold price registered gains for the third consecutive week amid bets that the Federal Reserve may not exclude the possibility of cutting interest rates further in 2025 and benefits the Gold price.
- The expectations were lifted by the US Producer Price Index (PPI) and Consumer Price Index (CPI) released last week, which indicated that inflationary pressures in the US eased in December.
- Adding to this, Fed Governor Christopher Waller said last Thursday that inflation is likely to continue to ease and allow the US central bank to cut interest rates sooner and faster than expected.
- The US Dollar struggles to capitalize on Friday's positive move, which, along with concerns about US President-elect Donald Trump's disruptive trade tariffs, underpins the safe-haven XAU/USD.
- Against the backdrop of the Israel-Hamas ceasefire deal, hopes that Trump might relax curbs on Russia in exchange for a deal to end the Ukraine war remain supportive of the positive risk tone.
- Furthermore, the US central bank is expected to pause its rate-cutting cycle later this month amid expectations that Trump's policies could stoke inflation, capping the non-yielding yellow metal.
- Traders might also refrain from placing aggressive directional bets ahead of Trump's inaugural address later this Monday and a US holiday in observance of Martin Luther King Jr. Day.
Gold price could accelerate the positive move once the $2,724-2,725 barrier is cleared decisively
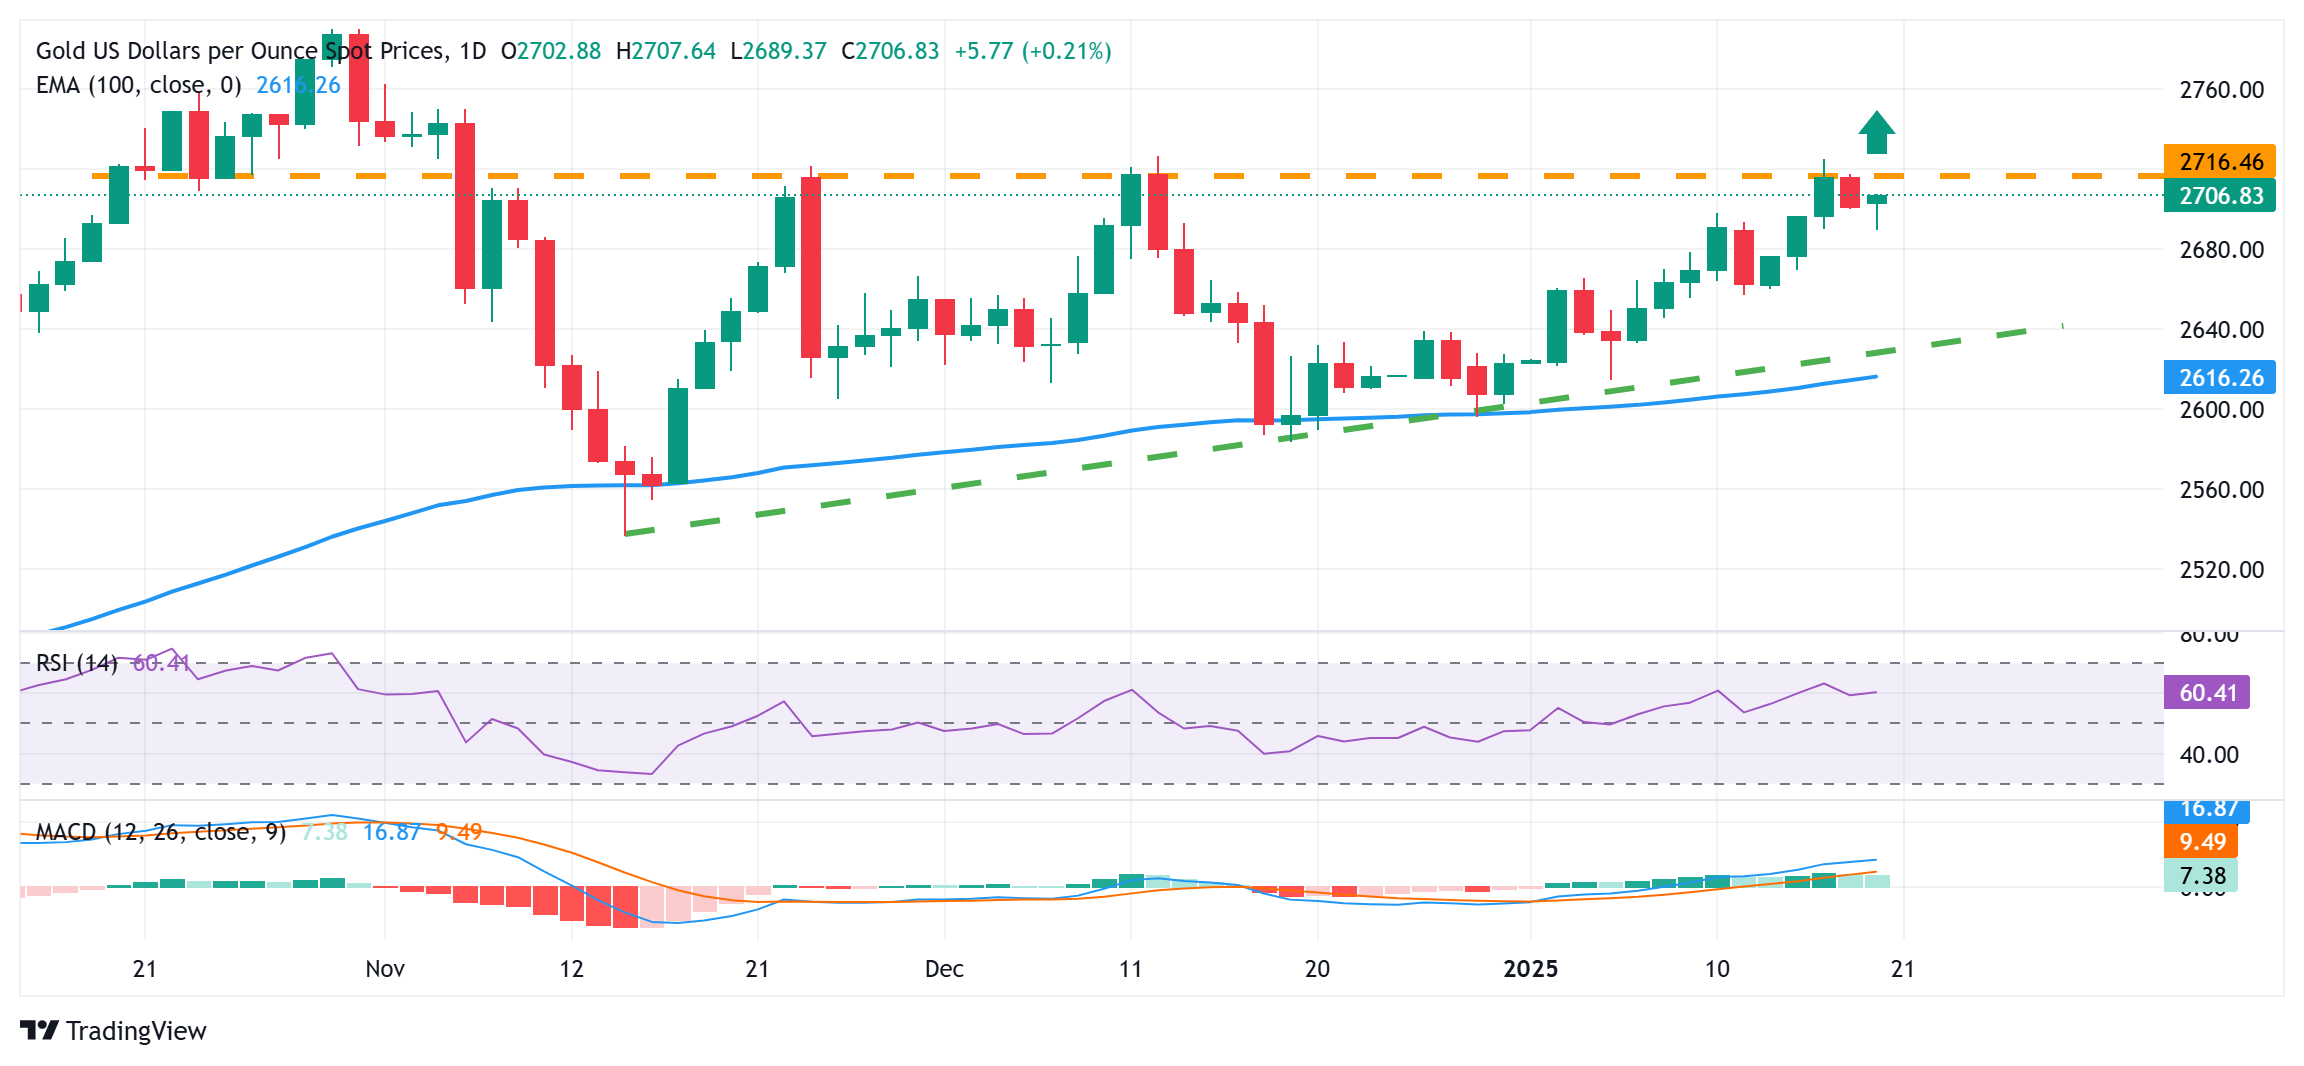
From a technical perspective, any subsequent move up is likely to face some resistance near the $2,715 area ahead of the $2,724-2,725 region, or a one-month top touched last Thursday. Given that oscillators on the daily chart have been gaining positive traction, some follow-through buying should pave the way for a move towards the $2,745 intermediate hurdle en route to the $2,760-2,762 area. The XAU/USD might eventually aim towards challenging the all-time peak, around the $2,790 region touched in October 2024.
On the flip side, any meaningful slide below the $2,700-2,690 immediate support could be seen as a buying opportunity and remain limited near the $2,662-2,662 region. The latter should act as a pivotal point, below which the Gold price could fall to the $2,635 zone en route to the $2,620-2,615 confluence – comprising a short-term ascending trend-line extending from the November swing low and the 100-day Exponential Moving Average (EMA).
Gold FAQs
Gold has played a key role in human’s history as it has been widely used as a store of value and medium of exchange. Currently, apart from its shine and usage for jewelry, the precious metal is widely seen as a safe-haven asset, meaning that it is considered a good investment during turbulent times. Gold is also widely seen as a hedge against inflation and against depreciating currencies as it doesn’t rely on any specific issuer or government.
Central banks are the biggest Gold holders. In their aim to support their currencies in turbulent times, central banks tend to diversify their reserves and buy Gold to improve the perceived strength of the economy and the currency. High Gold reserves can be a source of trust for a country’s solvency. Central banks added 1,136 tonnes of Gold worth around $70 billion to their reserves in 2022, according to data from the World Gold Council. This is the highest yearly purchase since records began. Central banks from emerging economies such as China, India and Turkey are quickly increasing their Gold reserves.
Gold has an inverse correlation with the US Dollar and US Treasuries, which are both major reserve and safe-haven assets. When the Dollar depreciates, Gold tends to rise, enabling investors and central banks to diversify their assets in turbulent times. Gold is also inversely correlated with risk assets. A rally in the stock market tends to weaken Gold price, while sell-offs in riskier markets tend to favor the precious metal.
The price can move due to a wide range of factors. Geopolitical instability or fears of a deep recession can quickly make Gold price escalate due to its safe-haven status. As a yield-less asset, Gold tends to rise with lower interest rates, while higher cost of money usually weighs down on the yellow metal. Still, most moves depend on how the US Dollar (USD) behaves as the asset is priced in dollars (XAU/USD). A strong Dollar tends to keep the price of Gold controlled, whereas a weaker Dollar is likely to push Gold prices up.
-
06:52
FX option expiries for Jan 20 NY cut
FX option expiries for Jan 20 NY cut at 10:00 Eastern Time via DTCC can be found below.
EUR/USD: EUR amounts
- 1.0150 973m
- 1.0200 1.3b
- 1.0300 2.2b
- 1.0325 1.3b
GBP/USD: GBP amounts
- 1.2200 620m
- 1.2300 786m
USD/JPY: USD amounts
- 155.00 550m
AUD/USD: AUD amounts
- 0.6185 781m
- 0.6300 1b
-
06:11
USD/CHF Price Forecast: The first upside barrier emerges near 0.9200
- USD/CHF weakens to around 0.9130 in Monday’s Asian session, losing 0.22% on the day.
- The positive view of the pair prevails above the 100-day EMA with the bullish RSI indicator.
- The first upside barrier emerges at 0.9200; the initial support level is located at 0.9082.
The USD/CHF pair edges lower to near 0.9130 during the Asian trading hours on Monday, pressured by the weakening of the US Dollar (USD). The cautious mood in the markets ahead of Donald Trump’s presidential inauguration provides some support to the safe-haven flows, benefiting the Swiss Franc (CHF).
Technically, USD/CHF keeps a bullish vibe at present as the price is well supported above the key 100-day Exponential Moving Average (EMA) on the daily chart. Additionally, the upward momentum is supported by the 14-day Relative Strength Index (RSI), which is located above the midline near 60.50, suggesting that further upside looks favorable.
The crucial resistance level for USD/CHF emerges at 0.9200, presenting the psychological level, the high of January 13, and the upper boundary of the Bollinger Band. Any follow-through buying above this level could pave the way to 0.9225, the high of May 1. The next upside barrier is seen at 0.9300, the high of March 17, 2023.
On the other hand, the initial support level is at 0.9082, the low of January 15. Extended losses below this level could expose the key contention level at 0.9000, the round figure. The additional downside filter to watch is 0.8980, the lower limit of the Bollinger Band, followed by 0.8874, the 100-day EMA.USD/CHF daily chart
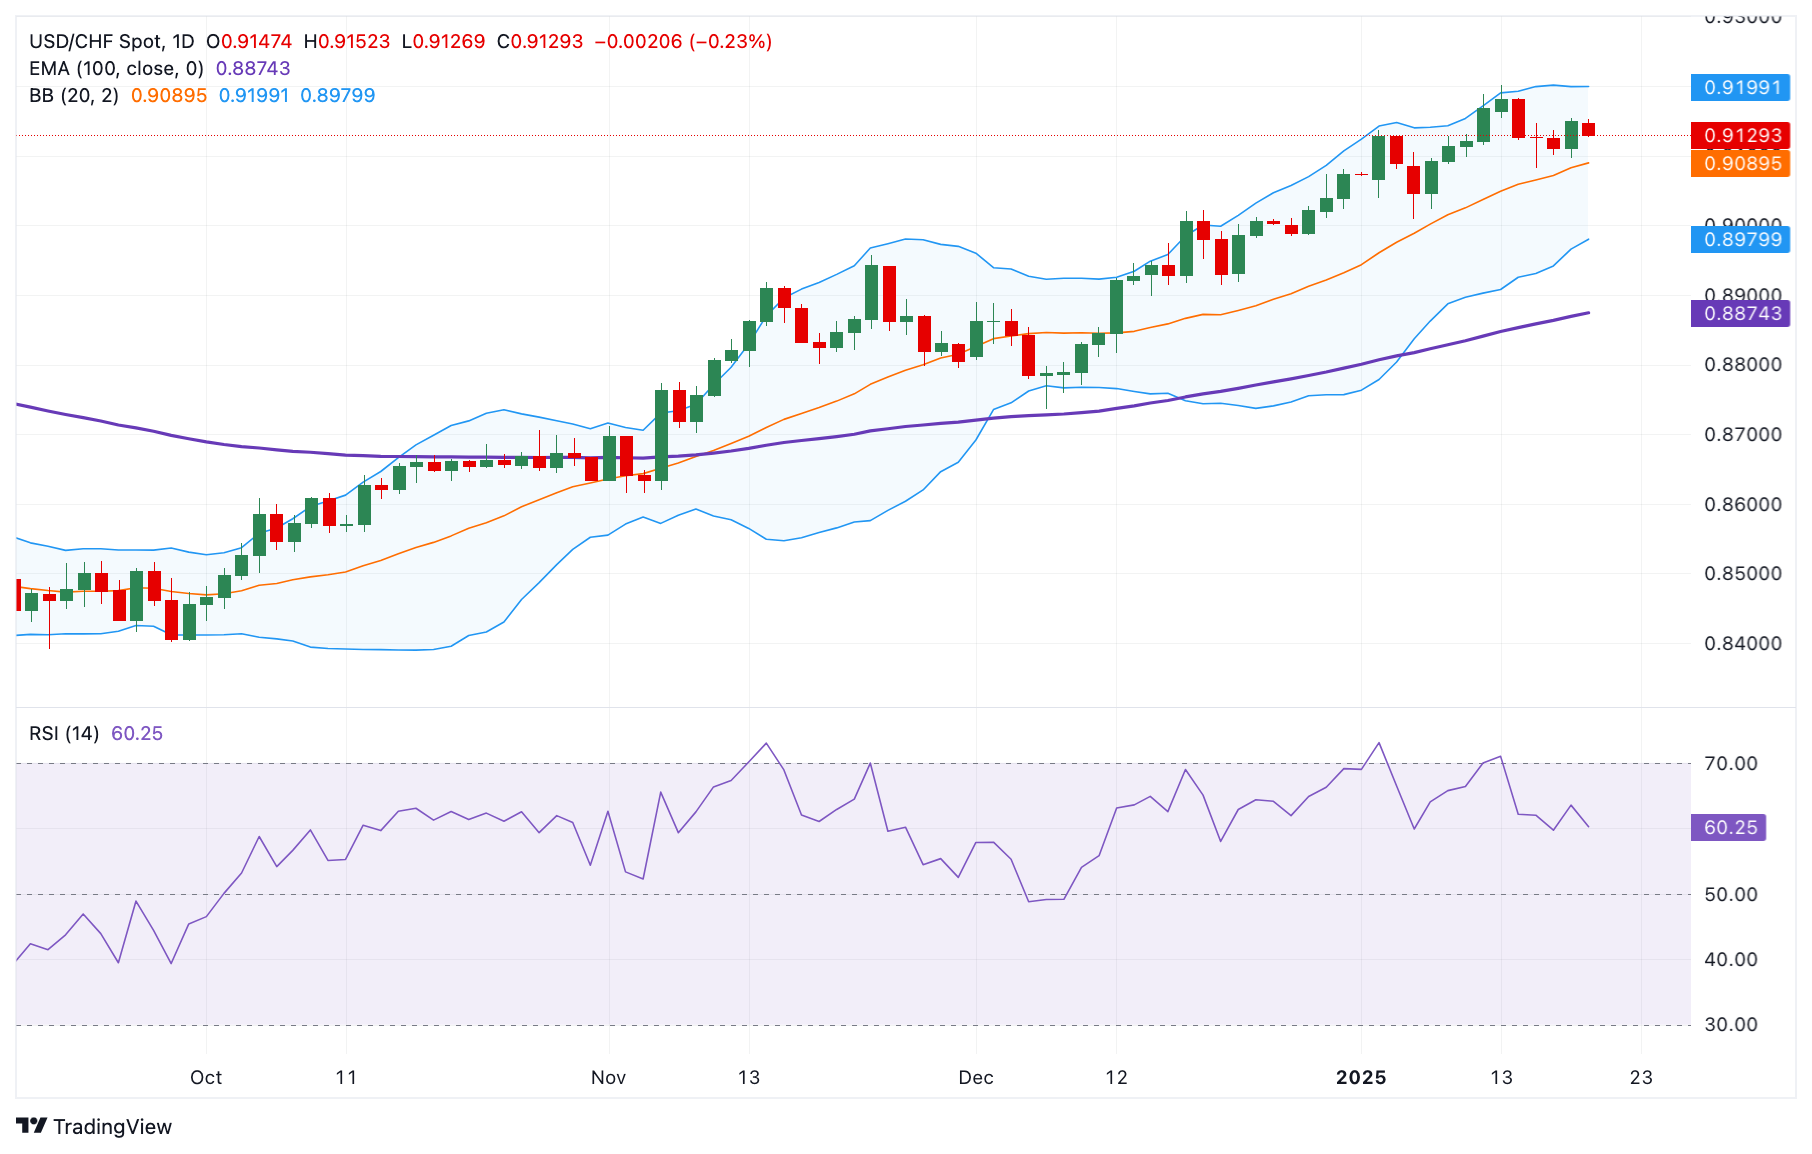
Swiss Franc FAQs
The Swiss Franc (CHF) is Switzerland’s official currency. It is among the top ten most traded currencies globally, reaching volumes that well exceed the size of the Swiss economy. Its value is determined by the broad market sentiment, the country’s economic health or action taken by the Swiss National Bank (SNB), among other factors. Between 2011 and 2015, the Swiss Franc was pegged to the Euro (EUR). The peg was abruptly removed, resulting in a more than 20% increase in the Franc’s value, causing a turmoil in markets. Even though the peg isn’t in force anymore, CHF fortunes tend to be highly correlated with the Euro ones due to the high dependency of the Swiss economy on the neighboring Eurozone.
The Swiss Franc (CHF) is considered a safe-haven asset, or a currency that investors tend to buy in times of market stress. This is due to the perceived status of Switzerland in the world: a stable economy, a strong export sector, big central bank reserves or a longstanding political stance towards neutrality in global conflicts make the country’s currency a good choice for investors fleeing from risks. Turbulent times are likely to strengthen CHF value against other currencies that are seen as more risky to invest in.
The Swiss National Bank (SNB) meets four times a year – once every quarter, less than other major central banks – to decide on monetary policy. The bank aims for an annual inflation rate of less than 2%. When inflation is above target or forecasted to be above target in the foreseeable future, the bank will attempt to tame price growth by raising its policy rate. Higher interest rates are generally positive for the Swiss Franc (CHF) as they lead to higher yields, making the country a more attractive place for investors. On the contrary, lower interest rates tend to weaken CHF.
Macroeconomic data releases in Switzerland are key to assessing the state of the economy and can impact the Swiss Franc’s (CHF) valuation. The Swiss economy is broadly stable, but any sudden change in economic growth, inflation, current account or the central bank’s currency reserves have the potential to trigger moves in CHF. Generally, high economic growth, low unemployment and high confidence are good for CHF. Conversely, if economic data points to weakening momentum, CHF is likely to depreciate.
As a small and open economy, Switzerland is heavily dependent on the health of the neighboring Eurozone economies. The broader European Union is Switzerland’s main economic partner and a key political ally, so macroeconomic and monetary policy stability in the Eurozone is essential for Switzerland and, thus, for the Swiss Franc (CHF). With such dependency, some models suggest that the correlation between the fortunes of the Euro (EUR) and the CHF is more than 90%, or close to perfect.
-
06:03
EUR/JPY Price Forecast: Tests ascending channel’s lower boundary around 162.50
- The EUR/JPY cross tests the lower boundary of the ascending channel, suggesting a potential for weakening bullish bias.
- The bearish outlook seems possible as the 14-day RSI remains below the 50 mark.
- The primary barrier appears at the nine-day EMA at 161.31 level.
EUR/JPY trades higher for the second successive day, hovering around 162.70 during Monday’s Asian trading session. Technical analysis of the daily chart indicates that the currency cross testing the lower boundary of the ascending channel, suggesting a potential for weakening bullish bias.
Additionally, the 14-day Relative Strength Index (RSI) remains below the 50 mark, indicating a potential bearish outlook for the EUR/JPY cross. Moreover, the currency cross's position below the nine- and 14-day Exponential Moving Averages (EMAs) highlights weakened short-term price momentum and supports the potential for further declines.
In terms of support, the EUR/JPY cross tests the ascending channel’s lower boundary at 160.50 level. A break below this channel would strengthen the bearish bias and put pressure on the currency cross to navigate the region around its four-month low of 156.18, recorded on December 3.
On the upside, the EUR/JPY cross may find its primary resistance at the nine-day EMA at 161.31 level, followed by the 14-day EMA at 161.64 level. A break above these levels would improve the short-term price momentum and support the currency cross to approach its two-month high at the 164.90 level.
A further resistance zone appears around its six-month high of 166.69, a level last seen in October 2024, followed by the psychological level at 167.00, aligned with the upper boundary of the ascending channel.
EUR/JPY: Daily Chart
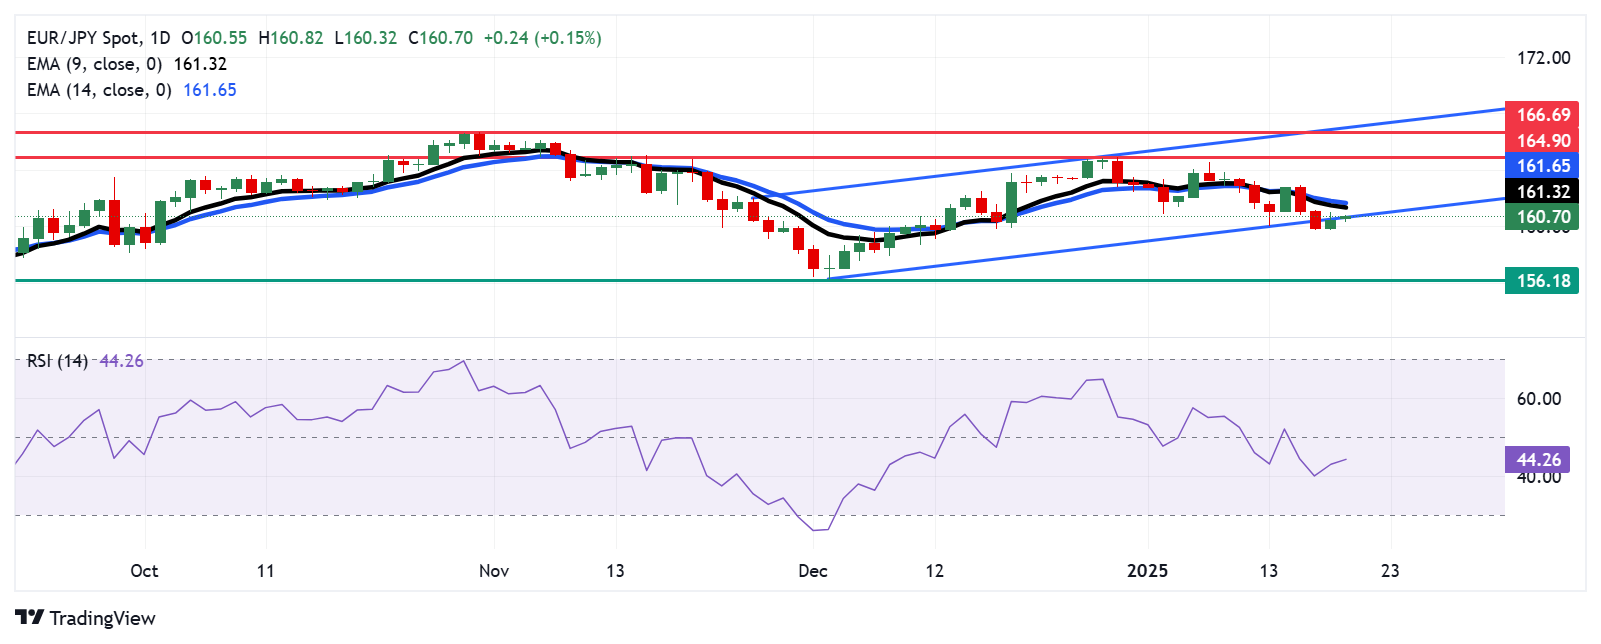
Euro PRICE Today
The table below shows the percentage change of Euro (EUR) against listed major currencies today. Euro was the strongest against the US Dollar.
USD EUR GBP JPY CAD AUD NZD CHF USD -0.31% -0.32% -0.20% -0.15% -0.36% -0.35% -0.01% EUR 0.31% -0.07% 0.00% 0.06% 0.01% -0.15% 0.17% GBP 0.32% 0.07% 0.02% 0.12% 0.09% -0.08% 0.24% JPY 0.20% 0.00% -0.02% 0.06% -0.11% -0.25% 0.00% CAD 0.15% -0.06% -0.12% -0.06% -0.15% -0.20% 0.12% AUD 0.36% -0.01% -0.09% 0.11% 0.15% -0.25% 0.09% NZD 0.35% 0.15% 0.08% 0.25% 0.20% 0.25% 0.14% CHF 0.01% -0.17% -0.24% -0.01% -0.12% -0.09% -0.14% The heat map shows percentage changes of major currencies against each other. The base currency is picked from the left column, while the quote currency is picked from the top row. For example, if you pick the Euro from the left column and move along the horizontal line to the US Dollar, the percentage change displayed in the box will represent EUR (base)/USD (quote).
-
05:35
India Gold price today: Gold steadies, according to FXStreet data
Gold prices remained broadly unchanged in India on Monday, according to data compiled by FXStreet.
The price for Gold stood at 7,517.01 Indian Rupees (INR) per gram, broadly stable compared with the INR 7,510.45 it cost on Friday.
The price for Gold was broadly steady at INR 87,676.27 per tola from INR 87,600.38 per tola on friday.
Unit measure Gold Price in INR 1 Gram 7,517.01 10 Grams 75,169.53 Tola 87,676.27 Troy Ounce 233,805.30 FXStreet calculates Gold prices in India by adapting international prices (USD/INR) to the local currency and measurement units. Prices are updated daily based on the market rates taken at the time of publication. Prices are just for reference and local rates could diverge slightly.
Gold FAQs
Gold has played a key role in human’s history as it has been widely used as a store of value and medium of exchange. Currently, apart from its shine and usage for jewelry, the precious metal is widely seen as a safe-haven asset, meaning that it is considered a good investment during turbulent times. Gold is also widely seen as a hedge against inflation and against depreciating currencies as it doesn’t rely on any specific issuer or government.
Central banks are the biggest Gold holders. In their aim to support their currencies in turbulent times, central banks tend to diversify their reserves and buy Gold to improve the perceived strength of the economy and the currency. High Gold reserves can be a source of trust for a country’s solvency. Central banks added 1,136 tonnes of Gold worth around $70 billion to their reserves in 2022, according to data from the World Gold Council. This is the highest yearly purchase since records began. Central banks from emerging economies such as China, India and Turkey are quickly increasing their Gold reserves.
Gold has an inverse correlation with the US Dollar and US Treasuries, which are both major reserve and safe-haven assets. When the Dollar depreciates, Gold tends to rise, enabling investors and central banks to diversify their assets in turbulent times. Gold is also inversely correlated with risk assets. A rally in the stock market tends to weaken Gold price, while sell-offs in riskier markets tend to favor the precious metal.
The price can move due to a wide range of factors. Geopolitical instability or fears of a deep recession can quickly make Gold price escalate due to its safe-haven status. As a yield-less asset, Gold tends to rise with lower interest rates, while higher cost of money usually weighs down on the yellow metal. Still, most moves depend on how the US Dollar (USD) behaves as the asset is priced in dollars (XAU/USD). A strong Dollar tends to keep the price of Gold controlled, whereas a weaker Dollar is likely to push Gold prices up.
(An automation tool was used in creating this post.)
-
05:31
Japan Industrial Production (YoY) rose from previous -2.8% to -2.7% in November
-
05:31
Japan Tertiary Industry Index (MoM) came in at -0.3%, below expectations (0.1%) in November
-
05:31
Japan Industrial Production (MoM) above expectations (-2.3%) in November: Actual (-2.2%)
-
05:30
Japan Capacity Utilization fell from previous 2.6% to -1.9% in November
-
04:45
Silver Price Forecast: XAG/USD falls below $30.50 due to easing Middle-East tensions
- Silver price struggles due to safe-haven amid easing tensions in the Middle East.
- Hamas released three female hostages in exchange for 90 Palestinians imprisoned in Israel, in return for the three Israeli hostages freed.
- The Silver demand could rise as proposed Trump trade tariffs are expected to drive inflation, potentially triggering trade wars.
Silver price (XAG/USD) extends its losses for the second successive session, trading around $30.30 per troy ounce during the Asian hours on Monday. The safe-haven metal faces challenges due to easing tensions in the Middle East. On Sunday, Hamas and Israel exchanged hostages and prisoners, marking the first day of a ceasefire after 15 months of conflict.
Hamas released three female hostages in exchange for 90 Palestinians imprisoned in Israel, according to Bloomberg. In turn, for the three Israeli hostages freed, Hamas agreed to release 90 prisoners and detainees, all of whom were expected to be women and children, as reported by the Commission of Prisoners' Affairs.
Traders adopt a cautious approach ahead of President-elect Donald Trump’s inauguration later in the day. His proposed trade tariffs are expected to drive inflation, potentially triggering trade wars and increasing Silver’s appeal as a hedge against inflation.
Concerns are growing over Trump’s policy proposals, such as potential tariffs, tax cuts, and the deportation of undocumented immigrants. Analysts suggest that the US Federal Reserve’s (Fed) future interest rate decisions will largely depend on how these policies are implemented.
Softer-than-expected US inflation data from last week has rekindled expectations of further rate cuts by the Federal Reserve this year. Lower rates reduce the opportunity cost of holding non-interest-bearing Silver, thereby enhancing its appeal.
Silver FAQs
Silver is a precious metal highly traded among investors. It has been historically used as a store of value and a medium of exchange. Although less popular than Gold, traders may turn to Silver to diversify their investment portfolio, for its intrinsic value or as a potential hedge during high-inflation periods. Investors can buy physical Silver, in coins or in bars, or trade it through vehicles such as Exchange Traded Funds, which track its price on international markets.
Silver prices can move due to a wide range of factors. Geopolitical instability or fears of a deep recession can make Silver price escalate due to its safe-haven status, although to a lesser extent than Gold's. As a yieldless asset, Silver tends to rise with lower interest rates. Its moves also depend on how the US Dollar (USD) behaves as the asset is priced in dollars (XAG/USD). A strong Dollar tends to keep the price of Silver at bay, whereas a weaker Dollar is likely to propel prices up. Other factors such as investment demand, mining supply – Silver is much more abundant than Gold – and recycling rates can also affect prices.
Silver is widely used in industry, particularly in sectors such as electronics or solar energy, as it has one of the highest electric conductivity of all metals – more than Copper and Gold. A surge in demand can increase prices, while a decline tends to lower them. Dynamics in the US, Chinese and Indian economies can also contribute to price swings: for the US and particularly China, their big industrial sectors use Silver in various processes; in India, consumers’ demand for the precious metal for jewellery also plays a key role in setting prices.
Silver prices tend to follow Gold's moves. When Gold prices rise, Silver typically follows suit, as their status as safe-haven assets is similar. The Gold/Silver ratio, which shows the number of ounces of Silver needed to equal the value of one ounce of Gold, may help to determine the relative valuation between both metals. Some investors may consider a high ratio as an indicator that Silver is undervalued, or Gold is overvalued. On the contrary, a low ratio might suggest that Gold is undervalued relative to Silver.
-
04:38
USD/CAD trades with negative bias below multi-year peak, around mid-1.4400s
- USD/CAD attracts intraday sellers after hitting a fresh multi-year top amid a modest USD downtick.
- Oil prices remain below a multi-week high, undermining the Loonie and lending support to the pair.
- Traders also seem reluctant and opt to wait for US President-elect Donald Trump’s inaugural address.
The USD/CAD pair retreated slightly after touching its highest level since March 2020 during the Asian session on Monday and for now, seems to have snapped a two-day winning streak. Spot prices currently trade around the mid-1.4400s, down 0.10% for the day amid a modest US Dollar (USD), though the downtick lacks follow-through or a bearish conviction.
Signs of abating inflation in the US increased the chances that the Federal Reserve could cut interest rates twice this year and failed to assist the USD to capitalize on Friday's positive move. Apart from this, a generally positive risk tone around the equity markets is seen weighing on the safe-haven buck and the USD/CAD pair. Investors, however, expect that US President-elect Donald Trump’s protectionist policies could boost inflation. This might force the Fed to adopt a more hawkish stance, warranting some caution for the USD bears.
Meanwhile, easing tensions in the Middle East, along with expectations that US President-elect Donald Trump could relax curbs on Russia in exchange for a deal to end the Ukraine war, offset worries about tighter supplies and weigh on Crude Oil prices. This, in turn, could undermine the commodity-linked Loonie and contribute to limiting losses for the USD/CAD pair. Traders also seem reluctant and opt to wait for Trump's inaugural address later today, making it prudent to wait for some follow-through selling before positioning for deeper losses.
Canadian Dollar FAQs
The key factors driving the Canadian Dollar (CAD) are the level of interest rates set by the Bank of Canada (BoC), the price of Oil, Canada’s largest export, the health of its economy, inflation and the Trade Balance, which is the difference between the value of Canada’s exports versus its imports. Other factors include market sentiment – whether investors are taking on more risky assets (risk-on) or seeking safe-havens (risk-off) – with risk-on being CAD-positive. As its largest trading partner, the health of the US economy is also a key factor influencing the Canadian Dollar.
The Bank of Canada (BoC) has a significant influence on the Canadian Dollar by setting the level of interest rates that banks can lend to one another. This influences the level of interest rates for everyone. The main goal of the BoC is to maintain inflation at 1-3% by adjusting interest rates up or down. Relatively higher interest rates tend to be positive for the CAD. The Bank of Canada can also use quantitative easing and tightening to influence credit conditions, with the former CAD-negative and the latter CAD-positive.
The price of Oil is a key factor impacting the value of the Canadian Dollar. Petroleum is Canada’s biggest export, so Oil price tends to have an immediate impact on the CAD value. Generally, if Oil price rises CAD also goes up, as aggregate demand for the currency increases. The opposite is the case if the price of Oil falls. Higher Oil prices also tend to result in a greater likelihood of a positive Trade Balance, which is also supportive of the CAD.
While inflation had always traditionally been thought of as a negative factor for a currency since it lowers the value of money, the opposite has actually been the case in modern times with the relaxation of cross-border capital controls. Higher inflation tends to lead central banks to put up interest rates which attracts more capital inflows from global investors seeking a lucrative place to keep their money. This increases demand for the local currency, which in Canada’s case is the Canadian Dollar.
Macroeconomic data releases gauge the health of the economy and can have an impact on the Canadian Dollar. Indicators such as GDP, Manufacturing and Services PMIs, employment, and consumer sentiment surveys can all influence the direction of the CAD. A strong economy is good for the Canadian Dollar. Not only does it attract more foreign investment but it may encourage the Bank of Canada to put up interest rates, leading to a stronger currency. If economic data is weak, however, the CAD is likely to fall.
-
04:15
WTI remains subdued near $77.00 due to market caution ahead of Trump’s inauguration
- WTI price loses ground amid risk aversion ahead of President-elect Donald Trump’s inauguration on Monday.
- Traders shift their attention to how the incoming Trump administration will approach sanctions on Russia’s energy sector.
- Crude Oil prices struggle due to easing tensions in the Middle East, as Hamas and Israel exchanged hostages and prisoners.
West Texas Intermediate (WTI) extends losses for the third successive session, trading near $77.20 per barrel during Monday's Asian session. Oil traders adopt a cautious stance ahead of President-elect Donald Trump’s inauguration later in the day. The US market will remain closed on Monday in observance of Martin Luther King Jr. Day.
Concerns are mounting over Trump’s policy proposals, including potential tariffs, tax cuts, and the deportation of undocumented immigrants. Analysts note that the future path of US Federal Reserve (Fed) interest rates will depend significantly on how extensively these policies are enacted.
Oil prices rose following Washington’s imposition of two rounds of sanctions on Russia’s energy sector over the ongoing Ukraine conflict. Over the past two weeks, the Biden administration targeted more than 100 tankers and two Russian Oil producers.
Attention is now shifting to how the incoming Trump administration will approach the Biden administration’s sanctions. Traders are also looking for clarity on Trump’s stance regarding trade tariffs and potential sanctions on Iran and Venezuela.
However, easing tensions in the Middle East may cap further upside of crude Oil prices. On Sunday, Hamas and Israel exchanged hostages and prisoners, marking the first day of a ceasefire after 15 months of conflict.
Hamas released three female hostages in exchange for 90 Palestinians imprisoned in Israel, according to Bloomberg. In turn, for the three Israeli hostages freed, Hamas agreed to release 90 prisoners and detainees, all of whom were expected to be women and children, as reported by the Commission of Prisoners' Affairs.
WTI Oil FAQs
WTI Oil is a type of Crude Oil sold on international markets. The WTI stands for West Texas Intermediate, one of three major types including Brent and Dubai Crude. WTI is also referred to as “light” and “sweet” because of its relatively low gravity and sulfur content respectively. It is considered a high quality Oil that is easily refined. It is sourced in the United States and distributed via the Cushing hub, which is considered “The Pipeline Crossroads of the World”. It is a benchmark for the Oil market and WTI price is frequently quoted in the media.
Like all assets, supply and demand are the key drivers of WTI Oil price. As such, global growth can be a driver of increased demand and vice versa for weak global growth. Political instability, wars, and sanctions can disrupt supply and impact prices. The decisions of OPEC, a group of major Oil-producing countries, is another key driver of price. The value of the US Dollar influences the price of WTI Crude Oil, since Oil is predominantly traded in US Dollars, thus a weaker US Dollar can make Oil more affordable and vice versa.
The weekly Oil inventory reports published by the American Petroleum Institute (API) and the Energy Information Agency (EIA) impact the price of WTI Oil. Changes in inventories reflect fluctuating supply and demand. If the data shows a drop in inventories it can indicate increased demand, pushing up Oil price. Higher inventories can reflect increased supply, pushing down prices. API’s report is published every Tuesday and EIA’s the day after. Their results are usually similar, falling within 1% of each other 75% of the time. The EIA data is considered more reliable, since it is a government agency.
OPEC (Organization of the Petroleum Exporting Countries) is a group of 12 Oil-producing nations who collectively decide production quotas for member countries at twice-yearly meetings. Their decisions often impact WTI Oil prices. When OPEC decides to lower quotas, it can tighten supply, pushing up Oil prices. When OPEC increases production, it has the opposite effect. OPEC+ refers to an expanded group that includes ten extra non-OPEC members, the most notable of which is Russia.
-
04:09
USD/INR softens as traders brace for Trump’s inauguration
- The Indian Rupee gains traction in Monday’s Asian session.
- Routine RBI intervention and lower oil prices underpin the INR; foreign outflows and renewed USD demand might cap its upside.
- Investors await Donald Trump’s presidential inauguration on Monday at 17:00 GMT.
The Indian Rupee (INR) strengthens on Monday after logging its worst week in 18 months in the previous week. The frequent interventions by the Reserve Bank of India (RBI) and a decline in crude oil prices could help prevent sharper losses of the local currency.
On the other hand, persistent foreign portfolio outflows and heightened US Dollar (USD) bids in the non-deliverable forwards (NDF) market might weigh on the INR. Investors will closely monitor the announcement of President-elect Donald Trump’s policies ahead of his inauguration at 17:00 GMT. The expectations of tariff policies under the Trump administration might drag the emerging market currencies, including the INR.Indian Rupee recovers ahead of Trump’s inauguration
- India’s foreign exchange reserves dropped for the sixth consecutive week, reaching a 10-month low of $625.9 billion for the week ended January 10, according to the Reserve Bank of India (RBI).
- Analysts noted that the Indian central bank has been cautious in deploying reserves to contain undue currency volatility amid strong global challenges. The foreign exchange reserves also include India’s reserve tranche position in the International Monetary Fund (IMF).
- India's economy is projected to grow by 6.7% in the next fiscal year starting in April, slightly higher than in the current fiscal year, according to the World Bank. The country’s growth rate in the current fiscal year is at 6.5%, down from 8.2% in the previous period.
- US Housing Starts climbed by 15.8% from 1.294 million (revised from 1.289 million) to 1.499 million in December, beating the estimation of 1.32 million.
- The US Building Permits declined by 0.7% from 1.493 million (revised from 1.505 million) to 1.483 million, but above the market consensus of 1.46 million.
USD/INR maintains its positive bias, oversold RSI warrants caution
The Indian Rupee trades firmer on the day. The bullish trend of the USD/INR pair remains intact as the price has formed higher highs and higher lows while holding above the key 100-day Exponential Moving Average (EMA) on the daily timeframe. Nonetheless, the 14-day Relative Strength Index (RSI) reaches overbought territory beyond the 70.00 mark, suggesting that a temporary weakness or further consolidation cannot be ruled out in the near term.
An all-time high of 86.69 appears to be a tough nut to crack for bulls. A sustained move above the mentioned level could set the stage for a run at the 87.00 psychological level.
On the flip side, any follow-through selling below 86.30, the low of January 15, could see a drop to 85.85, the low of January 10. The additional downside filter to watch is 85.65, the low of January 7.Indian Rupee FAQs
The Indian Rupee (INR) is one of the most sensitive currencies to external factors. The price of Crude Oil (the country is highly dependent on imported Oil), the value of the US Dollar – most trade is conducted in USD – and the level of foreign investment, are all influential. Direct intervention by the Reserve Bank of India (RBI) in FX markets to keep the exchange rate stable, as well as the level of interest rates set by the RBI, are further major influencing factors on the Rupee.
The Reserve Bank of India (RBI) actively intervenes in forex markets to maintain a stable exchange rate, to help facilitate trade. In addition, the RBI tries to maintain the inflation rate at its 4% target by adjusting interest rates. Higher interest rates usually strengthen the Rupee. This is due to the role of the ‘carry trade’ in which investors borrow in countries with lower interest rates so as to place their money in countries’ offering relatively higher interest rates and profit from the difference.
Macroeconomic factors that influence the value of the Rupee include inflation, interest rates, the economic growth rate (GDP), the balance of trade, and inflows from foreign investment. A higher growth rate can lead to more overseas investment, pushing up demand for the Rupee. A less negative balance of trade will eventually lead to a stronger Rupee. Higher interest rates, especially real rates (interest rates less inflation) are also positive for the Rupee. A risk-on environment can lead to greater inflows of Foreign Direct and Indirect Investment (FDI and FII), which also benefit the Rupee.
Higher inflation, particularly, if it is comparatively higher than India’s peers, is generally negative for the currency as it reflects devaluation through oversupply. Inflation also increases the cost of exports, leading to more Rupees being sold to purchase foreign imports, which is Rupee-negative. At the same time, higher inflation usually leads to the Reserve Bank of India (RBI) raising interest rates and this can be positive for the Rupee, due to increased demand from international investors. The opposite effect is true of lower inflation.
-
03:54
Japanese Yen bulls have the upper hand amid firming BoJ rate hike expectations
- The Japanese Yen strengthens in reaction to the upbeat Core Machinery Orders data.
- Firming expectations for an additional BoJ rate hike this week also underpin the JPY.
- Bets that the Fed will cut interest rates further weigh on the USD and the USD/JPY pair.
The Japanese Yen (JPY) attracts some dip-buyers following an Asian session downtick and stalls its retracement slide from a near four-week high touched against its American counterpart on Friday. An increase in Japan's Core Machinery Orders for the second straight month signaled a further recovery in capital expenditure. Adding to this, bets that the Bank of Japan (BoJ) will hike interest rates at its policy meeting later this week underpin the JPY, which, along with a modest US Dollar (USD) weakness, drag the USD/JPY pair back below the 156.00 mark in the last hour.
Despite growing acceptance that the Federal Reserve (Fed) will pause its rate-cutting cycle this month, signs of abating inflation in the US could allow the central bank to lower borrowing costs further in 2025. This had been a key factor behind the recent pullback in the US Treasury bond yields, which resulted in the narrowing of the US-Japan yield differential and offered additional support to the JPY. That said, uncertainties over the incoming US President Donald Trump's trade policies might hold back the JPY bulls from placing fresh bets ahead of the BoJ meeting starting on Thursday.
Japanese Yen regains positive traction on upbeat domestic data, BoJ rate hike bets
- Government data released earlier this Monday showed that Japan's Core Machinery Orders increased by 3.4% month-on-month in November 2024, marking the second consecutive month of increase and the strongest growth in nine months.
- This comes on top of the broadening inflation and strong wage growth in Japan, which, along with hawkish remarks from Bank of Japan officials, lifted bets for another rate hike later this week and offered some support to the Japanese Yen.
- BoJ Deputy Governor Ryozo Himino said last week that a rate hike will be discussed at the January 23-24 meeting as prospects of sustained wage gains heighten and the US policy outlook under President-elect Donald Trump becomes clearer.
- Moreover, BoJ Governor Kazuo Ueda said last week that there was a lot of positive talk on the wage outlook and reiterated that the central bank would raise the policy rate further this year if economic and price conditions continue to improve.
- Adding to this, a BoJ report released earlier this month showed that wage hikes are spreading to firms of all sizes and sectors in Japan, suggesting that conditions for a near-term interest rate hike were continuing to fall into place.
- The JPY bulls, however, might refrain from placing aggressive bets and opt to move to the sidelines ahead of US President-elect Donald Trump's inaugural address later this Monday and a two-day BoJ meeting starting Thursday.
- Data released last week suggested that the underlying inflation in the US slowed last month and fueled speculations that the Federal Reserve may not necessarily exclude the possibility of cutting interest rates further in 2025.
- Furthermore, Fed Governor Christopher Waller said last Thursday that inflation is likely to continue to ease and that as many as three or four quarter-percentage-point rate reductions could still be possible by the end of this year.
- The US Commerce Department's Census Bureau reported on Friday that Housing Starts rose 3.3% in December, to a seasonally adjusted annual rate of 1.50 million units, marking the highest level since February 2024.
- This, to a larger extent, offsets a slight disappointment from the latest report on Building Permits, which registered a sudden drop of 0.7% in December as compared to the 5.2% strong growth registered in the previous month.
- The yield on the benchmark 10-year US government bond rebounded after touching a two-week low on Friday, which assisted the US Dollar to snap a four-day losing streak and offered support to the USD/JPY pair.
USD/JPY could find support at the lower end of a multi-month-old ascending channel
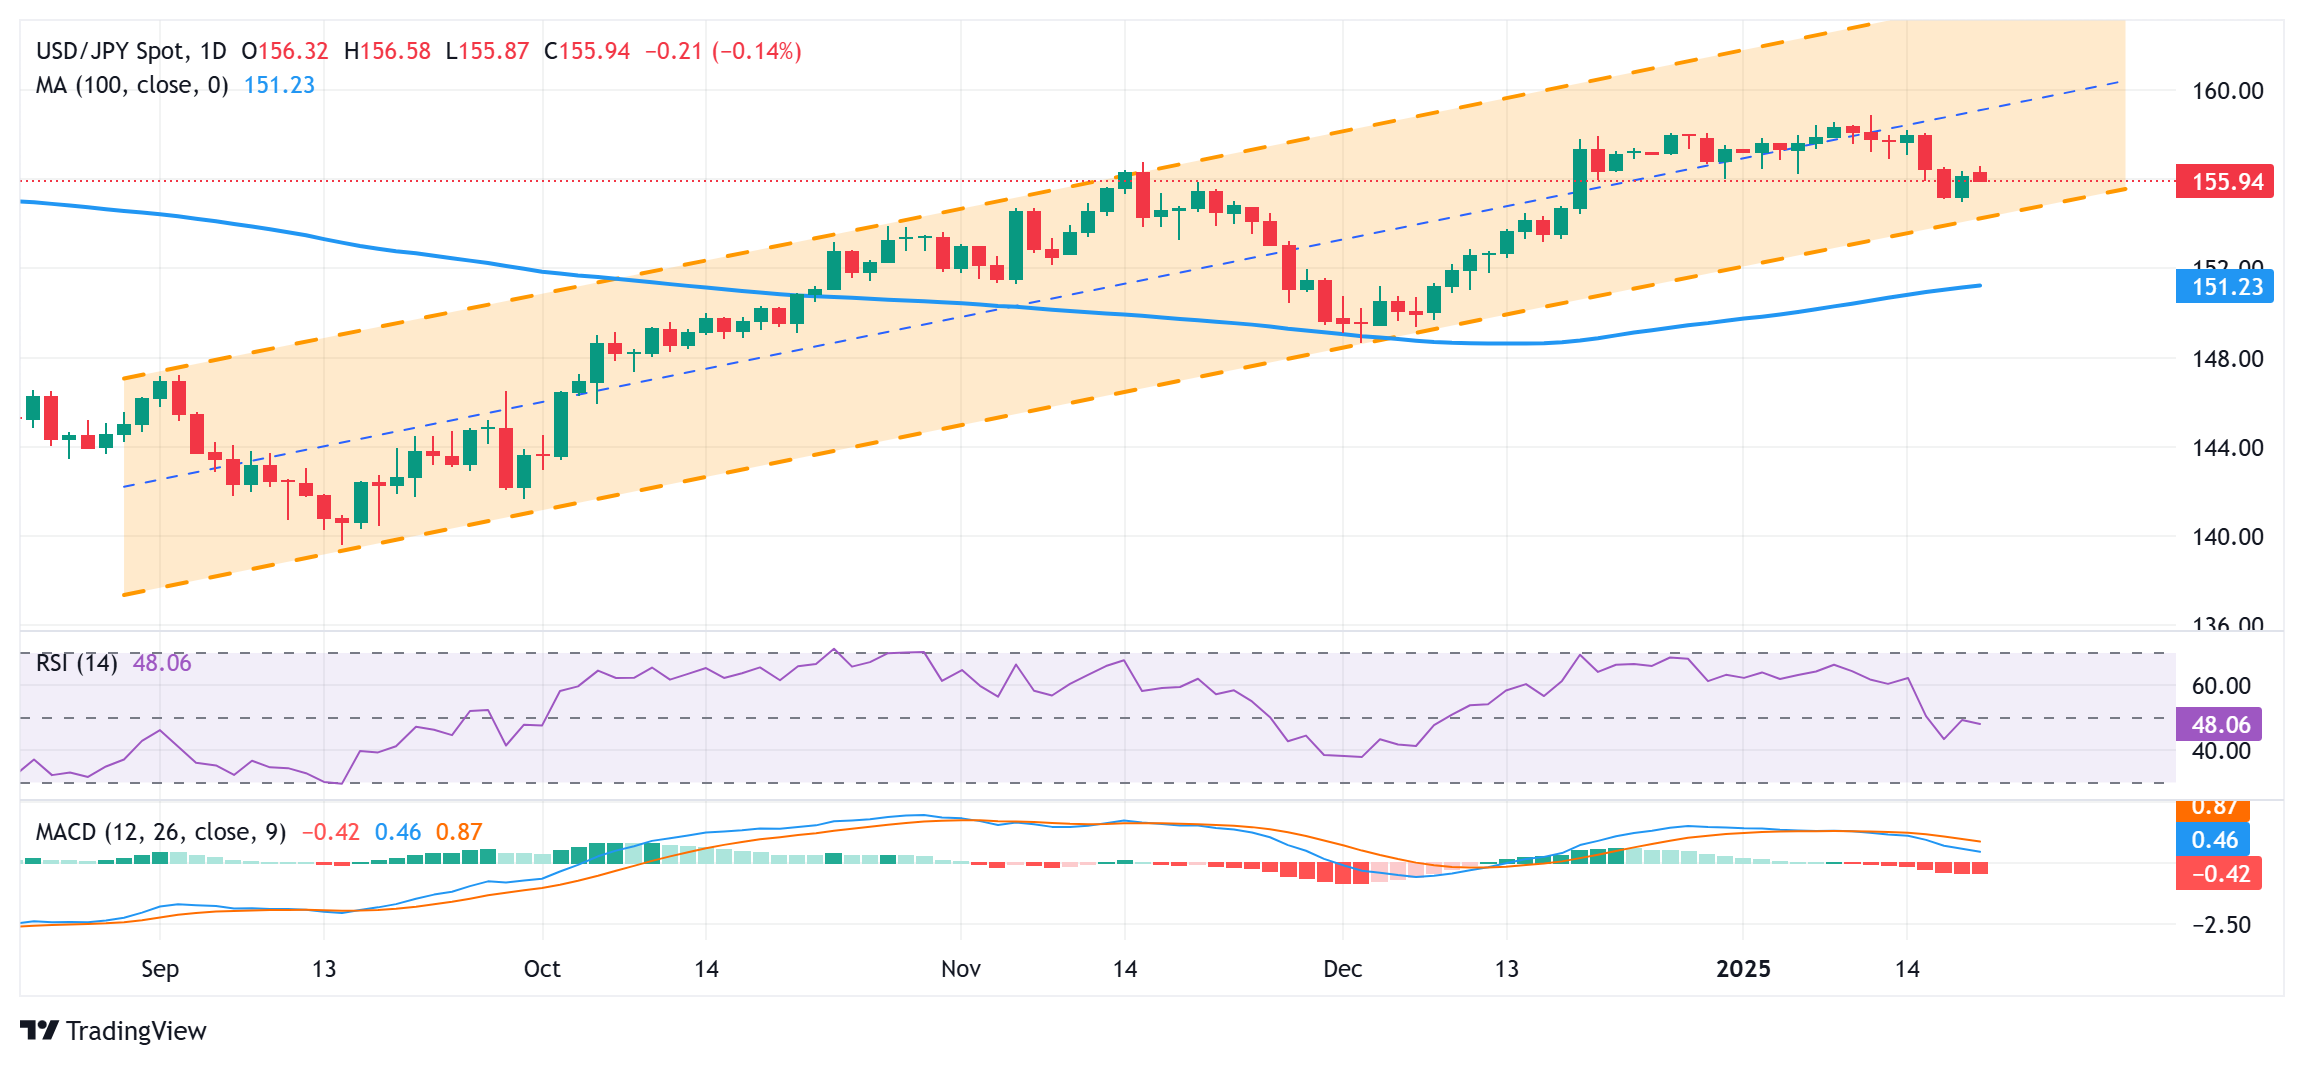
From a technical perspective, Friday's bounce from support marked by the lower boundary of a multi-month-old ascending channel falters near the 156.55-156.60 region. The said area should now act as an immediate hurdle, above which a fresh bout of a short-covering could allow the USD/JPY pair to reclaim the 157.00 round figure. The subsequent move up could extend further towards the 157.40-157.45 intermediate barrier en route to the 158.00 mark and the 158.85 region, or a multi-month top touched on January 10.
On the flip side, the ascending channel support, currently pegged near the 155.25 area, might continue to protect the immediate downside ahead of the 155.00 psychological mark. A sustained break and acceptance below the latter will be seen as a fresh trigger for bearish traders and drag the USD/JPY pair towards the 154.60-154.55 region. Spot prices could extend the downward trajectory further towards the 154.00 mark en route to the next relevant support near the 153.35-153.30 horizontal zone.
Economic Indicator
Machinery Orders (MoM)
New orders, released by the Cabinet Office, are the total value of machinery orders placed at major manufacturers in Japan. They are legally binding contracts between consumers and producers for delivering goods and services. The report is considered the best leading indicator of business capital spending, and increases are indicative of stronger business confidence and therefore, as larger the number is, the positive it tends to be for the currency, while a negative reading is understood as a drop down in growth.
Read more.Last release: Sun Jan 19, 2025 23:50
Frequency: Monthly
Actual: 3.4%
Consensus: -0.4%
Previous: 2.1%
Source: Japanese Cabinet Office
-
03:30
Commodities. Daily history for Friday, January 17, 2025
Raw materials Closed Change, % Silver 30.313 -1.54 Gold 2701.81 -0.45 Palladium 937.29 -0.09 -
03:29
Australian Dollar gains ground amid rising metals prices, PBoC keeps LPRs unchanged
- The Australian Dollar appreciates despite a cautious mood ahead of President-elect Donald Trump’s inauguration on Monday.
- The PBoC maintained its one- and five-year Loan Prime Rates at 3.10% and 3.60%, respectively.
- Traders adopt caution amid uncertainty surrounding Trump’s policy pledges, including imposing tariffs, extending tax cuts, and deporting illegal immigrants.
The Australian Dollar (AUD) halts its two-day losing streak against the US Dollar (USD) on Monday, receiving support from rising metals prices. However, the AUD/USD pair's upside may remain capped as the US Dollar (USD) could strengthen due to market caution ahead of President-elect Donald Trump’s inauguration later on the day. The US market will remain closed on Monday for the Martin Luther King Jr. Day holiday.
The People’s Bank of China (PBOC) announced on Monday that it would keep its Loan Prime Rates (LPRs) unchanged. The one-year Loan Prime Rate (LPR) remains at 3.10%, while the five-year LPR stands at 3.60%. Since China and Australia are close trading partners, any shifts in China’s economy could have an impact on Australian markets.
The AUD also gained ground due to the robust economic data from China. China’s Gross Domestic Product (GDP) grew 5.4% over the year in the fourth quarter of 2024 after reporting a 4.6% expansion in the third quarter. Data beat the market consensus of 5% in the reported period, by a wide margin. Additionally, the annual December Retail Sales increased by 3.7% vs. the 3.5% expected and 3.0% prior, while Industrial Production arrived at 6.2% vs. the 5.4% forecast and November’s 5.4%.
The Aussie Dollar could face challenges as market expectations grow that the Reserve Bank of Australia (RBA) might start cutting rates as early as next month. Traders are now focusing on Australia’s quarterly inflation report, set to be released next week, for clues about the future direction of interest rates.
Australian Dollar could face headwinds due to rising concerns over Trump’s policy pledges
- The US Dollar Index (DXY), which measures the USD’s performance against six major currencies, hovers near 109.30 at the time of writing. However, the Greenback found support as US Treasury yields rose, driven by concerns over Trump’s policy pledges, including imposing tariffs, extending tax cuts, and deporting illegal immigrants. Analysts believe the US Federal Reserve's (Fed) future interest rate path will depend on the degree to which the Trump administration enacts these policies.
- Investors will closely watch Trump’s planned executive orders, expected to be issued shortly after he takes office. Meanwhile, the Fed is widely anticipated to keep interest rates steady at its January meeting, with a majority of economists polled by Reuters forecasting a resumption of rate hikes in March.
- Growing expectations that the Fed will cut interest rates twice this year have driven US Treasury bond yields lower, with the 2-year and 10-year notes currently at 4.23% and 4.60%, respectively. Both yields are on course for a weekly decline of over 3%.
- US Retail Sales rose by 0.4% MoM in December, reaching $729.2 billion. This reading was weaker than the market expectations of a 0.6% rise and lower than the previous reading of a 0.8% increase (revised from 0.7%).
- The US Consumer Price Index increased by 2.9% year-over-year in December, up from 2.7% in November, aligning with market expectations. Monthly, CPI rose 0.4%, following a 0.3% increase in the previous month. US Core CPI, which excludes volatile food and energy prices, rose 3.2% annually in December, slightly below November's figure and analysts' forecasts of 3.3%.
- On Thursday, Chicago Federal Reserve Bank President Austan Goolsbee stated that he has grown increasingly confident over the past several months that the job market is stabilizing at a level resembling full employment, rather than deteriorating into something worse, according to Reuters.
- Scott Bessent, Donald Trump’s nominee for Treasury Secretary, emphasized the importance of maintaining the US Dollar as the world’s reserve currency for the nation's economic stability and future prosperity. Bessent stated “Productive investment that grows the economy must be prioritized over wasteful spending that drives inflation,” per Bloomberg.
- The Federal Reserve reported in its latest Beige Book survey, released last week, that economic activity saw slight to moderate growth across the twelve Federal Reserve Districts in late November and December. Consumer spending increased moderately, driven by strong holiday sales that surpassed expectations. However, manufacturing activity experienced a slight decline overall, as some manufacturers stockpiled inventories in anticipation of higher tariffs.
Technical Analysis: Australian Dollar holds ground above 0.6200 support near 14-day EMA
The AUD/USD pair trades near 0.6210 on Monday, attempting to break above the descending channel on the daily chart. A successful breakout would weaken the prevailing bearish bias. However, the 14-day Relative Strength Index (RSI) remains below the 50 level, signaling bearish bias is still intact.
The initial support is seen at the nine-day Exponential Moving Average (EMA) at 0.6202. A more substantial support level is located near the recent low at 0.6131 level. A break below this level could lead the AUD/USD pair to navigate the region around the lower boundary of the descending channel, around the 0.5900 mark.
On the upside, the AUD/USD pair encounters immediate resistance at the 14-day EMA at 0.6210, aligned with the upper boundary of the descending channel.
AUD/USD: Daily Chart
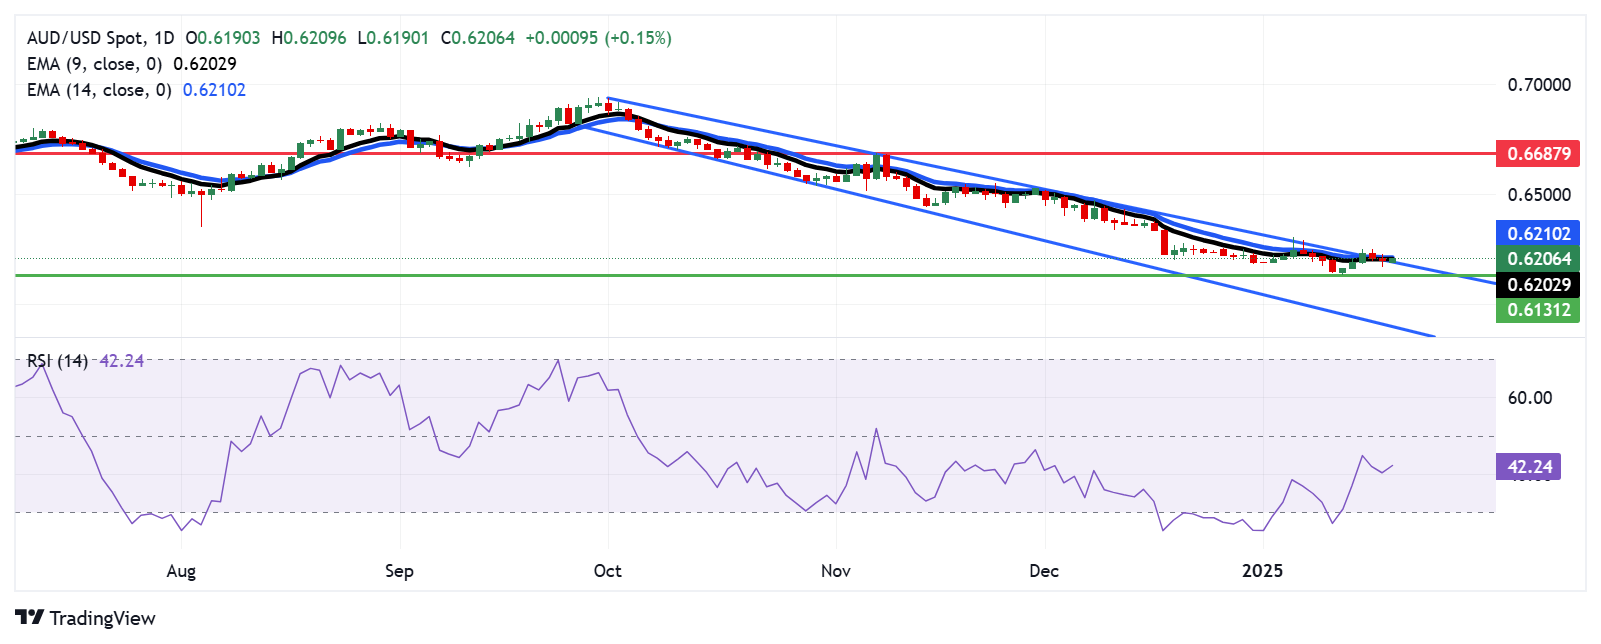
Australian Dollar PRICE Today
The table below shows the percentage change of Australian Dollar (AUD) against listed major currencies today. Australian Dollar was the strongest against the US Dollar.
USD EUR GBP JPY CAD AUD NZD CHF USD -0.15% -0.14% -0.14% -0.10% -0.24% -0.17% 0.10% EUR 0.15% -0.05% -0.10% -0.05% -0.03% -0.13% 0.12% GBP 0.14% 0.05% -0.10% -0.01% 0.04% -0.08% 0.18% JPY 0.14% 0.10% 0.10% 0.06% -0.05% -0.12% 0.07% CAD 0.10% 0.05% 0.00% -0.06% -0.08% -0.08% 0.18% AUD 0.24% 0.03% -0.04% 0.05% 0.08% -0.19% 0.08% NZD 0.17% 0.13% 0.08% 0.12% 0.08% 0.19% 0.07% CHF -0.10% -0.12% -0.18% -0.07% -0.18% -0.08% -0.07% The heat map shows percentage changes of major currencies against each other. The base currency is picked from the left column, while the quote currency is picked from the top row. For example, if you pick the Australian Dollar from the left column and move along the horizontal line to the US Dollar, the percentage change displayed in the box will represent AUD (base)/USD (quote).
Australian Dollar FAQs
One of the most significant factors for the Australian Dollar (AUD) is the level of interest rates set by the Reserve Bank of Australia (RBA). Because Australia is a resource-rich country another key driver is the price of its biggest export, Iron Ore. The health of the Chinese economy, its largest trading partner, is a factor, as well as inflation in Australia, its growth rate and Trade Balance. Market sentiment – whether investors are taking on more risky assets (risk-on) or seeking safe-havens (risk-off) – is also a factor, with risk-on positive for AUD.
The Reserve Bank of Australia (RBA) influences the Australian Dollar (AUD) by setting the level of interest rates that Australian banks can lend to each other. This influences the level of interest rates in the economy as a whole. The main goal of the RBA is to maintain a stable inflation rate of 2-3% by adjusting interest rates up or down. Relatively high interest rates compared to other major central banks support the AUD, and the opposite for relatively low. The RBA can also use quantitative easing and tightening to influence credit conditions, with the former AUD-negative and the latter AUD-positive.
China is Australia’s largest trading partner so the health of the Chinese economy is a major influence on the value of the Australian Dollar (AUD). When the Chinese economy is doing well it purchases more raw materials, goods and services from Australia, lifting demand for the AUD, and pushing up its value. The opposite is the case when the Chinese economy is not growing as fast as expected. Positive or negative surprises in Chinese growth data, therefore, often have a direct impact on the Australian Dollar and its pairs.
Iron Ore is Australia’s largest export, accounting for $118 billion a year according to data from 2021, with China as its primary destination. The price of Iron Ore, therefore, can be a driver of the Australian Dollar. Generally, if the price of Iron Ore rises, AUD also goes up, as aggregate demand for the currency increases. The opposite is the case if the price of Iron Ore falls. Higher Iron Ore prices also tend to result in a greater likelihood of a positive Trade Balance for Australia, which is also positive of the AUD.
The Trade Balance, which is the difference between what a country earns from its exports versus what it pays for its imports, is another factor that can influence the value of the Australian Dollar. If Australia produces highly sought after exports, then its currency will gain in value purely from the surplus demand created from foreign buyers seeking to purchase its exports versus what it spends to purchase imports. Therefore, a positive net Trade Balance strengthens the AUD, with the opposite effect if the Trade Balance is negative.
-
02:53
NZD/USD gathers strength to near 0.5600, Trump 2.0 in focus
- NZD/USD attracts some buyers to near 0.5600 in Monday’s early Asian session, up 0.20% on the day.
- The PBoC left the one-year and five-year Loan Prime Rates (LPR) unchanged on Monday.
- The Fed's dovish expectation could weigh on the USD and create a tailwind for the pair.
The NZD/USD pair holds positive ground around 0.5600 during the Asian trading hours on Monday. The Kiwi remains strong after the People’s Bank of China (PBOC) announced to leave its Loan Prime Rates (LPRs) unchanged on Monday. The market might turn cautious as investors brace for the policy announcements ahead of President-elect Donald Trump’s inauguration.
Early Monday, the Chinese central bank decided to hold the one-year and five-year LPR steady at 3.35% and 3.85%, respectively. However, the attention will shift to Trump's tariff policies. In December, Trump said that he would impose tariffs of as much as 10% on global imports and 60% on Chinese goods, plus a 25% import surcharge on Canadian and Mexican products.
Any development in the Chinese economy generally impacts Kiwi, as China is New Zealand's largest trading partner. "A forceful start to Trump's new term could rattle nerves and give the dollar more support," noted Corpay currency strategist Peter Dragicevich.
On the other hand, the softer US inflation data and dovish comments from the US Federal Reserve (Fed) officials might cap the upside for the Greenback. Fed Governor Christopher Waller highlighted favorable inflation results that could warrant a rate reduction in the near term, adding that a rate cut in March remains a possibility if incoming data support further price moderation.New Zealand Dollar FAQs
The New Zealand Dollar (NZD), also known as the Kiwi, is a well-known traded currency among investors. Its value is broadly determined by the health of the New Zealand economy and the country’s central bank policy. Still, there are some unique particularities that also can make NZD move. The performance of the Chinese economy tends to move the Kiwi because China is New Zealand’s biggest trading partner. Bad news for the Chinese economy likely means less New Zealand exports to the country, hitting the economy and thus its currency. Another factor moving NZD is dairy prices as the dairy industry is New Zealand’s main export. High dairy prices boost export income, contributing positively to the economy and thus to the NZD.
The Reserve Bank of New Zealand (RBNZ) aims to achieve and maintain an inflation rate between 1% and 3% over the medium term, with a focus to keep it near the 2% mid-point. To this end, the bank sets an appropriate level of interest rates. When inflation is too high, the RBNZ will increase interest rates to cool the economy, but the move will also make bond yields higher, increasing investors’ appeal to invest in the country and thus boosting NZD. On the contrary, lower interest rates tend to weaken NZD. The so-called rate differential, or how rates in New Zealand are or are expected to be compared to the ones set by the US Federal Reserve, can also play a key role in moving the NZD/USD pair.
Macroeconomic data releases in New Zealand are key to assess the state of the economy and can impact the New Zealand Dollar’s (NZD) valuation. A strong economy, based on high economic growth, low unemployment and high confidence is good for NZD. High economic growth attracts foreign investment and may encourage the Reserve Bank of New Zealand to increase interest rates, if this economic strength comes together with elevated inflation. Conversely, if economic data is weak, NZD is likely to depreciate.
The New Zealand Dollar (NZD) tends to strengthen during risk-on periods, or when investors perceive that broader market risks are low and are optimistic about growth. This tends to lead to a more favorable outlook for commodities and so-called ‘commodity currencies’ such as the Kiwi. Conversely, NZD tends to weaken at times of market turbulence or economic uncertainty as investors tend to sell higher-risk assets and flee to the more-stable safe havens.
-
02:16
PBOC sets USD/CNY reference rate at 7.1886 vs. 7.1889 previous
On Monday, the People’s Bank of China (PBOC) set the USD/CNY central rate for the trading session ahead at 7.1886 as compared to Friday's fix of 7.1889 and 7.3353 Reuters estimates.
PBOC FAQs
The primary monetary policy objectives of the People's Bank of China (PBoC) are to safeguard price stability, including exchange rate stability, and promote economic growth. China’s central bank also aims to implement financial reforms, such as opening and developing the financial market.
The PBoC is owned by the state of the People's Republic of China (PRC), so it is not considered an autonomous institution. The Chinese Communist Party (CCP) Committee Secretary, nominated by the Chairman of the State Council, has a key influence on the PBoC’s management and direction, not the governor. However, Mr. Pan Gongsheng currently holds both of these posts.
Unlike the Western economies, the PBoC uses a broader set of monetary policy instruments to achieve its objectives. The primary tools include a seven-day Reverse Repo Rate (RRR), Medium-term Lending Facility (MLF), foreign exchange interventions and Reserve Requirement Ratio (RRR). However, The Loan Prime Rate (LPR) is China’s benchmark interest rate. Changes to the LPR directly influence the rates that need to be paid in the market for loans and mortgages and the interest paid on savings. By changing the LPR, China’s central bank can also influence the exchange rates of the Chinese Renminbi.
Yes, China has 19 private banks – a small fraction of the financial system. The largest private banks are digital lenders WeBank and MYbank, which are backed by tech giants Tencent and Ant Group, per The Straits Times. In 2014, China allowed domestic lenders fully capitalized by private funds to operate in the state-dominated financial sector.
-
02:10
EUR/USD edges higher to near 1.0300, upside seems limited ahead of Trump’s inauguration
- EUR/USD could lose ground amid risk aversion ahead of President-elect Donald Trump’s inauguration on Monday.
- Traders remain cautious amid uncertainty surrounding Trump’s policy pledges, including imposing tariffs, extending tax cuts, and deporting illegal immigrants.
- The Euro struggles as markets anticipate a 25 basis point rate cut at the next four ECB policy meetings.
EUR/USD recovers some of its losses from the previous session, trading near 1.0280 during Asian hours. However, the pair's upside may remain capped as the US Dollar (USD) could strengthen due to market caution ahead of President-elect Donald Trump’s inauguration later on the day. The US market will remain closed on Monday for the Martin Luther King Jr. Day holiday.
Concerns over Trump’s policy pledges—such as imposing tariffs, extending tax cuts, and deporting illegal immigrants—have fueled an increase in US Treasury yields and supported the US Dollar ahead of his swearing-in. Analysts suggest that the US Federal Reserve's (Fed) future interest rate trajectory will hinge on the extent to which the Trump administration implements these policies.
Investors will be closely watching Trump’s planned executive orders, expected to be issued shortly after he takes office. Meanwhile, the Fed is widely anticipated to keep interest rates steady at its January meeting, with a majority of economists polled by Reuters forecasting a resumption of rate hikes in March.
The Euro (EUR) faces headwinds as dovish expectations for the European Central Bank (ECB) persist. Markets are pricing in a 25 basis point (bps) interest rate cut at each of the next four ECB policy meetings, reflecting concerns over the Eurozone's economic outlook and the expectation that inflationary pressures will remain under control.
The ECB's December meeting minutes, released last week, suggested that policymakers focused more on the pace of policy easing this year rather than pausing or ending the rate cut cycle. Notably, officials debated the possibility of a larger-than-usual 50 bps rate cut to safeguard against downside risks to growth, which are being compounded by both global and domestic political uncertainties.
Euro FAQs
The Euro is the currency for the 19 European Union countries that belong to the Eurozone. It is the second most heavily traded currency in the world behind the US Dollar. In 2022, it accounted for 31% of all foreign exchange transactions, with an average daily turnover of over $2.2 trillion a day. EUR/USD is the most heavily traded currency pair in the world, accounting for an estimated 30% off all transactions, followed by EUR/JPY (4%), EUR/GBP (3%) and EUR/AUD (2%).
The European Central Bank (ECB) in Frankfurt, Germany, is the reserve bank for the Eurozone. The ECB sets interest rates and manages monetary policy. The ECB’s primary mandate is to maintain price stability, which means either controlling inflation or stimulating growth. Its primary tool is the raising or lowering of interest rates. Relatively high interest rates – or the expectation of higher rates – will usually benefit the Euro and vice versa. The ECB Governing Council makes monetary policy decisions at meetings held eight times a year. Decisions are made by heads of the Eurozone national banks and six permanent members, including the President of the ECB, Christine Lagarde.
Eurozone inflation data, measured by the Harmonized Index of Consumer Prices (HICP), is an important econometric for the Euro. If inflation rises more than expected, especially if above the ECB’s 2% target, it obliges the ECB to raise interest rates to bring it back under control. Relatively high interest rates compared to its counterparts will usually benefit the Euro, as it makes the region more attractive as a place for global investors to park their money.
Data releases gauge the health of the economy and can impact on the Euro. Indicators such as GDP, Manufacturing and Services PMIs, employment, and consumer sentiment surveys can all influence the direction of the single currency. A strong economy is good for the Euro. Not only does it attract more foreign investment but it may encourage the ECB to put up interest rates, which will directly strengthen the Euro. Otherwise, if economic data is weak, the Euro is likely to fall. Economic data for the four largest economies in the euro area (Germany, France, Italy and Spain) are especially significant, as they account for 75% of the Eurozone’s economy.
Another significant data release for the Euro is the Trade Balance. This indicator measures the difference between what a country earns from its exports and what it spends on imports over a given period. If a country produces highly sought after exports then its currency will gain in value purely from the extra demand created from foreign buyers seeking to purchase these goods. Therefore, a positive net Trade Balance strengthens a currency and vice versa for a negative balance.
-
02:05
PBOC leaves Loan Prime Rates unchanged in January
The People’s Bank of China (PBOC), China's central bank, announced to leave its Loan Prime Rates (LPRs) unchanged on Monday. The one-year and five-year LPRs were at 3.10% and 3.60%, respectively.
Market reaction
At the time of writing, AUD/USD is holding higher ground near 0.6200, up 0.05% on the day.
PBOC FAQs
The primary monetary policy objectives of the People's Bank of China (PBoC) are to safeguard price stability, including exchange rate stability, and promote economic growth. China’s central bank also aims to implement financial reforms, such as opening and developing the financial market.
The PBoC is owned by the state of the People's Republic of China (PRC), so it is not considered an autonomous institution. The Chinese Communist Party (CCP) Committee Secretary, nominated by the Chairman of the State Council, has a key influence on the PBoC’s management and direction, not the governor. However, Mr. Pan Gongsheng currently holds both of these posts.
Unlike the Western economies, the PBoC uses a broader set of monetary policy instruments to achieve its objectives. The primary tools include a seven-day Reverse Repo Rate (RRR), Medium-term Lending Facility (MLF), foreign exchange interventions and Reserve Requirement Ratio (RRR). However, The Loan Prime Rate (LPR) is China’s benchmark interest rate. Changes to the LPR directly influence the rates that need to be paid in the market for loans and mortgages and the interest paid on savings. By changing the LPR, China’s central bank can also influence the exchange rates of the Chinese Renminbi.
Yes, China has 19 private banks – a small fraction of the financial system. The largest private banks are digital lenders WeBank and MYbank, which are backed by tech giants Tencent and Ant Group, per The Straits Times. In 2014, China allowed domestic lenders fully capitalized by private funds to operate in the state-dominated financial sector.
-
02:05
China PBoC Interest Rate Decision in line with forecasts (3.1%)
-
01:58
GBP/USD ticks higher on softer USD; lacks bullish conviction and remains below 1.2200
- GBP/USD ticks higher on Monday amid the emergence of some US Dollar selling.
- Expectations that the Fed might stick to its hawkish stance should limit USD losses.
- Bets that the BoE will cut rates in February might contribute to capping the pair.
The GBP/USD pair kicks off the new week on a slightly positive note and reverses a part of Friday's decline, though the uptick lacks follow-through or bullish conviction. Spot prices currently trade around the 1.2180 region, up less than 0.10% for the day, and remain close to the lowest level since November 2023 touched last week.
The US Dollar (USD) struggles to capitalize on Friday's positive move amid expectations that the Federal Reserve (Fed) may not exclude the possibility of rate cuts by the end of this year. Apart from this, a generally positive risk tone undermines demand for the safe-haven Greenback, which is seen lending some support to the GBP/USD pair. That said, a combination of factors could act as a headwind for spot prices, warranting some caution for bullish traders.
Investors seem convinced that US President-elect Donald Trump’s protectionist policies could boost inflation and force the Fed to adopt a more hawkish stance. Moreover, the Fed is expected to pause its rate-cutting cycle later this month, which should limit the USD losses. Adding to this, the risk of stagflation, along with worries about the UK's fiscal health, might hold back traders from placing bullish bets around the British Pound (GBP) and cap the GBP/USD pair.
Furthermore, the mixed UK macro data released last week lifted bets for a 25-basis-points rate cut by the Bank of England (BoE) at the next policy meeting on February 6. Hence, it is prudent to wait for strong follow-through buying before confirming that the GBP/USD pair has formed a near-term bottom and positioning for any meaningful appreciating move in the absence of any relevant market-moving economic data on Monday.
Pound Sterling FAQs
The Pound Sterling (GBP) is the oldest currency in the world (886 AD) and the official currency of the United Kingdom. It is the fourth most traded unit for foreign exchange (FX) in the world, accounting for 12% of all transactions, averaging $630 billion a day, according to 2022 data. Its key trading pairs are GBP/USD, also known as ‘Cable’, which accounts for 11% of FX, GBP/JPY, or the ‘Dragon’ as it is known by traders (3%), and EUR/GBP (2%). The Pound Sterling is issued by the Bank of England (BoE).
The single most important factor influencing the value of the Pound Sterling is monetary policy decided by the Bank of England. The BoE bases its decisions on whether it has achieved its primary goal of “price stability” – a steady inflation rate of around 2%. Its primary tool for achieving this is the adjustment of interest rates. When inflation is too high, the BoE will try to rein it in by raising interest rates, making it more expensive for people and businesses to access credit. This is generally positive for GBP, as higher interest rates make the UK a more attractive place for global investors to park their money. When inflation falls too low it is a sign economic growth is slowing. In this scenario, the BoE will consider lowering interest rates to cheapen credit so businesses will borrow more to invest in growth-generating projects.
Data releases gauge the health of the economy and can impact the value of the Pound Sterling. Indicators such as GDP, Manufacturing and Services PMIs, and employment can all influence the direction of the GBP. A strong economy is good for Sterling. Not only does it attract more foreign investment but it may encourage the BoE to put up interest rates, which will directly strengthen GBP. Otherwise, if economic data is weak, the Pound Sterling is likely to fall.
Another significant data release for the Pound Sterling is the Trade Balance. This indicator measures the difference between what a country earns from its exports and what it spends on imports over a given period. If a country produces highly sought-after exports, its currency will benefit purely from the extra demand created from foreign buyers seeking to purchase these goods. Therefore, a positive net Trade Balance strengthens a currency and vice versa for a negative balance.
-
01:41
First Israeli hostages freed as Gaza ceasefire takes effect
A long-delayed ceasefire in the Gaza conflict started to take hold when Hamas released three female hostages in return for 90 Palestinians imprisoned in Israel, per Bloomberg.
In return for the three Israeli hostages freed Hamas agreed to release 90 prisoners and detainees. All of them were expected to be women and children, according to the Commission of Prisoners' Affairs.Market reaction
At the time of press, the XAU/USD pair was down 0.22% on the day at $2,695.
Risk sentiment FAQs
In the world of financial jargon the two widely used terms “risk-on” and “risk off'' refer to the level of risk that investors are willing to stomach during the period referenced. In a “risk-on” market, investors are optimistic about the future and more willing to buy risky assets. In a “risk-off” market investors start to ‘play it safe’ because they are worried about the future, and therefore buy less risky assets that are more certain of bringing a return, even if it is relatively modest.
Typically, during periods of “risk-on”, stock markets will rise, most commodities – except Gold – will also gain in value, since they benefit from a positive growth outlook. The currencies of nations that are heavy commodity exporters strengthen because of increased demand, and Cryptocurrencies rise. In a “risk-off” market, Bonds go up – especially major government Bonds – Gold shines, and safe-haven currencies such as the Japanese Yen, Swiss Franc and US Dollar all benefit.
The Australian Dollar (AUD), the Canadian Dollar (CAD), the New Zealand Dollar (NZD) and minor FX like the Ruble (RUB) and the South African Rand (ZAR), all tend to rise in markets that are “risk-on”. This is because the economies of these currencies are heavily reliant on commodity exports for growth, and commodities tend to rise in price during risk-on periods. This is because investors foresee greater demand for raw materials in the future due to heightened economic activity.
The major currencies that tend to rise during periods of “risk-off” are the US Dollar (USD), the Japanese Yen (JPY) and the Swiss Franc (CHF). The US Dollar, because it is the world’s reserve currency, and because in times of crisis investors buy US government debt, which is seen as safe because the largest economy in the world is unlikely to default. The Yen, from increased demand for Japanese government bonds, because a high proportion are held by domestic investors who are unlikely to dump them – even in a crisis. The Swiss Franc, because strict Swiss banking laws offer investors enhanced capital protection.
-
01:30
Stocks. Daily history for Friday, January 17, 2025
Index Change, points Closed Change, % NIKKEI 225 -121.14 38451.46 -0.31 Hang Seng 61.17 19584.06 0.31 KOSPI -3.94 2523.55 -0.16 ASX 200 -16.6 8310.4 -0.2 DAX 248 20903.39 1.2 CAC 40 75.01 7709.75 0.98 Dow Jones 334.7 43487.83 0.78 S&P 500 59.32 5996.66 1 NASDAQ Composite 291.91 19630.2 1.51 -
01:16
Gold Price Forecast: XAU/USD attracts some sellers below $2,700, eyes on Trump's inauguration
- Gold price declines to around $2,695 in Monday’s early Asian session.
- The firmer Greenback undermines the USD-denominated Gold price.
- The uncertainty and elevated geopolitical tensions could boost the Gold price, a traditional safe-haven asset.
Gold price (XAU/USD) extends its decline to near $2,695 during the early Asian session on Monday. The stronger US Dollar (USD) broadly ahead of President-elect Donald Trump’s inauguration exerts some selling pressure on the yellow metal.
Analysts expect the gold price to face volatility before Trump takes office. Traders will closely watch the developments surrounding potential trade policies. Any of Trump's aggressive comments about using trade tariffs to support the US manufacturing sector could lift the Greenback and weigh on the USD-denominated commodity price.
However, the softer-than-expected US inflation data last week could support the precious metal as it might trigger the speculation of more than a single rate cut from the US Federal Reserve (Fed). Traders await Trump's inauguration on Monday for fresh catalysts about executive orders that he plans to issue after he is sworn into office. "The uncertainty in regard to the policies that President Trump is going to put in place has been one of the supportive factors for gold," said David Meger, director of metals trading at High Ridge Futures.
Additionally, the persistent geopolitical tensions in the Middle East and the ongoing Russia-Ukraine conflicts could boost the safe-haven flows, benefiting the Gold price. The Guardian reported that the Russian military took control of two more settlements in eastern Ukraine’s Donetsk region on Saturday, the latest in a series of gains it has reported in its steady advance westward.Gold FAQs
Gold has played a key role in human’s history as it has been widely used as a store of value and medium of exchange. Currently, apart from its shine and usage for jewelry, the precious metal is widely seen as a safe-haven asset, meaning that it is considered a good investment during turbulent times. Gold is also widely seen as a hedge against inflation and against depreciating currencies as it doesn’t rely on any specific issuer or government.
Central banks are the biggest Gold holders. In their aim to support their currencies in turbulent times, central banks tend to diversify their reserves and buy Gold to improve the perceived strength of the economy and the currency. High Gold reserves can be a source of trust for a country’s solvency. Central banks added 1,136 tonnes of Gold worth around $70 billion to their reserves in 2022, according to data from the World Gold Council. This is the highest yearly purchase since records began. Central banks from emerging economies such as China, India and Turkey are quickly increasing their Gold reserves.
Gold has an inverse correlation with the US Dollar and US Treasuries, which are both major reserve and safe-haven assets. When the Dollar depreciates, Gold tends to rise, enabling investors and central banks to diversify their assets in turbulent times. Gold is also inversely correlated with risk assets. A rally in the stock market tends to weaken Gold price, while sell-offs in riskier markets tend to favor the precious metal.
The price can move due to a wide range of factors. Geopolitical instability or fears of a deep recession can quickly make Gold price escalate due to its safe-haven status. As a yield-less asset, Gold tends to rise with lower interest rates, while higher cost of money usually weighs down on the yellow metal. Still, most moves depend on how the US Dollar (USD) behaves as the asset is priced in dollars (XAU/USD). A strong Dollar tends to keep the price of Gold controlled, whereas a weaker Dollar is likely to push Gold prices up.
-
01:15
Currencies. Daily history for Friday, January 17, 2025
Pare Closed Change, % AUDUSD 0.61961 -0.2 EURJPY 160.44 0.44 EURUSD 1.02757 -0.21 GBPJPY 190.023 0.09 GBPUSD 1.21704 -0.51 NZDUSD 0.55868 -0.31 USDCAD 1.44657 0.58 USDCHF 0.91498 0.61 USDJPY 156.135 0.65 -
01:03
United Kingdom Rightmove House Price Index (YoY) up to 1.8% in January from previous 1.4%
-
01:01
United Kingdom Rightmove House Price Index (MoM): 1.7% (January) vs -1.7%
-
00:50
Japan Machinery Orders (MoM) above forecasts (-0.4%) in November: Actual (3.4%)
-
00:50
Japan Machinery Orders (YoY) above expectations (5.6%) in November: Actual (10.3%)
-
00:23
AUD/USD holds below 0.6200 ahead of Trump’s inauguration
- AUD/USD softens to near 0.6190 in Monday’s early Asian session.
- The Fed is anticipated to hold rates steady in the January meeting.
- Trump’s tariff threat could put pressure on the Aussie.
The AUD/USD pair weakens to around 0.6190, snapping the two-day losing streak during the early Asian session on Monday. The markets turn cautious as President-elect Donald Trump will be inaugurated later on Monday. The US market is closed on Monday due to the Martin Luther King Day bank holiday.
Concerns around Trump's pledges, including tariffs, extending tax cuts, and deportations of illegal immigrants, have contributed to a rise in US Treasury yields and the Greenback before he takes office. Analysts believe that the US Federal Reserve (Fed) future interest rate path will depend on how aggressively the incoming Trump administration follows through on those pledges.
Investors will closely monitor Trump’s executive orders, which he plans to issue just hours after he is sworn into office. The Fed is expected to hold interest rates unchanged at its January meeting and resume the reductions in March, according to a slim majority of economists polled by Reuters.
The possibility of renewed trade tensions between the US and China and the potential of Trump's higher tariffs could exert some selling pressure on the Australian Dollar (AUD) as China is a major trading partner to Australia. However, the upbeat Chinese economic data on Friday could support the Australian Dollar (AUD). China’s economy grew 5.4% YoY in the fourth quarter (Q4) of 2024, compared to a 4.6% expansion in Q3. This reading came in stronger than the 5% expected by a wide margin.Australian Dollar FAQs
One of the most significant factors for the Australian Dollar (AUD) is the level of interest rates set by the Reserve Bank of Australia (RBA). Because Australia is a resource-rich country another key driver is the price of its biggest export, Iron Ore. The health of the Chinese economy, its largest trading partner, is a factor, as well as inflation in Australia, its growth rate and Trade Balance. Market sentiment – whether investors are taking on more risky assets (risk-on) or seeking safe-havens (risk-off) – is also a factor, with risk-on positive for AUD.
The Reserve Bank of Australia (RBA) influences the Australian Dollar (AUD) by setting the level of interest rates that Australian banks can lend to each other. This influences the level of interest rates in the economy as a whole. The main goal of the RBA is to maintain a stable inflation rate of 2-3% by adjusting interest rates up or down. Relatively high interest rates compared to other major central banks support the AUD, and the opposite for relatively low. The RBA can also use quantitative easing and tightening to influence credit conditions, with the former AUD-negative and the latter AUD-positive.
China is Australia’s largest trading partner so the health of the Chinese economy is a major influence on the value of the Australian Dollar (AUD). When the Chinese economy is doing well it purchases more raw materials, goods and services from Australia, lifting demand for the AUD, and pushing up its value. The opposite is the case when the Chinese economy is not growing as fast as expected. Positive or negative surprises in Chinese growth data, therefore, often have a direct impact on the Australian Dollar and its pairs.
Iron Ore is Australia’s largest export, accounting for $118 billion a year according to data from 2021, with China as its primary destination. The price of Iron Ore, therefore, can be a driver of the Australian Dollar. Generally, if the price of Iron Ore rises, AUD also goes up, as aggregate demand for the currency increases. The opposite is the case if the price of Iron Ore falls. Higher Iron Ore prices also tend to result in a greater likelihood of a positive Trade Balance for Australia, which is also positive of the AUD.
The Trade Balance, which is the difference between what a country earns from its exports versus what it pays for its imports, is another factor that can influence the value of the Australian Dollar. If Australia produces highly sought after exports, then its currency will gain in value purely from the surplus demand created from foreign buyers seeking to purchase its exports versus what it spends to purchase imports. Therefore, a positive net Trade Balance strengthens the AUD, with the opposite effect if the Trade Balance is negative.
-
