Noticias del mercado
-
23:59
RBA’s Bullock: Board remains cautious about prospects for further policy easing
Reserve Bank of Australia Governor Michele Bullock said late Thursday that the central projection suggests that if monetary policy is eased too quickly or by too much, disinflation could stall and inflation would settle above the midpoint.
Key quotes
The board is committed to being guided by the incoming data and our evolving assessment of the risks.
While the strong employment growth is good news for jobseekers, we are alert to the possibility that it is signaling a bit more strength in the economy.
We have not pre-committed to any particular course of action on interest rates.
Satisfied with the progress on inflation so far – though our job is definitely not done.
The central projection suggests that if monetary policy is eased too quickly or by too much, disinflation could stall and inflation would settle above the midpoint of the target range.
So the board remains cautious about prospects for further policy easing.
The economic outlook remains uncertain.
We have made good progress on inflation, however, the board needs to be confident that it is returning to the target range sustainably.Market reaction
At the press time, the AUD/USD pair was down 0.08% on the day to trade at 0.6398.
Australian Dollar FAQs
One of the most significant factors for the Australian Dollar (AUD) is the level of interest rates set by the Reserve Bank of Australia (RBA). Because Australia is a resource-rich country another key driver is the price of its biggest export, Iron Ore. The health of the Chinese economy, its largest trading partner, is a factor, as well as inflation in Australia, its growth rate and Trade Balance. Market sentiment – whether investors are taking on more risky assets (risk-on) or seeking safe-havens (risk-off) – is also a factor, with risk-on positive for AUD.
The Reserve Bank of Australia (RBA) influences the Australian Dollar (AUD) by setting the level of interest rates that Australian banks can lend to each other. This influences the level of interest rates in the economy as a whole. The main goal of the RBA is to maintain a stable inflation rate of 2-3% by adjusting interest rates up or down. Relatively high interest rates compared to other major central banks support the AUD, and the opposite for relatively low. The RBA can also use quantitative easing and tightening to influence credit conditions, with the former AUD-negative and the latter AUD-positive.
China is Australia’s largest trading partner so the health of the Chinese economy is a major influence on the value of the Australian Dollar (AUD). When the Chinese economy is doing well it purchases more raw materials, goods and services from Australia, lifting demand for the AUD, and pushing up its value. The opposite is the case when the Chinese economy is not growing as fast as expected. Positive or negative surprises in Chinese growth data, therefore, often have a direct impact on the Australian Dollar and its pairs.
Iron Ore is Australia’s largest export, accounting for $118 billion a year according to data from 2021, with China as its primary destination. The price of Iron Ore, therefore, can be a driver of the Australian Dollar. Generally, if the price of Iron Ore rises, AUD also goes up, as aggregate demand for the currency increases. The opposite is the case if the price of Iron Ore falls. Higher Iron Ore prices also tend to result in a greater likelihood of a positive Trade Balance for Australia, which is also positive of the AUD.
The Trade Balance, which is the difference between what a country earns from its exports versus what it pays for its imports, is another factor that can influence the value of the Australian Dollar. If Australia produces highly sought after exports, then its currency will gain in value purely from the surplus demand created from foreign buyers seeking to purchase its exports versus what it spends to purchase imports. Therefore, a positive net Trade Balance strengthens the AUD, with the opposite effect if the Trade Balance is negative.
-
23:40
Australia's Judo Bank Manufacturing PMI rises to 50.6 in February, Services PMI improves to 51.4
The preliminary reading of Australia's Judo Bank Manufacturing Purchasing Managers Index (PMI) rose to 50.6 in February from 50.2 in January, the latest data published by Judo Bank and S&P Global showed on Friday.
The Judo Bank Australian Services PMI improved to 51.4 in February from the previous reading of 51.2, while the Composite PMI increased to 51.2 in February versus 51.1 prior.Market reaction
At the press time, the AUD/USD pair was down 0.11% on the day to trade at 0.6395.
Australian Dollar FAQs
One of the most significant factors for the Australian Dollar (AUD) is the level of interest rates set by the Reserve Bank of Australia (RBA). Because Australia is a resource-rich country another key driver is the price of its biggest export, Iron Ore. The health of the Chinese economy, its largest trading partner, is a factor, as well as inflation in Australia, its growth rate and Trade Balance. Market sentiment – whether investors are taking on more risky assets (risk-on) or seeking safe-havens (risk-off) – is also a factor, with risk-on positive for AUD.
The Reserve Bank of Australia (RBA) influences the Australian Dollar (AUD) by setting the level of interest rates that Australian banks can lend to each other. This influences the level of interest rates in the economy as a whole. The main goal of the RBA is to maintain a stable inflation rate of 2-3% by adjusting interest rates up or down. Relatively high interest rates compared to other major central banks support the AUD, and the opposite for relatively low. The RBA can also use quantitative easing and tightening to influence credit conditions, with the former AUD-negative and the latter AUD-positive.
China is Australia’s largest trading partner so the health of the Chinese economy is a major influence on the value of the Australian Dollar (AUD). When the Chinese economy is doing well it purchases more raw materials, goods and services from Australia, lifting demand for the AUD, and pushing up its value. The opposite is the case when the Chinese economy is not growing as fast as expected. Positive or negative surprises in Chinese growth data, therefore, often have a direct impact on the Australian Dollar and its pairs.
Iron Ore is Australia’s largest export, accounting for $118 billion a year according to data from 2021, with China as its primary destination. The price of Iron Ore, therefore, can be a driver of the Australian Dollar. Generally, if the price of Iron Ore rises, AUD also goes up, as aggregate demand for the currency increases. The opposite is the case if the price of Iron Ore falls. Higher Iron Ore prices also tend to result in a greater likelihood of a positive Trade Balance for Australia, which is also positive of the AUD.
The Trade Balance, which is the difference between what a country earns from its exports versus what it pays for its imports, is another factor that can influence the value of the Australian Dollar. If Australia produces highly sought after exports, then its currency will gain in value purely from the surplus demand created from foreign buyers seeking to purchase its exports versus what it spends to purchase imports. Therefore, a positive net Trade Balance strengthens the AUD, with the opposite effect if the Trade Balance is negative.
-
23:03
Australia Judo Bank Manufacturing PMI up to 50.6 in February from previous 50.2
-
23:01
Australia Judo Bank Services PMI rose from previous 51.2 to 51.4 in February
-
23:01
Australia Judo Bank Composite PMI increased to 51.2 in February from previous 51.1
-
22:57
Gold price extended gains on trade war fears, soft US Dollar
- Gold rises 0.23% as risk aversion fuels safe-haven flows.
- Fed Minutes highlight inflation concerns amid Trump’s trade policies.
- Traders eye S&P Global Flash PMIs for further market direction.
Gold's price advanced late in the North American session yet traded off record highs of $2,954 as traders took profits. Trade war woes, a weak US Dollar, and falling US Treasury bond yields kept XAU/USD trading with modest gains of 0.23% near the $2,939 mark at the time of writing.
Bullion’s demand remains fueled by uncertainty about global trade. Risk aversion sparked flows toward the safe-haven appeal of Gold alongside the Japanese Yen (JPY), which posted substantial gains during the day.
The Federal Reserve’s (Fed) Meeting Minutes from Wednesday revealed that Trump’s trade and immigration policies fueled concerns over rising prices. Hence, the Fed Chair Jerome Powell and Co. decided to hold rates unchanged at the January meeting as they assess the current economic data.
In the meantime, some Fed speakers crossed the wires and have turned slightly cautious. Atlanta Fed President Raphael Bostic sees two rate cuts this year and emphasizes that the economy is not facing a new burst of inflation. St. Louis Fed President Alberto Musalem sees some policy shifts and increased risks of inflation stalling above the Fed’s 2% goal.
Finally, Chicago’s Fed President Austan Goolsbee said that before the recent policy and geopolitical uncertainties, overall inflation "looked pretty good" and was down substantially. However, Trump's broad-based and higher tariffs currently in development keep the Fed nervous.
Data-wise, US job data was softer than expected as the number of Americans filling out unemployment benefits came below estimates. On Friday, Gold traders are eyeing the release of S&P Global Flash PMIs.
Daily digest market movers: Gold price boosted by Trump’s tariff threats fueling safe-haven demand
- US President Donald Trump recently announced that tariffs on cars, automobiles, and computer chips would be around 25%. He also said on Wednesday that duties would broaden to other commodities like lumber.
- US Initial Jobless Claims for the week ending February 15 increased by 219K, exceeding forecasts of 215K.
- The US 10-year Treasury bond yield falls three basis points (bps) and yields 4.505%.
- US real yields, which correlate inversely to Bullion prices, drop three basis points to 2.04%, a tailwind for Bullion prices.
- The World Gold Council revealed that central bank purchases rose more than 54% YoY to 333 tonnes following Trump’s victory, according to its data.
- Money market fed funds futures are pricing in 41.5 basis points of easing by the Fed in 2025.
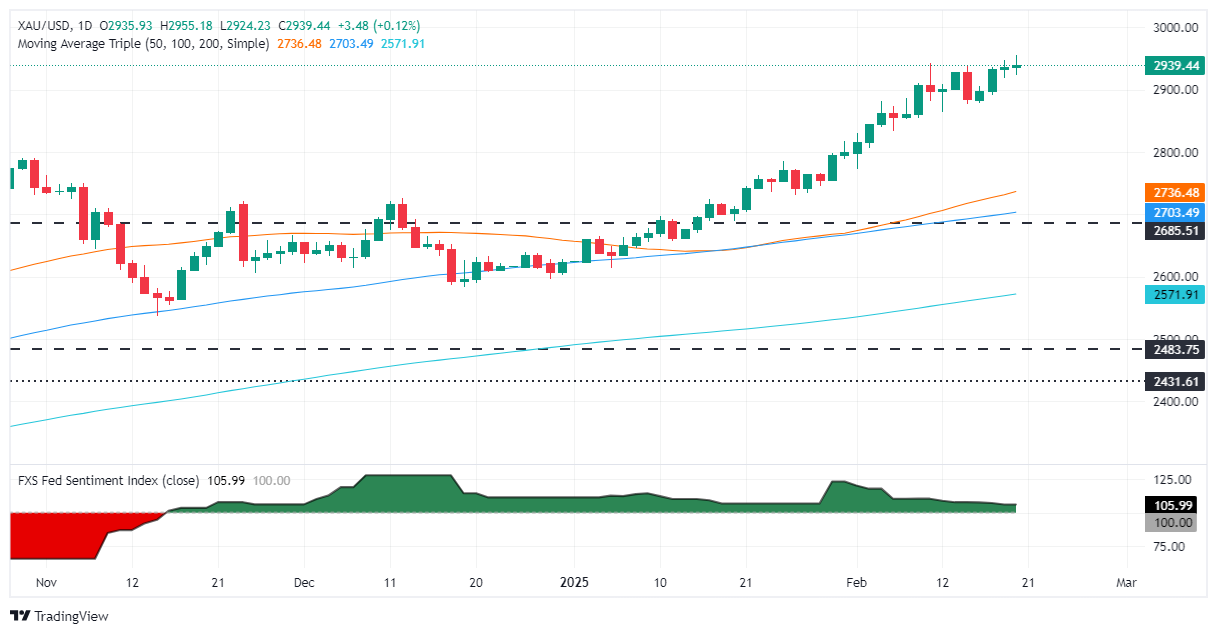
XAU/USD technical outlook: Gold price faces stir resistance and retreats
Gold price uptrend remains intact, even though it has failed to decisively clear the $2,950 figure, opening the door for a pullback. Momentum shows overstretched as the Relative Strength Index (RSI) exited from overbought conditions, suggesting that sellers are gathering momentum.
In that outcome, the first support would be the February 14 swing low of $2,877, followed by the February 12 daily low of $2,864.
On the other hand, if XAU/USD rises past $2,954, the first resistance would be the psychological $2,950, followed by $3,000.
Gold FAQs
Gold has played a key role in human’s history as it has been widely used as a store of value and medium of exchange. Currently, apart from its shine and usage for jewelry, the precious metal is widely seen as a safe-haven asset, meaning that it is considered a good investment during turbulent times. Gold is also widely seen as a hedge against inflation and against depreciating currencies as it doesn’t rely on any specific issuer or government.
Central banks are the biggest Gold holders. In their aim to support their currencies in turbulent times, central banks tend to diversify their reserves and buy Gold to improve the perceived strength of the economy and the currency. High Gold reserves can be a source of trust for a country’s solvency. Central banks added 1,136 tonnes of Gold worth around $70 billion to their reserves in 2022, according to data from the World Gold Council. This is the highest yearly purchase since records began. Central banks from emerging economies such as China, India and Turkey are quickly increasing their Gold reserves.
Gold has an inverse correlation with the US Dollar and US Treasuries, which are both major reserve and safe-haven assets. When the Dollar depreciates, Gold tends to rise, enabling investors and central banks to diversify their assets in turbulent times. Gold is also inversely correlated with risk assets. A rally in the stock market tends to weaken Gold price, while sell-offs in riskier markets tend to favor the precious metal.
The price can move due to a wide range of factors. Geopolitical instability or fears of a deep recession can quickly make Gold price escalate due to its safe-haven status. As a yield-less asset, Gold tends to rise with lower interest rates, while higher cost of money usually weighs down on the yellow metal. Still, most moves depend on how the US Dollar (USD) behaves as the asset is priced in dollars (XAU/USD). A strong Dollar tends to keep the price of Gold controlled, whereas a weaker Dollar is likely to push Gold prices up.
-
22:45
New Zealand Trade Balance NZD (MoM) came in at $-486M below forecasts ($225M) in January
-
22:45
New Zealand Exports down to $6.19B in January from previous $6.84B
-
22:45
New Zealand Trade Balance NZD (YoY): $-7.22B (January) vs $-7.67B
-
22:45
New Zealand Imports rose from previous $6.62B to $6.68B in January
-
22:42
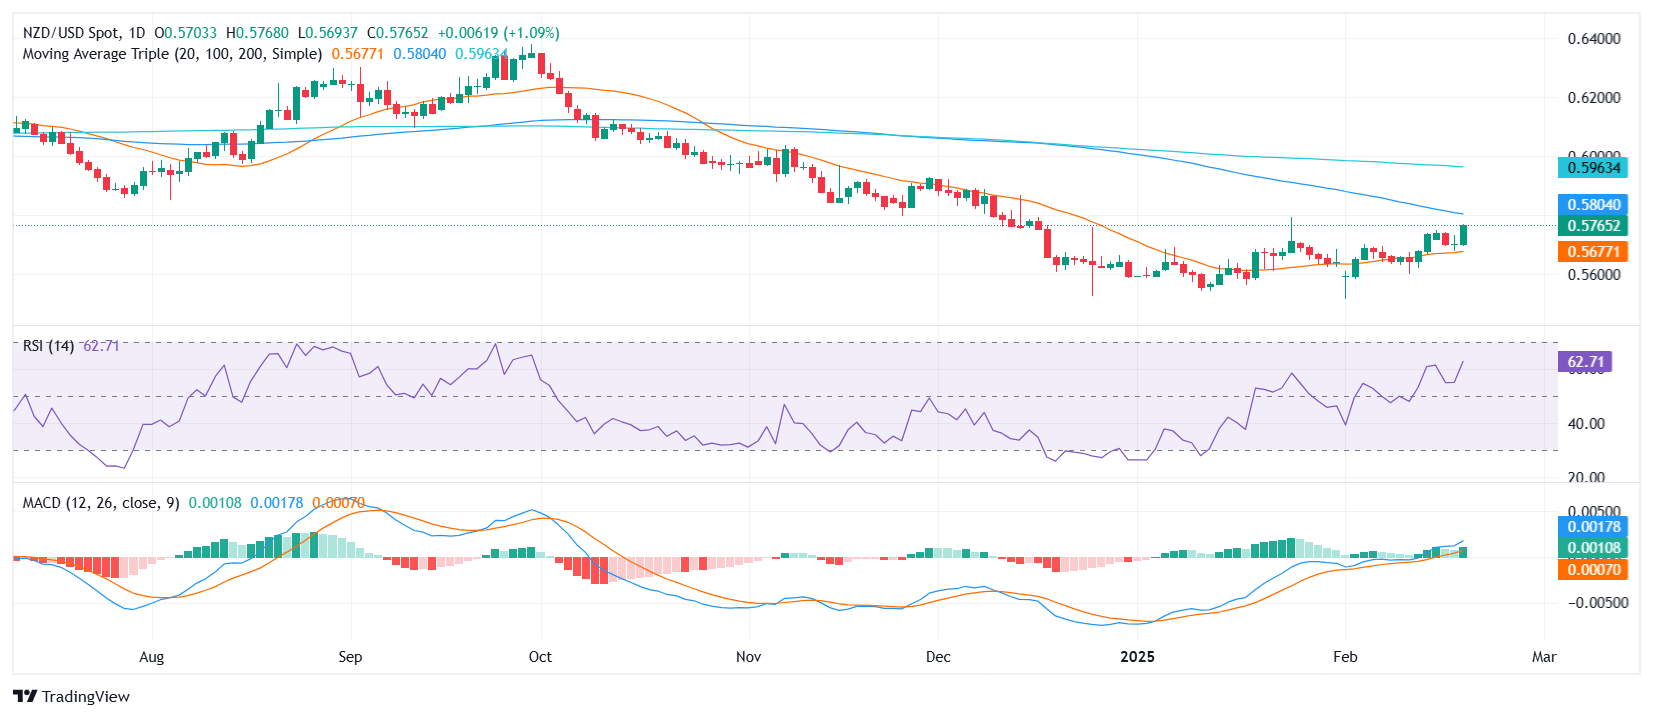
NZD/USD Price Analysis: Bulls surge to back to highs since January, eyeing 100-day SMA retest
- NZD/USD jumps to 0.5765 on Thursday, reaching its highest level since January.
- The RSI climbs to 62, nearing overbought territory but still signaling room for further gains.
- MACD histogram shows rising green bars, indicating sustained bullish momentum and potential for continued upside.
The NZD/USD pair staged an impressive rally on Thursday, climbing 1.03% to close at 0.5765, marking its highest point since January. Buyers regained control, building on recent momentum as the pair looks poised to retest the 100-day Simple Moving Average (SMA), which stands as the next major resistance level.
Technical indicators support the bullish outlook. The Relative Strength Index (RSI) surged to 65, edging closer to overbought territory but still offering room for additional upside before triggering exhaustion signals. Meanwhile, the Moving Average Convergence Divergence (MACD) histogram continues to print rising green bars, highlighting sustained buying pressure and strengthening momentum.
Looking forward, a successful break above the 100-day SMA, currently around 0.5805, could open the door for further gains, potentially extending the bullish trend. On the downside, immediate support is seen near 0.5700, with a drop below this level potentially triggering a deeper correction. However, with indicators still favoring buyers, the near-term bias remains tilted to the upside.
NZD/USD daily chart
-
22:27
South Korea BOK Manufacturing BSI up to 65 in March from previous 63
-
21:47
US Dollar weakens asTrump hints at possible China trade deal, weak labor data
- The US DXY index falls below 106.50 amid trade optimism.
- Trump signals potential easing of China tariffs before April deadline.
- US Jobless Claims disappoint, rising above market expectations.
- Fed officials voice concerns over inflation risks and economic outlook.
The US Dollar Index (DXY), which tracks the US Dollar’s (USD) performance against six major currencies, extends its decline on Thursday, slipping near 106.30. The pullback follows United States (US) President Donald Trump’s announcement of potential progress on a trade deal with China, offering markets a temporary reprieve from tariff concerns. Despite this relief, weak US jobless claims data and mixed Federal Reserve (Fed) commentary keep traders cautious.
Daily digest market movers: US Dollar softens amid trade optimism and weak data
- US President Donald Trump suggests a trade deal with China could be reached before April, easing tariff concerns.
- Initial Jobless Claims for the week ending February 14 rose to 219,000, missing expectations of 215,000.
- Continuing Jobless Claims increase to 1.869 million, slightly below the forecast of 1.87 million.
- Philadelphia Fed Manufacturing Survey for February hits 18.1, below the 20 forecast and down from 44.3 in January.
- St. Louis Fed President Alberto Musalem warns of potential stagflation risks and rising inflation expectations.
- Atlanta Fed President Raphael Bostic maintains the possibility of two rate cuts this year, depending on economic developments.
- The Fed sentiment index remains fairly neutral but in hawkish terrain which might limit the downside.
DXY technical outlook: Bears keep control as downside pressure builds
The US Dollar Index remains under pressure after falling below 106.50, with bearish momentum gaining traction. The index struggles to reclaim the 20-day Simple Moving Average (SMA), signaling continued weakness. Both the Relative Strength Index (RSI) and Moving Average Convergence Divergence (MACD) remain entrenched in negative territory, suggesting persistent downside pressure. A decisive drop below the 100-day SMA at 106.30 could signal a further bearish breakout, with 106.00 emerging as the next significant support level. Bulls need to reclaim the 107.50 resistance zone to shift momentum in their favor.
-
20:32
Canadian Dollar strengthens after hot PPI figures
- USD/CAD dips as traders digest Fed minutes, signaling cautious stance on rate cuts.
- Trump’s new tariffs on Canadian lumber add fresh trade uncertainty.
- Markets eye Canadian Retail Sales, BoC Governor Macklem’s speech for further cues.
The Canadian Dollar appreciated against the Greenback on Thursday. The USD/CAD dropped below the 1.4200 figure, and the Greenback got battered due to investors digesting the latest Federal Open Market Committee (FOMC) minutes.
Canada’s economic docket revealed that Producer Prices exceeded market estimates and December’s figures in January. Other data showed that housing prices were mixed monthly and yearly.
Regarding tariffs, US President Donald Trump announced plans to enact tariffs on lumber and forest products next month. This is significant for Canada, one of the world's leading producers and exporters.
In the meantime, the Fed’s latest minutes showed that officials are concerned about Trump’s administration's trade and immigration policies. Policymakers noted that some inflation expectations had risen recently, adding that maintaining policy firm is appropriate.
Traders would be eyeing the release of Canadian Retail Sales on Friday and Bank of Canada (BoC) Governor Tiff Macklem's speech. At the same time, S&P Global Flash PMIs will update the status of business activity in the US.
Daily digest market movers: Canadian Dollar rallie amid mixed US data
- Canada’s Producer Price Index (PPI) rose 1.6% MoM in January, above forecasts of 0.8%. In the twelve months to January, the PPI increased 5.8%, up from 4.1%.
- US Initial Jobless Claims for the week ending February 15 increased by 219K, exceeding forecasts of 215K.
- Interest rate differentials between Canada and the United States are putting a lid on the Loonie’s gains.
- Elevated inflation reports in Canada could prevent the BoC from lowering rates in check following the release of January’s CPI data. In that outcome, the USD/CAD could aim lower as the Canadian Dollar appreciates versus the Greenback.
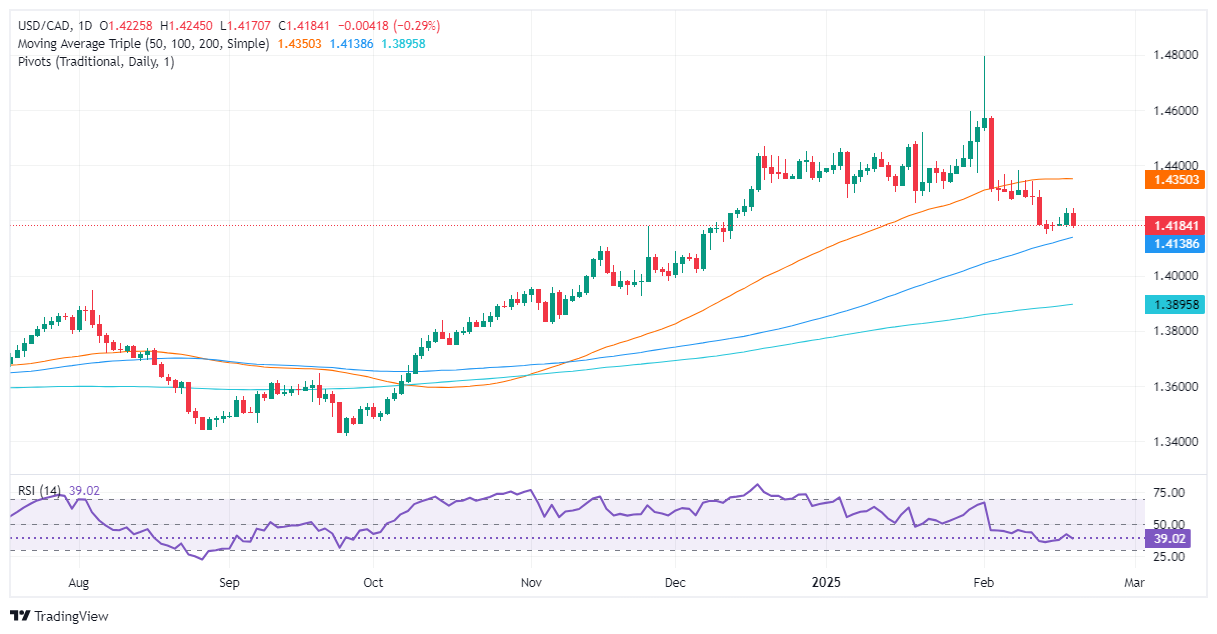
USD/CAD price forecast: Canadian Dollar gathers traction and appreciates on soft US Dollar
The USD/CAD uptrend has lost steam after the pair peaked near 1.4800. Since then, sellers have taken over, pushing prices below the 50-day Simple Moving Average (SMA) at 1.4338 and clearing the January 20 daily low of 1.4260, a crucial level for buyers. Further downside lies ahead if bears push spot prices below the 100-day SMA at 1.4111.
Otherwise, if buyers lift USD/CAD past 1.4300, they must reclaim the 50-day SMA to remain hopeful of higher prices.
Canadian Dollar FAQs
The key factors driving the Canadian Dollar (CAD) are the level of interest rates set by the Bank of Canada (BoC), the price of Oil, Canada’s largest export, the health of its economy, inflation and the Trade Balance, which is the difference between the value of Canada’s exports versus its imports. Other factors include market sentiment – whether investors are taking on more risky assets (risk-on) or seeking safe-havens (risk-off) – with risk-on being CAD-positive. As its largest trading partner, the health of the US economy is also a key factor influencing the Canadian Dollar.
The Bank of Canada (BoC) has a significant influence on the Canadian Dollar by setting the level of interest rates that banks can lend to one another. This influences the level of interest rates for everyone. The main goal of the BoC is to maintain inflation at 1-3% by adjusting interest rates up or down. Relatively higher interest rates tend to be positive for the CAD. The Bank of Canada can also use quantitative easing and tightening to influence credit conditions, with the former CAD-negative and the latter CAD-positive.
The price of Oil is a key factor impacting the value of the Canadian Dollar. Petroleum is Canada’s biggest export, so Oil price tends to have an immediate impact on the CAD value. Generally, if Oil price rises CAD also goes up, as aggregate demand for the currency increases. The opposite is the case if the price of Oil falls. Higher Oil prices also tend to result in a greater likelihood of a positive Trade Balance, which is also supportive of the CAD.
While inflation had always traditionally been thought of as a negative factor for a currency since it lowers the value of money, the opposite has actually been the case in modern times with the relaxation of cross-border capital controls. Higher inflation tends to lead central banks to put up interest rates which attracts more capital inflows from global investors seeking a lucrative place to keep their money. This increases demand for the local currency, which in Canada’s case is the Canadian Dollar.
Macroeconomic data releases gauge the health of the economy and can have an impact on the Canadian Dollar. Indicators such as GDP, Manufacturing and Services PMIs, employment, and consumer sentiment surveys can all influence the direction of the CAD. A strong economy is good for the Canadian Dollar. Not only does it attract more foreign investment but it may encourage the Bank of Canada to put up interest rates, leading to a stronger currency. If economic data is weak, however, the CAD is likely to fall.
-
20:06
Forex Today: It’s PMIs day!
The US Dollar came under renewed and significant selling pressure, retreating to two-month lows even though the US tariff narrative remained unchanged and the Russia-Ukraine peace talks showed no signs of improvement.
Here is what you need to know on Friday, February 21:
The US Dollar Index (DXY) tumbled to fresh two-month lows near 106.40 amid declining US yields, the strong appreciation of the Japanese yen and extra buying pressure in the risk complex. The preliminary S&P Global Manufacturing and Services PMIs should grab all the attention, seconded by Existing Home Sales, and the final Michigan Consumer Sentiment print. In addition, the Fed’s Jefferson is due to speak.
EUR/USD rebounded to three-day highs and approached the key 1.0500 barrier on the back of the US Dollar’s sharp pullback. The advanced HCOB Manufacturing and Services PMIs in Germany and the euro bloc will be released, followed by the European Commission’s Winter Forecasts and the speech by the ECB’s Lane.
GBP/USD climbed to levels last seen in early December around 1.2650 following extra weakness in the Greenback and the widespread uptick in the risk-linked assets. The GfK Consumer Confidence comes first, ahead of Retail Sales, the flash S&P Global Manufacturing and Services PMIs and Public Sector Net Borrowing readings.
The intense buying bias in the Japanese yen motivated USD/JPY to retreat sharply to the 149.40 zone for the first time since December. Key Inflation Rate will be at the centre of the debate along with the preliminary Jibun Bank Manufacturing and Services PMIs.
AUD/USD clocked a new two-month high just above 0.6400 the figure following the deep retracement in the US Dollar. Next on tap in Oz will be the RBA’s Monthly CPI Indicator, and Construction Done figures, all due on February 26.
Supply concerns sparked extra gains in WTI prices, lifting the barrel back above the $73.00 mark on Thursday.
Gold prices clinched an all-time peak beyond $2,950 per ounce troy following tariff concerns and difficult peace talks around the Russia-Ukraine crisis. Silver prices advanced to weekly peaks north of the $33.00 mark per ounce.
-
19:38
Dow Jones Industrial Average slides as markets digest mixed economic data and Fed remarks
- Dow Jones drops over 1.40% to 43,980 as investor sentiment weakens.
- The US Dollar Index retreats below 106.90 after Trump hints at a potential trade deal with China.
- US Initial Jobless Claims miss estimates, raising concerns about labor market resilience.
- St. Louis Fed warns of inflation risks, while Atlanta Fed’s Bostic sees room for two rate cuts this year.
The Dow Jones Industrial Average (DJIA), which measures the performance of 30 large-cap US stocks, fell sharply on Thursday, dropping more than 1.40% to 43,980. Investors reacted to mixed economic data and cautious remarks from Federal Reserve (Fed) officials. The labor market showed signs of weakness, while the possibility of a United States (US)-China trade deal helped ease concerns over upcoming tariffs.
Daily digest market movers: Dow Jones tumbles as economic concerns grow
- The Dow extended losses as market participants digested weaker-than-expected weekly jobless claims.
- Initial Jobless Claims rose to 219,000, exceeding estimates of 215,000 and higher than the previous 214,000.
- Continuing Jobless Claims climbed to 1.869 million, surpassing forecasts and the previous 1.845 million.
- The Philadelphia Fed Manufacturing Survey printed at 18.1, below expectations of 20 and January’s 44.3.
- US President Donald Trump hinted at a potential trade deal with China, easing concerns over April’s tariff hikes.
- The US Dollar Index (DXY) fell below 106.90 following Trump’s comments, signaling reduced demand for safe-haven assets.
- St. Louis Fed President Alberto Musalem warned of rising inflation expectations and the risk of stagflation.
- Atlanta Fed President Raphael Bostic reiterated that two rate cuts remain possible this year, depending on economic conditions.
- The Dow remains under selling pressure, struggling to regain key technical levels after breaking below 44,000.
Technical Analysis
The Dow Jones Industrial Average has fallen below 44,000, accelerating downside momentum. The break below the 20-day SMA at 44,580 confirms a bearish trend, with sellers gaining control. If the index fails to hold above 43,900, further declines toward the 100-day SMA around 43,480 could follow. A recovery above 44,200 is needed to ease immediate selling pressure.
Fed FAQs
Monetary policy in the US is shaped by the Federal Reserve (Fed). The Fed has two mandates: to achieve price stability and foster full employment. Its primary tool to achieve these goals is by adjusting interest rates. When prices are rising too quickly and inflation is above the Fed’s 2% target, it raises interest rates, increasing borrowing costs throughout the economy. This results in a stronger US Dollar (USD) as it makes the US a more attractive place for international investors to park their money. When inflation falls below 2% or the Unemployment Rate is too high, the Fed may lower interest rates to encourage borrowing, which weighs on the Greenback.
The Federal Reserve (Fed) holds eight policy meetings a year, where the Federal Open Market Committee (FOMC) assesses economic conditions and makes monetary policy decisions. The FOMC is attended by twelve Fed officials – the seven members of the Board of Governors, the president of the Federal Reserve Bank of New York, and four of the remaining eleven regional Reserve Bank presidents, who serve one-year terms on a rotating basis.
In extreme situations, the Federal Reserve may resort to a policy named Quantitative Easing (QE). QE is the process by which the Fed substantially increases the flow of credit in a stuck financial system. It is a non-standard policy measure used during crises or when inflation is extremely low. It was the Fed’s weapon of choice during the Great Financial Crisis in 2008. It involves the Fed printing more Dollars and using them to buy high grade bonds from financial institutions. QE usually weakens the US Dollar.
Quantitative tightening (QT) is the reverse process of QE, whereby the Federal Reserve stops buying bonds from financial institutions and does not reinvest the principal from the bonds it holds maturing, to purchase new bonds. It is usually positive for the value of the US Dollar.
-
18:54
Mexican Peso rebounds as Retail Sales beat forecasts, Banxico stays dovish
- Mexican Peso appreciates, shrugging off dovish Banxico stance, weaker economic outlook.
- Mexico’s December Retail Sales exceed estimates but slow from prior month.
- Banxico minutes reaffirm dovish stance, highlighting progress on disinflation.
- Q4 GDP final reading expected to confirm economic slowdown on Friday.
The Mexican Peso staged a comeback, rising over 0.23% against the Greenback. Retail Sales in December exceeded estimates, yet they lagged compared to the previous month’s figures. The USD/MXN trades at 20.39 after hitting a daily high of 20.46.
Mexico’s economic docket revealed that consumer spending dipped compared to November’s data but exceeded private economists' pessimistic expectations. Meanwhile, Banco de Mexico (Banxico) revealed its latest Meeting Minutes, reaffirming the Mexican institution's dovish stance, and suggested that further rate cuts are eyed.
On Wednesday, Banxico revealed its quarterly report for Q4 2024, in which the central bank downwardly revised its growth forecast for 2025. Furthermore, the bank expects weaker consumption and private spending, reflecting the highly uncertain environment.
Regarding their 50basis-point rate cut in the latest monetary policy decision, the Governing Board ruled out they’re comfortable with the current inflation levels. It highlighted the progress of the disinflationary process.
On Friday, the Instituto Nacional de Estadistica Geografia e Informatica (INEGI) will feature the final GDP reading for Q4 2024, which is expected to show a quarterly contraction and is foreseen expanding annually.
Daily digest market movers: Mexican Peso climbs, unfazed by weaker economic outlook
- Banxico’s latest minutes acknowledged that growth risks are tilted to the downside. The Governing Board expects the economy will grow 0.6% in 2025, down from the 1.2% previously foreseen. The forecast is well below the estimate from Mexico’s Finance Ministry of 2.3% and beneath the Citi Expectations Survey of 1%.
- For 2026, Banxico estimates that Mexico’s economy will expand by 1.8%.
- Mexico’s Retail Sales rose by 0.1% MoM, above estimates for a -0.4% shrinkage. On an annual basis, sales improved from a -1.9% contraction to -0.2% YoY.
- Mexico’s President Claudia Sheinbaum said that Marcelo Ebrard, Mexico’s Secretary of Economy, will meet with the US Commerce Secretary today about tariffs.
- Monetary policy divergence between Banxico and the Fed favors further USD/MXN upside. The Fed is expected to keep rates steady, while Banxico is foreseen cutting rates again by 50 basis points at the next meeting.
- The USD/MXN is advancing due to weakness in the Greenback. The US Dollar Index (DXY) dropped 0.65% to 106.45.
- Trade disputes between the US and Mexico remain front and center. Although the countries found common ground previously, USD/MXN traders should know that there is a 30-day pause and that tensions could arise toward the end of February.
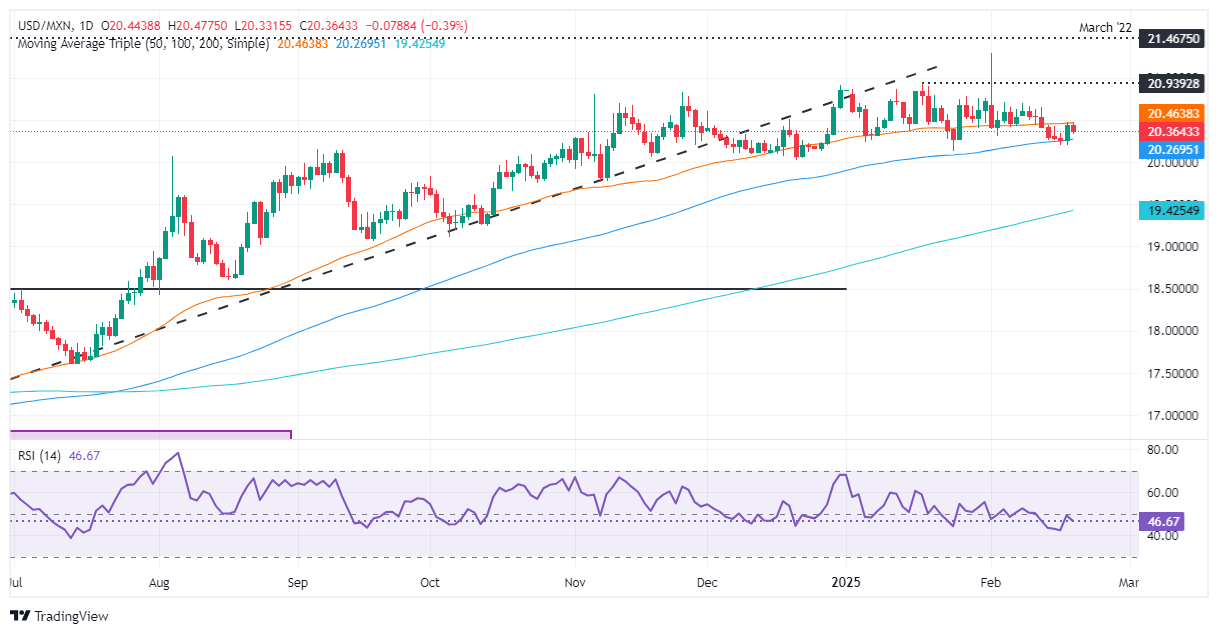
USD/MXN technical outlook: Mexican Peso is steady as USD/MXN is below 50-day SMA
The USD/MXN continued consolidating below the 50-day Simple Moving Average (SMA), keeping bulls in check. Further weakness could drive the exchange rate below the 100-day SMA at 20.22 and threaten to challenge the psychological 20.00 figure. If cleared, the next support would be the October 18, 2024 low at 19.64, ahead of the 200-day SMA at 19.37.
Conversely, if USD/MXN climbs past the 50-day SMA, further gains lie ahead of the 20.50 mark.
Mexican Peso FAQs
The Mexican Peso (MXN) is the most traded currency among its Latin American peers. Its value is broadly determined by the performance of the Mexican economy, the country’s central bank’s policy, the amount of foreign investment in the country and even the levels of remittances sent by Mexicans who live abroad, particularly in the United States. Geopolitical trends can also move MXN: for example, the process of nearshoring – or the decision by some firms to relocate manufacturing capacity and supply chains closer to their home countries – is also seen as a catalyst for the Mexican currency as the country is considered a key manufacturing hub in the American continent. Another catalyst for MXN is Oil prices as Mexico is a key exporter of the commodity.
The main objective of Mexico’s central bank, also known as Banxico, is to maintain inflation at low and stable levels (at or close to its target of 3%, the midpoint in a tolerance band of between 2% and 4%). To this end, the bank sets an appropriate level of interest rates. When inflation is too high, Banxico will attempt to tame it by raising interest rates, making it more expensive for households and businesses to borrow money, thus cooling demand and the overall economy. Higher interest rates are generally positive for the Mexican Peso (MXN) as they lead to higher yields, making the country a more attractive place for investors. On the contrary, lower interest rates tend to weaken MXN.
Macroeconomic data releases are key to assess the state of the economy and can have an impact on the Mexican Peso (MXN) valuation. A strong Mexican economy, based on high economic growth, low unemployment and high confidence is good for MXN. Not only does it attract more foreign investment but it may encourage the Bank of Mexico (Banxico) to increase interest rates, particularly if this strength comes together with elevated inflation. However, if economic data is weak, MXN is likely to depreciate.
As an emerging-market currency, the Mexican Peso (MXN) tends to strive during risk-on periods, or when investors perceive that broader market risks are low and thus are eager to engage with investments that carry a higher risk. Conversely, MXN tends to weaken at times of market turbulence or economic uncertainty as investors tend to sell higher-risk assets and flee to the more-stable safe havens.
-
18:21
Banxico Minutes: Weaker growth and lower inflation keep rate-cut bets alive
- Banxico sees Q4 2024 GDP contraction, with 2024 growth slowing to 1.5%.
- Inflation falls to 3.69%, back within Banxico’s 2-4% target range.
- Most members anticipate further inflation decline, keeping rate-cut path open.
Banco de Mexico, also known as Banxico revealed its monetar policy minutes for the decision announced on February 6. The Central Bank decided to lower borriwng costs by 50 basis points (bps) to 9.50% via a 4 to 1 vote split, with Deputy Governor Jonathan Heath, supporting a 25 bps rate cut.
Key highlights
All members pointed out that the weakness of the Mexican economy intensified in the fourth quarter of 2024.
Most members stated that, according to the flash estimate, GDP contracted with respect to the previous quarter. They highlighted that annual GDP growth would have been 1.5% in 2024 as a whole, in contrast to the growth above 3% in each of the previous two years.
Most members indicated that investment slowed down markedly in 2024.
The majority anticipated that the Mexican economy will continue growing at low rates in 2025.
Some members mentioned that the balance of risks to growth is biased to the downside.
Most members agreed that a possible impact on trade flows between Mexico and the United States would result in a decline in Mexican economic activity.
All members agreed that there has been a significant progress in resolving the inflationary episode derived from the shocks of the pandemic
and the war in Ukraine.Most members pointed out that the behavior of core inflation reflects the progress attained. They commented that the inflationary outlook seems more favorable than in the most critical moments of the inflationary episode.
Most members noted that since the last monetary policy meeting, headline inflation decreased to 3.69% in the first fortnight of January 2025.
Most members highlighted that headline inflation returned to the 2-4% variability range for the first time since then.
Another member added that annual headline inflation has declined 501 basis points since the peak of the current inflationary episode. One member asserted that, nevertheless, it remains above target.
Most members stated that the most recent decline in headline inflation was associated with the significant reduction in noncore inflation.
The majority noted that in its most recent reading core inflation reached 3.72%. They commented that it has been below 4% for four and a half months.
Most members emphasized the importance of the expectations channel in the transmission of monetary policy. They highlighted that these
have remained anchored despite the complexity of the recent inflationary episode. They asserted that this is the result of Banco de México's firm response.Most members mentioned that inflation is expected to continue declining as previously anticipated.
Banxico FAQs
The Bank of Mexico, also known as Banxico, is the country’s central bank. Its mission is to preserve the value of Mexico’s currency, the Mexican Peso (MXN), and to set the monetary policy. To this end, its main objective is to maintain low and stable inflation within target levels – at or close to its target of 3%, the midpoint in a tolerance band of between 2% and 4%.
The main tool of the Banxico to guide monetary policy is by setting interest rates. When inflation is above target, the bank will attempt to tame it by raising rates, making it more expensive for households and businesses to borrow money and thus cooling the economy. Higher interest rates are generally positive for the Mexican Peso (MXN) as they lead to higher yields, making the country a more attractive place for investors. On the contrary, lower interest rates tend to weaken MXN. The rate differential with the USD, or how the Banxico is expected to set interest rates compared with the US Federal Reserve (Fed), is a key factor.
Banxico meets eight times a year, and its monetary policy is greatly influenced by decisions of the US Federal Reserve (Fed). Therefore, the central bank’s decision-making committee usually gathers a week after the Fed. In doing so, Banxico reacts and sometimes anticipates monetary policy measures set by the Federal Reserve. For example, after the Covid-19 pandemic, before the Fed raised rates, Banxico did it first in an attempt to diminish the chances of a substantial depreciation of the Mexican Peso (MXN) and to prevent capital outflows that could destabilize the country.
-
18:16
Fed’s Musalem: Inflation risks are tilted to the upside
On Thursday, St. Louis Fed President Alberto Musalem warned that rising inflation expectations combined with the risk of stubborn stagflation could create a double challenge for the US economy.
Key Takeaways
Assurance inflation is returning to 2% target needed before further policy changes; patient approach appropriate.
His baseline is for inflation to return to 2%, but risks are skewed to the upside.
Inflation expectations have moved higher, would make Fed's job more difficult if sustained.
There are scenarios where progress on inflation stalls or inflation rises alongside a weakening labor market.
-
18:00
United States EIA Crude Oil Stocks Change registered at 4.633M above expectations (3M) in February 14
-
17:33
United States 4-Week Bill Auction dipped from previous 4.25% to 4.245%
-
17:21
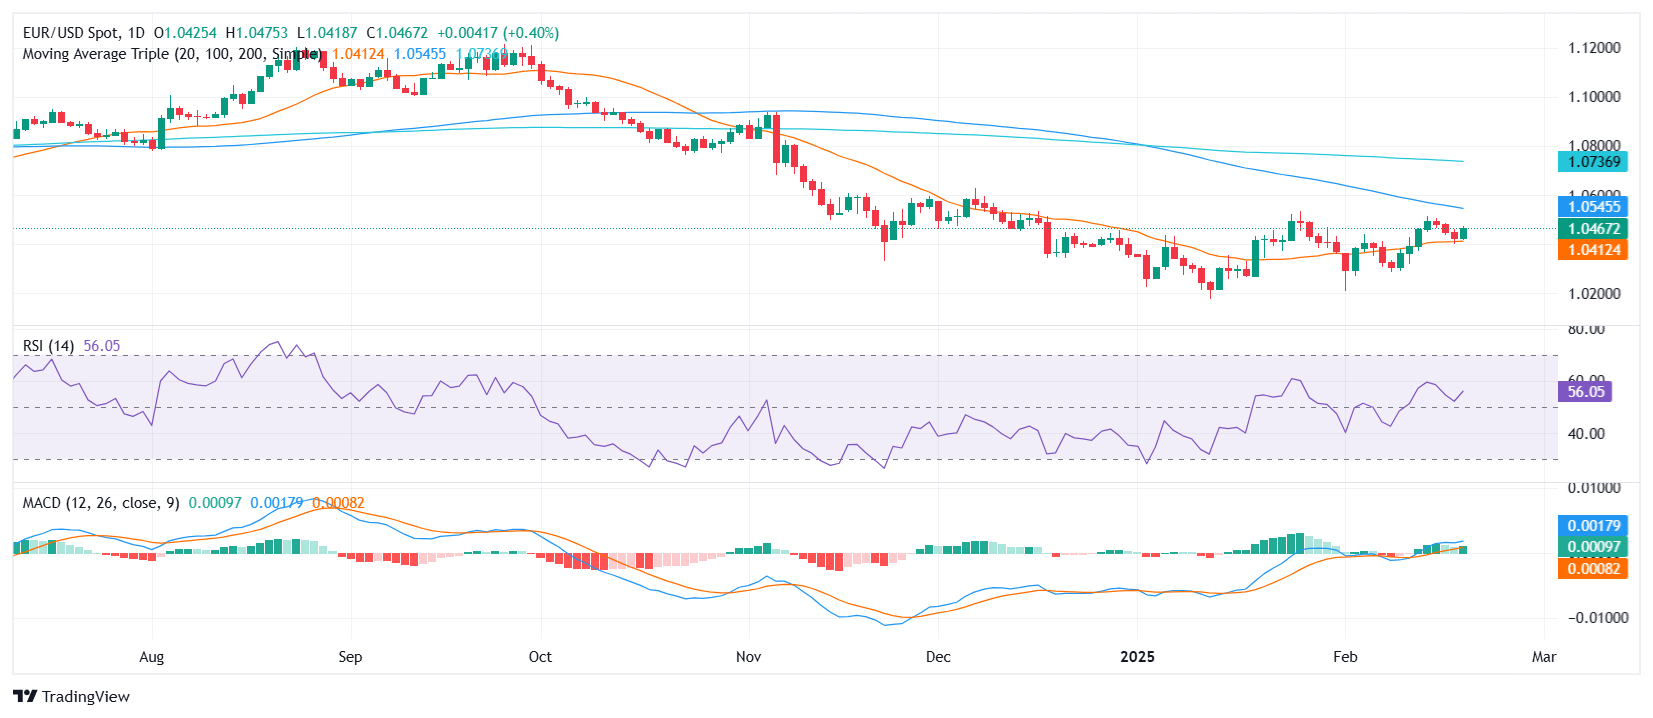
EUR/USD Price Analysis: Bulls reclaim ground after bouncing off key support
- EUR/USD rises to 1.0440 on Thursday, reversing losses after a three-day decline.
- Pair rebounded strongly off the 20-day SMA, gained over 0.40% of its intra-weekdrop.
- Momentum indicators show signs of stabilization, with RSI rising sharply and MACD flattening in positive territory.
After a sharp three-day decline that saw EUR/USD shed more than 0.50% of its value following last week’s rally, bulls regained control on Thursday. The pair climbed to 1.0440, marking a 0.40% gain, as buyers defended the 20-day Simple Moving Average (SMA), which acted as a key technical floor.
Momentum indicators hint at a shift in sentiment. The Relative Strength Index (RSI) has turned higher, now at 57, signaling renewed upside momentum after dipping earlier in the week. Meanwhile, the Moving Average Convergence Divergence (MACD) histogram remains flat but holds in green territory, suggesting that bearish momentum has stalled.
Looking ahead, the pair’s ability to hold above the 20-day SMA will be crucial for sustaining a broader recovery. If buyers maintain control, the next key resistance lies near 1.0500, where stronger selling pressure could emerge. On the downside, a break below 1.0420 would invalidate the latest rebound and expose EUR/USD to further losses toward 1.0380.
EUR/USD daily chart
-
17:16
Fed’s Bostic: The economy so far remains resilient
Raphael Bostic, President of the Atlanta Federal Reserve, still sees room for two rate cuts this year, though much depends on the evolving economic conditions.
Key Quotes
He does not expect a new burst of inflation, though uncertainty is widespread.
Businesses are optimistic about deregulation, but apprehensive about the impact of tariff and immigration changes.
He says his overall expectation is for inflation to continue a bumpy decline to 2%, with shelter inflation likely to ease and expectations anchored.
Businesses say they would try to pass along import taxes to consumers.
The labour market is showing signs of easing, such as difficulty finding a job, but is broadly stable.
Monetary policy is currently in a good place, but this is not a time to be complacent about risks.
He still sees two Fed rate cuts this year, with a lot of uncertainty.
He says much could happen to yield more or fewer rate cuts.
He says inflation data has been bumpy and that is likely to continue.
He still thinks the biggest risk to the Fed's mandate is from inflation; 2% is the target and the US central bank is not there.
The aim is still to get to the 2% target without damage to the labour market.
The possibility of slowing quantitative tightening is not just about the debt ceiling, but also because the Fed does not want to overshoot.
He does not want its balance sheet to become a source of instability.
He will want to review its current framework language about maximum employment to see how it worked in practice.
He says he is still trying to understand implications of the Trump executive order on the Fed's role in financial regulation.
The Fed's current benchmark interest rate is moderately restrictive compared to a 3%-3.5% neutral rate.
A slowdown in the economy because of coming policy shifts is a material concern, but businesses expect 2025 to be a solid year.
-
16:38
GBP/USD rises above 1.2600 on weak US jobs data
- GBP/USD climbs as soft US jobless claims data weakens the Greenback.
- UK inflation above 3% reduces the odds of aggressive BoE rate cuts.
- Traders eye Fed speakers and potential US-China trade deal signals.
The Pound Sterling (GBP) climbs against the US Dollar (USD) and crosses the 1.2600 figure on Thursday, with traders awaiting the release of United Kingdom (UK) Retail Sales data. Meanwhile, a soft United States (US) jobs report weakened the US Dollar. The GBP/USD pair trades at 1.2616, up 0.25%.
Sterling gains 0.25% ahead of UK Retail Sales release
The Cable failed to rally on Wednesday as inflation rose above 3% in January, weakening the case for further interest rate cuts by the Bank of England (BoE). Meanwhile, US President Donald Trump's tariffs rhetoric continues.
Developments in the Russia–Ukraine conflict continued to grab the headlines as Trump called Ukrainian President Volodymyr Zelenskiy a dictator, who questioned discussions of a ceasefire held between Russia and the US in Saudi Arabia.
Market participants cheered the chance of a new trade deal between the US and China. Trump said, “It’s possible,” adding that Chinese President Xi Jinping to visit the US but failed to provide a date.
Data-wise, the US economic docket featured the release of US Initial Jobless Claims for the week ending February 15, which came at 219K, up from 214K, exceeding forecasts of 215.
Ahead in the day, GBP/USD traders would eye Fed speakers. Chicago’s Fed Austan Goolsbee, St. Louis Fed Alberto Musalem, and Governors Michael Barr and Adriana Kugler will cross the wires.
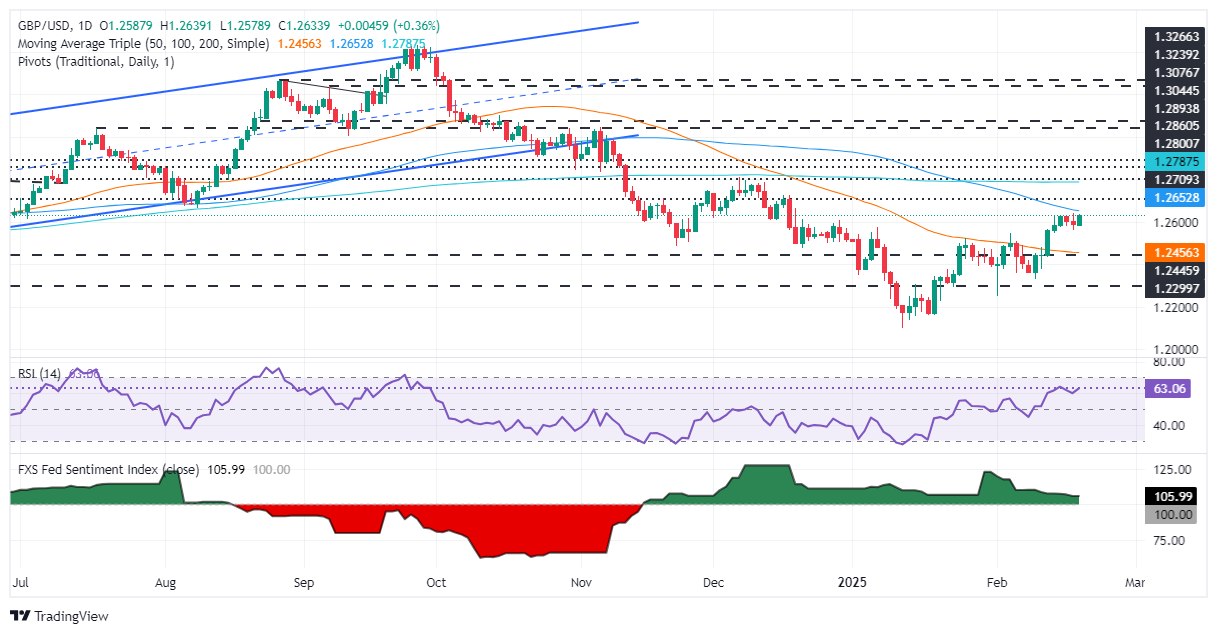
GBP/USD Price Forecast: Technical outlook
GBP/USD is neutral to slightly upward biased after registering a successive series of higher highs and higher lows, alongside strong bullish momentum, as depicted by the Relative Strength Index (RSI). However, if buyers want to regain control they must clear the 100-day Simple Moving Average (SMA) at 1.2664, followed by the 200-day SMA at 1.2787.
On the other hand, if sellers drag the exchange rate below 1.2600, the trend could turn downwards if they surpass 1.2500, followed by the 50-day SMA at 1.2461.
Pound Sterling FAQs
The Pound Sterling (GBP) is the oldest currency in the world (886 AD) and the official currency of the United Kingdom. It is the fourth most traded unit for foreign exchange (FX) in the world, accounting for 12% of all transactions, averaging $630 billion a day, according to 2022 data. Its key trading pairs are GBP/USD, also known as ‘Cable’, which accounts for 11% of FX, GBP/JPY, or the ‘Dragon’ as it is known by traders (3%), and EUR/GBP (2%). The Pound Sterling is issued by the Bank of England (BoE).
The single most important factor influencing the value of the Pound Sterling is monetary policy decided by the Bank of England. The BoE bases its decisions on whether it has achieved its primary goal of “price stability” – a steady inflation rate of around 2%. Its primary tool for achieving this is the adjustment of interest rates. When inflation is too high, the BoE will try to rein it in by raising interest rates, making it more expensive for people and businesses to access credit. This is generally positive for GBP, as higher interest rates make the UK a more attractive place for global investors to park their money. When inflation falls too low it is a sign economic growth is slowing. In this scenario, the BoE will consider lowering interest rates to cheapen credit so businesses will borrow more to invest in growth-generating projects.
Data releases gauge the health of the economy and can impact the value of the Pound Sterling. Indicators such as GDP, Manufacturing and Services PMIs, and employment can all influence the direction of the GBP. A strong economy is good for Sterling. Not only does it attract more foreign investment but it may encourage the BoE to put up interest rates, which will directly strengthen GBP. Otherwise, if economic data is weak, the Pound Sterling is likely to fall.
Another significant data release for the Pound Sterling is the Trade Balance. This indicator measures the difference between what a country earns from its exports and what it spends on imports over a given period. If a country produces highly sought-after exports, its currency will benefit purely from the extra demand created from foreign buyers seeking to purchase these goods. Therefore, a positive net Trade Balance strengthens a currency and vice versa for a negative balance.
-
16:30
United States EIA Natural Gas Storage Change below forecasts (-188B) in February 14: Actual (-196B)
-
16:04
Eurozone Consumer Confidence above expectations (-14) in February: Actual (-13.6)
-
15:38
USD/CAD declines to near 1.4200 as US Dollar underperforms its peers
- USD/CAD drops sharply to near 1.4200 as the US Dollar underperforms its major peers.
- Slightly higher US Initial Jobless Claims have weighed on the US Dollar.
- Fed officials are worried about growing upside risks to inflation.
The USD/CAD pair falls sharply to near the key level of 1.4200 in North American trading hours on Thursday. The Loonie pair weakens as the US Dollar (USD) underperforms its major peers, with the US Dollar Index (DXY) declining to near 106.70.
US Dollar PRICE Today
The table below shows the percentage change of US Dollar (USD) against listed major currencies today. US Dollar was the strongest against the Canadian Dollar.
USD EUR GBP JPY CAD AUD NZD CHF USD -0.32% -0.25% -1.00% -0.24% -0.62% -0.76% -0.28% EUR 0.32% 0.06% -0.69% 0.08% -0.31% -0.44% 0.02% GBP 0.25% -0.06% -0.74% 0.02% -0.37% -0.51% -0.01% JPY 1.00% 0.69% 0.74% 0.77% 0.38% 0.20% 0.72% CAD 0.24% -0.08% -0.02% -0.77% -0.38% -0.52% -0.03% AUD 0.62% 0.31% 0.37% -0.38% 0.38% -0.14% 0.37% NZD 0.76% 0.44% 0.51% -0.20% 0.52% 0.14% 0.50% CHF 0.28% -0.02% 0.01% -0.72% 0.03% -0.37% -0.50% The heat map shows percentage changes of major currencies against each other. The base currency is picked from the left column, while the quote currency is picked from the top row. For example, if you pick the US Dollar from the left column and move along the horizontal line to the Japanese Yen, the percentage change displayed in the box will represent USD (base)/JPY (quote).
The Greenback faces selling pressure after the release of the slightly higher-than-expected United States (US) Initial Jobless Claims data for the week ending February 14. Department of Labor reported that individuals claiming jobless benefits for the first time were 219K, higher than estimates of 215K.
The US Dollar was already underperforming even though US President Donald Trump announced on Wednesday that tariffs on automobiles, semiconductors, and pharmaceuticals could be imposed over the next month or sooner. Market participants expect Trump’s tariff agenda could lead to a global trade war. Such a scenario will result in a global slowdown.
Meanwhile, hawkish Federal Open Market Committee (FOMC) minutes for the January meeting also failed to support the US Dollar. The FOMC minutes showed on Wednesday that officials were more worried about deepening upside risks to inflation due to Trump’s policies than risks to the labor market.
In the policy meeting, the Fed kept interest rates steady in the range of 4.25%-4.50% and guided a cautious stance on interest rate cuts.
In the neighboring nation, investors await the Canadian Retail Sales data for December, which will be released on Friday. Month-on-month Retail Sales, a key measure of consumer spending, are estimated to have expanded by 1.6% after remaining flat in December
US Dollar FAQs
The US Dollar (USD) is the official currency of the United States of America, and the ‘de facto’ currency of a significant number of other countries where it is found in circulation alongside local notes. It is the most heavily traded currency in the world, accounting for over 88% of all global foreign exchange turnover, or an average of $6.6 trillion in transactions per day, according to data from 2022. Following the second world war, the USD took over from the British Pound as the world’s reserve currency. For most of its history, the US Dollar was backed by Gold, until the Bretton Woods Agreement in 1971 when the Gold Standard went away.
The most important single factor impacting on the value of the US Dollar is monetary policy, which is shaped by the Federal Reserve (Fed). The Fed has two mandates: to achieve price stability (control inflation) and foster full employment. Its primary tool to achieve these two goals is by adjusting interest rates. When prices are rising too quickly and inflation is above the Fed’s 2% target, the Fed will raise rates, which helps the USD value. When inflation falls below 2% or the Unemployment Rate is too high, the Fed may lower interest rates, which weighs on the Greenback.
In extreme situations, the Federal Reserve can also print more Dollars and enact quantitative easing (QE). QE is the process by which the Fed substantially increases the flow of credit in a stuck financial system. It is a non-standard policy measure used when credit has dried up because banks will not lend to each other (out of the fear of counterparty default). It is a last resort when simply lowering interest rates is unlikely to achieve the necessary result. It was the Fed’s weapon of choice to combat the credit crunch that occurred during the Great Financial Crisis in 2008. It involves the Fed printing more Dollars and using them to buy US government bonds predominantly from financial institutions. QE usually leads to a weaker US Dollar.
Quantitative tightening (QT) is the reverse process whereby the Federal Reserve stops buying bonds from financial institutions and does not reinvest the principal from the bonds it holds maturing in new purchases. It is usually positive for the US Dollar.
-
15:06
EUR/USD can move to parity around the middle of the year – Rabobank
President Trump has shifted the axis of US foreign policy since his return to power just one month ago. Any remaining ambiguity on this issue for Europeans was stripped away by US Defence Secretary Hegseth last week with his remarks that Washington would 'no longer tolerate an imbalanced relationship' and that 'safeguarding European security must be an imperative for European members of Nato', Rabobank's FX analyst Jane Foley notes.
Fresh headwinds to growth can weigh on the outlook for the EUR
"To drive this point home, Hegseth made clear the US’ expectation that 'Europe must provide the overwhelming share of future lethal and non-lethal aid to Ukraine.' Since then European politicians have been scrambling to respond. Extra spending on defence will be expensive. Fresh headwinds to growth and weakened budgets could weigh on the outlook for the EUR."
"That said, as pointed out by former ECB President Draghi in his essay in the FT last week, many of the existing headwinds facing the Eurozone economy are of its own making. Crucially, Draghi argues that Europe also has the ability to lead itself out of its current predicament if it is prepared to undergo radical change. How European politicians respond to the challenges they currently face could be key in determining the long-term coherence of the Eurozone project and the EUR."
"For now we would argue that with Europe currently unable to match the US in terms of growth and with its leadership position on the world stage undermined by its weak position on defence, that the EUR will struggle to launch a sustained and significant recovery vs the USD near-term. We continue to see risk of a move to EUR/USD parity around the middle of the year."
-
14:40
AUD/USD jumps to near 0.6380 on better-than-expected Aussie employment
- AUD/USD advances to near 0.6380 as upbeat Aussie employment data is likely to force traders to pare RBA dovish bets.
- On Tuesday, the RBA cut its OCR by 25 bps to 4.10%, the first interest rate cut in more than four years.
- Higher US Initial Jobless Claims have weighed further on the US Dollar.
The AUD/USD pair posts a fresh two-month high near 0.6380 in Thursday’s European session. The Aussie pair is 0.6% higher as the Australian Dollar (AUD) performs strongly across the board, except the Japanese Yen (JPY), after the release of the better-than-projected Australian labor market data for January.
The Australian Bureau of Statistics reported that the economy added 44K workers, more than double than expectations of 20K but lower than 60K addition seen in December. The Unemployment Rate accelerated to 4.1%, as expected, from 4% in the previous month.
Upbeat Aussie employment data adds to expectations that the Reserve Bank of Australia (RBA) will remain cautious on further policy-easing. On Tuesday, the RBA announced its first-ever interest rate cut decision since November 2020 but cleared that the battle against inflation is not over yet. The RBA guided a cautious stance on interest rate cuts after reducing its Official Cash Rate (OCR) by 25 basis points (bps) to 4.10%.
Meanwhile, a sharp weakness in the US Dollar has also strengthened the Aussie pair. The US Dollar Index (DXY), which tracks the Greenback’s value against six major currencies, slumps to near 106.75.
Earlier in the day, the Greenback was already underperforming, slightly higher-than-expected United States (US) Initial Jobless Claims data for the week ending February 14 has weighed further. The Department of Labor reported that individuals claiming jobless benefits for the first time were 219K, higher than estimates of 215K.
Australian Dollar FAQs
One of the most significant factors for the Australian Dollar (AUD) is the level of interest rates set by the Reserve Bank of Australia (RBA). Because Australia is a resource-rich country another key driver is the price of its biggest export, Iron Ore. The health of the Chinese economy, its largest trading partner, is a factor, as well as inflation in Australia, its growth rate and Trade Balance. Market sentiment – whether investors are taking on more risky assets (risk-on) or seeking safe-havens (risk-off) – is also a factor, with risk-on positive for AUD.
The Reserve Bank of Australia (RBA) influences the Australian Dollar (AUD) by setting the level of interest rates that Australian banks can lend to each other. This influences the level of interest rates in the economy as a whole. The main goal of the RBA is to maintain a stable inflation rate of 2-3% by adjusting interest rates up or down. Relatively high interest rates compared to other major central banks support the AUD, and the opposite for relatively low. The RBA can also use quantitative easing and tightening to influence credit conditions, with the former AUD-negative and the latter AUD-positive.
China is Australia’s largest trading partner so the health of the Chinese economy is a major influence on the value of the Australian Dollar (AUD). When the Chinese economy is doing well it purchases more raw materials, goods and services from Australia, lifting demand for the AUD, and pushing up its value. The opposite is the case when the Chinese economy is not growing as fast as expected. Positive or negative surprises in Chinese growth data, therefore, often have a direct impact on the Australian Dollar and its pairs.
Iron Ore is Australia’s largest export, accounting for $118 billion a year according to data from 2021, with China as its primary destination. The price of Iron Ore, therefore, can be a driver of the Australian Dollar. Generally, if the price of Iron Ore rises, AUD also goes up, as aggregate demand for the currency increases. The opposite is the case if the price of Iron Ore falls. Higher Iron Ore prices also tend to result in a greater likelihood of a positive Trade Balance for Australia, which is also positive of the AUD.
The Trade Balance, which is the difference between what a country earns from its exports versus what it pays for its imports, is another factor that can influence the value of the Australian Dollar. If Australia produces highly sought after exports, then its currency will gain in value purely from the surplus demand created from foreign buyers seeking to purchase its exports versus what it spends to purchase imports. Therefore, a positive net Trade Balance strengthens the AUD, with the opposite effect if the Trade Balance is negative.
-
14:39
US: Initial Jobless Claims rose to 219K last week
- Initial Jobless Claims rose above consensus to 219K.
- Continuing Jobless Claims increased to 1.869M in the week ending February 8.
US citizens filing new applications for unemployment insurance rose to 219K for the week ending February 15, as reported by the US Department of Labor (DoL) on Thursday. This print missed initial estimates and was higher than the previous week's revised tally of 214K (from 213K).
The report also highlighted a seasonally adjusted insured unemployment rate of 1.2%, while the four-week moving average dropped by 1K to 215.25K from the prior week’s revised average.
Moreover, Continuing Jobless Claims went up by 24K to reach 1.869M for the week ending February 8.
Market reaction
The Greenback maintains its bearish attitude around 106.80 when tracked by the US Dollar Index (DXY), receding to the area of daily lows.
-
14:31
Canada Employment Insurance Beneficiaries Change (MoM) up to -0.4% in December from previous -0.9%
-
14:31
Canada New Housing Price Index (YoY) remains unchanged at 0.1% in January
-
14:30
United States Philadelphia Fed Manufacturing Survey below expectations (20) in February: Actual (18.1)
-
14:30
United States Continuing Jobless Claims registered at 1.869M, below expectations (1.87M) in February 7
-
14:30
United States Initial Jobless Claims above forecasts (215K) in February 14: Actual (219K)
-
14:30
United States Initial Jobless Claims 4-week average declined to 215.25K in February 14 from previous 216K
-
14:30
Canada Industrial Product Price (MoM) registered at 1.6% above expectations (0.8%) in January
-
14:30
Canada New Housing Price Index (MoM) below expectations (0.1%) in January: Actual (-0.1%)
-
14:30
Canada Raw Material Price Index registered at 3.7% above expectations (2.4%) in January
-
14:28
JPY leads gains in majors – Scotiabank
The Japanese Yen (JPY) is leading the currency run higher on the US Dollar (USD), Scotiabank's Chief FX Strategist Shaun Osborne notes.
Markets position for higher inflation data
"The JPY is leading the currency run higher on the USD, with traders taking on board hawkish comments from BoJ policymaker Takata earlier this week and positioning for another jump in Japan’s rate of inflation which will support the outlook for moderately tighter policy."
"Japan releases CPI data this evening. January inflation is expected to push up to 4.0% Y/Y."
-
14:25
GBP/USD regains 1.26 handle – Scotiabank
Sterling is a little firmer on the session, regaining the low 1.26 zone where recent gains have stalled. The CBI Trends survey reflected slightly better—but still weak—Total Orders (-28) and a dip in Selling Prices (19, from 27), Scotiabank's Chief FX Strategist Shaun Osborne notes.
GBP may struggle to extend
"Other survey data indicate weakening consumer confidence. Despite these challenges, markets have pared BoE rate expectations since the central bank’s policy decision and cautious messaging on the outlook earlier this month. Swaps anticipate 50bps of additional cuts this year."
"Despite a weak (bearish) technical close for Cable yesterday (outside range reversal), the GBP has rebounded moderately so far today to regain 1.26. The low 1.26 zone has been a cap on the GBP’s recent rise, however, and likely remains so (1.2610 is the 38.2% Fibonacci retracement of the September/January drop in Cable). Support is 1.2555/65."
-
14:22
EUR recovers to low/mid 1.04s – Scotiabank
The Euro (EUR) has managed a fairly solid-looking short-term rebound from yesterday’s low near 1.04 on little news other than the broader mood-shift on the USD, Scotiabank's Chief FX Strategist Shaun Osborne notes.
ECB policymakers continue to debate the outlook for rates
"Spot gains are lagging most of the major currencies, however. ECB policymakers continue to debate the outlook for rates; Governor Schnabel commented yesterday that there should be a debate about a halt to rate cuts amid the uncertain inflation outlook. "
"But the rate doves appear to be in the majority and markets are more or less fully priced for a 25bps cut in early March. Solid, local equity returns vs US markets should provide a moderate backstop for the EUR amid current uncertainties."
"The EUR is trading a little higher after rebounding from the 1.04 area yesterday. The rebound in spot from yesterday’s low looks technically positive on the short-term chart but price action looks more like a consolidation than a major reversal at this point. Support is 1.0400 and 1.0375/80. Resistance is 1.0470."
-
14:19
CAD lags peers and holds range – Scotiabank
The Canadian Dollar (USD) is a little firmer on the session but it is lagging its commodity peers (AUD, NZD) and the spot market is still essentially range trading and awaiting developments, Scotiabank's Chief FX Strategist Shaun Osborne notes.
CAD is trading marginally higher
"News reports indicate that the Canadian government is asking Canadian financial institutions to help in combating the fentanyl trade as it bolsters efforts to address the trafficking issue and satisfy White House demands to tighten up the border."
"Spot is drifting a little lower but the drop in the USD is hardly decisive or significant from a short-term technical point of view. The USD is maintaining the mild upward bias established after last Friday’s low but momentum is weak and the intraday range is holding within yesterday’s range at this point."
"That may tilt risks towards a renewed dip, if sustained through the close, however. Support is 1.4180/90. Resistance is 1.4250/55."
-
14:15
DXY: Markets anticipate hot inflation – Scotiabank
The general US Dollar (USD) rebound that has developed over the course of this week is showing signs of stumbling, Scotiabank's Chief FX Strategist Shaun Osborne notes.
USD drifts lower as tariff volatility eases
"There is not an evident theme behind the USD dip. However, tariff volatility in the markets generally is subsiding and there are perhaps signs that the 'US exceptionalism' mood that developed around the president’s election win is fading somewhat. US stocks are up 4-5% in YTD terms but European markets—which are clearly facing some growth challenges—are up significantly more (Dax +13%, CAC +10.6% YTD)."
"DXY losses below 107 overnight tip near-term technical risks towards a bit more softness at least and perhaps a retest of last Friday’s low around 106.5. Yesterday’s FOMC minutes reflected the cautious tone of recent comments from top policymakers. The minutes noted that officials wanted more progress on inflation before adjusting rates while uncertainty warranted caution. They also noted trade and immigration policy might hinder disinflation. Swaps suggest the Fed will remain on hold until September when the first full 1/4 point cut is priced into contracts."
"US weekly claims data drop at 8.30ET along with the Philly Fed survey. US Leading Indicators are out at 10ET. The Fed’s Goolsbee, Musalem, Barr and Kugler (all voters this year) are speaking over the course of the day. RBA Governor Bullock delivers her parliamentary testimony at 17.30 ET. Remarks are likely to reflect her cautious comments on the policy outlook that followed the central bank’s first rate cut in four years this week."
-
14:00
Russia Central Bank Reserves $: $628.5B vs $626.9B
-
13:26
US Dollar dips after President Trump says trade deal with China is possible
- The US Dollar edges lower against major currencies on a calm Thursday.
- US President Donald Trump lashed out at Ukraine and hinted at a possible trade deal with China.
- The US Dollar Index (DXY) reverses course and dips below 107.00 after a firm upside rejection on Wednesday.
The US Dollar Index (DXY), which tracks the performance of the US Dollar (USD) against six major currencies, slips lower on Thursday and trades below 107.00 at the time of writing. The move comes after United States (US) President Donald Trump mentioned that a trade deal with China might come. This is a big sigh of relief in markets on the tariff and trade front, as it would mean that some easing could come before April when levies are due to kick in.
The US economic calendar is quite calm this Thursday, except for the weekly Initial Jobless Claims, the Philadelphia Fed Manufacturing Survey for February and some speeches by Fed policymakers. However, as it happened in the earlier part of this week, US data is likely to be overshadowed by Trump’s comments.
Daily digest market movers: Does it matter?
- At 13:30 GMT, the weekly US Jobless Claims are due, with Initial Claims for the week ending February 14 expected to tick up to 215,000 from 213,000. Continuing Claims for the week ending February 7 are expected to head higher as well to 1.87 million, from the previous 1.85 million.
- At the same time, the Philadelphia Fed Manufacturing Survey for February is expected to decline to 20 from 44.3 in January.
- Quite an army of Fed speakers are scheduled for this Thursday:
- At 14:35 GMT, Chicago Fed President Austan Goolsbee speaks in a moderated Q&A at an event hosted by the Chicagoland Chamber of Commerce.
- At 17:05 GMT, St. Louis Fed President Alberto Musalem speaks to the Economic Club of New York about the US economy and monetary policy
- At 19:30 GMT, Fed Vice Chair for Supervision Michael Barr talks about supervision and regulation at an event at Georgetown University Law Center.
- Around 22:00 GMT, Federal Reserve Governor Adriana Kugler gives a speech on "Navigating inflation waves while riding on the Phillips curve" at a lecture hosted by Georgetown University.
- Equities are down across the globe, except for the European ones, with the German Dax and the pan-European Stoxx 50 in the green.
- The CME FedWatch tool shows a 51.2% chance that interest rates will remain unchanged at current levels in June.
- The US 10-year yield trades around 4.52%, slipping lower from its Wednesday’s high of 4.574%.
US Dollar Index Technical Analysis: Greenback just does not care
The US Dollar Index (DXY) is back to square one and gives up all its Wednesday’s gains. The firm technical rejection at 107.35 was enough to push the DXY back to where it was earlier this week. If US President Trump comes out with more easing or softening comments on tariffs or other deals, a revisit to 106.60 could be in the cards.
On the upside, the previous support at 107.35 has now turned into a firm resistance. Further up, the 55-day SMA at 107.96 must be regained before reclaiming 108.00.
On the downside, look for 106.56 (100-day SMA), 106.52 (April 16, 2024, high), or even 105.89 (resistance in June 2024) as support levels. The Relative Strength Index (RSI) momentum indicator in the daily chart shows room for more downside. Therefore, the 200-day SMA at 104.97 could be a possible outcome if a firm catalyst emerges.
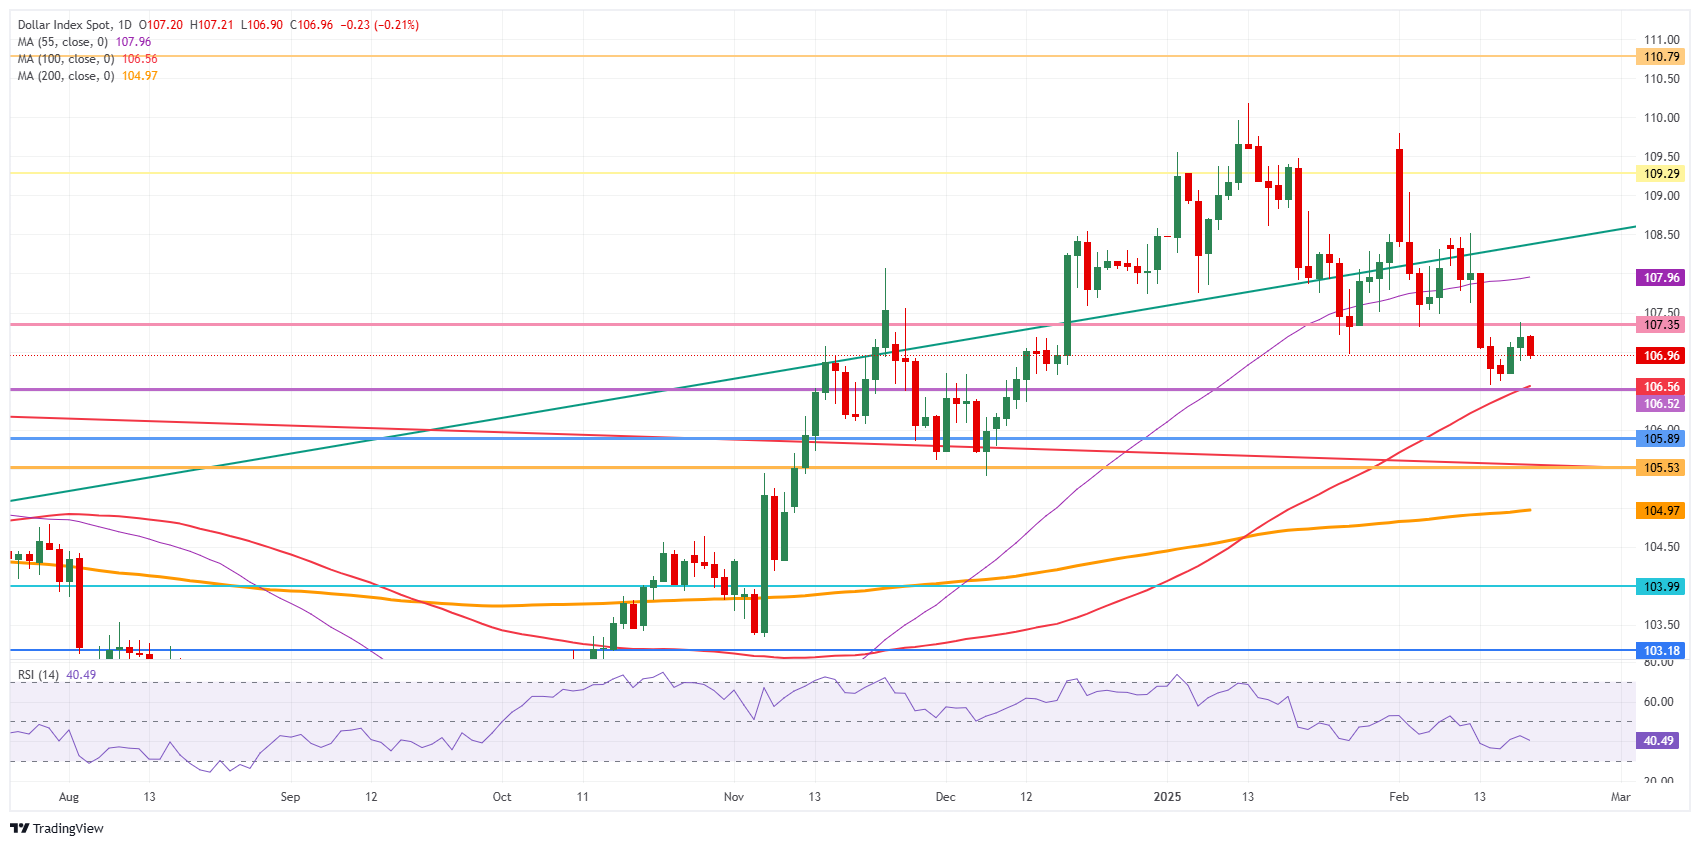
US Dollar Index: Daily Chart
US Dollar FAQs
The US Dollar (USD) is the official currency of the United States of America, and the ‘de facto’ currency of a significant number of other countries where it is found in circulation alongside local notes. It is the most heavily traded currency in the world, accounting for over 88% of all global foreign exchange turnover, or an average of $6.6 trillion in transactions per day, according to data from 2022. Following the second world war, the USD took over from the British Pound as the world’s reserve currency. For most of its history, the US Dollar was backed by Gold, until the Bretton Woods Agreement in 1971 when the Gold Standard went away.
The most important single factor impacting on the value of the US Dollar is monetary policy, which is shaped by the Federal Reserve (Fed). The Fed has two mandates: to achieve price stability (control inflation) and foster full employment. Its primary tool to achieve these two goals is by adjusting interest rates. When prices are rising too quickly and inflation is above the Fed’s 2% target, the Fed will raise rates, which helps the USD value. When inflation falls below 2% or the Unemployment Rate is too high, the Fed may lower interest rates, which weighs on the Greenback.
In extreme situations, the Federal Reserve can also print more Dollars and enact quantitative easing (QE). QE is the process by which the Fed substantially increases the flow of credit in a stuck financial system. It is a non-standard policy measure used when credit has dried up because banks will not lend to each other (out of the fear of counterparty default). It is a last resort when simply lowering interest rates is unlikely to achieve the necessary result. It was the Fed’s weapon of choice to combat the credit crunch that occurred during the Great Financial Crisis in 2008. It involves the Fed printing more Dollars and using them to buy US government bonds predominantly from financial institutions. QE usually leads to a weaker US Dollar.
Quantitative tightening (QT) is the reverse process whereby the Federal Reserve stops buying bonds from financial institutions and does not reinvest the principal from the bonds it holds maturing in new purchases. It is usually positive for the US Dollar.
-
13:00
Mexico Retail Sales (MoM) came in at 0.1%, above forecasts (-0.4%) in December
-
13:00
Mexico Retail Sales (YoY) above expectations (-1.7%) in December: Actual (-0.2%)
-
12:40
Silver Price Forecast: XAG/USD rallies to near $33.20 amid geopolitical and trade worries
- Silver price strengthens and jumps to near $33.20 amid multiple tailwinds.
- US President Trump’s tariff agenda could lead to a global economic slowdown.
- The Fed is expected to maintain a restrictive interest rate stance for longer.
Silver price (XAG/USD) surges almost 1.5% to near $33.20 in European trading hours on Thursday. The white metal strengthens as investors remain concerned over deepening global trade tensions. United States (US) President Donald Trump announced on Wednesday that he is planning to impose tariffs on lumber, cars, semiconductors, and pharmaceuticals over the next month or sooner.
Market participants expect President Trump's tariffs would lead to a global trade war, which would result in an economic slowdown across the globe.
Meanwhile, Donald Trump has also ordered his team to prepare reciprocal tariffs, which are expected to be unveiled in April.
On the geopolitical front, Ukraine President Volodymyr Zelenskyy feeling left out of Russia-US peace talks to end the war in Ukraine has raised some uncertainty. Ukrainian leader has condemned US Trump for initiating peace talks with Russia without his involvement in discussing the issue in Saudi Arabia.
Signs of a slowdown in the Russia-Ukraine peace talks would boost demand for safe-haven assets, such as Silver.
Meanwhile, the safe-haven demand of the US Dollar has remained weak even though traders becoming increasingly confident that the Federal Reserve (Fed) will keep interest rates in the current range of 4.25%-4.50% for longer. The US Dollar Index (DXY), which tracks the Greenback’s value against six major currencies, declines to near 106.90.
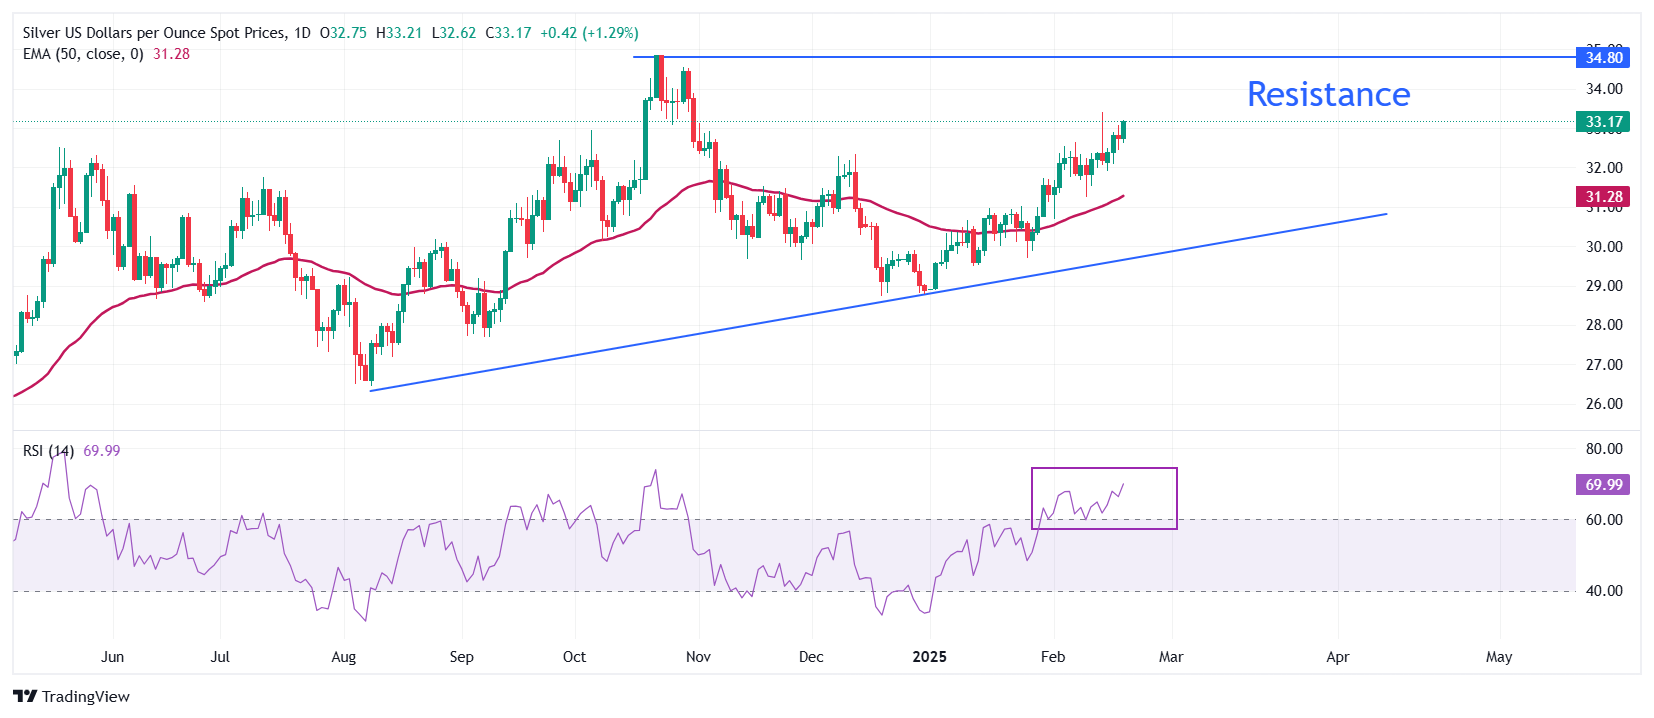
Silver technical analysis
Silver price is inch far from revisiting an over three-month high of $33.40, which it posted on February 14. The outlook of the white metal is bullish as the 50-day Exponential Moving Average (EMA) has been sloping higher, which trades around $31.28.
The 14-day Relative Strength Index (RSI) oscillates in the 60.00-80.00 range, suggesting that the momentum is strongly bullish.
Looking down, the upward-sloping trendline from the August 8 low of $26.45 will act as key support for the Silver price around $30.00. While, the October 22 high of $34.87 will be the key barrier.
Silver daily chart
Silver FAQs
Silver is a precious metal highly traded among investors. It has been historically used as a store of value and a medium of exchange. Although less popular than Gold, traders may turn to Silver to diversify their investment portfolio, for its intrinsic value or as a potential hedge during high-inflation periods. Investors can buy physical Silver, in coins or in bars, or trade it through vehicles such as Exchange Traded Funds, which track its price on international markets.
Silver prices can move due to a wide range of factors. Geopolitical instability or fears of a deep recession can make Silver price escalate due to its safe-haven status, although to a lesser extent than Gold's. As a yieldless asset, Silver tends to rise with lower interest rates. Its moves also depend on how the US Dollar (USD) behaves as the asset is priced in dollars (XAG/USD). A strong Dollar tends to keep the price of Silver at bay, whereas a weaker Dollar is likely to propel prices up. Other factors such as investment demand, mining supply – Silver is much more abundant than Gold – and recycling rates can also affect prices.
Silver is widely used in industry, particularly in sectors such as electronics or solar energy, as it has one of the highest electric conductivity of all metals – more than Copper and Gold. A surge in demand can increase prices, while a decline tends to lower them. Dynamics in the US, Chinese and Indian economies can also contribute to price swings: for the US and particularly China, their big industrial sectors use Silver in various processes; in India, consumers’ demand for the precious metal for jewellery also plays a key role in setting prices.
Silver prices tend to follow Gold's moves. When Gold prices rise, Silver typically follows suit, as their status as safe-haven assets is similar. The Gold/Silver ratio, which shows the number of ounces of Silver needed to equal the value of one ounce of Gold, may help to determine the relative valuation between both metals. Some investors may consider a high ratio as an indicator that Silver is undervalued, or Gold is overvalued. On the contrary, a low ratio might suggest that Gold is undervalued relative to Silver.
-
12:32
USD/CNH: Above 7.2960, USD can stop declining – UOB Group
The US Dollar (USD) is expected to trade between 7.2700 and 7.2900 against the Chinese Yuan (CNH). In the longer run, a breach of 7.2960 would indicate that the USD/CHN is not declining further, UOB Group’s FX analysts Quek Ser Leang and Peter Chia note.
USD can decline towards the major support level at 7.2300
24-HOUR VIEW: "Our view for USD to “trade between 7.2620 and 7.2850” yesterday was incorrect, as it traded in a 7.2735/7.2930 range. The price action provides no fresh clues. Today, we expect USD to trade between 7.2700 and 7.2900."
1-3 WEEKS VIEW: "Our most recent narrative was from Monday (17 Feb, spot at 7.2600), wherein 'the increase in downward momentum suggests USD could decline the major support level at 7.2300.' After rebounding from 7.2428, USD has not been able to make further headway on the downside. From here, a breach of 7.2960 (no change in ‘strong resistance’ level), we indicate that USD is not declining further."
-
12:30
India M3 Money Supply up to 9.8% in February 3 from previous 9.6%
-
12:24
Aluminium rises after EU agrees to ban on Russian imports – ING
LME aluminium prices rose above $2,700/t briefly yesterday, for the first time in a month. This followed reports the EU agreed on a sixteenth package of sanctions against Russia, including a ban on primary aluminium imports. Prices later gave up the gains, ING’s commodity analysts Warren Patterson and Ewa Manthey notes.
More Russian metal has been shipped to China
"The package is expected to be adopted by EU foreign ministers on Monday to mark the third anniversary of Russia’s invasion of Ukraine. This comes as the US conducts talks with Russia on a peace deal to end the war in Ukraine. The US has signalled that sanctions relief could be part of an agreement."
"Any impact is likely to be limited. Although the EU continues to import Russian aluminium, volumes have fallen, with European buyers self-sanctioning. The gap left by Russian supplies has mostly been filled by imports from the Middle East, India, and Southeast Asia, and this trend is likely to continue. Meanwhile, more Russian metal has been shipped to China, the world's biggest aluminium consumer."
"The US and the UK banned the import of metals produced in Russia in 2024. The EU has so far banned aluminium products, including wire, tube, pipe and foil, which account for less than 15% of EU imports. Russia is the world’s largest aluminium producer outside China, accounting for about 5% of global aluminium production."
-
12:03
Ireland HICP (YoY) registered at 1.7% above expectations (1.5%) in January
-
12:02
Ireland HICP (YoY) above forecasts (1.5%) in January: Actual (1.7%)
-
12:02
Ireland HICP (MoM) above expectations (-0.9%) in January: Actual (-0.7%)
-
12:02
Ireland Consumer Price Index (YoY) climbed from previous 1.4% to 1.9% in January
-
11:35
NZD/USD: Upward momentum has slowed – UOB Group
Outlook is mixed; New Zealand Dollar (NZD) is likely to trade in a 0.5675/0.5725 range vs US Dollar (USD). In the longer run, upward momentum has slowed; a breach of 0.5675 would indicate that 0.5790 is not coming into view, UOB Group’s FX analysts Quek Ser Leang and Peter Chia note.
Breach of 0.5675 to indicate that 0.5790 is not coming into view
24-HOUR VIEW: "We expected NZD to “trade sideways between 0.5690 and 0.5730” yesterday. Our view was incorrect as it fluctuated between 0.5678 and 0.5730, closing little changed (0.5705, +0.02%). The outlook is mixed after the choppy price movements. Today, we expect NZD to trade in a 0.5675/0.5725 range."
1-3 WEEKS VIEW: "We turned positive in NZD on Monday (17 Feb, spot at 0.5730), indicating that “the price action suggests further NZD strength, potentially to 0.5790.” NZD then rose to 0.5750 but has not been able to build on its gains. Upward momentum has slowed, and a breach of 0.5675 (no change in ‘strong support’ level) would indicate 0.5790 is not coming into view. Note that NZD dropped briefly to 0.5678 yesterday."
-
11:29
EU sanctions Russian vessels – ING
Supply uncertainty continues to support the oil market, which faces multiple risks, including disruptions to Kazakh flows, the potential for a delay in the return of OPEC+ barrels, weather events in the US, and ever-present sanctions risks hanging over the market. The concerns pushed ICE Brent back above US$76/bbl yesterday, ING’s commodity analysts Warren Patterson and Ewa Manthey notes.
Buyers might be less willing to accept sanctioned Russian vessels
"This week, the market is dealing with supply disruptions in North Dakota due to extremely cold weather. The North Dakota Pipeline Authority said that oil production is down between 120-150k b/d, while natural gas production has also taken a hit. These disruptions will likely last until the weekend when warmer weather is forecast in the region."
"As for sanctions, the EU agreed to a new sanctions package against Russia. It includes targeting oil exports by sanctioning 73 additional vessels that are part of Russia’s shadow fleet. The EU had sanctioned 79 vessels previously. While similar sanctions from the US on Russia have not led to a significant drop in export volumes, floating storage has increased. This has buyers less willing to accept sanctioned vessels."
"However, potential restarts of oil flows from Iraq’s Kurdistan region, and soon, are offsetting these supply risks. There's talk that these flows could resume soon, after being offline since early 2023. A resumption could bring 300k b/d of supply onto the market. This isn’t the first time that there’s been talk of an imminent restart of flows. In addition, it’s unclear how Iraq would manage its OPEC+ production target if these flows were to resume."
-
11:28
EUR/USD rises as risk-premium of US Dollar diminishes
- EUR/USD edges slightly higher as the US Dollar declines, with investors seeming less fearful about President Trump’s tariff threats.
- The FOMC Minutes showed on Wednesday that officials are concerned over upside risks to inflation.
- ECB’s Schnabel expected the central bank to pause the policy-easing cycle.
EUR/USD ticks higher to near 1.0440 as the US Dollar (USD) declines in Thursday’s European session. The US Dollar Index (DXY), which tracks the Greenback’s value against six major currencies, falls to near 106.90. The Greenback appears to have resumed its downside journey after a mild recovery earlier this week as investors expect United States (US) President Donald Trump’s tariffs agenda won’t be much more terrifying than the market had anticipated.
Till now, President Trump has imposed 25% tariffs on steel and aluminum, 10% on all imports from China, and has threatened to introduce reciprocal tariffs, with a 25% levy on automobiles, semiconductors, and pharmaceuticals by April. Market participants had anticipated that Trump would force tariffs soon after returning to the White House.
Meanwhile, Donald Trump has mentioned that he refrained from imposing tariffs immediately to allow local manufacturers enough time to increase their operating capacity. Market experts believe that US trading partners would be able to negotiate a deal with Trump in the meantime, and the impact of tariffs would remain limited on the global economy.
Apart from Trump’s tariff agenda, growing optimism over the Russia-Ukraine truce has also diminished the risk premium of the US Dollar. President Trump has agreed to hold more talks with Russia, including Ukraine and Europe, to end the war in Ukraine.
A Russia-Ukraine peace agreement would have a favorable impact on the Eurozone. The truce would improve the global supply chain and lower energy prices. The Eurozone used to be significantly dependent on Russia for energy imports before its war with Ukraine.
Daily digest market movers: EUR/USD ticks higher amid weakness in US Dollar
- EUR/USD edges higher as the US Dollar struggles for a firm footing even though Federal Open Market Committee (FOMC) minutes for the January meeting showed on Wednesday that policymakers hesitated to continue easing the monetary policy amid concerns over a sticky inflation outlook.
- The FOMC Minutes revealed that producers will pass on the import tariff cost to consumers, according to the output policymakers have received from business owners. Such a scenario will increase inflationary pressures and allow the Fed to maintain a restrictive monetary policy stance for longer. Technically, hawkish FOMC Minutes should have supported the US Dollar, but Trump’s economic policies are driving the asset.
- In the Eurozone, traders have fully priced in three more interest rate cuts by the European Central Bank (ECB) by this summer. However, ECB executive board member Isabel Schnabel said on Wednesday that she expects the central bank could announce a "halt" in the monetary expansion cycle as risks to inflation have "skewed to the upside" while borrowing costs had eased a lot. Schnabel warned that domestic inflation was "still high" and wage growth was "still elevated", amid "new shocks to energy prices".
- Going forward, the major trigger for the US Dollar and the Euro (EUR) will be flash Purchasing Managers Index (PMI) data for February, which will be released on Friday. In Thursday’s North American session, investors will focus on the Initial Jobless Claims data for the week ending February 14.
Technical Analysis: EUR/USD oscillates inside Wednesday’s trading range
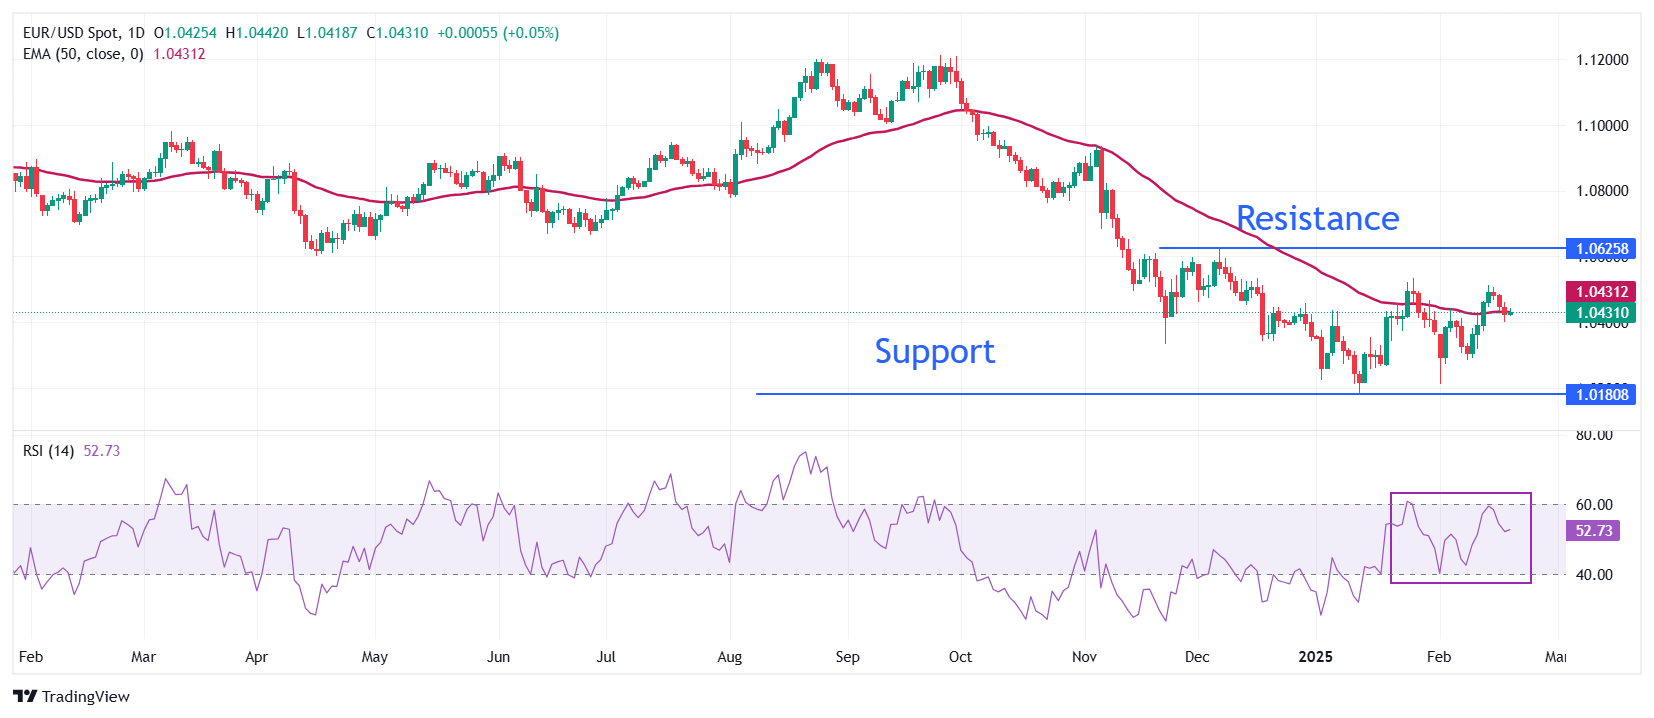
EUR/USD trades inside Wednesday’s trading range around 1.0440 in European trading hours on Thursday. The 50-day Exponential Moving Average (EMA) continues to offer support to the major currency pair around 1.0430.
The 14-day Relative Strength Index (RSI) struggles to break above 60.00. A bullish momentum would activate if the RSI (14) manages to sustain above that level.
Looking down, the February 10 low of 1.0285 will act as the major support zone for the pair. Conversely, the December 6 high of 1.0630 will be the key barrier for the Euro bulls.
Euro FAQs
The Euro is the currency for the 19 European Union countries that belong to the Eurozone. It is the second most heavily traded currency in the world behind the US Dollar. In 2022, it accounted for 31% of all foreign exchange transactions, with an average daily turnover of over $2.2 trillion a day. EUR/USD is the most heavily traded currency pair in the world, accounting for an estimated 30% off all transactions, followed by EUR/JPY (4%), EUR/GBP (3%) and EUR/AUD (2%).
The European Central Bank (ECB) in Frankfurt, Germany, is the reserve bank for the Eurozone. The ECB sets interest rates and manages monetary policy. The ECB’s primary mandate is to maintain price stability, which means either controlling inflation or stimulating growth. Its primary tool is the raising or lowering of interest rates. Relatively high interest rates – or the expectation of higher rates – will usually benefit the Euro and vice versa. The ECB Governing Council makes monetary policy decisions at meetings held eight times a year. Decisions are made by heads of the Eurozone national banks and six permanent members, including the President of the ECB, Christine Lagarde.
Eurozone inflation data, measured by the Harmonized Index of Consumer Prices (HICP), is an important econometric for the Euro. If inflation rises more than expected, especially if above the ECB’s 2% target, it obliges the ECB to raise interest rates to bring it back under control. Relatively high interest rates compared to its counterparts will usually benefit the Euro, as it makes the region more attractive as a place for global investors to park their money.
Data releases gauge the health of the economy and can impact on the Euro. Indicators such as GDP, Manufacturing and Services PMIs, employment, and consumer sentiment surveys can all influence the direction of the single currency. A strong economy is good for the Euro. Not only does it attract more foreign investment but it may encourage the ECB to put up interest rates, which will directly strengthen the Euro. Otherwise, if economic data is weak, the Euro is likely to fall. Economic data for the four largest economies in the euro area (Germany, France, Italy and Spain) are especially significant, as they account for 75% of the Eurozone’s economy.
Another significant data release for the Euro is the Trade Balance. This indicator measures the difference between what a country earns from its exports and what it spends on imports over a given period. If a country produces highly sought after exports then its currency will gain in value purely from the extra demand created from foreign buyers seeking to purchase these goods. Therefore, a positive net Trade Balance strengthens a currency and vice versa for a negative balance.
-
11:23
NZD/USD gains to near 0.5730 as US Dollar faces selling pressure
- NZD/USD rises to near 0.5730 as the US Dollar weakens amid an upbeat market mood.
- Growing optimism over Russia-Ukraine peace has diminished the safe-haven appeal of the US Dollar.
- The RBNZ cut its OCR by an outsize rate for the third time in a row.
The NZD/USD pair moves higher to near 0.5730 in European trading hours on Thursday. The Kiwi pair gains as the US Dollar (USD) weakens, with the US Dollar Index (DXY) sliding marginally below the key level of 107.00.
The US Dollar weakens as the risk sentiment seems favorable for risk-sensitive currencies. The risk-on mood is the outcome of investors turning confident over the potential Russia-Ukraine truce. Market participants have become more hopeful for an end to the three-year-long war in Ukraine after United States (US) President Donald Trump agreed to have more peace talks with Russia.
President Trump announced that he will also meet Russian leader Vladimir Putin before the end of this month. Positive developments in Russia-US peace talks are expected to weaken the appeal of safe-haven assets.
On the monetary policy front, the Federal Open Market Committee (FOMC) minutes of the January meeting show that officials hesitate to cut interest rates as Trump’s economic policies are expected to boost inflationary pressures.
Meanwhile, the New Zealand Dollar (NZD) performs strongly as market participants had already priced in that the Reserve Bank of New Zealand (RBNZ) will cut its Official Cash Rate (OCR) by 50 basis points (bps) to 3.75% on Wednesday. The RBNZ reduced its OCR by an outsize rate for the third time in a row, with officials remaining worried about moderating inflation and a fragile economy.
New Zealand Dollar PRICE Today
The table below shows the percentage change of the New Zealand Dollar (NZD) against listed major currencies today. The New Zealand Dollar was the strongest against the US Dollar.
USD EUR GBP JPY CAD AUD NZD CHF USD -0.14% -0.23% -0.84% -0.11% -0.48% -0.49% -0.27% EUR 0.14% -0.09% -0.71% 0.03% -0.34% -0.35% -0.15% GBP 0.23% 0.09% -0.61% 0.12% -0.25% -0.26% -0.04% JPY 0.84% 0.71% 0.61% 0.74% 0.38% 0.32% 0.57% CAD 0.11% -0.03% -0.12% -0.74% -0.36% -0.38% -0.16% AUD 0.48% 0.34% 0.25% -0.38% 0.36% -0.02% 0.19% NZD 0.49% 0.35% 0.26% -0.32% 0.38% 0.02% 0.22% CHF 0.27% 0.15% 0.04% -0.57% 0.16% -0.19% -0.22% The heat map shows percentage changes of major currencies against each other. The base currency is picked from the left column, while the quote currency is picked from the top row. For example, if you pick the New Zealand Dollar from the left column and move along the horizontal line to the US Dollar, the percentage change displayed in the box will represent NZD (base)/USD (quote).
RBNZ Governor Adrian Orr has guided that the central bank could slow down its policy-easing pace and reduce interest rates by 25 bps in the next two policy meetings.
New Zealand Dollar FAQs
The New Zealand Dollar (NZD), also known as the Kiwi, is a well-known traded currency among investors. Its value is broadly determined by the health of the New Zealand economy and the country’s central bank policy. Still, there are some unique particularities that also can make NZD move. The performance of the Chinese economy tends to move the Kiwi because China is New Zealand’s biggest trading partner. Bad news for the Chinese economy likely means less New Zealand exports to the country, hitting the economy and thus its currency. Another factor moving NZD is dairy prices as the dairy industry is New Zealand’s main export. High dairy prices boost export income, contributing positively to the economy and thus to the NZD.
The Reserve Bank of New Zealand (RBNZ) aims to achieve and maintain an inflation rate between 1% and 3% over the medium term, with a focus to keep it near the 2% mid-point. To this end, the bank sets an appropriate level of interest rates. When inflation is too high, the RBNZ will increase interest rates to cool the economy, but the move will also make bond yields higher, increasing investors’ appeal to invest in the country and thus boosting NZD. On the contrary, lower interest rates tend to weaken NZD. The so-called rate differential, or how rates in New Zealand are or are expected to be compared to the ones set by the US Federal Reserve, can also play a key role in moving the NZD/USD pair.
Macroeconomic data releases in New Zealand are key to assess the state of the economy and can impact the New Zealand Dollar’s (NZD) valuation. A strong economy, based on high economic growth, low unemployment and high confidence is good for NZD. High economic growth attracts foreign investment and may encourage the Reserve Bank of New Zealand to increase interest rates, if this economic strength comes together with elevated inflation. Conversely, if economic data is weak, NZD is likely to depreciate.
The New Zealand Dollar (NZD) tends to strengthen during risk-on periods, or when investors perceive that broader market risks are low and are optimistic about growth. This tends to lead to a more favorable outlook for commodities and so-called ‘commodity currencies’ such as the Kiwi. Conversely, NZD tends to weaken at times of market turbulence or economic uncertainty as investors tend to sell higher-risk assets and flee to the more-stable safe havens.
-
11:22
GBP: The European bond market sell-off is unwelcome – ING
If European bond markets are going to sell off further, life may become even harder for UK Chancellor Rachel Reeves, ING’s FX analysts Chris Turner notes.
GBP/USD can't hold any near-term gains over the 1.26 area
"Remember she is going to provide a spending update on 26 March and needs to credibly argue how the government will hit its fiscal rule of a balanced budget in FY29/30. Higher gilt yields mean a higher bar for a credible spending plan and questions whether she can present a plan that defers spending cuts to the later years."
"If gilt yields are pressing their January highs at the time of the March review, this means either: a) the Chancellor will need to deliver deeper spending cuts or b) UK asset markets get hit should her plans not look credible."
"Neither scenario is a good look for Pound Sterling and that is why we doubt GBP/USD holds any near-term gains over the 1.26 area."
-
11:04
Spain 5-y Bond Auction dipped from previous 2.763% to 2.682%
-
11:02
AUD/USD is under mild downward pressure – UOB Group
Australian Dollar (AUD) is under mild downward pressure vs US Dollar (USD); it could edge lower but is unlikely to break below 0.6305 (there is another support at 0.6325). In the longer run, momentum is slowing; a breach of 0.6305 would indicate that AUD is likely to trade in a range instead of advancing, UOB Group’s FX analysts Quek Ser Leang and Peter Chia note.
Under 0.6305, AUD is likely to trade in a range
24-HOUR VIEW: "Yesterday, we noted that 'the price movements continue to suggest range trading, likely between 0.6330 and 0.6365.' However, AUD traded in a 0.6337/0.6370 range, closing slightly lower at 0.6345 (-0.14%). There has been a slight increase in downward momentum. Today, we expect AUD to edge lower, but given the mild momentum, any decline is unlikely to break the strong support at 0.6305 (there is another support at 0.6325). Resistance is at 0.6355; a breach of 0.6370 would indicate that the mild downward pressure has eased."
1-3 WEEKS VIEW: "We have held a positive AUD view since early this month. In our latest narrative from Monday (17 Feb, spot at 0.6355), we highlighted, 'momentum remains strong, and we continue to expect AUD to advance, potentially to 0.6410.' Since then, AUD has not been able to make much headway on the upside. Upward momentum is slowing, and a breach of 0.6305 (no change in ‘strong support’ level) would indicate AUD is likely to trade in a range instead of advancing."
-
11:01
Spain 3-y Bond Auction climbed from previous 2.388% to 2.487%
-
11:00
Gold rallies with yields taking a step back
- Gold is printing another fresh all-time high at around $2,955.
- US President Donald Trump took markets by surprise when he mentioned a trade deal with China could be done.
- If US yields drop off further, expect to see more all-time highs in Gold this week.
Gold’s price (XAU/USD) is jumping again this Thursday while US yields are taking a step back together with a weaker Greenback. The precious metal trades around $2,955 at the time of writing. The push higher comes after United States (US) President Donald Trump said that a trade deal with China could be possible. Geopolitical concerns grew after Trump said Ukraine started the war with Russia and alluded it is time to repay the US for all the funding provided.
Meanwhile, the Federal Reserve (Fed) Minutes from Wednesday overnight did not have much impact. Only a handful of Federal Open Market Committee (FOMC) members were advocating for a steady interest rate and no rush for any cuts. Considering this, chances for a June interest rate cut still stand.
Daily digest market movers: Geopolitics take over
- Thousands of Gold bars are being physically moved from the Bank of England's vaults to the US futures market, exposing logistical bottlenecks in the global market. The move is driven by an arbitrage opportunity created by speculation that US President Donald Trump will impose tariffs on Gold, with traders buying spot Gold in London and selling futures contracts in the US, Bloomberg reports.
- Gold Fields Ltd. said full-year profit surged 77% last year after the price of the precious metal soared, while the company started to overcome operational challenges at mines in Chile and South Africa, Reuters reports.
- The relationship between the US and Ukraine reached a new low on Wednesday in a social media frenzy between US President Donald Trump and Ukraine’s President Volodymyr Zelenskiy. There are growing concerns that Trump could halt American support for Ukraine after Russia invaded its neighbor in 2022. The US leader said on social media on Wednesday that Volodymyr Zelenskiy should “better move fast” to reach a deal with Russia “or he is not going to have a country left,” Bloomberg reports.
Technical Analysis: Let’s get to $3,000 and be done with it
It looks like even despite a softer tone on tariffs and with a possible trade deal between the US and China, traders will still have enough reasons to push XAU/USD further up. The path to $3,000 looks set and it is just a matter of time before Gold gets to it. As seen with several other asset classes, once the precious metal frenzy reaches the masses, it would be then the cue to sell.
The first support for this Thursday is located at $2,947, the first resistance, which coincides with Wednesday’s high. The daily pivot comes in at $2,933. Below there, the low of Wednesday and the S1 support are coming in at $2,919 and should be strong enough to support and brief selling pressure.
On the upside, the R2 resistance at $2,961 is the level to target for this Thursday. With a light economic calendar, there are great chances that the level will get tested later during the day. From there, the $3,000 handle comes in although it might still be a bit too high to get tested this week.

XAU/USD: Daily Chart
Gold FAQs
Gold has played a key role in human’s history as it has been widely used as a store of value and medium of exchange. Currently, apart from its shine and usage for jewelry, the precious metal is widely seen as a safe-haven asset, meaning that it is considered a good investment during turbulent times. Gold is also widely seen as a hedge against inflation and against depreciating currencies as it doesn’t rely on any specific issuer or government.
Central banks are the biggest Gold holders. In their aim to support their currencies in turbulent times, central banks tend to diversify their reserves and buy Gold to improve the perceived strength of the economy and the currency. High Gold reserves can be a source of trust for a country’s solvency. Central banks added 1,136 tonnes of Gold worth around $70 billion to their reserves in 2022, according to data from the World Gold Council. This is the highest yearly purchase since records began. Central banks from emerging economies such as China, India and Turkey are quickly increasing their Gold reserves.
Gold has an inverse correlation with the US Dollar and US Treasuries, which are both major reserve and safe-haven assets. When the Dollar depreciates, Gold tends to rise, enabling investors and central banks to diversify their assets in turbulent times. Gold is also inversely correlated with risk assets. A rally in the stock market tends to weaken Gold price, while sell-offs in riskier markets tend to favor the precious metal.
The price can move due to a wide range of factors. Geopolitical instability or fears of a deep recession can quickly make Gold price escalate due to its safe-haven status. As a yield-less asset, Gold tends to rise with lower interest rates, while higher cost of money usually weighs down on the yellow metal. Still, most moves depend on how the US Dollar (USD) behaves as the asset is priced in dollars (XAU/USD). A strong Dollar tends to keep the price of Gold controlled, whereas a weaker Dollar is likely to push Gold prices up.
(This story was corrected on February 20 at 10:19GMT to say that traders buying spot Gold in London and selling futures contracts in the US, Bloomberg reports. Not "Bloomberg supports.")
-
11:00
Eurozone Construction Output w.d.a (YoY) fell from previous 1.4% to -0.1% in December
-
11:00
Eurozone Construction Output s.a (MoM) dipped from previous 1.2% to 0% in December
-
10:58
JPY to outperform on the crosses – especially against the euro – ING
This is not a broad-based decline but is largely led by developments in Japan, ING’s FX analysts Chris Turner notes.
A sizable USD/JPY move sub-150 on its way
"Here, local investors seem impressed that there has been little official push-back against the recent rise in JGB yields and that the Bank Of Japan may hike again this summer. The OIS market prices 21bp of a 25bp hike in July – which would take the policy rate to 0.75%."
"We have been surprised by the yen's strength in response to these relatively modest moves in Japanese interest rates. And we do note that speculative positioning is now quite long for the yen. However, we don't want to stand in the way of further short-term term USD/JPY losses, because tomorrow's January Japan CPI release could trigger another leg lower."
"That said, we are not looking for a sizable USD/JPY move sub-150 and instead prefer yen out-performance on the crosses – especially against the euro."
-
10:55
GBP to remain bullish near term – Danske Bank
EUR/GBP broke firmly below the 0.83 mark during yesterday's session amid higher-than-expected inflation, Danske Bank's FX analyst Mohamad Al-Saraf reports.
Rise in headline inflation is driven by fuel prices
"Headline came in higher than expected at 3.0% (cons: 2.8%, prior: 2.5%), core at 3.7% (cons: 3.7%, prior: 3.2%). Services however was a touch lower than expected, meeting the BoE's expectation of 5.0% (cons: 5.1%, prior: 4.4%)."
"The rise in headline was driven by fuel prices, education (VAT on private school fees), airfares but also stronger food prices. Note, this was the final CPI release ahead of the next BoE meeting on 20 March, where markets price 2bp."
"We see the bar as high for delivering a cut in March, amplified by today's release and expect the next cut in May. We stay bullish on GBP FX and expect a more gradual BoE easing cycle relative to peers to support this view."
-
10:51
USD: The Fed doesn't seem worried about the consumer – ING
The Dollar Index (DXY) is a little softer, ING’s FX analysts Chris Turner notes.
DXY can find support under 107
"When it comes to the US Dollar (USD), we largely see it staying supported. Even though short-dated US yields fell 2bp on last night's release of the January FOMC minutes, the release did not look particularly dovish. The clear message was that the Fed needed to see additional evidence or progress before cutting rates again."
"At the same time, the Fed released a from Vice Chair Philip Jefferson. He noted that those from the entire income spectrum had been enjoying the benefits of wealth effects and seemed to suggest that US household balance sheets were in relatively healthy shape."
"FX markets will also be digesting some overnight comments from President Trump that the US could sign a new trade deal with China. That saw USD/CNH come off a little in Asia, but we doubt it is enough to prompt a big re-rating of the Rest of the World currencies just yet. Assuming that there is no big spike in the US weekly jobless claims data today, we think DXY can find support under 107."
-
10:41
PBOC: To promote cross-border use of the Yuan currency
Following are the key takeaways from the People’s Bank of China’s (PBOC) annual macro-prudential work conference.
Will step up analysis of macroeconomic and financial work.
To innovate macro prudential policy tools and promote sustained recovery of the economy.
To focus on real economy and people's need for financial services.
Will help arrest the fall in the property market and stabilise conditions.
Will develop Yuan offshore market.
To allow for currency swap and Yuan settlement to play their respective roles.
Market reaction
The Chinese proxy, the Australian Dollar (AUD) is unperturbed by these headlines. AUD/USD is trading 0.50% firmer on the day at 0.6372 as of writing.
PBOC FAQs
The primary monetary policy objectives of the People's Bank of China (PBoC) are to safeguard price stability, including exchange rate stability, and promote economic growth. China’s central bank also aims to implement financial reforms, such as opening and developing the financial market.
The PBoC is owned by the state of the People's Republic of China (PRC), so it is not considered an autonomous institution. The Chinese Communist Party (CCP) Committee Secretary, nominated by the Chairman of the State Council, has a key influence on the PBoC’s management and direction, not the governor. However, Mr. Pan Gongsheng currently holds both of these posts.
Unlike the Western economies, the PBoC uses a broader set of monetary policy instruments to achieve its objectives. The primary tools include a seven-day Reverse Repo Rate (RRR), Medium-term Lending Facility (MLF), foreign exchange interventions and Reserve Requirement Ratio (RRR). However, The Loan Prime Rate (LPR) is China’s benchmark interest rate. Changes to the LPR directly influence the rates that need to be paid in the market for loans and mortgages and the interest paid on savings. By changing the LPR, China’s central bank can also influence the exchange rates of the Chinese Renminbi.
Yes, China has 19 private banks – a small fraction of the financial system. The largest private banks are digital lenders WeBank and MYbank, which are backed by tech giants Tencent and Ant Group, per The Straits Times. In 2014, China allowed domestic lenders fully capitalized by private funds to operate in the state-dominated financial sector.
-
10:35
EUR/USD to consolidate around current levels – Danske Bank
EUR/USD has remained rangebound this week, trading with a slight downward bias within the 1.04-1.05 range, as FX markets largely shrugged off Trump's latest tariff threats after he proposed 25% tariffs on autos, chips, and pharma imports , Danske Bank's FX analyst Mohamad Al-Saraf reports.
Weekly jobless claims are on the agenda
"The January FOMC meeting minutes indicated that as long as the economy remains near full employment, policymakers would need to see further tangible progress on inflation before considering rate cuts. Market reaction was muted, though front-end yields edged slightly lower."
"Today is expected to be another quiet session, with only weekly jobless claims on the agenda. Market focus will shift to tomorrow's PMI releases from the US and euro area, where it will be key to see if momentum builds following January's surprisingly strong euro area PMIs."
"Germany's elections this weekend could gain traction, particularly if a CDU/CSU-led coalition is formed, potentially signalling a shift in fiscal policy that could support Germany's weak growth outlook and, in turn, the EUR. We continue to expect EUR/USD to consolidate around current levels in the near term while maintaining our strategically bearish outlook."
-
10:31
Silver price today: Silver rises, according to FXStreet data
Silver prices (XAG/USD) rose on Thursday, according to FXStreet data. Silver trades at $33.08 per troy ounce, up 0.98% from the $32.75 it cost on Wednesday.
Silver prices have increased by 14.47% since the beginning of the year.
Unit measure Silver Price Today in USD Troy Ounce 33.08 1 Gram 1.06 The Gold/Silver ratio, which shows the number of ounces of Silver needed to equal the value of one ounce of Gold, stood at 89.27 on Thursday, down from 89.64 on Wednesday.
Silver FAQs
Silver is a precious metal highly traded among investors. It has been historically used as a store of value and a medium of exchange. Although less popular than Gold, traders may turn to Silver to diversify their investment portfolio, for its intrinsic value or as a potential hedge during high-inflation periods. Investors can buy physical Silver, in coins or in bars, or trade it through vehicles such as Exchange Traded Funds, which track its price on international markets.
Silver prices can move due to a wide range of factors. Geopolitical instability or fears of a deep recession can make Silver price escalate due to its safe-haven status, although to a lesser extent than Gold's. As a yieldless asset, Silver tends to rise with lower interest rates. Its moves also depend on how the US Dollar (USD) behaves as the asset is priced in dollars (XAG/USD). A strong Dollar tends to keep the price of Silver at bay, whereas a weaker Dollar is likely to propel prices up. Other factors such as investment demand, mining supply – Silver is much more abundant than Gold – and recycling rates can also affect prices.
Silver is widely used in industry, particularly in sectors such as electronics or solar energy, as it has one of the highest electric conductivity of all metals – more than Copper and Gold. A surge in demand can increase prices, while a decline tends to lower them. Dynamics in the US, Chinese and Indian economies can also contribute to price swings: for the US and particularly China, their big industrial sectors use Silver in various processes; in India, consumers’ demand for the precious metal for jewellery also plays a key role in setting prices.
Silver prices tend to follow Gold's moves. When Gold prices rise, Silver typically follows suit, as their status as safe-haven assets is similar. The Gold/Silver ratio, which shows the number of ounces of Silver needed to equal the value of one ounce of Gold, may help to determine the relative valuation between both metals. Some investors may consider a high ratio as an indicator that Silver is undervalued, or Gold is overvalued. On the contrary, a low ratio might suggest that Gold is undervalued relative to Silver.
(An automation tool was used in creating this post.)
-
10:27
EUR: New theme alert – fiscal risk premium – ING
The euro is looking soft on the crosses and a new theme may be coming into play on the back of geopolitical developments. US isolationism means that Europe is going to have to ramp up defence spending sharply. The question is: who's going to pay for it? Will spending be undertaken at the European supranational level? Or will a failure to reach any collective agreement put pressure back on local and national budgets, ING’s FX analysts Chris Turner notes.
EUR/USD to stall in the 1.0450/70 area and can drop to 1.0350
"Italy could be in focus here with perhaps one of the greatest needs to increase defence spending but a debt-to-GDP ratio already close to 140%. Our rates strategy team feels that the recent narrowing in Italian-German sovereign bond spreads could well reverse as it dawns on investors that national governments will be paying the defence bill."
"Some of these trends started to show through in financial markets yesterday, where European debt really started to underperform. We are seeing a bearish steepening of European bond curves, where the German 2-10-year Bund curve, now at 38bp, has steepened to the highest levels since October 2022. We are wary that the theme of increased government bond supply can pressure peripheral spreads and demand a new fiscal risk premium of the euro."
"This comes at a time when there is not much trade risk premium priced into EUR/USD either. As above, there do not seem any immediate signs that the US consumer is about to crumble or that the Fed is about to pull the trigger on another rate cut. Overall we have a slight preference that EUR/USD stalls in the 1.0450/70 area and could drop to 1.0350 should we start to see Italian longer-dated government bonds coming under pressure."
-
10:00
Greece Current Account (YoY) down to €-3.602B in December from previous €-3.152B
-
10:00
GBP/USD: To trade in a sideways range of 1.2550/1.2615 – UOB Group
Momentum indicators are turning flat; Pound Sterling (GBP) is expected to trade in a sideways range of 1.2550/1.2615 vs US Dollar (USD). In the longer run, upward momentum is beginning to slow; a breach of 1.2525 would indicate that GBP is not strengthening further, UOB Group’s FX analysts Quek Ser Leang and Peter Chia note.
Upward momentum is beginning to slow
24-HOUR VIEW: "We pointed out yesterday that 'although upward momentum has not increased much, there is still a chance for GBP to edge higher today.' However, we were of the view that 'a clear break above 1.2655 still seems unlikely.' GBP subsequently rose to 1.2641, pulling back to close at 1.2586 (-0.22%). Momentum indicators are turning flat, and today, we expect GBP to trade in a sideways range of 1.2550/1.2615."
1-3 WEEKS VIEW: "We turned positive in GBP late last week. After GBP exceeded our initial technical target at 1.2600, we indicated on Monday (17 Feb, spot at 1.2580) that 'further GBP strength appears likely, and the focus now is at 1.2655.' Yesterday, GBP rose to 1.2641 and then pulled back. Upward momentum is beginning to slow, but only a breach of 1.2525 (no change in ‘strong support’ level) would mean that GBP is not strengthening further."
-
09:58
US Dollar Index remains subdued around 107.00 as Treasury yields continue to fall
- The US Dollar Index loses ground as yields on US Treasury notes extend their losses.
- Trump has confirmed plans to impose a 25% tariff on imports of automobiles, semiconductors, and pharmaceutical products.
- The latest FOMC Meeting Minutes emphasized needing more time to assess multiple factors before considering any rate adjustments.
The US Dollar Index (DXY), which measures the value of the US Dollar (USD) against six major currencies, depreciates after registering gains for the last two successive days amid falling Treasury yields. The DXY hovers around 107.00. with 2- and 10-year yields on US Treasury bonds standing at 4.26% and 4.52%, respectively, during the European hours on Thursday.
Market participants are now focused on key US economic data, including weekly Initial Jobless Claims, the CB Leading Economic Index, and the Philly Fed Manufacturing Index, set to be released during the North American session.
However, the US Dollar gained ground as risk aversion rose due to concerns over the latest tariffs from US President Donald Trump, who has confirmed that a 25% tariff on pharmaceutical, semiconductor, and auto imports will take effect in April.
The US Dollar may appreciate as the cautious tone rises following the Federal Open Market Committee (FOMC) Minutes from January’s policy meeting. Federal Reserve (Fed) policymakers reaffirmed the decision to keep interest rates unchanged in January. They also emphasized the need for more time to assess economic activity, labor market trends, and inflation before considering any rate adjustments. The committee also agreed that clear signs of declining inflation are necessary before implementing rate cuts.
Markets are pricing in one rate cut for the federal funds rate in 2025, with the potential for a second. Fed Vice Chairman Philip Jefferson stated late Wednesday that the US central bank has time to assess its next interest rate move, citing a resilient economy and persistent inflation. Meanwhile, Chicago Fed President Austan Goolsbee acknowledged that while inflation has eased, it remains elevated, emphasizing that rate cuts would be considered once inflation reaches a more acceptable level, according to Reuters.
US Dollar FAQs
The US Dollar (USD) is the official currency of the United States of America, and the ‘de facto’ currency of a significant number of other countries where it is found in circulation alongside local notes. It is the most heavily traded currency in the world, accounting for over 88% of all global foreign exchange turnover, or an average of $6.6 trillion in transactions per day, according to data from 2022. Following the second world war, the USD took over from the British Pound as the world’s reserve currency. For most of its history, the US Dollar was backed by Gold, until the Bretton Woods Agreement in 1971 when the Gold Standard went away.
The most important single factor impacting on the value of the US Dollar is monetary policy, which is shaped by the Federal Reserve (Fed). The Fed has two mandates: to achieve price stability (control inflation) and foster full employment. Its primary tool to achieve these two goals is by adjusting interest rates. When prices are rising too quickly and inflation is above the Fed’s 2% target, the Fed will raise rates, which helps the USD value. When inflation falls below 2% or the Unemployment Rate is too high, the Fed may lower interest rates, which weighs on the Greenback.
In extreme situations, the Federal Reserve can also print more Dollars and enact quantitative easing (QE). QE is the process by which the Fed substantially increases the flow of credit in a stuck financial system. It is a non-standard policy measure used when credit has dried up because banks will not lend to each other (out of the fear of counterparty default). It is a last resort when simply lowering interest rates is unlikely to achieve the necessary result. It was the Fed’s weapon of choice to combat the credit crunch that occurred during the Great Financial Crisis in 2008. It involves the Fed printing more Dollars and using them to buy US government bonds predominantly from financial institutions. QE usually leads to a weaker US Dollar.
Quantitative tightening (QT) is the reverse process whereby the Federal Reserve stops buying bonds from financial institutions and does not reinvest the principal from the bonds it holds maturing in new purchases. It is usually positive for the US Dollar.
-
09:55
EUR/USD: Likely to trade in a 1.0395/1.0455 range – UOB Group
Euro (EUR) is likely to trade in a 1.0395/1.0455 range vs US Dollar (USD). In the longer run, EUR appears to have moved into a 1.0350/1.0500 range trading phase, UOB Group’s FX analysts Quek Ser Leang and Peter Chia note.
EUR appears to have moved into a range trading phase
24-HOUR VIEW: "Yesterday, we indicated that EUR 'could dip to 1.0430 before recovering.' We also indicated that 'the strong support at 1.0415 is unlikely to come under threat.' However, EUR fell more than expected to 1.0400, closing lower by 0.35% at 1.0421. Despite the decline, there has been no significant increase in downward momentum. This, combined with oversold conditions, suggests EUR is unlikely to weaken much further. Today, EUR is more likely to trade in a 1.0395/1.0455 range."
1-3 WEEKS VIEW: "We highlighted last Friday (14 Feb, spot at 1.0460) that 'the outlook for EUR is positive, with a technical target of 1.0530.' EUR then rose to 1.0514 and then pulled back. Yesterday, it broke below our ‘strong support’ level at 1.0415, indicating that upward momentum has faded. EUR appears to have moved into a range trading phase, and it is likely to trade between 1.0350 and 1.0500 for the time being."
-
09:36
China SMEI: Activity slows in February – Standard Chartered
Headline SMEI edged down 0.5pts to 50.4 in February as current performance sub-index fell below 50. Tourism-related services activity dropped m/m after holiday boost; real estate performance rebounded. Manufacturing SMEs reported m/m decline in production, sales and new orders, partly due to seasonality. Credit conditions turned more favourable on lower funding costs for SMEs; FX expectations stabilised, Standard Chartered's economists note.
Performance deteriorates, while expectations improve
"Our proprietary Small and Medium Enterprise Confidence Index (SMEI; Bloomberg: SCCNSMEI <Index>) retreated to 50.4 in February from 50.9 in January. The performance sub-index fell sharply by 2pts to 48.5, into contractionary territory again, registering the lowest reading since end-2022 partly due to holiday distortions. On the bright side, the expectations index improved, with all sub-indices rising into expansionary territory, suggesting the setback might be temporary."
"Manufacturing SMEs reported a m/m decline in sales, production, new orders and profitability. We think Lunar New Year holiday disruptions have been partly reflected in this month’s survey. That said, average key sub-indices’ readings for 2M-2025 fell below 50, likely reflecting the impact of additional tariffs. Tourism-related services activity, such as transport, retail and wholesale, and accommodation and catering, has normalised, after rising sharply in January. Real estate performance has recovered. Construction activity remains subdued."
"The credit sub-indices moderated slightly to 51.8 in February as receivables turnover lengthened. Meanwhile, credit conditions have turned more favourable for SMEs as financing costs trended lower from January. SMEs’ exchange rate expectations stabilised in February after depreciation expectations had spiked in prior months."
-
09:34
AUD/JPY trades below 96.00 due to rising odds of more BoJ rate hikes
- AUD/JPY faces challenges as the BoJ is widely expected to raise interest rates further.
- The risk-sensitive currency cross amid rising global uncertainties following fresh tariffs from the US President Donald Trump.
- Australia’s Unemployment Rate increased to 4.1% in January from 4.0% in December, as expected.
AUD/JPY loses ground for the second successive day, trading around 95.80 during the European hours on Thursday. This downside of the currency cross could be attributed to the growing acceptance that the Bank of Japan (BoJ) would hike interest rates further.
Additionally, the Japanese Yen (JPY) gains ground as the hawkish Bank of Japan (BoJ) expectations push the Japanese government bond (JGB) yields to their highest levels in more than a decade. The resultant narrowing of the rate differential between Japan and other countries provides an additional boost to the JPY.
Additionally, the AUD/JPY cross depreciates as the risk-sensitive Australian Dollar (AUD) faces challenges, while the safe-haven Japanese Yen gains ground due to a fresh wave of the global risk aversion trade, triggered by US President Donald Trump's tariff threats. Trump confirmed that a 25% tariff on pharmaceutical, semiconductor, and auto imports will take effect in April, further escalating global trade tensions.
The downside of the AUD/JPY cross could be restrained as the Australian Dollar (AUD) gains ground against its peers following the release of domestic employment data. Australia’s seasonally adjusted Unemployment Rate rose to 4.1% in January from 4.0% in December, aligning with market expectations. Additionally, Employment Change came in at 44K for January, down from a revised 60K in December (previously 56.3K), but still exceeding the consensus forecast of 20K.
Reserve Bank of Australia (RBA) Deputy Governor Andrew Hauser stated while speaking to Bloomberg News on Thursday that the central bank’s policy “is still restrictive.” Hauser noted that the latest jobs data showed little cause for concern. Hauser also emphasized that Australia’s monthly CPI data remains incomplete, requiring a wait for quarterly figures to gain a clearer picture. While market expectations suggest three to four rate cuts, the RBA remains uncertain. The central bank’s primary focus is still on inflation, while global economic uncertainty poses potential risks to Australia’s economy.
Interest rates FAQs
Interest rates are charged by financial institutions on loans to borrowers and are paid as interest to savers and depositors. They are influenced by base lending rates, which are set by central banks in response to changes in the economy. Central banks normally have a mandate to ensure price stability, which in most cases means targeting a core inflation rate of around 2%. If inflation falls below target the central bank may cut base lending rates, with a view to stimulating lending and boosting the economy. If inflation rises substantially above 2% it normally results in the central bank raising base lending rates in an attempt to lower inflation.
Higher interest rates generally help strengthen a country’s currency as they make it a more attractive place for global investors to park their money.
Higher interest rates overall weigh on the price of Gold because they increase the opportunity cost of holding Gold instead of investing in an interest-bearing asset or placing cash in the bank. If interest rates are high that usually pushes up the price of the US Dollar (USD), and since Gold is priced in Dollars, this has the effect of lowering the price of Gold.
The Fed funds rate is the overnight rate at which US banks lend to each other. It is the oft-quoted headline rate set by the Federal Reserve at its FOMC meetings. It is set as a range, for example 4.75%-5.00%, though the upper limit (in that case 5.00%) is the quoted figure. Market expectations for future Fed funds rate are tracked by the CME FedWatch tool, which shapes how many financial markets behave in anticipation of future Federal Reserve monetary policy decisions.
-
09:13
Pound Sterling gains against USD as investors see Trump’s tariff policies less fearful
- The Pound Sterling rises around 1.2610 against the US Dollar while investors wait for more developments in President Trump’s international policies.
- The FOMC minutes showed on Wednesday that officials are worried about deepening upside risks to inflation.
- Investors await the UK Retail Sales report for January and the preliminary S&P Global UK/US PMI data for February, scheduled for Friday.
The Pound Sterling (GBP) moves higher slightly above 1.2600 against the US Dollar (USD) in Thursday’s European session. The GBP/USD pair gains as the market sentiment is slightly favorable for risk-perceived currencies, with investors gaining confidence that United States (US) President Donald Trump’s tariff agenda won't be as fearful as expected.
On Wednesday, Donald Trump announced that a trade deal with China is “possible”. His comments were optimistic even though he announced 10% tariffs on all imports from the Asian country earlier this month. On Tuesday, Trump also announced that he is planning to impose 25% tariffs on imports of foreign cars, pharmaceuticals and semiconductors. There is no detailed plan for all tariff threats, which he has announced till now. While Trump was expected to start imposing levies soon after returning to the White House.
Meanwhile, growing confidence over potential Russia-Ukraine truce has also improved market mood. President Trump has confirmed that he will hold more talks on a Russia-Ukraine peace deal after discussing the issue with Russian diplomats in Saudi Arabia without including Ukraine and Europe. However, Ukraine has said that it won’t agree to a deal that would be made on its behalf.
However, the outlook for the US Dollar still seems upbeat on the monetary policy front. The Federal Open Market Committee (FOMC) minutes for the January meeting showed on Wednesday that officials are expected to keep interest rates in the current range of 4.25%-4.50% for longer.
Fed policymakers were more concerned about the upside risks to inflation due to Trump’s potential tariff policies than risks to the labor market. The FOMC Minutes also indicated that business owners plan to pass on the impact of higher input costs to consumers. Even though tariffs on critical imports would boost local production, those products won’t be competitive in terms of manufacturing cost, given the higher United States (US) labor costs compared to those of its trading partners.
Such a scenario will boost inflationary pressures and prevent Federal Reserve (Fed) officials from continuing the monetary expansion cycle sooner, which started in September 2024.
Daily digest market movers: Pound Sterling continues to underperform on a broader note
- The Pound Sterling remains fragile against its major peers as investors are concerned over the United Kingdom’s (UK) economic outlook. Bank of England (BoE) Governor Andrew Bailey warned this week that the economic growth is expected to remain sluggish and sees the labor market softening.
- The British currency attempted to gain ground after the release of a hotter-than-expected UK Consumer Price Index (CPI) report for January on Wednesday but failed to do so. Governor Bailey had already cautioned that a short-term uptick in inflation is expected due to volatile energy prices, but that won’t be persistent.
- Year-on-year headline CPI rose by 3%, faster than estimates of 2.8% and the December reading of 2.5%. In the same period, the core CPI – which excludes volatile components of food, energy, alcohol, and tobacco – grew by 3.7%, as expected, faster than the former reading of 3.2%.
- Though the acceleration in inflationary pressures should be temporary, it will not allow the BoE to ease monetary policy further. The central bank reduced its borrowing rates by 25 basis points (bps) to 4.5% in its policy meeting, which took place on February 6 but guided a cautious policy easing outlook.
- Going forward, investors will focus on the UK Retail Sales data for January, and the flash S&P Global UK/US Purchasing Managers Index (PMI) report for February, which will be released on Friday.
British Pound PRICE Today
The table below shows the percentage change of British Pound (GBP) against listed major currencies today. British Pound was the strongest against the US Dollar.
USD EUR GBP JPY CAD AUD NZD CHF USD -0.11% -0.16% -0.75% -0.05% -0.38% -0.38% -0.19% EUR 0.11% -0.05% -0.66% 0.05% -0.28% -0.28% -0.11% GBP 0.16% 0.05% -0.59% 0.10% -0.23% -0.23% -0.04% JPY 0.75% 0.66% 0.59% 0.69% 0.37% 0.33% 0.54% CAD 0.05% -0.05% -0.10% -0.69% -0.32% -0.33% -0.15% AUD 0.38% 0.28% 0.23% -0.37% 0.32% -0.00% 0.16% NZD 0.38% 0.28% 0.23% -0.33% 0.33% 0.00% 0.18% CHF 0.19% 0.11% 0.04% -0.54% 0.15% -0.16% -0.18% The heat map shows percentage changes of major currencies against each other. The base currency is picked from the left column, while the quote currency is picked from the top row. For example, if you pick the British Pound from the left column and move along the horizontal line to the US Dollar, the percentage change displayed in the box will represent GBP (base)/USD (quote).
Technical Analysis: Pound Sterling struggles around 38.2% Fibo retracement at 1.2620
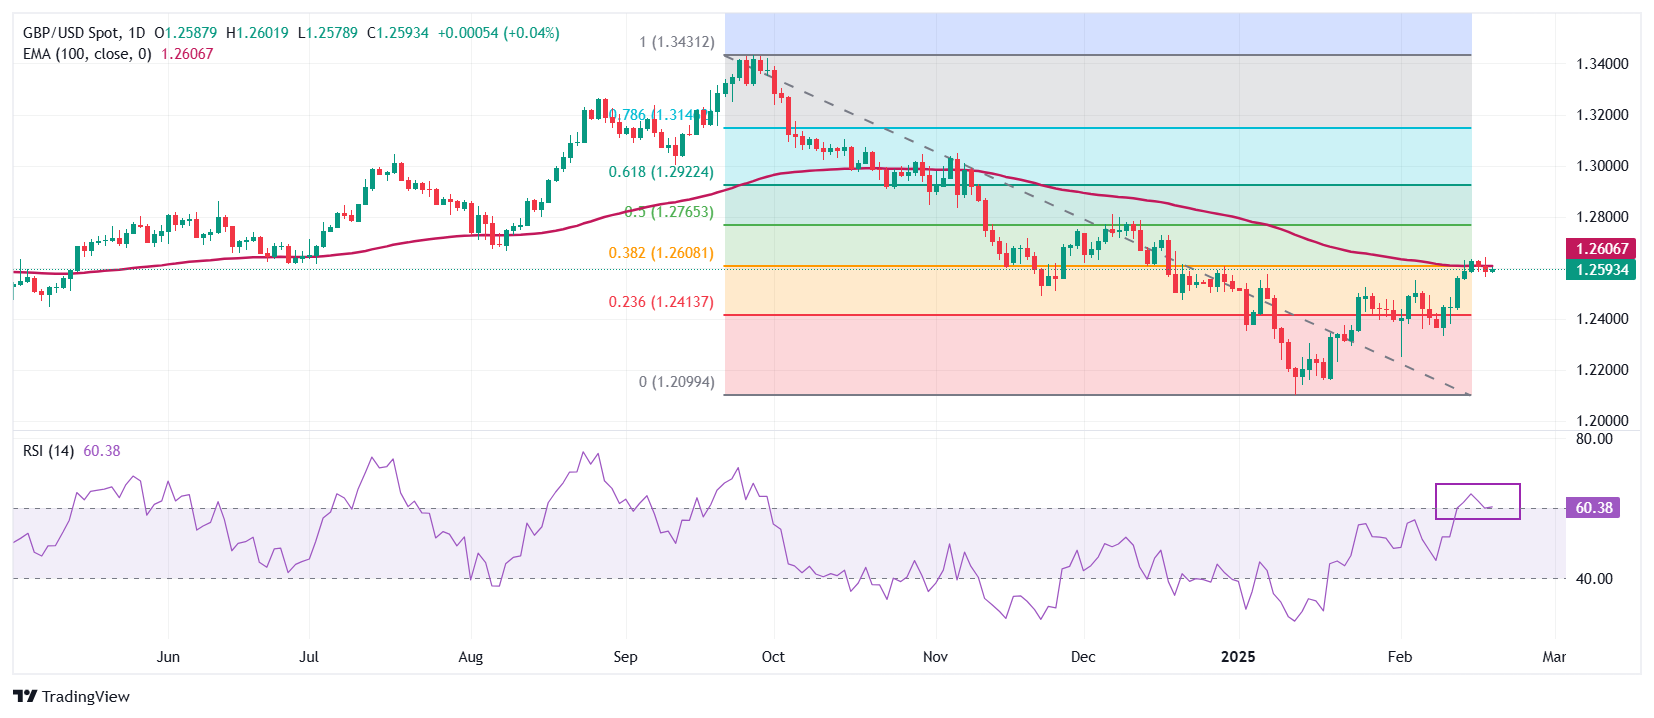
The Pound Sterling wobbles near 1.2600 against the US Dollar in European trading hours on Thursday. The GBP/USD pair faces pressure while attempting to break above the 38.2% Fibonacci retracement from the end-September high to the mid-January low downtrend, which coincides with the 100-day Exponential Moving Average (EMA), around 1.2620.
The 14-day Relative Strength Index (RSI) struggles to hold above 60.00. The bullish momentum would fizzle out if the RSI (14) fails to sustain above that level.
Looking down, the February 3 low of 1.2250 will act as a key support zone for the pair. On the upside, the 50% Fibonacci retracement at 1.2767 will act as a key resistance zone.
Pound Sterling FAQs
The Pound Sterling (GBP) is the oldest currency in the world (886 AD) and the official currency of the United Kingdom. It is the fourth most traded unit for foreign exchange (FX) in the world, accounting for 12% of all transactions, averaging $630 billion a day, according to 2022 data. Its key trading pairs are GBP/USD, also known as ‘Cable’, which accounts for 11% of FX, GBP/JPY, or the ‘Dragon’ as it is known by traders (3%), and EUR/GBP (2%). The Pound Sterling is issued by the Bank of England (BoE).
The single most important factor influencing the value of the Pound Sterling is monetary policy decided by the Bank of England. The BoE bases its decisions on whether it has achieved its primary goal of “price stability” – a steady inflation rate of around 2%. Its primary tool for achieving this is the adjustment of interest rates. When inflation is too high, the BoE will try to rein it in by raising interest rates, making it more expensive for people and businesses to access credit. This is generally positive for GBP, as higher interest rates make the UK a more attractive place for global investors to park their money. When inflation falls too low it is a sign economic growth is slowing. In this scenario, the BoE will consider lowering interest rates to cheapen credit so businesses will borrow more to invest in growth-generating projects.
Data releases gauge the health of the economy and can impact the value of the Pound Sterling. Indicators such as GDP, Manufacturing and Services PMIs, and employment can all influence the direction of the GBP. A strong economy is good for Sterling. Not only does it attract more foreign investment but it may encourage the BoE to put up interest rates, which will directly strengthen GBP. Otherwise, if economic data is weak, the Pound Sterling is likely to fall.
Another significant data release for the Pound Sterling is the Trade Balance. This indicator measures the difference between what a country earns from its exports and what it spends on imports over a given period. If a country produces highly sought-after exports, its currency will benefit purely from the extra demand created from foreign buyers seeking to purchase these goods. Therefore, a positive net Trade Balance strengthens a currency and vice versa for a negative balance.
-
08:47
Crude oil price today: WTI price bearish, according to FXStreet data
West Texas Intermediate (WTI) Oil price falls on Thursday, according to FXStreet data. WTI trades at $72.10 per barrel, down from Wednesday’s close at $72.16. Brent Oil Exchange Rate (Brent crude) is also shedding ground, trading at $75.78 after its previous daily close at $75.81.
WTI Oil FAQs
WTI Oil is a type of Crude Oil sold on international markets. The WTI stands for West Texas Intermediate, one of three major types including Brent and Dubai Crude. WTI is also referred to as “light” and “sweet” because of its relatively low gravity and sulfur content respectively. It is considered a high quality Oil that is easily refined. It is sourced in the United States and distributed via the Cushing hub, which is considered “The Pipeline Crossroads of the World”. It is a benchmark for the Oil market and WTI price is frequently quoted in the media.
Like all assets, supply and demand are the key drivers of WTI Oil price. As such, global growth can be a driver of increased demand and vice versa for weak global growth. Political instability, wars, and sanctions can disrupt supply and impact prices. The decisions of OPEC, a group of major Oil-producing countries, is another key driver of price. The value of the US Dollar influences the price of WTI Crude Oil, since Oil is predominantly traded in US Dollars, thus a weaker US Dollar can make Oil more affordable and vice versa.
The weekly Oil inventory reports published by the American Petroleum Institute (API) and the Energy Information Agency (EIA) impact the price of WTI Oil. Changes in inventories reflect fluctuating supply and demand. If the data shows a drop in inventories it can indicate increased demand, pushing up Oil price. Higher inventories can reflect increased supply, pushing down prices. API’s report is published every Tuesday and EIA’s the day after. Their results are usually similar, falling within 1% of each other 75% of the time. The EIA data is considered more reliable, since it is a government agency.
OPEC (Organization of the Petroleum Exporting Countries) is a group of 12 Oil-producing nations who collectively decide production quotas for member countries at twice-yearly meetings. Their decisions often impact WTI Oil prices. When OPEC decides to lower quotas, it can tighten supply, pushing up Oil prices. When OPEC increases production, it has the opposite effect. OPEC+ refers to an expanded group that includes ten extra non-OPEC members, the most notable of which is Russia.
(An automation tool was used in creating this post.)
-
08:38
USD/CAD Price Forecast: Tests nine-day EMA barrier after breaking above 1.4200
- USD/CAD tests immediate resistance at the nine-day EMA of 1.4236.
- A break above the falling wedge pattern signals the potential for further upward movement.
- A return to the falling wedge would lead the pair to test the psychological level of 1.4100.
The USD/CAD pair remains steady after registering gains for the last two successive days, trading near 1.4220 during early European hours on Thursday. Technical analysis on the daily chart indicates that the pair has broken above the falling wedge pattern, a bullish formation signaling a potential upward move.
However, the 14-day Relative Strength Index (RSI) remains below the 50 level, indicating a prevailing bearish outlook. A decisive move would be needed to confirm a clear directional trend. Additionally, the USD/CAD pair continues to trade below the nine- and 14-day Exponential Moving Averages (EMAs), reflecting persistent bearish sentiment and weak short-term price action.
The USD/CAD pair faces immediate resistance at the nine-day EMA of 1.4236, followed by the 14-day EMA of 1.4262. A decisive break above these levels could strengthen short-term momentum, potentially pushing the pair toward the psychological level of 1.4300.
On the downside, a return to the falling wedge would reinforce the bearish bias, pushing the USD/CAD pair toward the psychological level of 1.4100, followed by the lower boundary of the wedge at 1.4080. A break below this channel would further strengthen the bearish outlook, potentially driving the pair toward the three-month low of 1.3927, last reached on November 25.
USD/CAD: Daily Chart

Canadian Dollar PRICE Today
The table below shows the percentage change of Canadian Dollar (CAD) against listed major currencies today. Canadian Dollar was the strongest against the US Dollar.
USD EUR GBP JPY CAD AUD NZD CHF USD -0.05% -0.08% -0.87% 0.00% -0.24% -0.30% -0.16% EUR 0.05% -0.03% -0.83% 0.06% -0.21% -0.24% -0.13% GBP 0.08% 0.03% -0.78% 0.08% -0.17% -0.22% -0.08% JPY 0.87% 0.83% 0.78% 0.87% 0.62% 0.52% 0.69% CAD -0.00% -0.06% -0.08% -0.87% -0.24% -0.30% -0.17% AUD 0.24% 0.21% 0.17% -0.62% 0.24% -0.05% 0.06% NZD 0.30% 0.24% 0.22% -0.52% 0.30% 0.05% 0.13% CHF 0.16% 0.13% 0.08% -0.69% 0.17% -0.06% -0.13% The heat map shows percentage changes of major currencies against each other. The base currency is picked from the left column, while the quote currency is picked from the top row. For example, if you pick the Canadian Dollar from the left column and move along the horizontal line to the US Dollar, the percentage change displayed in the box will represent CAD (base)/USD (quote).
-
08:32
Forex Today: Gold hits new record-high, USD struggles to find direction
Here is what you need to know on Thursday, February 20:
While major currency pairs are having a tough time making a decisive move in either direction, Gold extends its uptrend to a new record-high on Thursday. The US economic calendar will feature the weekly Initial Jobless Claims report and the European Commission will publish the preliminary Consumer Confidence Index data for February. Later in the American session, several Federal Reserve (Fed) policymakers will be delivering speeches.
US Dollar PRICE This week
The table below shows the percentage change of US Dollar (USD) against listed major currencies this week. US Dollar was the weakest against the Japanese Yen.
USD EUR GBP JPY CAD AUD NZD CHF USD 0.60% -0.09% -1.38% 0.32% -0.22% -0.03% 0.36% EUR -0.60% -0.54% -1.99% -0.18% -0.73% -0.53% -0.14% GBP 0.09% 0.54% -1.36% 0.35% -0.14% 0.00% 0.40% JPY 1.38% 1.99% 1.36% 1.69% 1.19% 1.56% 1.71% CAD -0.32% 0.18% -0.35% -1.69% -0.50% -0.34% 0.04% AUD 0.22% 0.73% 0.14% -1.19% 0.50% 0.20% 0.60% NZD 0.03% 0.53% -0.01% -1.56% 0.34% -0.20% 0.39% CHF -0.36% 0.14% -0.40% -1.71% -0.04% -0.60% -0.39% The heat map shows percentage changes of major currencies against each other. The base currency is picked from the left column, while the quote currency is picked from the top row. For example, if you pick the US Dollar from the left column and move along the horizontal line to the Japanese Yen, the percentage change displayed in the box will represent USD (base)/JPY (quote).
The minutes of the Fed's January policy meeting showed on Wednesday that officials debated whether it might be wise to slow or even pause the reduction of their balance sheet holdings, given that renewed concerns over the federal debt ceiling have come back into play. Meanwhile, US President Donald Trump noted that it could be possible to make a new trade deal with China. These comments failed to trigger a noticeable market reaction and Wall Street's main indexes ended the day marginally higher. Early Thursday, US stock index futures trade in negative territory and the US Dollar Index holds steady near 107.00 after posting small gains for two consecutive days.
The data from Australia showed early Thursday that the Unemployment Rate edged higher to 4.1% in January from 4% in December, as expected. In this period, Full-Time Employment rose by 54.1K after declining by 23.7K in December. In the meantime, the People’s Bank of China (PBoC), China's central bank, announced that it left the one-year and five-year Loan Prime Rates (LPRs) unchanged at 3.10% and 3.60%, respectively. AUD/USD edged slightly higher in the Asian trading hours and was last seen trading above 0.6360.
EUR/USD failed to gather recovery momentum and closed in the negative territory for the third consecutive day on Wednesday. The pair trades in a tight range below 1.0450 in the European morning on Thursday.
Although stronger-than-expected inflation data from the UK helped Pound Sterling stay resilient against its rivals in the early European session on Wednesday, GBP/USD lost its traction and closed the day marginally lower. The pair holds its ground to begin the European session and trades near 1.2600.
Growing expectations for a hawkish Bank of Japan (BoJ) policy outlook continue to support the Japanese Yen (JPY). Earlier in the day, Japan's 10-year government bond yield touched its highest level in 15 years. At the time of press, USD/JPY was trading at its lowest level since early December near 150.00, losing about 1% on the day.
Following Thursday's choppy action, Gold resumed its uptrend early Thursday and touched a fresh record high near $2,950.
Gold FAQs
Gold has played a key role in human’s history as it has been widely used as a store of value and medium of exchange. Currently, apart from its shine and usage for jewelry, the precious metal is widely seen as a safe-haven asset, meaning that it is considered a good investment during turbulent times. Gold is also widely seen as a hedge against inflation and against depreciating currencies as it doesn’t rely on any specific issuer or government.
Central banks are the biggest Gold holders. In their aim to support their currencies in turbulent times, central banks tend to diversify their reserves and buy Gold to improve the perceived strength of the economy and the currency. High Gold reserves can be a source of trust for a country’s solvency. Central banks added 1,136 tonnes of Gold worth around $70 billion to their reserves in 2022, according to data from the World Gold Council. This is the highest yearly purchase since records began. Central banks from emerging economies such as China, India and Turkey are quickly increasing their Gold reserves.
Gold has an inverse correlation with the US Dollar and US Treasuries, which are both major reserve and safe-haven assets. When the Dollar depreciates, Gold tends to rise, enabling investors and central banks to diversify their assets in turbulent times. Gold is also inversely correlated with risk assets. A rally in the stock market tends to weaken Gold price, while sell-offs in riskier markets tend to favor the precious metal.
The price can move due to a wide range of factors. Geopolitical instability or fears of a deep recession can quickly make Gold price escalate due to its safe-haven status. As a yield-less asset, Gold tends to rise with lower interest rates, while higher cost of money usually weighs down on the yellow metal. Still, most moves depend on how the US Dollar (USD) behaves as the asset is priced in dollars (XAU/USD). A strong Dollar tends to keep the price of Gold controlled, whereas a weaker Dollar is likely to push Gold prices up.
-
08:01
Turkey Consumer Confidence up to 82.1 in February from previous 81
-
08:01
Switzerland Exports (MoM) climbed from previous 21630M to 24450M in January
-
08:00
Switzerland Imports (MoM) increased to 18326M in January from previous 18135M
-
08:00
Germany Producer Price Index (MoM) registered at -0.1%, below expectations (0.6%) in January
-
08:00
Switzerland Trade Balance climbed from previous 3494M to 6124M in January
-
08:00
Germany Producer Price Index (YoY) registered at 0.5%, below expectations (1.3%) in January
-
08:00
Sweden Capacity Utilization: 0.7% (4Q) vs -0.9%
-
07:55
FX option expiries for Feb 20 NY cut
FX option expiries for Feb 20 NY cut at 10:00 Eastern Time via DTCC can be found below.
EUR/USD: EUR amounts
- 1.0300 1.9b
- 1.0315 1.2b
- 1.0350 1.2b
- 1.0400 1.5b
- 1.0410 1.2b
- 1.0420 1.4b
- 1.0430 3.9b
- 1.0450 2.7b
- 1.0500 1.4b
- 1.0525 1.6b
GBP/USD: GBP amounts
- 1.2350 612m
- 1.2520 1.3b
USD/JPY: USD amounts
- 151.00 579m
- 152.45 590m
- 153.60 954m
- 154.00 1.5b
USD/CHF: USD amounts
- 0.8935 649m
AUD/USD: AUD amounts
- 0.6235 723m
- 0.6325 759m
- 0.6350 972m
- 0.6375 1.1b
USD/CAD: USD amounts
- 1.4000 687m
- 1.4100 685m
- 1.4155 735m
- 1.4175 852m
- 1.4400 717m
NZD/USD: NZD amounts
- 0.5660 1.4b
-
07:43
EUR/JPY extends decline below 157.00 on BoJ hike bets
- EUR/JPY tumbles to nearly 156.55 in Thursday’s European session, down 0.85% on the day.
- Hawkish BoJ expectations boost the JPY.
- Investors will take more cues from the German January PPI, which is due later on Thursday.
The EUR/JPY cross extends its downside to around 156.55 during the early European session on Thursday. The Japanese Yen (JPY) strengthens amid rising bets for additional Bank of Japan (BoJ) rate hikes. The German Producer Price Index (PPI) for January is due later on Thursday.
Japan's latest data has reinforced the BoJ's case for raising interest rates, with GDP surpassing expectations and nominal wages rising at the fastest pace in nearly three decades. According to a Reuters poll, over 65% of economists said that the BoJ could hike to 0.75% in the third quarter and the rate of pay increases in this year's labor talks are seen as 5.00% vs. 4.75% in the January poll.
BOJ Board Member Hajime Takata said on Wednesday that it’s important to continue considering gradual rate hikes, while also noting that Japan’s bond yields are moving in accordance with the market’s view of the economy. The growing speculation the BoJ will hike rates sooner rather than later lifts the JPY and creates a headwind for EUR/JPY.
On the Euro front, tariff concerns from US President Donald Trump could weigh on the shared currency. Late Tuesday, Trump said that he would likely impose tariffs of around 25% on foreign cars, while semiconductor chips and drugs are set to face higher duties. Trump didn’t provide a clear timeline for when these tariffs will come into effect but said that some of them will be enacted by April 2.
Additionally, the monetary policy divergence between the BoJ and the European Central Bank (ECB) also weighs on the Euro. "Markets imply another 75bps of ECB cuts in the next 12 months, which would see the policy rate bottom at 2.00%,” noted BBH's FX analysts.
RBI FAQs
The role of the Reserve Bank of India (RBI), in its own words, is "..to maintain price stability while keeping in mind the objective of growth.” This involves maintaining the inflation rate at a stable 4% level primarily using the tool of interest rates. The RBI also maintains the exchange rate at a level that will not cause excess volatility and problems for exporters and importers, since India’s economy is heavily reliant on foreign trade, especially Oil.
The RBI formally meets at six bi-monthly meetings a year to discuss its monetary policy and, if necessary, adjust interest rates. When inflation is too high (above its 4% target), the RBI will normally raise interest rates to deter borrowing and spending, which can support the Rupee (INR). If inflation falls too far below target, the RBI might cut rates to encourage more lending, which can be negative for INR.
Due to the importance of trade to the economy, the Reserve Bank of India (RBI) actively intervenes in FX markets to maintain the exchange rate within a limited range. It does this to ensure Indian importers and exporters are not exposed to unnecessary currency risk during periods of FX volatility. The RBI buys and sells Rupees in the spot market at key levels, and uses derivatives to hedge its positions.
-
06:59
RBNZ’s Hawkesby: New Zealand’s economy is well-placed to respond to trade shocks
Reserve Bank of New Zealand (RBNZ) Deputy Governor Christian Hawkesby said in an interview on Thursday that “New Zealand is well-placed to respond to trade shocks.”
Additional quotes
Economy better balanced; inflation low.
Stronger economy buys time to respond to trade shocks.
Trade war guaranteed to slow world growth.
Lower New Zealand Dollar would be a shock absorber.
New Zealand economy is well-placed to withstand trade shocks.
Market reaction
NZD/USD holds higher ground near 0.5720 following these above comments, up 0.26% on the day.
RBNZ FAQs
The Reserve Bank of New Zealand (RBNZ) is the country’s central bank. Its economic objectives are achieving and maintaining price stability – achieved when inflation, measured by the Consumer Price Index (CPI), falls within the band of between 1% and 3% – and supporting maximum sustainable employment.
The Reserve Bank of New Zealand’s (RBNZ) Monetary Policy Committee (MPC) decides the appropriate level of the Official Cash Rate (OCR) according to its objectives. When inflation is above target, the bank will attempt to tame it by raising its key OCR, making it more expensive for households and businesses to borrow money and thus cooling the economy. Higher interest rates are generally positive for the New Zealand Dollar (NZD) as they lead to higher yields, making the country a more attractive place for investors. On the contrary, lower interest rates tend to weaken NZD.
Employment is important for the Reserve Bank of New Zealand (RBNZ) because a tight labor market can fuel inflation. The RBNZ’s goal of “maximum sustainable employment” is defined as the highest use of labor resources that can be sustained over time without creating an acceleration in inflation. “When employment is at its maximum sustainable level, there will be low and stable inflation. However, if employment is above the maximum sustainable level for too long, it will eventually cause prices to rise more and more quickly, requiring the MPC to raise interest rates to keep inflation under control,” the bank says.
In extreme situations, the Reserve Bank of New Zealand (RBNZ) can enact a monetary policy tool called Quantitative Easing. QE is the process by which the RBNZ prints local currency and uses it to buy assets – usually government or corporate bonds – from banks and other financial institutions with the aim to increase the domestic money supply and spur economic activity. QE usually results in a weaker New Zealand Dollar (NZD). QE is a last resort when simply lowering interest rates is unlikely to achieve the objectives of the central bank. The RBNZ used it during the Covid-19 pandemic.
-
06:40
USD/CHF weakens to 0.9025 area amid rising trade tensions, modest USD weakness
- USD/CHF attracts some sellers and snaps a three-day winning streak amid renewed USD selling.
- Trump’s fresh tariff threats weigh on the global risk sentiment and benefit the safe-haven CHF.
- The Fed’s hawkish outlook could act as a tailwind for the USD and help limit losses for the pair.
The USD/CHF pair meets with some supply during the Asian session on Thursday and for now, seems to have snapped a three-day winning streak to the weekly top, around the 0.9055 area touched the previous day. Spot prices currently trade near the lower end of the daily range, around the 0.9025 region, and seem vulnerable to sliding further.
US President Donald Trump said on Wednesday that he will announce tariffs on a number of products next month or even sooner. This fuels concerns about a global trade war and tempers investors' appetite for riskier assets, which is evident from a generally weaker tone around the equity markets and benefits traditional safe-haven currencies, including the Swiss Franc (CHF). Apart from this, the emergence of some US Dollar (USD) selling exerts downward pressure on the USD/CHF pair.
The global flight to safety triggers a fresh leg down in the US Treasury bond yields and to a larger extent, overshadows hawkish FOMC minutes released on Wednesday. This, in turn, fails to assist the USD Index (DXY), which tracks the Greenback against a basket of currencies, to build on its bounce from the vicinity of a two-month low tested earlier this week. That said, expectations for an extended pause on rates by the Federal Reserve (Fed) could support the buck and the USD/CHF pair.
Hence, it will be prudent to wait for strong follow-through selling before confirming that the currency pair's recovery from the 0.8970-0.8965 horizontal support, or the year-to-date low has run out of steam. Traders now look forward to Thursday's US economic docket – featuring the release of the usual Weekly Initial Jobless Claims and the Philly Fed Manufacturing Index. Apart from this, speeches by influential FOMC members might influence the USD price dynamics and the USD/CHF pair.
Tariffs FAQs
Tariffs are customs duties levied on certain merchandise imports or a category of products. Tariffs are designed to help local producers and manufacturers be more competitive in the market by providing a price advantage over similar goods that can be imported. Tariffs are widely used as tools of protectionism, along with trade barriers and import quotas.
Although tariffs and taxes both generate government revenue to fund public goods and services, they have several distinctions. Tariffs are prepaid at the port of entry, while taxes are paid at the time of purchase. Taxes are imposed on individual taxpayers and businesses, while tariffs are paid by importers.
There are two schools of thought among economists regarding the usage of tariffs. While some argue that tariffs are necessary to protect domestic industries and address trade imbalances, others see them as a harmful tool that could potentially drive prices higher over the long term and lead to a damaging trade war by encouraging tit-for-tat tariffs.
During the run-up to the presidential election in November 2024, Donald Trump made it clear that he intends to use tariffs to support the US economy and American producers. In 2024, Mexico, China and Canada accounted for 42% of total US imports. In this period, Mexico stood out as the top exporter with $466.6 billion, according to the US Census Bureau. Hence, Trump wants to focus on these three nations when imposing tariffs. He also plans to use the revenue generated through tariffs to lower personal income taxes.
-
06:30
Netherlands, The Unemployment Rate s.a (3M): 3.8% (January) vs 3.7%
-
06:30
Netherlands, The Consumer Confidence Adj down to -32 in February from previous -28
-
06:14
EUR/USD Price Forecast: First upside barrier emerges above 1.0450
- EUR/USD gains ground to around 1.0430 in Thursday’s early European session.
- The pair keeps the positive outlook above the 100-period EMA with a bullish RSI indicator.
- The immediate resistance level emerges at 1.0461; the first downside target is seen at 1.4936.
The EUR/USD pair recovers some lost ground to near 1.0425 during the early European trading hours on Thursday. The weakening of the US Dollar (USD) provides some support to the major pair. However, tariff concerns from US President Donald Trump and geopolitical tension might cap its upside.
Technically, the bullish outlook of EUR/USD remains intact as the major pair holds above the key 100-period Exponential Moving Averages (EMA) on the 4-hour chart. However, the Relative Strength Index (RSI) is located below the midline, near 42.85, suggesting that further downside cannot be ruled out.
The first upside barrier for EUR/USD emerges near 1.0461, the high of February 19. The key resistance level to watch is the 1.0500-1.0505 zone, representing the psychological level and the upper boundary of the Bollinger Band. A decisive break above this level will see a rally to 1.0533, the high of January 27.
On the other hand, the crucial support level for the major pair is seen at 1.0410, the confluence of the 100-period EMA, and the lower limit of the Bollinger Band. A breach of this level will see a drop to 1.0352, the low of February 6. The additional downside filter is located at 1.0285, the low of February 10.EUR/USD 4-hour chart
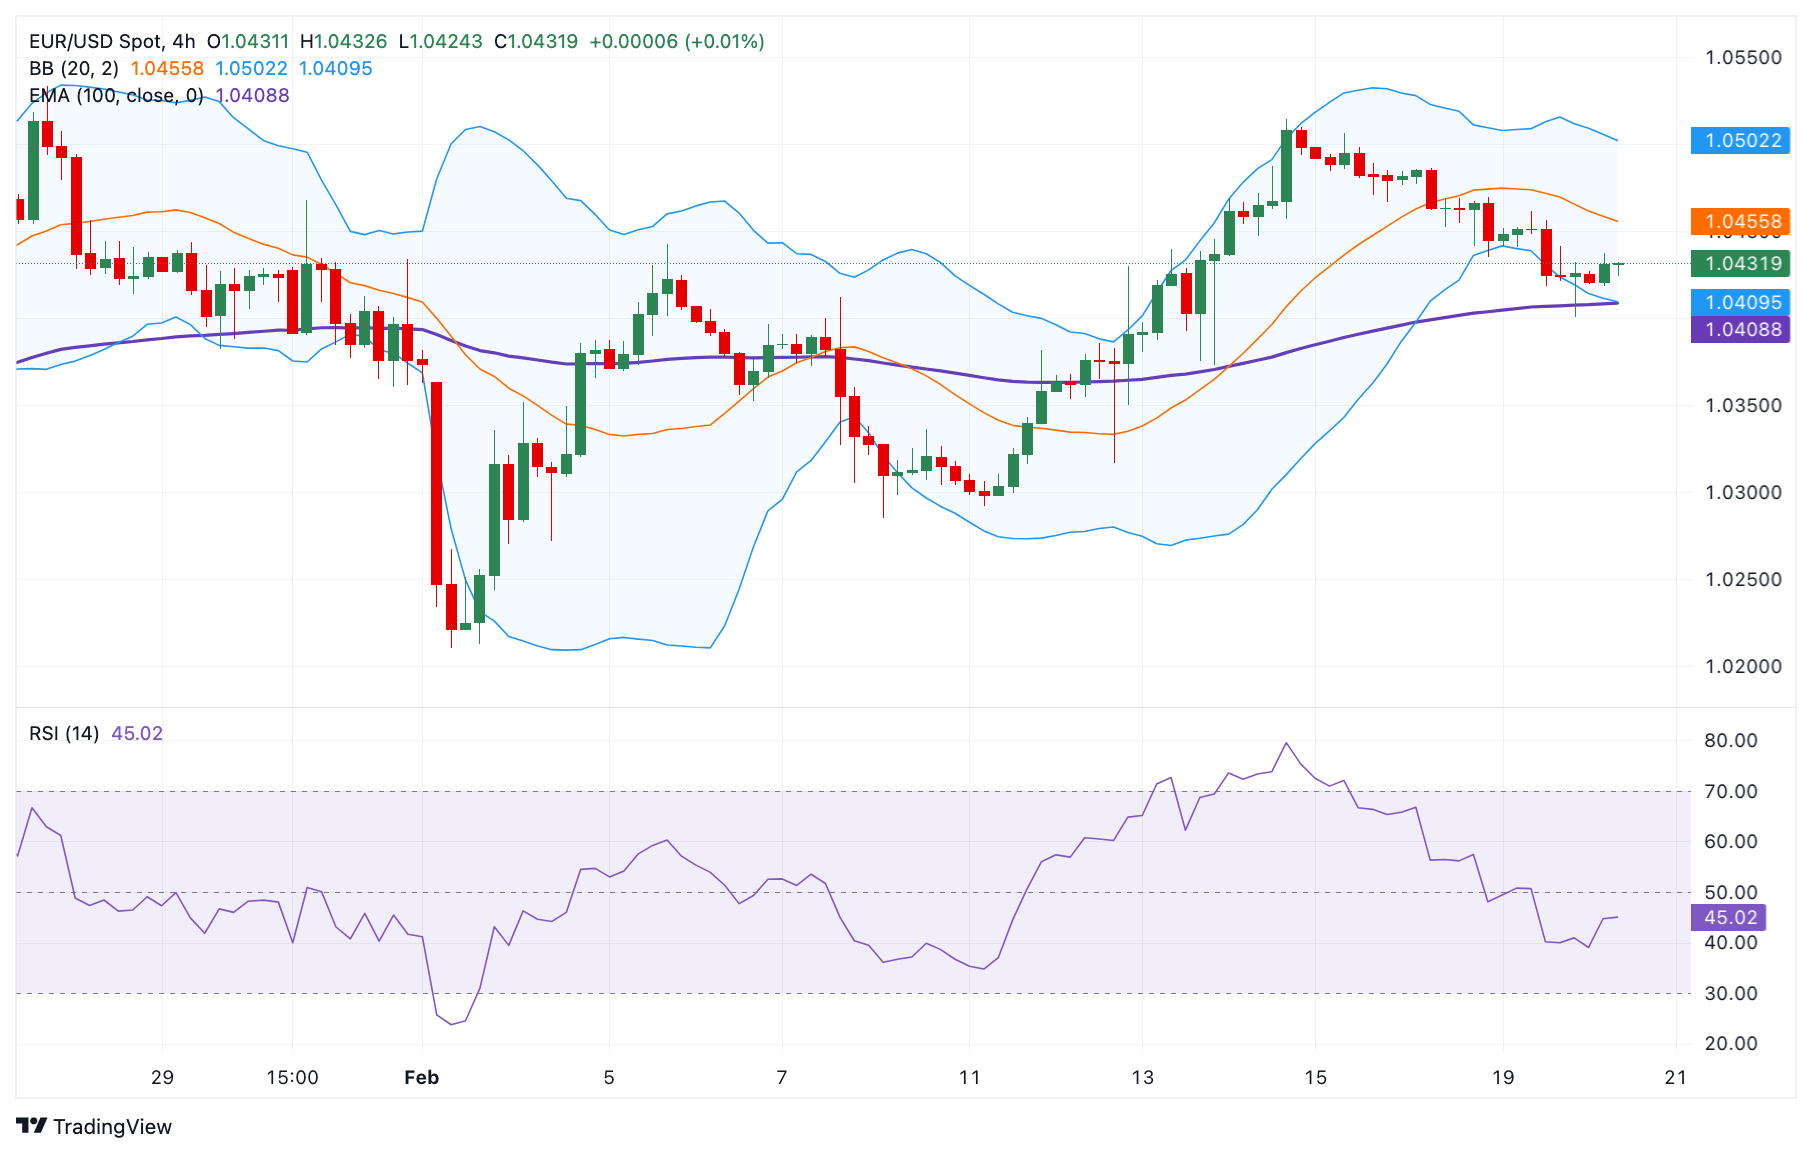
ECB FAQs
The European Central Bank (ECB) in Frankfurt, Germany, is the reserve bank for the Eurozone. The ECB sets interest rates and manages monetary policy for the region. The ECB primary mandate is to maintain price stability, which means keeping inflation at around 2%. Its primary tool for achieving this is by raising or lowering interest rates. Relatively high interest rates will usually result in a stronger Euro and vice versa. The ECB Governing Council makes monetary policy decisions at meetings held eight times a year. Decisions are made by heads of the Eurozone national banks and six permanent members, including the President of the ECB, Christine Lagarde.
In extreme situations, the European Central Bank can enact a policy tool called Quantitative Easing. QE is the process by which the ECB prints Euros and uses them to buy assets – usually government or corporate bonds – from banks and other financial institutions. QE usually results in a weaker Euro. QE is a last resort when simply lowering interest rates is unlikely to achieve the objective of price stability. The ECB used it during the Great Financial Crisis in 2009-11, in 2015 when inflation remained stubbornly low, as well as during the covid pandemic.
Quantitative tightening (QT) is the reverse of QE. It is undertaken after QE when an economic recovery is underway and inflation starts rising. Whilst in QE the European Central Bank (ECB) purchases government and corporate bonds from financial institutions to provide them with liquidity, in QT the ECB stops buying more bonds, and stops reinvesting the principal maturing on the bonds it already holds. It is usually positive (or bullish) for the Euro.
-
06:11
GBP/JPY Price Analysis: Falls toward 189.00 after breaking below nine-day EMA
- GBP/JPY could navigate the support region around the five-month low at 187.05.
- The 14-day RSI remains below the 50 level, indicating strengthening bearish momentum.
- The immediate resistance appears at the nine-day EMA of 190.69.
GBP/JPY extends its decline for the second consecutive day, trading around 189.30 during Asian hours on Thursday. A daily chart analysis suggests that the currency cross remains within a descending channel pattern, signaling a continued bearish bias.
The 14-day Relative Strength Index (RSI), a key momentum indicator, remains below the 50 level, reinforcing the bearish momentum. Moreover, the GBP/JPY cross continues to trade below the nine- and 14-day Exponential Moving Averages (EMAs), indicating weaker short-term price momentum.
Regarding its support, the GBP/JPY cross could navigate the region around a five-month low at 187.05, which was recorded on February 7, followed by the lower boundary of the descending channel around the 185.50 level.
On the upside, the GBP/JPY cross could test immediate resistance at the nine-day EMA of 190.69, followed by the 14-day EMA at 190.91. A break above these levels could weaken the bearish bias and support the currency cross to test the descending channel’s upper boundary at the 192.00 level.
A break above the channel would weaken the bearish bias and support the GBP/JPY cross to explore the area around the two-month high of 198.26.
GBP/JPY: Daily Chart
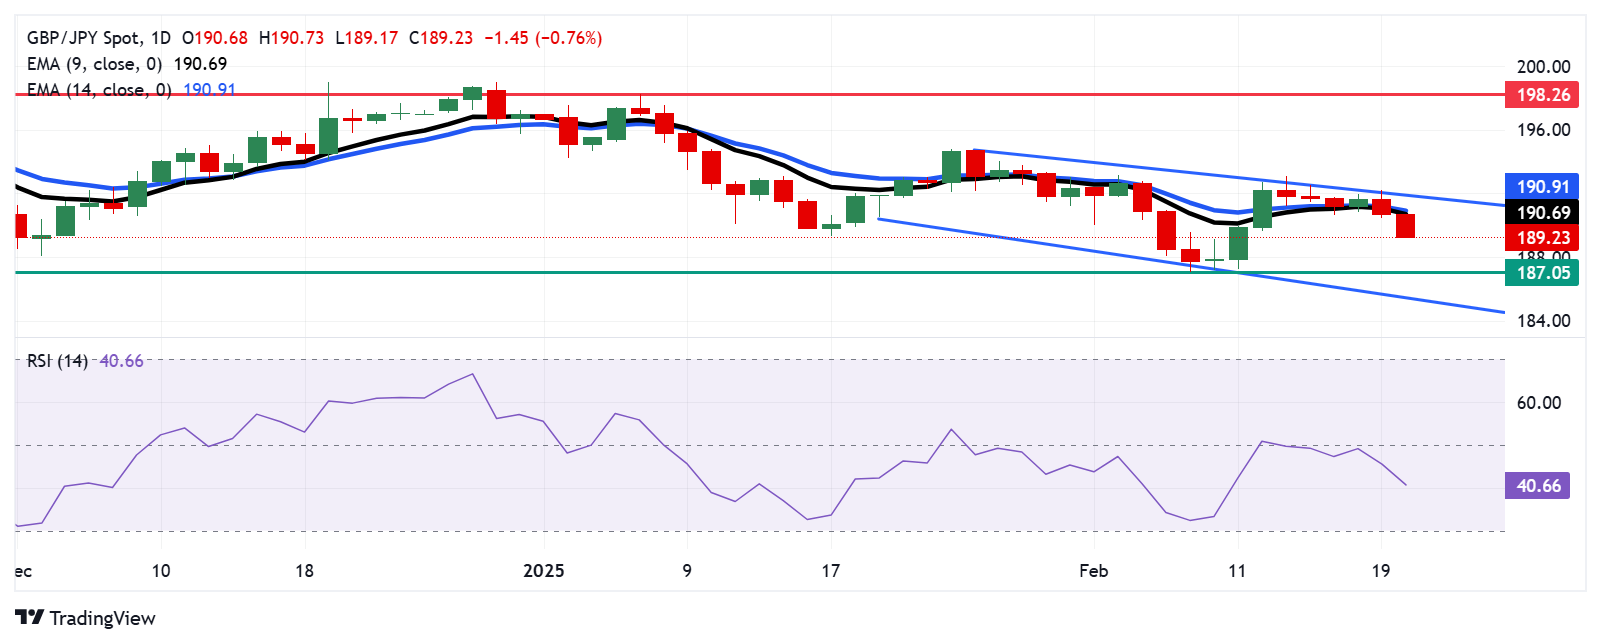
British Pound PRICE Today
The table below shows the percentage change of British Pound (GBP) against listed major currencies today. British Pound was the weakest against the Japanese Yen.
USD EUR GBP JPY CAD AUD NZD CHF USD -0.07% -0.08% -0.81% -0.03% -0.28% -0.29% -0.17% EUR 0.07% -0.01% -0.77% 0.04% -0.21% -0.22% -0.12% GBP 0.08% 0.01% -0.74% 0.06% -0.20% -0.21% -0.09% JPY 0.81% 0.77% 0.74% 0.78% 0.54% 0.49% 0.64% CAD 0.03% -0.04% -0.06% -0.78% -0.25% -0.26% -0.14% AUD 0.28% 0.21% 0.20% -0.54% 0.25% -0.01% 0.09% NZD 0.29% 0.22% 0.21% -0.49% 0.26% 0.01% 0.12% CHF 0.17% 0.12% 0.09% -0.64% 0.14% -0.09% -0.12% The heat map shows percentage changes of major currencies against each other. The base currency is picked from the left column, while the quote currency is picked from the top row. For example, if you pick the British Pound from the left column and move along the horizontal line to the US Dollar, the percentage change displayed in the box will represent GBP (base)/USD (quote).
-
06:00
BoJ’s Ueda: Did not discuss long-term rates with PM Ishiba
Bank of Japan (BoJ) Governor Kazuo Ueda said on Thursday that he “had a regular exchange of views with Prime Minister (PM) Shigeru Ishiba.”
Additional quotes
Explained economy, financial developments.
Had a meeting ahead of G20.
Did not discuss long-term rates.
-
05:40
WTI retreats further from one-week top set on Wednesday, slides to $71.70 area
- WTI attracts some sellers on Thursday and snaps a three-day winning streak to a one-week high.
- Indications of a rise in US Crude inventories and worries about Trump’s tariffs weigh on Oil prices.
- Concerns over supply disruption in Russia and a weaker USD could lend support to the black liquid.
West Texas Intermediate (WTI) US Crude Oil prices extend the overnight pullback from the vicinity of the $73.00 mark, or a one-week top, and drift lower during the Asian session on Thursday. The commodity slides to the $71.75 area, or a fresh daily low in the last hour, and for now, seems to have snapped a three-day losing streak.
Market sources, citing the American Petroleum Institute (API) report, said on Wednesday that US Crude stocks rose by 3.34 million barrels last week. This, along with concerns that US President Donald Trump's trade tariffs could weaken the global economy and dent fuel demand, fails to assist Crude Oil prices to capitalize on a three-day-old recovery from the year-to-date low touched earlier this week.
Apart from this, worries about slowing demand from the Eurozone and China exert additional pressure on the black liquid. That said, supply disruptions in Russia could help limit deeper losses. In fact, Russia said that oil flows from the Caspian Pipeline Consortium – a major route for crude exports from Kazakhstan – were reduced by 30%-40% after a Ukrainian drone attack on pumping stations.
Furthermore, the emergence of some US Dollar (USD) selling, despite the Federal Reserve's (Fed) hawkish outlook, could act as a tailwind for Crude Oil prices. Traders now look forward to the release of the official US Crude inventories data, due later during the North American session. Nevertheless, the mixed fundamental backdrop warrants some caution before placing aggressive directional bets.
WTI Oil FAQs
WTI Oil is a type of Crude Oil sold on international markets. The WTI stands for West Texas Intermediate, one of three major types including Brent and Dubai Crude. WTI is also referred to as “light” and “sweet” because of its relatively low gravity and sulfur content respectively. It is considered a high quality Oil that is easily refined. It is sourced in the United States and distributed via the Cushing hub, which is considered “The Pipeline Crossroads of the World”. It is a benchmark for the Oil market and WTI price is frequently quoted in the media.
Like all assets, supply and demand are the key drivers of WTI Oil price. As such, global growth can be a driver of increased demand and vice versa for weak global growth. Political instability, wars, and sanctions can disrupt supply and impact prices. The decisions of OPEC, a group of major Oil-producing countries, is another key driver of price. The value of the US Dollar influences the price of WTI Crude Oil, since Oil is predominantly traded in US Dollars, thus a weaker US Dollar can make Oil more affordable and vice versa.
The weekly Oil inventory reports published by the American Petroleum Institute (API) and the Energy Information Agency (EIA) impact the price of WTI Oil. Changes in inventories reflect fluctuating supply and demand. If the data shows a drop in inventories it can indicate increased demand, pushing up Oil price. Higher inventories can reflect increased supply, pushing down prices. API’s report is published every Tuesday and EIA’s the day after. Their results are usually similar, falling within 1% of each other 75% of the time. The EIA data is considered more reliable, since it is a government agency.
OPEC (Organization of the Petroleum Exporting Countries) is a group of 12 Oil-producing nations who collectively decide production quotas for member countries at twice-yearly meetings. Their decisions often impact WTI Oil prices. When OPEC decides to lower quotas, it can tighten supply, pushing up Oil prices. When OPEC increases production, it has the opposite effect. OPEC+ refers to an expanded group that includes ten extra non-OPEC members, the most notable of which is Russia.
-
05:35
India Gold price today: Gold rises, according to FXStreet data
Gold prices rose in India on Thursday, according to data compiled by FXStreet.
The price for Gold stood at 8,204.09 Indian Rupees (INR) per gram, up compared with the INR 8,193.85 it cost on Wednesday.
The price for Gold increased to INR 95,694.53 per tola from INR 95,571.48 per tola a day earlier.
Unit measure Gold Price in INR 1 Gram 8,204.09 10 Grams 82,033.24 Tola 95,694.53 Troy Ounce 255,176.00 FXStreet calculates Gold prices in India by adapting international prices (USD/INR) to the local currency and measurement units. Prices are updated daily based on the market rates taken at the time of publication. Prices are just for reference and local rates could diverge slightly.
Gold FAQs
Gold has played a key role in human’s history as it has been widely used as a store of value and medium of exchange. Currently, apart from its shine and usage for jewelry, the precious metal is widely seen as a safe-haven asset, meaning that it is considered a good investment during turbulent times. Gold is also widely seen as a hedge against inflation and against depreciating currencies as it doesn’t rely on any specific issuer or government.
Central banks are the biggest Gold holders. In their aim to support their currencies in turbulent times, central banks tend to diversify their reserves and buy Gold to improve the perceived strength of the economy and the currency. High Gold reserves can be a source of trust for a country’s solvency. Central banks added 1,136 tonnes of Gold worth around $70 billion to their reserves in 2022, according to data from the World Gold Council. This is the highest yearly purchase since records began. Central banks from emerging economies such as China, India and Turkey are quickly increasing their Gold reserves.
Gold has an inverse correlation with the US Dollar and US Treasuries, which are both major reserve and safe-haven assets. When the Dollar depreciates, Gold tends to rise, enabling investors and central banks to diversify their assets in turbulent times. Gold is also inversely correlated with risk assets. A rally in the stock market tends to weaken Gold price, while sell-offs in riskier markets tend to favor the precious metal.
The price can move due to a wide range of factors. Geopolitical instability or fears of a deep recession can quickly make Gold price escalate due to its safe-haven status. As a yield-less asset, Gold tends to rise with lower interest rates, while higher cost of money usually weighs down on the yellow metal. Still, most moves depend on how the US Dollar (USD) behaves as the asset is priced in dollars (XAU/USD). A strong Dollar tends to keep the price of Gold controlled, whereas a weaker Dollar is likely to push Gold prices up.
(An automation tool was used in creating this post.)
-
05:24
Silver Price Forecast: XAG/USD holds gains near $33.00 due to increased safe-haven appeal
- Silver price receives support from global uncertainties following fresh tariffs from US President Donald Trump.
- The latest FOMC Meeting Minutes emphasized needing more time to assess multiple factors before considering any rate adjustments.
- The grey metal found support from strong industrial demand driven by electrification and manufacturing.
Silver (XAG/USD) rebounds from recent losses recorded in the previous session, trading around $32.80 per troy ounce during Asian hours on Thursday. The grey metal gains momentum due to its safe-haven appeal remains strong amid global uncertainties. US President Donald Trump recently proposed a 25% tariff on automobiles, along with duties on semiconductors and pharmaceuticals.
However, the non-interest-bearing Silver faced little downward pressure as investors digest the latest Federal Open Market Committee (FOMC) Meeting Minutes, released on Wednesday, which reaffirmed the decision to keep interest rates unchanged in January.
Fed policymakers stressed the importance of further assessing economic activity, labor market trends, and inflation before considering any rate adjustments. They agreed that clear evidence of declining inflation is essential before implementing rate cuts. Some officials also expressed concerns that potential changes in trade and immigration policies could hinder the disinflation process. Additionally, certain inflation expectation measures have risen in recent months.
Markets are currently pricing in one rate cut for the federal funds rate in 2025, with the possibility of a second. Federal Reserve Vice Chairman Philip Jefferson stated late Wednesday that the US central bank has time to deliberate on its next interest rate move, citing a resilient economy and inflation still above target. Meanwhile, Chicago Fed President Austan Goolsbee noted that while inflation has declined, it remains elevated, emphasizing that interest rates could be lowered further once inflation reaches a more acceptable level, according to Reuters.
The precious metal gained support from strong industrial demand from electrification and manufacturing. China’s addition of 357 gigawatts of solar and wind power in 2024 further underscored Silver’s critical role in renewable energy. Additionally, the People’s Bank of China (PBOC) opted to keep its Loan Prime Rates (LPRs) unchanged, with the one-year and five-year rates remaining at 3.10% and 3.60%, respectively, signaling a cautious approach to monetary stimulus.
Silver FAQs
Silver is a precious metal highly traded among investors. It has been historically used as a store of value and a medium of exchange. Although less popular than Gold, traders may turn to Silver to diversify their investment portfolio, for its intrinsic value or as a potential hedge during high-inflation periods. Investors can buy physical Silver, in coins or in bars, or trade it through vehicles such as Exchange Traded Funds, which track its price on international markets.
Silver prices can move due to a wide range of factors. Geopolitical instability or fears of a deep recession can make Silver price escalate due to its safe-haven status, although to a lesser extent than Gold's. As a yieldless asset, Silver tends to rise with lower interest rates. Its moves also depend on how the US Dollar (USD) behaves as the asset is priced in dollars (XAG/USD). A strong Dollar tends to keep the price of Silver at bay, whereas a weaker Dollar is likely to propel prices up. Other factors such as investment demand, mining supply – Silver is much more abundant than Gold – and recycling rates can also affect prices.
Silver is widely used in industry, particularly in sectors such as electronics or solar energy, as it has one of the highest electric conductivity of all metals – more than Copper and Gold. A surge in demand can increase prices, while a decline tends to lower them. Dynamics in the US, Chinese and Indian economies can also contribute to price swings: for the US and particularly China, their big industrial sectors use Silver in various processes; in India, consumers’ demand for the precious metal for jewellery also plays a key role in setting prices.
Silver prices tend to follow Gold's moves. When Gold prices rise, Silver typically follows suit, as their status as safe-haven assets is similar. The Gold/Silver ratio, which shows the number of ounces of Silver needed to equal the value of one ounce of Gold, may help to determine the relative valuation between both metals. Some investors may consider a high ratio as an indicator that Silver is undervalued, or Gold is overvalued. On the contrary, a low ratio might suggest that Gold is undervalued relative to Silver.
-
05:06
Gold price trades with positive bias near record high on Trump’s tariff threats
- Gold price retains its bullish bias amid worries about Trump’s tariffs and a global trade war.
- Sliding US bond yields weigh on the USD and lend additional support to the precious metal.
- The Fed’s hawkish outlook could cap the XAU/USD pair amid slightly overbought conditions.
Gold price (XAU/USD) attracts fresh buyers during the Asian session on Thursday and remains close to the record high touched the previous day. US President Donald Trump's fresh threat to impose tariffs on imported goods sparks concerns about a global trade war and continues to underpin demand for the safe-haven bullion. Meanwhile, flight to safety triggers a fresh leg down in the US Treasury bond yields and turns out to be another factor benefiting the non-yielding yellow metal.
Apart from this, the emergence of some US Dollar (USD) selling lends additional support to the Gold price. That said, hawkish FOMC meeting minutes released on Wednesday reaffirmed expectations for an extended pause on rates by the Federal Reserve (Fed). This could act as a tailwind for the US bond yields and the Greenback, which, in turn, might hold back bullish traders from placing fresh bets around the XAU/USD amid slightly overbought conditions on the daily chart.
Gold price continues to attract safe-haven flows amid rising global trade tensions
- US President Donald Trump said on Wednesday that he will announce heavy tariffs on a number of products next month or even sooner, raising the risk of a further escalation of trade tensions and underpinning the safe-haven Gold price.
- US Commerce Secretary Howard Lutnick said in a Fox News interview that Trump's goal is to abolish the Internal Revenue Service and let all the outsiders pay. Meanwhile, Trump said that a new trade deal with China is possible.
- The US Dollar struggles to capitalize on its modest recovery gains registered over the past two days amid a fresh leg down in the US Treasury bond yields and turns out to be another factor lending additional support to the precious metal.
- Minutes from the last FOMC policy meeting held in January released on Wednesday revealed officials noted a high degree of uncertainty that requires the central bank to take a careful approach in considering any further interest rate cuts.
- Fed Vice Chairman Philip Jefferson said that the US economic performance has been quite strong, the US labor market is solid, inflation has eased but is still elevated, and the path back to the 2% inflation target could be bumpy.
- Chicago Fed President Austan Goolsbee said that inflation has decreased but it is still excessive and once inflation falls, rates can fall more. This, however, fails to impress the USD bulls or influence the non-yielding yellow metal.
- Thursday's US economic docket features the usual Weekly Initial Jobless Claims and the Philly Fed Manufacturing Index. This, along with speeches by influential FOMC members, could drive the USD and the XAU/USD pair.
- The market focus will then shift to the release of flash global PMIs on Friday, which should provide a fresh insight into the global economic health and provide some meaningful impetus to the safe-haven commodity.
Gold price could consolidate further before the next leg up; bullish bias remains
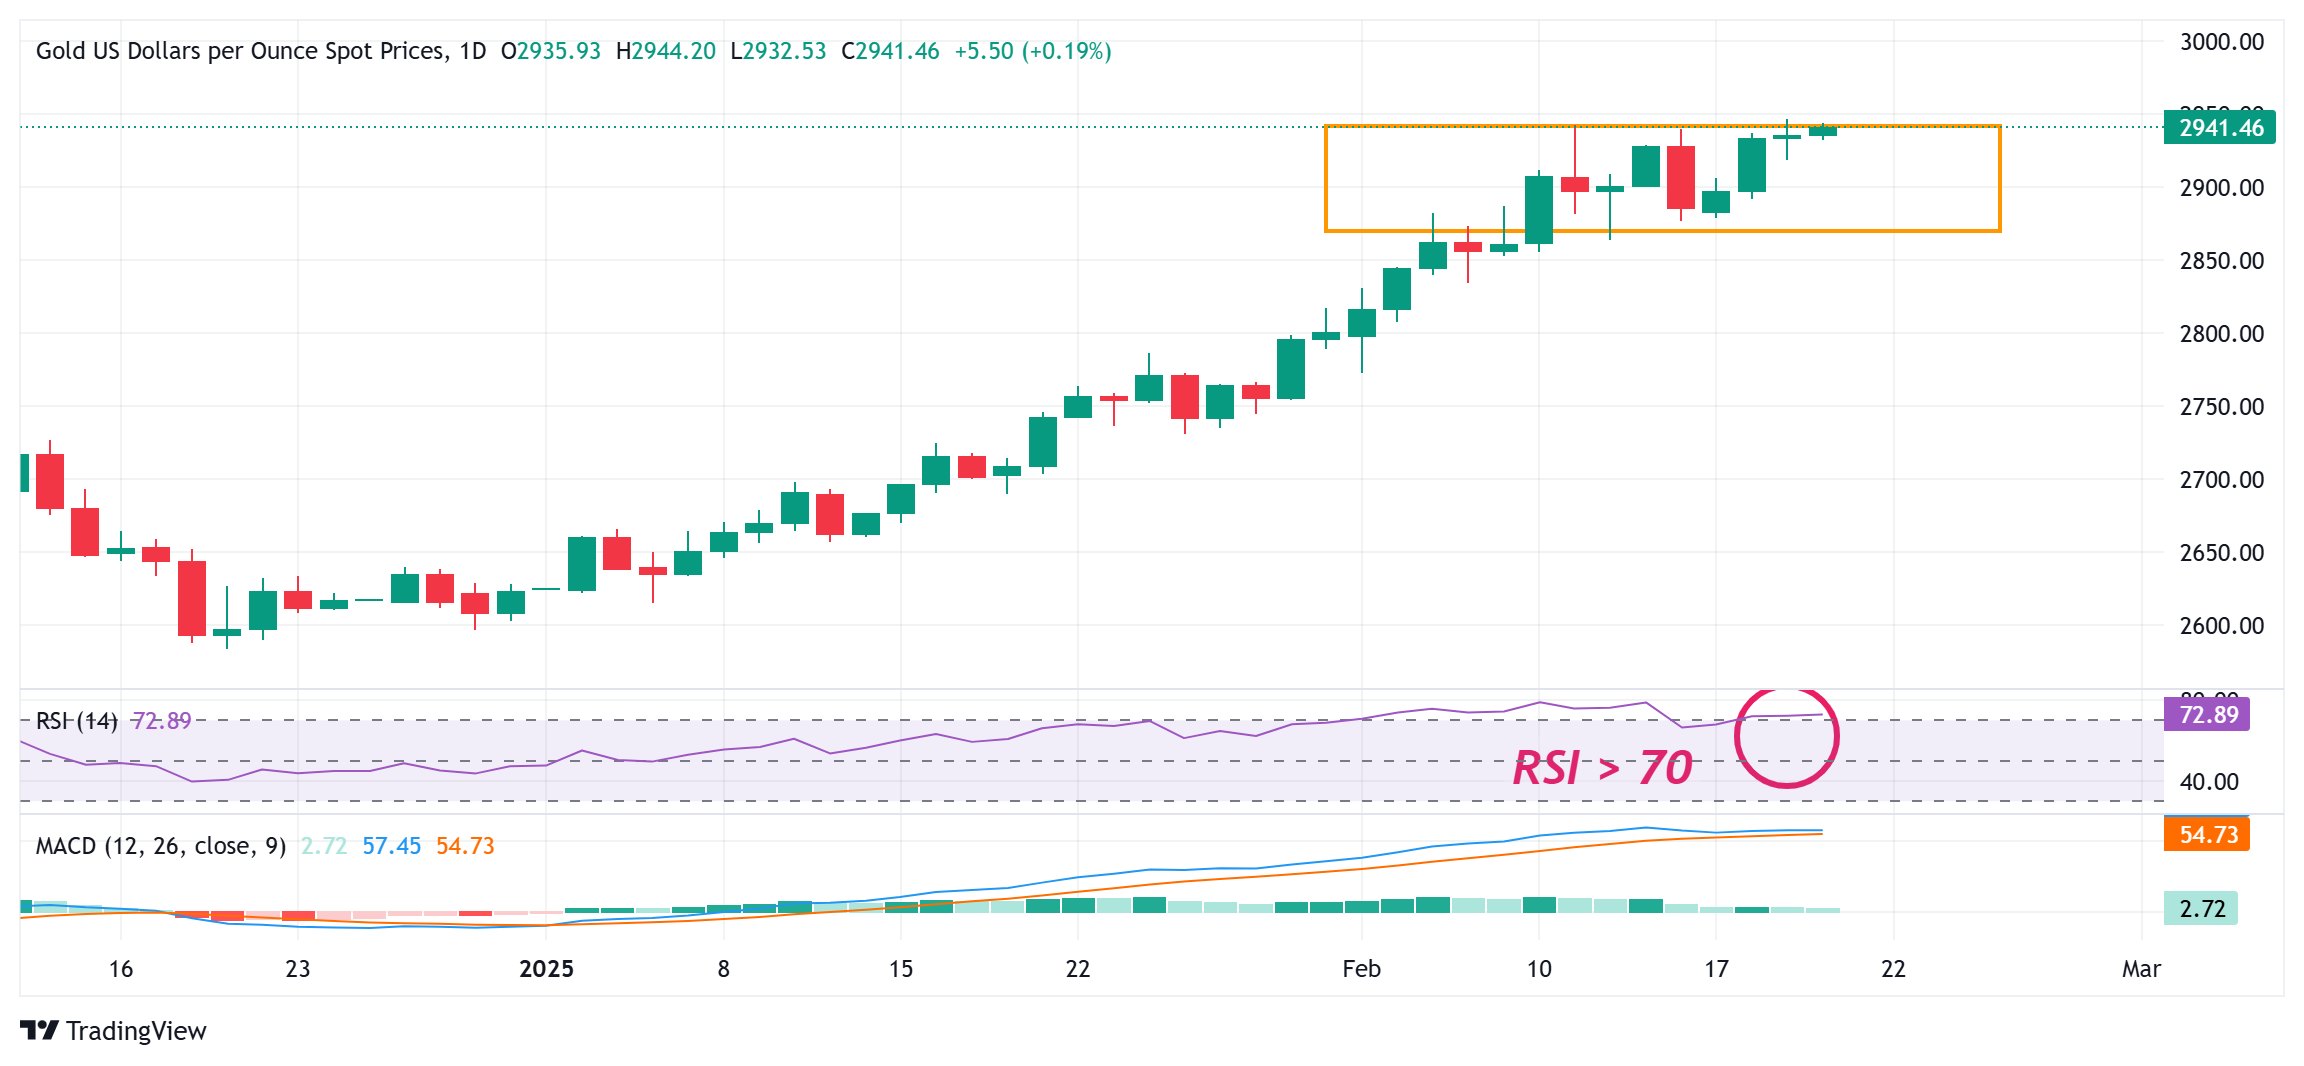
From a technical perspective, the daily Relative Strength Index (RSI) is holding above the 70 mark and warrants some caution for bullish traders. This, in turn, suggests that the Gold price is more likely to extend over a one-week-old range-bound price action. Nevertheless, the near-term bias remains tilted firmly in favor of bullish traders and suggests that the path of least resistance for the XAU/USD pair remains to the upside. A sustained strength beyond the $2,945-2,950 area will mark a fresh breakout through a short-term range and a consolidation phase. This would set the stage for an extension of a well-established uptrend witnessed over the past two months or so.
Meanwhile, any corrective pullback below the $2,928 immediate support could be seen as a buying opportunity near the $2,918 region, or the overnight swing low, and remain limited near the $2,900 mark. This is followed by the $2,880 horizontal support, which if broken decisively could drag the Gold price to the $2,860-2,855 area en route to the $2,834 zone. Some follow-through selling should pave the way for a fall toward the $2,815 region before the XAU/USD pair eventually drops to the $2,800 mark and the next relevant support near the $2,785-2,784 area.
Gold FAQs
Gold has played a key role in human’s history as it has been widely used as a store of value and medium of exchange. Currently, apart from its shine and usage for jewelry, the precious metal is widely seen as a safe-haven asset, meaning that it is considered a good investment during turbulent times. Gold is also widely seen as a hedge against inflation and against depreciating currencies as it doesn’t rely on any specific issuer or government.
Central banks are the biggest Gold holders. In their aim to support their currencies in turbulent times, central banks tend to diversify their reserves and buy Gold to improve the perceived strength of the economy and the currency. High Gold reserves can be a source of trust for a country’s solvency. Central banks added 1,136 tonnes of Gold worth around $70 billion to their reserves in 2022, according to data from the World Gold Council. This is the highest yearly purchase since records began. Central banks from emerging economies such as China, India and Turkey are quickly increasing their Gold reserves.
Gold has an inverse correlation with the US Dollar and US Treasuries, which are both major reserve and safe-haven assets. When the Dollar depreciates, Gold tends to rise, enabling investors and central banks to diversify their assets in turbulent times. Gold is also inversely correlated with risk assets. A rally in the stock market tends to weaken Gold price, while sell-offs in riskier markets tend to favor the precious metal.
The price can move due to a wide range of factors. Geopolitical instability or fears of a deep recession can quickly make Gold price escalate due to its safe-haven status. As a yield-less asset, Gold tends to rise with lower interest rates, while higher cost of money usually weighs down on the yellow metal. Still, most moves depend on how the US Dollar (USD) behaves as the asset is priced in dollars (XAU/USD). A strong Dollar tends to keep the price of Gold controlled, whereas a weaker Dollar is likely to push Gold prices up.
-
04:13
USD/CAD steadies above 1.4200, upside seems possible due to new Trump tariffs
- USD/CAD could increase further due to fresh tariffs from US President Donald Trump.
- The latest FOMC Meeting Minutes emphasized needing more time to assess multiple factors before considering any rate adjustments.
- The Bank of Canada may rethink its approach to policy easing after January’s inflation data indicated an upward trend.
USD/CAD remains steady after two successive days of gains, trading around 1.4230 during the Asian hours on Thursday. The upside of the pair is attributed to concerns over tariffs from US President Donald Trump, who has confirmed that a 25% tariff on pharmaceutical and semiconductor imports will take effect in April. Additionally, Trump reaffirmed that auto tariffs will remain at 25%, further escalating global trade tensions.
Market participants are now focused on key US economic data, including weekly Initial Jobless Claims, the CB Leading Economic Index, and the Philly Fed Manufacturing Index, set to be released during the North American session.
The Federal Open Market Committee (FOMC) Meeting Minutes for January’s policy meeting, published on Wednesday, reaffirmed the decision to keep interest rates unchanged in January. Policymakers emphasized the need for more time to assess economic activity, labor market trends, and inflation before considering any rate adjustments. The committee also agreed that clear signs of declining inflation are necessary before implementing rate cuts.
The Bank of Canada (BoC) may reconsider easing policy after January’s inflation data showed an uptick, data showed on Tuesday. Canada’s headline CPI inflation rose to 1.9% year-over-year, aligning with forecasts and increasing from the previous 1.8%. Meanwhile, core BoC CPI inflation accelerated to 2.1% YoY, up from 1.8%, marking its fastest pace in nearly a year.
Following the CPI release, market expectations for a 25-basis-point rate cut at the BoC’s March 12 policy meeting dropped to below 30%. “There is too much underlying inflationary pressure in Canada to warrant an inflation-targeting central bank easing monetary policy further,” wrote Scotiabank’s Derek Holt.
Canadian Dollar FAQs
The key factors driving the Canadian Dollar (CAD) are the level of interest rates set by the Bank of Canada (BoC), the price of Oil, Canada’s largest export, the health of its economy, inflation and the Trade Balance, which is the difference between the value of Canada’s exports versus its imports. Other factors include market sentiment – whether investors are taking on more risky assets (risk-on) or seeking safe-havens (risk-off) – with risk-on being CAD-positive. As its largest trading partner, the health of the US economy is also a key factor influencing the Canadian Dollar.
The Bank of Canada (BoC) has a significant influence on the Canadian Dollar by setting the level of interest rates that banks can lend to one another. This influences the level of interest rates for everyone. The main goal of the BoC is to maintain inflation at 1-3% by adjusting interest rates up or down. Relatively higher interest rates tend to be positive for the CAD. The Bank of Canada can also use quantitative easing and tightening to influence credit conditions, with the former CAD-negative and the latter CAD-positive.
The price of Oil is a key factor impacting the value of the Canadian Dollar. Petroleum is Canada’s biggest export, so Oil price tends to have an immediate impact on the CAD value. Generally, if Oil price rises CAD also goes up, as aggregate demand for the currency increases. The opposite is the case if the price of Oil falls. Higher Oil prices also tend to result in a greater likelihood of a positive Trade Balance, which is also supportive of the CAD.
While inflation had always traditionally been thought of as a negative factor for a currency since it lowers the value of money, the opposite has actually been the case in modern times with the relaxation of cross-border capital controls. Higher inflation tends to lead central banks to put up interest rates which attracts more capital inflows from global investors seeking a lucrative place to keep their money. This increases demand for the local currency, which in Canada’s case is the Canadian Dollar.
Macroeconomic data releases gauge the health of the economy and can have an impact on the Canadian Dollar. Indicators such as GDP, Manufacturing and Services PMIs, employment, and consumer sentiment surveys can all influence the direction of the CAD. A strong economy is good for the Canadian Dollar. Not only does it attract more foreign investment but it may encourage the Bank of Canada to put up interest rates, leading to a stronger currency. If economic data is weak, however, the CAD is likely to fall.
-
04:04
USD/INR flat lines as investors await fresh catalysts
- The Indian Rupee steadies in Thursday’s Asian session.
- Trump tariff threats and persistent outflows from Indian stocks weigh on the INR.
- RBI intervention and lower crude oil prices might cap the downside for the local currency.
The Indian Rupee (INR) is holding steady on Thursday. Concerns over the impact of trade tariffs and Foreign Portfolio Investment (FPI) outflows could exert some selling pressure on the local currency. FPIs sold more than $10 billion worth of Indian equities in the first six weeks of 2025, the largest outflow ever recorded during this time. This enormous selloff has resulted in the worst start for domestic markets in over a decade.
Nonetheless, the potential US Dollar (USD) selling intervention by the Reserve Bank of India (RBI) and a decline in crude oil prices might help limit the INR’s losses. Traders will keep an eye on the US weekly Initial Jobless Claims, the CB Leading Economic Index and the Philly Fed Manufacturing Index reports, which will be released later on Thursday. Also, the Federal Reserve’s (Fed) Austan Goolsbee, Michael Barr and Alberto Musalem are scheduled to speak on Thursday.Indian Rupee trades sideways amid heightened global market volatility
- The RBI’s foreign exchange reserves have declined sharply by over $75 billion since September 27, while the INR depreciated from 83.70 to 87.96 against the USD on February 10.
- India’s Gross Domestic Product (GDP) is estimated to grow at 6.6% in the October-December quarter of 2024-25, down from 8.6% recorded in the same period of 2023-24, the Bank of Baroda showed Tuesday.
- The minutes from the FOMC meeting released on Wednesday indicated that the Fed policymakers believe that it is well positioned to take time to assess the outlook for economic activity, the labor market and inflation.
- Fed officials agreed that inflation must show clear signs of slowing down before any further rate reductions can be made.
- Fed Vice Chairman Philip Jefferson said late Wednesday the US central bank has time to weigh its next interest rate decision move, citing a robust economy and still above-target inflation, per Reuters.
- Chicago Fed President Austan Goolsbee stated that inflation has fallen but is still too high, adding that once inflation falls, the interest rates can fall more.
USD/INR keeps the bullish vibe despite consolidation in the near term
The Indian Rupee trades flat on the day. The bullish tone of the USD/INR pair remains in play as the pair holds above the key 100-day Exponential Moving Average (EMA) on the daily chart. The 14-day Relative Strength Index (RSI) stands above the midline near 55.50, supporting the buyers in the near term.
The first upside barrier for USD/INR is located at the 87.00 psychological level. Bullish candlesticks past the mentioned level could see a rally to an all-time high near 88.00, en route to 88.50.
In the bearish case, the initial support level to watch is 86.58, the low of February 17. The additional downside target emerges at 86.35, the low of February 12, followed by 86.14, the low of January 27.Indian Rupee FAQs
The Indian Rupee (INR) is one of the most sensitive currencies to external factors. The price of Crude Oil (the country is highly dependent on imported Oil), the value of the US Dollar – most trade is conducted in USD – and the level of foreign investment, are all influential. Direct intervention by the Reserve Bank of India (RBI) in FX markets to keep the exchange rate stable, as well as the level of interest rates set by the RBI, are further major influencing factors on the Rupee.
The Reserve Bank of India (RBI) actively intervenes in forex markets to maintain a stable exchange rate, to help facilitate trade. In addition, the RBI tries to maintain the inflation rate at its 4% target by adjusting interest rates. Higher interest rates usually strengthen the Rupee. This is due to the role of the ‘carry trade’ in which investors borrow in countries with lower interest rates so as to place their money in countries’ offering relatively higher interest rates and profit from the difference.
Macroeconomic factors that influence the value of the Rupee include inflation, interest rates, the economic growth rate (GDP), the balance of trade, and inflows from foreign investment. A higher growth rate can lead to more overseas investment, pushing up demand for the Rupee. A less negative balance of trade will eventually lead to a stronger Rupee. Higher interest rates, especially real rates (interest rates less inflation) are also positive for the Rupee. A risk-on environment can lead to greater inflows of Foreign Direct and Indirect Investment (FDI and FII), which also benefit the Rupee.
Higher inflation, particularly, if it is comparatively higher than India’s peers, is generally negative for the currency as it reflects devaluation through oversupply. Inflation also increases the cost of exports, leading to more Rupees being sold to purchase foreign imports, which is Rupee-negative. At the same time, higher inflation usually leads to the Reserve Bank of India (RBI) raising interest rates and this can be positive for the Rupee, due to increased demand from international investors. The opposite effect is true of lower inflation.
-
03:51
US President Trump: Looking at a 25% tariff for lumber and forest products
US President Donald Trump is making some repeated comments early Thursday as markets remain on a cautious footing.
Key quotes
Greenland is needed from a point of security.
Expect China's President Xi Jinping to visit.
Going to resurrect a critical mineral deal with Ukraine.
We can make a deal with Russia.
Speaking to China on Tiktok.
Would not consider buying a plane from Airbus.
Market reaction
These comments fail to lift the sentiment around the safe-haven US Dollar against its major peers. At the press time, the US Dollar Index loses 0.17% on the day to trade near 107.00.
US-China Trade War FAQs
Generally speaking, a trade war is an economic conflict between two or more countries due to extreme protectionism on one end. It implies the creation of trade barriers, such as tariffs, which result in counter-barriers, escalating import costs, and hence the cost of living.
An economic conflict between the United States (US) and China began early in 2018, when President Donald Trump set trade barriers on China, claiming unfair commercial practices and intellectual property theft from the Asian giant. China took retaliatory action, imposing tariffs on multiple US goods, such as automobiles and soybeans. Tensions escalated until the two countries signed the US-China Phase One trade deal in January 2020. The agreement required structural reforms and other changes to China’s economic and trade regime and pretended to restore stability and trust between the two nations. However, the Coronavirus pandemic took the focus out of the conflict. Yet, it is worth mentioning that President Joe Biden, who took office after Trump, kept tariffs in place and even added some additional levies.
The return of Donald Trump to the White House as the 47th US President has sparked a fresh wave of tensions between the two countries. During the 2024 election campaign, Trump pledged to impose 60% tariffs on China once he returned to office, which he did on January 20, 2025. With Trump back, the US-China trade war is meant to resume where it was left, with tit-for-tat policies affecting the global economic landscape amid disruptions in global supply chains, resulting in a reduction in spending, particularly investment, and directly feeding into the Consumer Price Index inflation.
-
03:46
RBA’s Hauser: Policy is still restrictive
Speaking to Bloomberg News on Thursday, Reserve Bank of Australia (RBA) Deputy Governor Andrew Hauser said the central bank’s “policy is still restrictive.”
Additional quotes
Hard to see bad news in the latest jobs data.
No single piece of data will trigger a rate decision.
Monthly CPI data in Australia is incomplete, have to wait for quarterly data.
Market curve assumes there will be three or four more cuts, RBA is not so sure.
Models show inflation will undershoot mid point of band even if interest rates held constant.
RBA focus is still on inflation.
Global economy is a risk - uncertainty may weigh on Australian economy.
Market reaction
At the press time, AUD/USD is holding steady at around 0.6350.
RBA FAQs
The Reserve Bank of Australia (RBA) sets interest rates and manages monetary policy for Australia. Decisions are made by a board of governors at 11 meetings a year and ad hoc emergency meetings as required. The RBA’s primary mandate is to maintain price stability, which means an inflation rate of 2-3%, but also “..to contribute to the stability of the currency, full employment, and the economic prosperity and welfare of the Australian people.” Its main tool for achieving this is by raising or lowering interest rates. Relatively high interest rates will strengthen the Australian Dollar (AUD) and vice versa. Other RBA tools include quantitative easing and tightening.
While inflation had always traditionally been thought of as a negative factor for currencies since it lowers the value of money in general, the opposite has actually been the case in modern times with the relaxation of cross-border capital controls. Moderately higher inflation now tends to lead central banks to put up their interest rates, which in turn has the effect of attracting more capital inflows from global investors seeking a lucrative place to keep their money. This increases demand for the local currency, which in the case of Australia is the Aussie Dollar.
Macroeconomic data gauges the health of an economy and can have an impact on the value of its currency. Investors prefer to invest their capital in economies that are safe and growing rather than precarious and shrinking. Greater capital inflows increase the aggregate demand and value of the domestic currency. Classic indicators, such as GDP, Manufacturing and Services PMIs, employment, and consumer sentiment surveys can influence AUD. A strong economy may encourage the Reserve Bank of Australia to put up interest rates, also supporting AUD.
Quantitative Easing (QE) is a tool used in extreme situations when lowering interest rates is not enough to restore the flow of credit in the economy. QE is the process by which the Reserve Bank of Australia (RBA) prints Australian Dollars (AUD) for the purpose of buying assets – usually government or corporate bonds – from financial institutions, thereby providing them with much-needed liquidity. QE usually results in a weaker AUD.
Quantitative tightening (QT) is the reverse of QE. It is undertaken after QE when an economic recovery is underway and inflation starts rising. Whilst in QE the Reserve Bank of Australia (RBA) purchases government and corporate bonds from financial institutions to provide them with liquidity, in QT the RBA stops buying more assets, and stops reinvesting the principal maturing on the bonds it already holds. It would be positive (or bullish) for the Australian Dollar.
-
03:30
Commodities. Daily history for Wednesday, February 19, 2025
Raw materials Closed Change, % Silver 32.696 -0.6 Gold 2933 -0.07 Palladium 970.85 -1.22 -
03:23
Japanese Yen buying remains unabated; USD/JPY dives to mid-150.00s
- The Japanese Yen continues to strengthen amid rising bets for additional BoJ rate hikes.
- Trump’s tariff threats weigh on investors’ sentiment but also benefit the safe-haven JPY.
- The Fed's hawkish outlook fails to impress the USD bulls or lend support to USD/JPY.
The Japanese Yen (JPY) gained strong follow-through traction on Thursday and dragged the USD/JPY pair to its lowest level since December 9, around mid-150.00s during the Asian session. Firming expectations that the Bank of Japan (BoJ) would increase interest rates further push the Japanese government bond (JGB) yields to their highest levels in more than a decade. The resultant narrowing of the rate differential between Japan and other countries turns out to be a key factor that continues to drive flows toward the lower-yielding JPY.
Meanwhile, US President Donald Trump's fresh tariff threats dampen investors' appetite for riskier assets. This is evident from a fresh leg down in the equity markets and further underpins demand for the safe-haven JPY. The US Dollar (USD), on the other hand, struggles to lure buyers despite hawkish FOMC meeting minutes released on Wednesday, which further contributes to the USD/JPY pair's decline. With the latest leg down, the currency pair confirms a breakdown below the 151.00 mark and seems vulnerable to weaken further.
Japanese Yen continues to draw support from hawkish BoJ-inspired rise in JGB yields
- Bank of Japan board member Hajime Takata said on Wednesday that Japan's real interest rates remain deeply negative and the central bank must adjust the degree of monetary support further if the economy moves in line with forecasts.
- This comes on top of Japan's upbeat Q4 Gross Domestic Product (GDP) on Monday and cements expectations that the BoJ would hike interest rates further, which continues to push the Japanese government bond (JGB) yields higher.
- The yield on the benchmark 10-year JGB hits its highest since November 2009, which, in turn, provides a strong boost to the Japanese Yen during the Asian session on Thursday amid a fresh wave of the global risk aversion trade.
- US President Donald Trump said on Wednesday that he will announce tariffs on a number of products next month or even sooner, fueling concerns about a global trade war and tempering investors' appetite for riskier assets.
- The Asahi newspaper reported this Thursday that Japan's Trade Minister, Yoji Muto, is planning a trip to the US in March to request that the Trump administration exempt Japan from upcoming tariffs on steel and automobiles.
- Minutes from the January FOMC meeting released on Wednesday revealed that officials noted a high degree of uncertainty that requires the central bank to take a careful approach in considering any further interest rate cuts.
- Fed Vice Chairman Philip Jefferson noted that the US economic performance has been quite strong, the US labor market is solid, inflation has eased but is still elevated, and the path back to 2% inflation could be bumpy.
- Separately, Chicago Fed President Austan Goolsbee said that inflation has decreased but it is still excessive and once inflation falls, rates can fall more. This, however, does little to provide any meaningful impetus to the US Dollar.
- Thursday's US economic docket features the release of Weekly Initial Jobless Claims and the Philly Fed Manufacturing Index. Apart from this, speeches by influential FOMC members will drive the USD and the USD/JPY pair.
USD/JPY seems vulnerable to slide further; 151.00-150.90 support breakdown in play
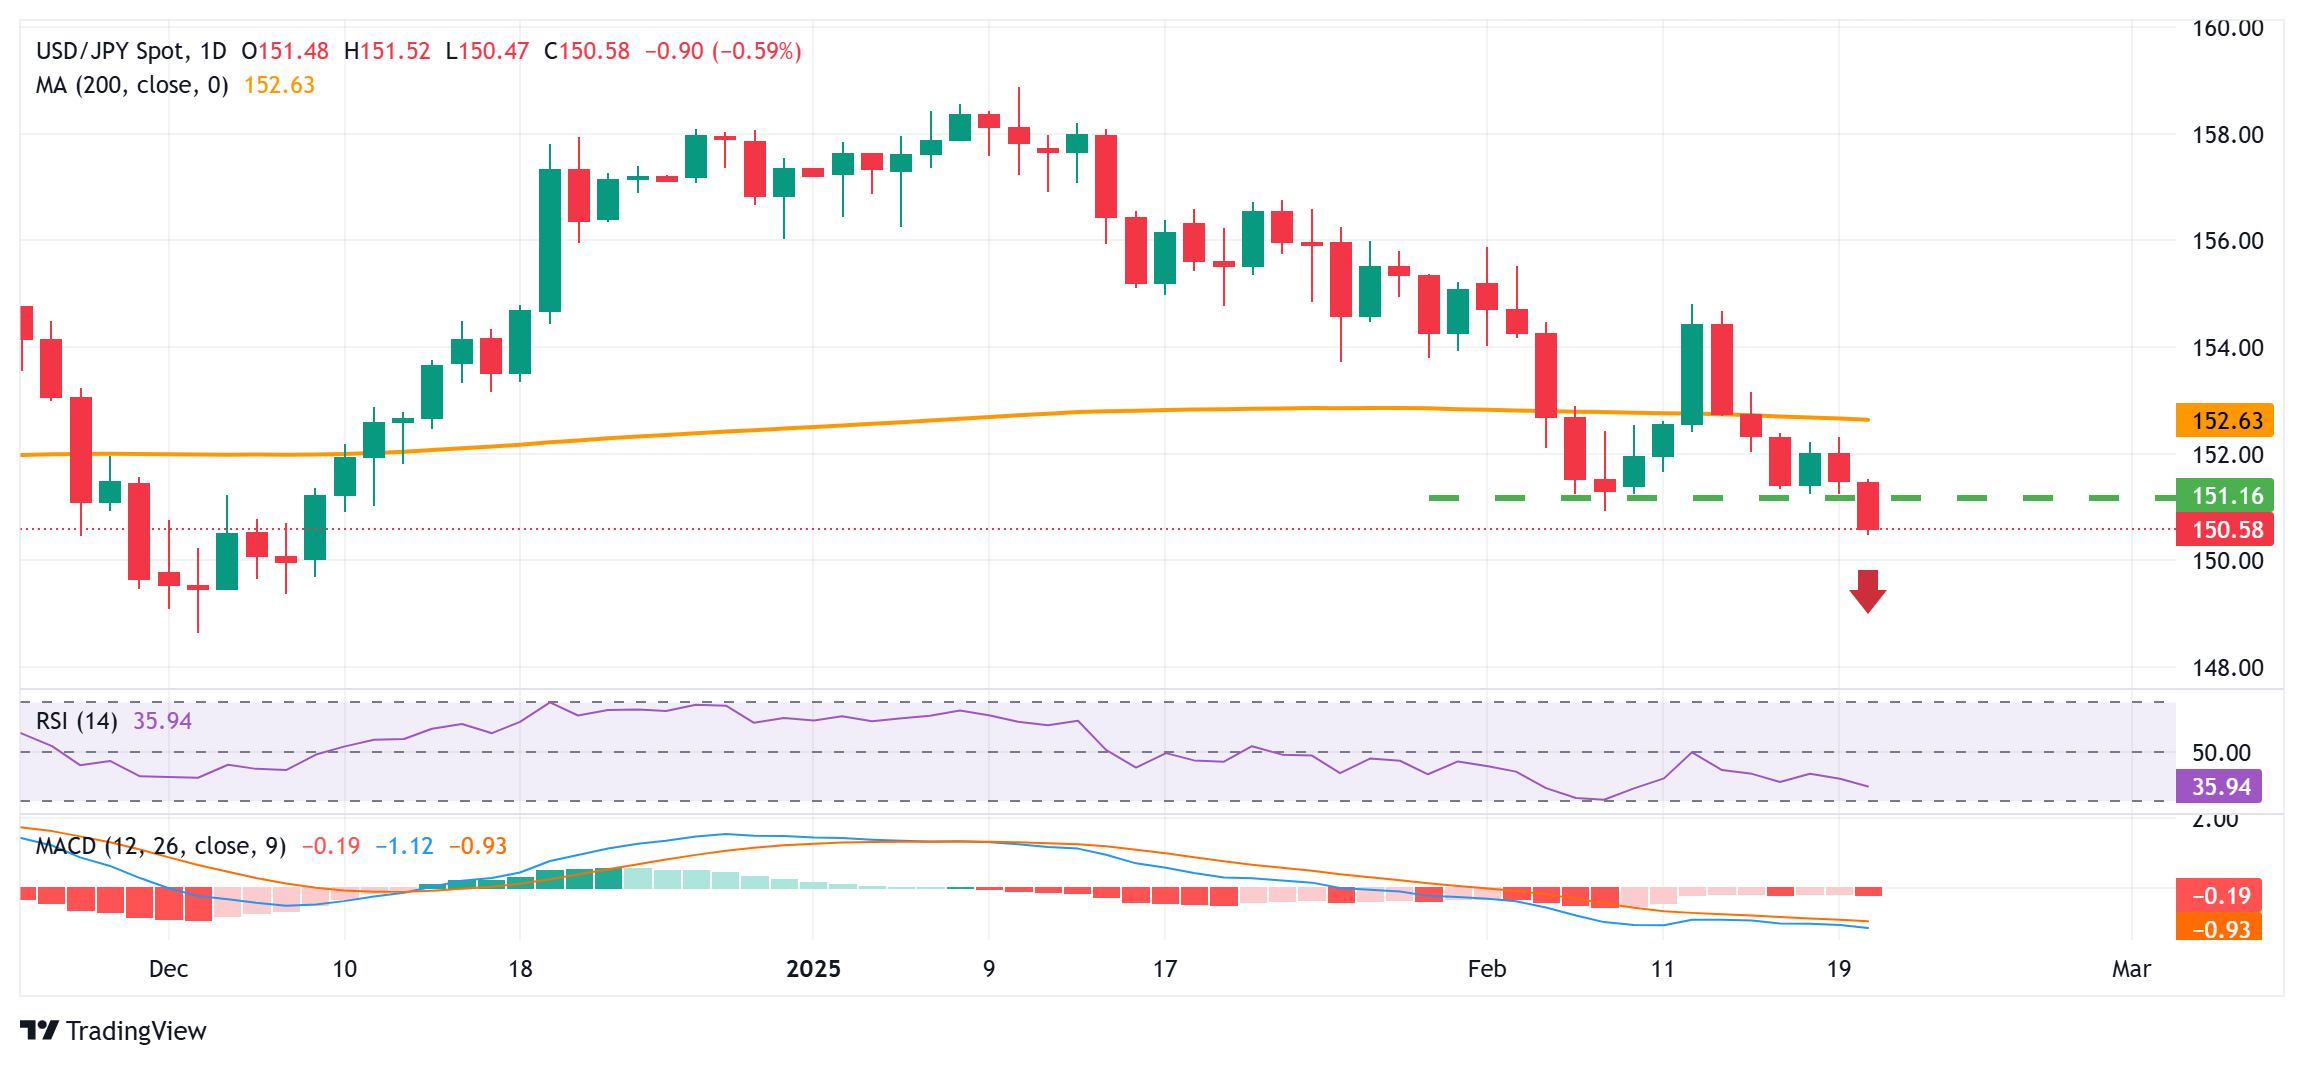
From a technical perspective, a sustained break and acceptance below the 151.00 mark could be seen as a fresh trigger for bearish traders. Moreover, oscillators on the daily chart are holding deep in negative territory and are still away from being in the oversold zone. This, in turn, suggests that the path of least resistance for the USD/JPY pair is to the downside and supports prospects for a slide toward the 150.00 psychological mark. The downward trajectory could extend further towards the 149.60-149.55 region en route to the 149.00 mark and the December 2024 low, around the 148.65 region.
On the flip side, the 150.90-151.00 horizontal support breakpoint now seems to act as an immediate hurdle, above which a bout of a short-covering could lift the USD/JPY pair to the 151.40 hurdle. Any further move up could be seen as a selling opportunity around the 152.00 round-figure mark and runs the risk of fizzling out rather quickly near the 152.65 area. The latter represents the very important 200-day Simple Moving Average (SMA) and should act as a key pivotal point for short-term traders.
Japanese Yen FAQs
The Japanese Yen (JPY) is one of the world’s most traded currencies. Its value is broadly determined by the performance of the Japanese economy, but more specifically by the Bank of Japan’s policy, the differential between Japanese and US bond yields, or risk sentiment among traders, among other factors.
One of the Bank of Japan’s mandates is currency control, so its moves are key for the Yen. The BoJ has directly intervened in currency markets sometimes, generally to lower the value of the Yen, although it refrains from doing it often due to political concerns of its main trading partners. The BoJ ultra-loose monetary policy between 2013 and 2024 caused the Yen to depreciate against its main currency peers due to an increasing policy divergence between the Bank of Japan and other main central banks. More recently, the gradually unwinding of this ultra-loose policy has given some support to the Yen.
Over the last decade, the BoJ’s stance of sticking to ultra-loose monetary policy has led to a widening policy divergence with other central banks, particularly with the US Federal Reserve. This supported a widening of the differential between the 10-year US and Japanese bonds, which favored the US Dollar against the Japanese Yen. The BoJ decision in 2024 to gradually abandon the ultra-loose policy, coupled with interest-rate cuts in other major central banks, is narrowing this differential.
The Japanese Yen is often seen as a safe-haven investment. This means that in times of market stress, investors are more likely to put their money in the Japanese currency due to its supposed reliability and stability. Turbulent times are likely to strengthen the Yen’s value against other currencies seen as more risky to invest in.
-
03:17
Australian Dollar depreciates following employment data, China’s policy decision
- The Australian Dollar depreciates due to the latest Trump tariffs and cautious FOMC Minutes.
- Australia’s Unemployment Rate increased to 4.1% in January from 4.0% in December, as expected.
- President Trump has confirmed plans to impose a 25% tariff on imports of automobiles, semiconductors, and pharmaceutical products.
The Australian Dollar (AUD) extends its losses against the US Dollar (USD) following the release of domestic employment data and China’s interest rate decision on Thursday. However, the AUD/USD pair faced headwinds as risk aversion increased due to concerns over the latest tariffs from US President Donald Trump and a cautious tone in the Federal Open Market Committee (FOMC) Minutes from January’s policy meeting.
On Thursday, the Australian Bureau of Statistics (ABS) reported that Australia’s seasonally adjusted Unemployment Rate rose to 4.1% in January from 4.0% in December, aligning with market expectations. Additionally, Employment Change came in at 44K for January, down from a revised 60K in December (previously 56.3K), but still exceeding the consensus forecast of 20K.
The People’s Bank of China (PBOC) opted to keep its Loan Prime Rates (LPRs) unchanged, with the one-year and five-year rates remaining at 3.10% and 3.60%, respectively.
The AUD faced downward pressure after the Reserve Bank of Australia (RBA) lowered its Official Cash Rate (OCR) by 25 basis points to 4.10% on Tuesday—the first rate cut in four years. RBA Governor Michele Bullock acknowledged the impact of high interest rates but cautioned that it was too soon to declare victory over inflation. She also emphasized the strength of the labor market and clarified that future rate cuts are not guaranteed, despite market expectations.
Australian Dollar declines due to Trump tariffs, FOMC Minutes
- The US Dollar Index (DXY), which measures the USD against six major currencies, hovers around 107.00. Meanwhile, US Treasury yields stand at 4.26% for the 2-year note and 4.52% for the 10-year note at the time of writing.
- The latest Federal Open Market Committee (FOMC) Meeting Minutes reaffirmed the decision to keep interest rates unchanged in January. Policymakers emphasized the need for more time to assess economic activity, labor market trends, and inflation before considering any rate adjustments. The committee also agreed that clear signs of declining inflation are necessary before implementing rate cuts.
- President Trump has confirmed that a 25% tariff on pharmaceutical and semiconductor imports will take effect in April. Additionally, he reaffirmed that auto tariffs will remain at 25%, further escalating global trade tensions.
- "So far, the dollar has tracked the path it had during the previous Trump administration...and we can pretty much agree that Trump is doing exactly what he said," said Chester Ntonifor, chief FX and global fixed income strategist, at BCA Research in Montreal.
- Federal Reserve Bank of Chicago President Austan Goolsbee stated late Wednesday that while inflation has declined, it remains elevated. Goolsbee emphasized that interest rates can be lowered further once inflation falls to a more acceptable level.
- San Francisco Fed President Mary Daly said on Tuesday that prospects of further rate cuts in 2025 remain uncertain despite an overall positive lean to US economic factors. Philadelphia Fed President Patrick Harker emphasized support for maintaining a steady interest rate policy, noting that inflation has remained elevated and persistent in recent months.
Technical Analysis: Australian Dollar tests nine-day EMA support
The AUD/USD pair hovers around 0.6330 on Thursday, trading within an ascending channel that suggests a bullish market sentiment. The 14-day Relative Strength Index (RSI) remains above 50, reinforcing the positive outlook.
On the upside, the AUD/USD pair could challenge the key psychological resistance at 0.6400, which aligns with the channel's upper boundary at 0.6410.
Immediate support is found at the nine-day Exponential Moving Average (EMA) of 0.6326, followed by the 14-day EMA at 0.6311. A stronger support zone lies near the channel's lower boundary at 0.6300.
AUD/USD: Daily Chart
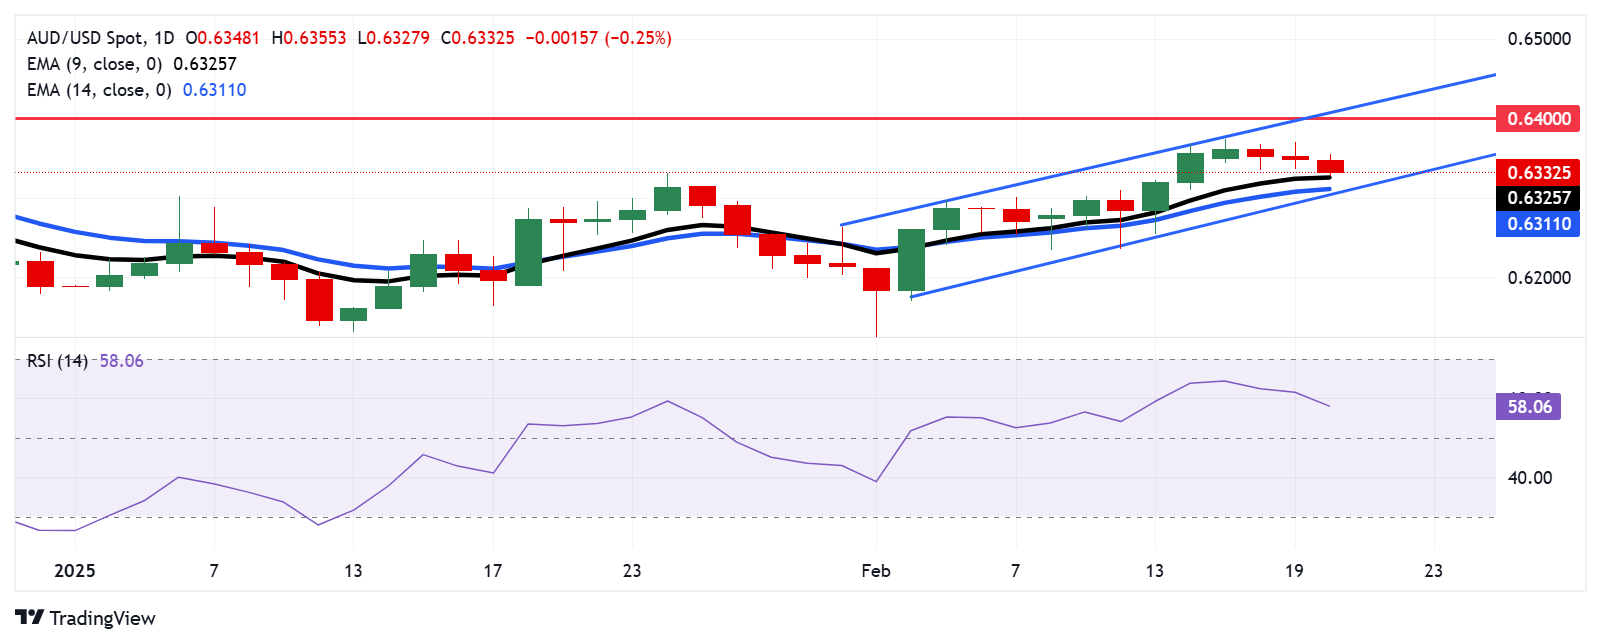
Australian Dollar PRICE Today
The table below shows the percentage change of Australian Dollar (AUD) against listed major currencies today. Australian Dollar was the weakest against the Japanese Yen.
USD EUR GBP JPY CAD AUD NZD CHF USD -0.03% 0.00% -0.62% 0.04% 0.14% 0.01% -0.13% EUR 0.03% 0.02% -0.63% 0.07% 0.16% 0.04% -0.12% GBP -0.00% -0.02% -0.64% 0.04% 0.13% 0.01% -0.13% JPY 0.62% 0.63% 0.64% 0.68% 0.77% 0.60% 0.49% CAD -0.04% -0.07% -0.04% -0.68% 0.11% -0.03% -0.16% AUD -0.14% -0.16% -0.13% -0.77% -0.11% -0.12% -0.28% NZD -0.01% -0.04% -0.01% -0.60% 0.03% 0.12% -0.15% CHF 0.13% 0.12% 0.13% -0.49% 0.16% 0.28% 0.15% The heat map shows percentage changes of major currencies against each other. The base currency is picked from the left column, while the quote currency is picked from the top row. For example, if you pick the Australian Dollar from the left column and move along the horizontal line to the US Dollar, the percentage change displayed in the box will represent AUD (base)/USD (quote).
Australian Dollar FAQs
One of the most significant factors for the Australian Dollar (AUD) is the level of interest rates set by the Reserve Bank of Australia (RBA). Because Australia is a resource-rich country another key driver is the price of its biggest export, Iron Ore. The health of the Chinese economy, its largest trading partner, is a factor, as well as inflation in Australia, its growth rate and Trade Balance. Market sentiment – whether investors are taking on more risky assets (risk-on) or seeking safe-havens (risk-off) – is also a factor, with risk-on positive for AUD.
The Reserve Bank of Australia (RBA) influences the Australian Dollar (AUD) by setting the level of interest rates that Australian banks can lend to each other. This influences the level of interest rates in the economy as a whole. The main goal of the RBA is to maintain a stable inflation rate of 2-3% by adjusting interest rates up or down. Relatively high interest rates compared to other major central banks support the AUD, and the opposite for relatively low. The RBA can also use quantitative easing and tightening to influence credit conditions, with the former AUD-negative and the latter AUD-positive.
China is Australia’s largest trading partner so the health of the Chinese economy is a major influence on the value of the Australian Dollar (AUD). When the Chinese economy is doing well it purchases more raw materials, goods and services from Australia, lifting demand for the AUD, and pushing up its value. The opposite is the case when the Chinese economy is not growing as fast as expected. Positive or negative surprises in Chinese growth data, therefore, often have a direct impact on the Australian Dollar and its pairs.
Iron Ore is Australia’s largest export, accounting for $118 billion a year according to data from 2021, with China as its primary destination. The price of Iron Ore, therefore, can be a driver of the Australian Dollar. Generally, if the price of Iron Ore rises, AUD also goes up, as aggregate demand for the currency increases. The opposite is the case if the price of Iron Ore falls. Higher Iron Ore prices also tend to result in a greater likelihood of a positive Trade Balance for Australia, which is also positive of the AUD.
The Trade Balance, which is the difference between what a country earns from its exports versus what it pays for its imports, is another factor that can influence the value of the Australian Dollar. If Australia produces highly sought after exports, then its currency will gain in value purely from the surplus demand created from foreign buyers seeking to purchase its exports versus what it spends to purchase imports. Therefore, a positive net Trade Balance strengthens the AUD, with the opposite effect if the Trade Balance is negative.
-
03:11
US Commerce Sec. Lutnick: Trump’s goal is to abolish Internal Revenue Service and let all outsiders pay
US Commerce Secretary Howard Lutnick said in a Fox News interview late Wednesday commented on US President Donald Trump’s tariff plans.
Lutnick said, “his goal is simple: to abolish the Internal Revenue Service and let all the outsiders pay.”
Market reaction
The above comments briefly put a fresh bid under the US Dollar Index (DXY) before sellers returned to knock it off to near 107.00, as of writing.
Tariffs FAQs
Tariffs are customs duties levied on certain merchandise imports or a category of products. Tariffs are designed to help local producers and manufacturers be more competitive in the market by providing a price advantage over similar goods that can be imported. Tariffs are widely used as tools of protectionism, along with trade barriers and import quotas.
Although tariffs and taxes both generate government revenue to fund public goods and services, they have several distinctions. Tariffs are prepaid at the port of entry, while taxes are paid at the time of purchase. Taxes are imposed on individual taxpayers and businesses, while tariffs are paid by importers.
There are two schools of thought among economists regarding the usage of tariffs. While some argue that tariffs are necessary to protect domestic industries and address trade imbalances, others see them as a harmful tool that could potentially drive prices higher over the long term and lead to a damaging trade war by encouraging tit-for-tat tariffs.
During the run-up to the presidential election in November 2024, Donald Trump made it clear that he intends to use tariffs to support the US economy and American producers. In 2024, Mexico, China and Canada accounted for 42% of total US imports. In this period, Mexico stood out as the top exporter with $466.6 billion, according to the US Census Bureau. Hence, Trump wants to focus on these three nations when imposing tariffs. He also plans to use the revenue generated through tariffs to lower personal income taxes.
-
02:55
NZD/USD weakens below 0.5700 on RBNZ’s dovish stance
- NZD/USD softens to around 0.5695 in Thursday’s Asian session.
- China’s central bank kept benchmark lending rates steady.
- Trump tariff threats could lift the US dollar and create a headwind for NZD/USD.
The NZD/USD pair trades on a negative note around 0.5695 during the Asian trading hours on Thursday. Traders brace for the US weekly Initial Jobless Claims, the CB Leading Economic Index and the Philly Fed Manufacturing Index reports, which are due later on Thursday.
On Thursday, the People’s Bank of China (PBOC) held the 1-year Loan Prime Rate (LPR) unchanged at 3.1% and the 5-year LPR at 3.6%. The Chinese authorities prioritize financial stability over interest rate easing to bolster the economy.
The Kiwi remains under selling pressure on the dovish stance of the Reserve Bank of New Zealand (RBNZ). The RBNZ cut its benchmark rate by 50 basis points (bps) to 3.75% at its February meeting on Wednesday. The central bank signaled further reductions in borrowing costs amid moderating inflation as policymakers sought to boost a struggling economy.
Meanwhile, the fresh US President Donald Trump tariff threats could boost the safe-haven flows, benefiting the Greenback in the near term. Since the inauguration last month, Trump has imposed a 10% tariff on all imports from China, on top of existing tariffs of up to 25%. Late Tuesday, Trump said that he would likely impose tariffs of around 25% on foreign cars, while semiconductor chips and drugs are set to face higher duties.New Zealand Dollar FAQs
The New Zealand Dollar (NZD), also known as the Kiwi, is a well-known traded currency among investors. Its value is broadly determined by the health of the New Zealand economy and the country’s central bank policy. Still, there are some unique particularities that also can make NZD move. The performance of the Chinese economy tends to move the Kiwi because China is New Zealand’s biggest trading partner. Bad news for the Chinese economy likely means less New Zealand exports to the country, hitting the economy and thus its currency. Another factor moving NZD is dairy prices as the dairy industry is New Zealand’s main export. High dairy prices boost export income, contributing positively to the economy and thus to the NZD.
The Reserve Bank of New Zealand (RBNZ) aims to achieve and maintain an inflation rate between 1% and 3% over the medium term, with a focus to keep it near the 2% mid-point. To this end, the bank sets an appropriate level of interest rates. When inflation is too high, the RBNZ will increase interest rates to cool the economy, but the move will also make bond yields higher, increasing investors’ appeal to invest in the country and thus boosting NZD. On the contrary, lower interest rates tend to weaken NZD. The so-called rate differential, or how rates in New Zealand are or are expected to be compared to the ones set by the US Federal Reserve, can also play a key role in moving the NZD/USD pair.
Macroeconomic data releases in New Zealand are key to assess the state of the economy and can impact the New Zealand Dollar’s (NZD) valuation. A strong economy, based on high economic growth, low unemployment and high confidence is good for NZD. High economic growth attracts foreign investment and may encourage the Reserve Bank of New Zealand to increase interest rates, if this economic strength comes together with elevated inflation. Conversely, if economic data is weak, NZD is likely to depreciate.
The New Zealand Dollar (NZD) tends to strengthen during risk-on periods, or when investors perceive that broader market risks are low and are optimistic about growth. This tends to lead to a more favorable outlook for commodities and so-called ‘commodity currencies’ such as the Kiwi. Conversely, NZD tends to weaken at times of market turbulence or economic uncertainty as investors tend to sell higher-risk assets and flee to the more-stable safe havens.
-
02:23
Fed's Goolsbee: Inflation has decreased but it is still excessive
Federal Reserve Bank of Chicago President Austan Goolsbee said late Wednesday that inflation has fallen but it is still too high.
Key quotes
Inflation has decreased but it is still excessive.
Once inflation falls, rates can fall more.Market reaction
At the time of writing, the US Dollar Index (DXY) is trading 0.13% lower on the day to trade at 107.05.
Fed FAQs
Monetary policy in the US is shaped by the Federal Reserve (Fed). The Fed has two mandates: to achieve price stability and foster full employment. Its primary tool to achieve these goals is by adjusting interest rates. When prices are rising too quickly and inflation is above the Fed’s 2% target, it raises interest rates, increasing borrowing costs throughout the economy. This results in a stronger US Dollar (USD) as it makes the US a more attractive place for international investors to park their money. When inflation falls below 2% or the Unemployment Rate is too high, the Fed may lower interest rates to encourage borrowing, which weighs on the Greenback.
The Federal Reserve (Fed) holds eight policy meetings a year, where the Federal Open Market Committee (FOMC) assesses economic conditions and makes monetary policy decisions. The FOMC is attended by twelve Fed officials – the seven members of the Board of Governors, the president of the Federal Reserve Bank of New York, and four of the remaining eleven regional Reserve Bank presidents, who serve one-year terms on a rotating basis.
In extreme situations, the Federal Reserve may resort to a policy named Quantitative Easing (QE). QE is the process by which the Fed substantially increases the flow of credit in a stuck financial system. It is a non-standard policy measure used during crises or when inflation is extremely low. It was the Fed’s weapon of choice during the Great Financial Crisis in 2008. It involves the Fed printing more Dollars and using them to buy high grade bonds from financial institutions. QE usually weakens the US Dollar.
Quantitative tightening (QT) is the reverse process of QE, whereby the Federal Reserve stops buying bonds from financial institutions and does not reinvest the principal from the bonds it holds maturing, to purchase new bonds. It is usually positive for the value of the US Dollar.
-
02:15
PBOC leaves Loan Prime Rates unchanged in February
The People’s Bank of China (PBOC), China's central bank, announced to leave its Loan Prime Rates (LPRs) unchanged on Thursday. The one-year and five-year LPRs were at 3.10% and 3.60%, respectively.
Market reaction
At the time of writing, AUD/USD is holding higher ground near 0.6350, up 0.05% on the day.
PBOC FAQs
The primary monetary policy objectives of the People's Bank of China (PBoC) are to safeguard price stability, including exchange rate stability, and promote economic growth. China’s central bank also aims to implement financial reforms, such as opening and developing the financial market.
The PBoC is owned by the state of the People's Republic of China (PRC), so it is not considered an autonomous institution. The Chinese Communist Party (CCP) Committee Secretary, nominated by the Chairman of the State Council, has a key influence on the PBoC’s management and direction, not the governor. However, Mr. Pan Gongsheng currently holds both of these posts.
Unlike the Western economies, the PBoC uses a broader set of monetary policy instruments to achieve its objectives. The primary tools include a seven-day Reverse Repo Rate (RRR), Medium-term Lending Facility (MLF), foreign exchange interventions and Reserve Requirement Ratio (RRR). However, The Loan Prime Rate (LPR) is China’s benchmark interest rate. Changes to the LPR directly influence the rates that need to be paid in the market for loans and mortgages and the interest paid on savings. By changing the LPR, China’s central bank can also influence the exchange rates of the Chinese Renminbi.
Yes, China has 19 private banks – a small fraction of the financial system. The largest private banks are digital lenders WeBank and MYbank, which are backed by tech giants Tencent and Ant Group, per The Straits Times. In 2014, China allowed domestic lenders fully capitalized by private funds to operate in the state-dominated financial sector.
-
02:15
PBOC sets USD/CNY reference rate at 7.1712 vs. 7.1705 previous
On Thursday, the People’s Bank of China (PBOC) set the USD/CNY central rate for the trading session ahead at 7.1712 as compared to the previous day's fix of 7.1705 and 7.2856 Reuters estimates.
PBOC FAQs
The primary monetary policy objectives of the People's Bank of China (PBoC) are to safeguard price stability, including exchange rate stability, and promote economic growth. China’s central bank also aims to implement financial reforms, such as opening and developing the financial market.
The PBoC is owned by the state of the People's Republic of China (PRC), so it is not considered an autonomous institution. The Chinese Communist Party (CCP) Committee Secretary, nominated by the Chairman of the State Council, has a key influence on the PBoC’s management and direction, not the governor. However, Mr. Pan Gongsheng currently holds both of these posts.
Unlike the Western economies, the PBoC uses a broader set of monetary policy instruments to achieve its objectives. The primary tools include a seven-day Reverse Repo Rate (RRR), Medium-term Lending Facility (MLF), foreign exchange interventions and Reserve Requirement Ratio (RRR). However, The Loan Prime Rate (LPR) is China’s benchmark interest rate. Changes to the LPR directly influence the rates that need to be paid in the market for loans and mortgages and the interest paid on savings. By changing the LPR, China’s central bank can also influence the exchange rates of the Chinese Renminbi.
Yes, China has 19 private banks – a small fraction of the financial system. The largest private banks are digital lenders WeBank and MYbank, which are backed by tech giants Tencent and Ant Group, per The Straits Times. In 2014, China allowed domestic lenders fully capitalized by private funds to operate in the state-dominated financial sector.
-
02:08
GBP/USD steadies near 1.2600, downside appears due to Trump’s tariff threats
- GBP/USD could struggle due to new tariff threats from US President Donald Trump.
- The latest FOMC Meeting Minutes emphasized needing more time to assess multiple factors before considering any rate adjustments.
- The British Pound struggled to gain traction despite a stronger-than-expected annual inflation rate.
GBP/USD holds ground after registering losses in the previous two successive days, hovering around 1.2590 during the Asian session on Thursday. However, the pair faces pressure as concerns over tariffs from US President Donald Trump lent support to the US Dollar (USD).
According to Bloomberg, Trump announced on Tuesday plans to impose a 25% tariff on foreign automobiles, alongside expected increases in duties on semiconductor chips and pharmaceuticals. An official announcement could come as early as April 2.
Market participants are now focused on key US economic data, including weekly Initial Jobless Claims, the CB Leading Economic Index, and the Philly Fed Manufacturing Index, set to be released during the North American session.
The Federal Open Market Committee (FOMC) Meeting Minutes for January’s policy meeting, published on Wednesday, reaffirmed the decision to keep interest rates unchanged in January. Policymakers emphasized the need for more time to assess economic activity, labor market trends, and inflation before considering any rate adjustments. The committee also agreed that clear signs of declining inflation are necessary before implementing rate cuts.
Despite a stronger-than-expected annual inflation rate released on Wednesday, the Pound Sterling (GBP) failed to gain traction. The UK’s Office for National Statistics (ONS) reported that January’s Consumer Price Index (CPI) rose 3.0% year-over-year, surpassing December’s 2.5% increase and market expectations of 2.8%. This figure remains well above the Bank of England’s (BoE) 2% inflation target.
BoE policymakers have previously acknowledged that inflation could rise in the short term due to higher energy prices before gradually returning to the target level. BoE Governor Andrew Bailey reiterated earlier this week that while inflation may temporarily rise, he does not expect it to be persistent and still sees a gradual disinflationary trend.
Pound Sterling FAQs
The Pound Sterling (GBP) is the oldest currency in the world (886 AD) and the official currency of the United Kingdom. It is the fourth most traded unit for foreign exchange (FX) in the world, accounting for 12% of all transactions, averaging $630 billion a day, according to 2022 data. Its key trading pairs are GBP/USD, also known as ‘Cable’, which accounts for 11% of FX, GBP/JPY, or the ‘Dragon’ as it is known by traders (3%), and EUR/GBP (2%). The Pound Sterling is issued by the Bank of England (BoE).
The single most important factor influencing the value of the Pound Sterling is monetary policy decided by the Bank of England. The BoE bases its decisions on whether it has achieved its primary goal of “price stability” – a steady inflation rate of around 2%. Its primary tool for achieving this is the adjustment of interest rates. When inflation is too high, the BoE will try to rein it in by raising interest rates, making it more expensive for people and businesses to access credit. This is generally positive for GBP, as higher interest rates make the UK a more attractive place for global investors to park their money. When inflation falls too low it is a sign economic growth is slowing. In this scenario, the BoE will consider lowering interest rates to cheapen credit so businesses will borrow more to invest in growth-generating projects.
Data releases gauge the health of the economy and can impact the value of the Pound Sterling. Indicators such as GDP, Manufacturing and Services PMIs, and employment can all influence the direction of the GBP. A strong economy is good for Sterling. Not only does it attract more foreign investment but it may encourage the BoE to put up interest rates, which will directly strengthen GBP. Otherwise, if economic data is weak, the Pound Sterling is likely to fall.
Another significant data release for the Pound Sterling is the Trade Balance. This indicator measures the difference between what a country earns from its exports and what it spends on imports over a given period. If a country produces highly sought-after exports, its currency will benefit purely from the extra demand created from foreign buyers seeking to purchase these goods. Therefore, a positive net Trade Balance strengthens a currency and vice versa for a negative balance.
-
02:02
China PBoC Interest Rate Decision meets forecasts (3.1%)
-
01:33
Australia’s Unemployment Rate rises to 4.1% in January vs. 4.1% expected
Australia’s Unemployment Rate rose to 4.1% in January from 4.0% in December, according to the official data released by the Australian Bureau of Statistics (ABS) on Thursday. The figure came in line with the market consensus of 4.1%.
Furthermore, the Australian Employment Change arrived at 44K in January from 60K in December (revised from 56.3K), compared with the consensus forecast of 20K.
The participation rate in Australia increased to 67.3% in January, compared to 67.2% in December (revised from 67.1%). Meanwhile, Full-Time Employment increased by 54.1 in the same period from a decline of 23.7K in the previous reading. The Part-Time Employment decreased by 10.1K in January versus 80K prior.
Market reaction to the Australia’s employment data
At the time of writing, the AUD/USD pair is trading 0.05% higher on the day to trade at 0.6350.
Employment FAQs
Labor market conditions are a key element to assess the health of an economy and thus a key driver for currency valuation. High employment, or low unemployment, has positive implications for consumer spending and thus economic growth, boosting the value of the local currency. Moreover, a very tight labor market – a situation in which there is a shortage of workers to fill open positions – can also have implications on inflation levels and thus monetary policy as low labor supply and high demand leads to higher wages.
The pace at which salaries are growing in an economy is key for policymakers. High wage growth means that households have more money to spend, usually leading to price increases in consumer goods. In contrast to more volatile sources of inflation such as energy prices, wage growth is seen as a key component of underlying and persisting inflation as salary increases are unlikely to be undone. Central banks around the world pay close attention to wage growth data when deciding on monetary policy.
The weight that each central bank assigns to labor market conditions depends on its objectives. Some central banks explicitly have mandates related to the labor market beyond controlling inflation levels. The US Federal Reserve (Fed), for example, has the dual mandate of promoting maximum employment and stable prices. Meanwhile, the European Central Bank’s (ECB) sole mandate is to keep inflation under control. Still, and despite whatever mandates they have, labor market conditions are an important factor for policymakers given its significance as a gauge of the health of the economy and their direct relationship to inflation.
-
01:33
Australia’s Unemployment Rate rises to 4.1% in January vs. 4.1% expected
Australia’s Unemployment Rate rose to 4.1% in January from 4.0% in December, according to the official data released by the Australian Bureau of Statistics (ABS) on Thursday. The figure came in line with the market consensus of 4.1%.
Furthermore, the Australian Employment Change arrived at 44K in January from 60K in December (revised from 56.3K), compared with the consensus forecast of 20K.
The participation rate in Australia increased to 67.3% in January, compared to 67.2% in December (revised from 67.1%). Meanwhile, Full-Time Employment increased by 54.1 in the same period from a decline of 23.7K in the previous reading. The Part-Time Employment decreased by 10.1K in January versus 83.7K prior (revised from 80K).
Market reaction to the Australia’s employment data
At the time of writing, the AUD/USD pair is trading 0.05% higher on the day to trade at 0.6350.
Employment FAQs
Labor market conditions are a key element to assess the health of an economy and thus a key driver for currency valuation. High employment, or low unemployment, has positive implications for consumer spending and thus economic growth, boosting the value of the local currency. Moreover, a very tight labor market – a situation in which there is a shortage of workers to fill open positions – can also have implications on inflation levels and thus monetary policy as low labor supply and high demand leads to higher wages.
The pace at which salaries are growing in an economy is key for policymakers. High wage growth means that households have more money to spend, usually leading to price increases in consumer goods. In contrast to more volatile sources of inflation such as energy prices, wage growth is seen as a key component of underlying and persisting inflation as salary increases are unlikely to be undone. Central banks around the world pay close attention to wage growth data when deciding on monetary policy.
The weight that each central bank assigns to labor market conditions depends on its objectives. Some central banks explicitly have mandates related to the labor market beyond controlling inflation levels. The US Federal Reserve (Fed), for example, has the dual mandate of promoting maximum employment and stable prices. Meanwhile, the European Central Bank’s (ECB) sole mandate is to keep inflation under control. Still, and despite whatever mandates they have, labor market conditions are an important factor for policymakers given its significance as a gauge of the health of the economy and their direct relationship to inflation.
-
01:32
Australia Part-Time Employment dipped from previous 80K to -10.1K in January
-
01:32
Australia Part-Time Employment dipped from previous 80K to -10.1K in January
-
01:30
Australia Employment Change s.a. above forecasts (20K) in January: Actual (44K)
-
01:30
Australia Unemployment Rate s.a. in line with forecasts (4.1%) in January
-
01:30
Australia Employment Change s.a. above forecasts (20K) in January: Actual (44K)
-
01:30
Australia Unemployment Rate s.a. in line with forecasts (4.1%) in January
-
01:30
Stocks. Daily history for Wednesday, February 19, 2025
Index Change, points Closed Change, % NIKKEI 225 -105.79 39164.61 -0.27 Hang Seng -32.57 22944.24 -0.14 KOSPI 44.71 2671.52 1.7 ASX 200 -61.8 8419.2 -0.73 DAX -410.87 22433.63 -1.8 CAC 40 -96.02 8110.54 -1.17 Dow Jones 71.25 44627.59 0.16 S&P 500 14.57 6144.15 0.24 NASDAQ Composite 14.99 20056.25 0.07 -
01:30
Australia Full-Time Employment increased to 54.1K in January from previous -23.7K
-
01:30
Australia Full-Time Employment increased to 54.1K in January from previous -23.7K
-
01:30
Australia Participation Rate above forecasts (67.1%) in January: Actual (67.3%)
-
01:30
Australia Participation Rate above forecasts (67.1%) in January: Actual (67.3%)
-
01:15
Currencies. Daily history for Wednesday, February 19, 2025
Pare Closed Change, % AUDUSD 0.6346 -0.04 EURJPY 157.91 -0.52 EURUSD 1.04237 -0.22 GBPJPY 190.676 -0.54 GBPUSD 1.25862 -0.22 NZDUSD 0.57054 0.06 USDCAD 1.42334 0.29 USDCHF 0.90446 0.23 USDJPY 151.484 -0.33 -
01:11
AUD/USD holds below 0.6350 ahead of Australian employment data
- AUD/USD extends its downside to around 0.6340 in Thursday’s early Asian session.
- Trump tariff threats lift the US Dollar against the Aussie.
- Investors brace for the Australian January employment data on Thursday.
The AUD/USD pair extends its decline to around 0.6340 during the early Asian session on Thursday. Fresh US President Donald Trump tariff threats continue to underpin the US Dollar (USD) and weigh on the pair.
The strengthening of the Greenback is supported by concerns about escalating trade tensions. Last week, US President Donald Trump ordered his administration to consider imposing reciprocal tariffs on numerous trading partners. Late Tuesday, Trump said that he would likely impose tariffs of around 25% on foreign cars, while semiconductor chips and drugs are set to face higher duties.
"So far, the dollar has tracked the path it had during the previous Trump administration...and we can pretty much agree that Trump is doing exactly what he said," said Chester Ntonifor, chief FX and global fixed income strategist, at BCA Research in Montreal.
The minutes from the FOMC meeting released on Wednesday indicated that the Fed policymakers believe that it is well positioned to take time to assess the outlook for economic activity, the labor market and inflation. Fed officials agreed that inflation must show clear signs of slowing down before any further rate reductions can be made.
The Reserve Bank of Australia (RBA) decided to cut its Official Cash Rate (OCR) by 25 basis points (bps) to 4.10% on Tuesday, the first rate cut in four years. The central bank warned that it was too early to declare victory over inflation and was cautious about the prospects of further easing. Investors await the release of Australian January employment data for fresh impetus, which is due later on Thursday.Australian Dollar FAQs
One of the most significant factors for the Australian Dollar (AUD) is the level of interest rates set by the Reserve Bank of Australia (RBA). Because Australia is a resource-rich country another key driver is the price of its biggest export, Iron Ore. The health of the Chinese economy, its largest trading partner, is a factor, as well as inflation in Australia, its growth rate and Trade Balance. Market sentiment – whether investors are taking on more risky assets (risk-on) or seeking safe-havens (risk-off) – is also a factor, with risk-on positive for AUD.
The Reserve Bank of Australia (RBA) influences the Australian Dollar (AUD) by setting the level of interest rates that Australian banks can lend to each other. This influences the level of interest rates in the economy as a whole. The main goal of the RBA is to maintain a stable inflation rate of 2-3% by adjusting interest rates up or down. Relatively high interest rates compared to other major central banks support the AUD, and the opposite for relatively low. The RBA can also use quantitative easing and tightening to influence credit conditions, with the former AUD-negative and the latter AUD-positive.
China is Australia’s largest trading partner so the health of the Chinese economy is a major influence on the value of the Australian Dollar (AUD). When the Chinese economy is doing well it purchases more raw materials, goods and services from Australia, lifting demand for the AUD, and pushing up its value. The opposite is the case when the Chinese economy is not growing as fast as expected. Positive or negative surprises in Chinese growth data, therefore, often have a direct impact on the Australian Dollar and its pairs.
Iron Ore is Australia’s largest export, accounting for $118 billion a year according to data from 2021, with China as its primary destination. The price of Iron Ore, therefore, can be a driver of the Australian Dollar. Generally, if the price of Iron Ore rises, AUD also goes up, as aggregate demand for the currency increases. The opposite is the case if the price of Iron Ore falls. Higher Iron Ore prices also tend to result in a greater likelihood of a positive Trade Balance for Australia, which is also positive of the AUD.
The Trade Balance, which is the difference between what a country earns from its exports versus what it pays for its imports, is another factor that can influence the value of the Australian Dollar. If Australia produces highly sought after exports, then its currency will gain in value purely from the surplus demand created from foreign buyers seeking to purchase its exports versus what it spends to purchase imports. Therefore, a positive net Trade Balance strengthens the AUD, with the opposite effect if the Trade Balance is negative.
-
00:50
Japan Foreign Investment in Japan Stocks climbed from previous ¥-384.4B to ¥-352.8B in February 14
-
00:32
EUR/USD softens below 1.0450 on Trump’s tariff threats
- EUR/USD edges lower to 1.0425 in Wednesday’s late American session.
- FOMC Minutes indicated that the Fed wants to take time before making adjustments to interest rates.
- The fresh round of Trump’s tariff threats weighs on the Euro.
The EUR/USD pair weakens to near 1.0425 during the late American session on Wednesday. Tariff concerns from US President Donald Trump and geopolitical tension provide some support to the US Dollar (USD). Investors await the US weekly Initial Jobless Claims, the CB Leading Economic Index and the Philly Fed Manufacturing Index reports, which are due later on Thursday.
The minutes from the FOMC meeting released on Wednesday stated that it was appropriate to keep the target interest rate unchanged at the January meeting, adding that the Fed believes that it is well positioned to take time to assess the outlook for economic activity, the labor market and inflation. Fed policymakers agreed that inflation must show clear signs of slowing down before any further rate reductions can be made.
The Federal Reserve’s (Fed) Austan Goolsbee, Michael Barr and Alberto Musalem are set to speak on Thursday. Their remarks could offer some hints about the path ahead for US interest rates. Any hawkish comments from Fed policymakers could boost the Greenback in the near term.
The latest round of tariff threats lifts the Greenback and creates a headwind for EUR/USD. Trump has criticized the EU’s car tariffs and threatened reciprocal tariffs on various sectors. Late Tuesday, Trump said that he intends to impose auto tariffs "in the neighborhood of 25%" and similar duties on semiconductors and pharmaceutical imports.Euro FAQs
The Euro is the currency for the 19 European Union countries that belong to the Eurozone. It is the second most heavily traded currency in the world behind the US Dollar. In 2022, it accounted for 31% of all foreign exchange transactions, with an average daily turnover of over $2.2 trillion a day. EUR/USD is the most heavily traded currency pair in the world, accounting for an estimated 30% off all transactions, followed by EUR/JPY (4%), EUR/GBP (3%) and EUR/AUD (2%).
The European Central Bank (ECB) in Frankfurt, Germany, is the reserve bank for the Eurozone. The ECB sets interest rates and manages monetary policy. The ECB’s primary mandate is to maintain price stability, which means either controlling inflation or stimulating growth. Its primary tool is the raising or lowering of interest rates. Relatively high interest rates – or the expectation of higher rates – will usually benefit the Euro and vice versa. The ECB Governing Council makes monetary policy decisions at meetings held eight times a year. Decisions are made by heads of the Eurozone national banks and six permanent members, including the President of the ECB, Christine Lagarde.
Eurozone inflation data, measured by the Harmonized Index of Consumer Prices (HICP), is an important econometric for the Euro. If inflation rises more than expected, especially if above the ECB’s 2% target, it obliges the ECB to raise interest rates to bring it back under control. Relatively high interest rates compared to its counterparts will usually benefit the Euro, as it makes the region more attractive as a place for global investors to park their money.
Data releases gauge the health of the economy and can impact on the Euro. Indicators such as GDP, Manufacturing and Services PMIs, employment, and consumer sentiment surveys can all influence the direction of the single currency. A strong economy is good for the Euro. Not only does it attract more foreign investment but it may encourage the ECB to put up interest rates, which will directly strengthen the Euro. Otherwise, if economic data is weak, the Euro is likely to fall. Economic data for the four largest economies in the euro area (Germany, France, Italy and Spain) are especially significant, as they account for 75% of the Eurozone’s economy.
Another significant data release for the Euro is the Trade Balance. This indicator measures the difference between what a country earns from its exports and what it spends on imports over a given period. If a country produces highly sought after exports then its currency will gain in value purely from the extra demand created from foreign buyers seeking to purchase these goods. Therefore, a positive net Trade Balance strengthens a currency and vice versa for a negative balance.
-
